Article

Research and Application of Biochar in Soil CO2 Emission, Fertility, and Microorganisms: A Sustainable Solution to Solve China’s Agricultural Straw Burning Problem

1
School of Tobacco, Henan Agricultural University, Zhengzhou 450002, China
2
Henan Biochar Engineering Technology Research Center, Henan Agricultural University, Zhengzhou 450002, China
3
Henan Biochar Technology Engineering Laboratory, Agricultural University, Zhengzhou 450002, China
*
Author to whom correspondence should be addressed.
Sustainability 2020, 12(5), 1922; https://doi.org/10.3390/su12051922
Submission received: 4 February 2020 / Revised: 19 February 2020 / Accepted: 21 February 2020 / Published: 3 March 2020
(This article belongs to the Section Sustainable Agriculture)

Abstract

:
This study aimed to explore a new way to address the burning of agricultural waste in China while achieving the sustainable use of it. Three agricultural wastes (Wheat straw, peanut shell, and rice husk) were slowly pyrolyzed into biochar, which was subsequently added to the soil to reduce CO2 emissions from the soil, and to improve soil fertility as well as microbial community structure. The biochar and raw materials were added to the soil and cultured under controlled conditions, and then the CO2 emissions produced from the mixing. At the same time, this study used pot experiments to determine the effects of biochar on tobacco soil physical and chemical properties and, therefore, the microbial communities of the soil. This study suggests that (1) biochar can effectively reduce soil CO2 emission rate. Compared with the control, peanut shell biochar could reduce the total CO2 emissions of soil by 33.41%, and the total CO2 emissions of wheat straw biochar treatment was 90.25% lower than that of wheat straw treatment. (2) The soil’s physical and chemical properties were improved. The soil bulk density of wheat straw biochar treatment kept 34.57% lower than that of the control as well as 21.15% lower than that of wheat straw treatment. The soil’s organic carbon of peanut shell biochar treatment was 87.62% more than that of peanut shell treatment. (3) Biochar changed soil microbial community structure. (4) Biochar is suitable for tobacco growth. Peanut husk biochar significantly increased the total biomass of tobacco, and wheat straw biochar significantly increased tobacco root vigor. This study concluded that processing Chinese agricultural waste into biochar and adding it to the soil instead of burning it directly would be an effective means to reduce greenhouse gas emissions, to improve soil, and to promote crop growth.

1. Introduction

Biochar is a material obtained by pyrolysis of crop straw, woody material, livestock manure, or other organic materials in a low-oxygen environment with the pyrolysis temperatures between 300 and 700 °C normally. This type of charcoal is a carbon-rich material with high surface area, porosity, adsorption, pH, and high stability [1]. As a new type of carbon material, biochar has attracted considerable attention, mainly due to its potential applications in improving soil, reducing greenhouse gas emissions, and environmental, ecological restoration. It provides new ideas for alleviating global climate change as well as environmental pollution, and improving soil properties [2]. Carbon dioxide is a greenhouse gas in the atmosphere, and its rising concentration in the atmosphere is the primary cause of human climate change [3]. Before the Industrial Revolution, atmospheric CO2 concentrations ranged from 255 to 280 ppm, while atmospheric CO2 concentrations for the last few decades have increased to around 400 ppm [4]. In the 21st century, the CO2 concentration could exceed 700 ppm, and the annual amount of CO2 emitted by the world’s agriculture worldwide can reach 5.1–6.1 × 10⁹ metric tons [5].
Biochar has been used in the soil for soil amendment for a long time. For example, the Amazon Basin contains large amounts of chelated carbon, the effect on the soil of which depends on the type of feedstock, the temperature, and the time of charring [6,7,8]. Biochar can promote plant growth, increase nutrient availability, provide habitats for microorganisms, increase soil water holding capacity [9,10,11], improve water use efficiency [12,13,14], and enhance hydraulic conductivity [15]. Biochar can reduce the net greenhouse gas emissions of agricultural soils through unclear mechanisms [16]. Research on reducing CO2 emissions, enhancing soil fertility, and increasing crop yields will become increasingly popular [3]. Chelation of C as biochar in the soil enables the increasing of soil fertility [17] and organic matter content, and the alleviating of repeated crop planting risk [18]. Biochar and other amendments favor carbon sequestration because they are made by waste that would normally be incinerated and emit gases and CO2 into the atmosphere. By producing biochar and not burning the raw material in a conventional way, on the one hand, that CO2 emission is avoided and, on the other, it improves soil quality. A portion of the carbon in biochar can be stored in the soil for decades or thousands of years [9]. As a result, biochar applications have proven to be a low-cost, improve agricultural soil fertility improving, and potentially carbon sequestration increasing method [3]. Rhizosphere microorganisms are bacteria, actinomycetes, fungi, algae, and protozoa that live in the soil of plant roots. The number of microorganisms is more than that of microbes outside the rhizosphere. Microorganisms interact with plant roots. This promotes the two species [19]. In recent years, there have been many studies focused on the application of biochar in different crops. Li Hang et al. [20] used potted cultivation of banana seedlings, mixing with different ratios of biochar and soil as the culture medium, and the microbial colony counting method for the determination of microorganisms. Biolog-ECO technology was used to analyze the microbial community in the rhizosphere soil of banana seedlings. It was found that the application of biochar could significantly increase the number of microorganisms in the soil. Biolog-ECO analysis showed that the application of biochar increased the average color change rate, diversity index, and carbon source abundance of microbial communities [21].
Agriculture contains lots of biomass that is harvested, left in the soil to decompose, which releases CO2 back to the atmosphere, or simply burned off. A sustainable alternative to the burning of agricultural waste is the conversion of agricultural residues into biochar. The biochar can then be used simultaneously to increase soil fertility, improve soil microbial community structure, carbon sequestration, and crop growth. The objectives of this study are: (1) using wheat straw, peanut shell, rice husk, and their biochar as soil amendments, to compare CO2 emissions after the addition of these materials; (2) to study the effect of biochar on the soil’s physical and chemical properties and microbes; and (3) to study the effect of biochar on tobacco growth.

2. Materials and Methods

2.1. Biochar Production

Wheat straw, peanut shell, and rice husk (agricultural waste) were collected from Weidu District, Xuchang City, Henan Province, China (E:113°25ʹ, N:33°42ʹ). The pyrolysis temperature was raised at a rate of 26 °C min−1 to 450 °C under the conditions of N2 and maintained for 25 min, and then the flow rate of N2 was 0.3 L min−1 [22]. The three raw materials were air-dried, and the wheat straw and the peanut shell stalk were cut into a size of 0.2–2 cm. The physical and chemical properties of the three biochars (WB, PB, RB), three biomasses (WS, PS, RS), and the tested soil are shown in Table 1. The CO2 value from consuming electricity and making N2 gas for carbonization during the production of biochar is shown in Table 2.

2.2. Equipment and Reagents

All chemicals were analytical (AR) grade reagents. Ammonium acetate and sodium hydroxide were purchased from Zhengzhou, China. The pH and conductivity (EC) were measured using a multi-parameter ion meter (pH/ION, Xiamen Longlide Environmental Technology Development Co., Ltd., China). The Na+ and K+ analyses were performed using a flame photometer (FP6440, Shanghai Xiangfan Instrument Co., Ltd., China). Mix the biochar–soil sample with a rotary incubator; mix the biochar–soil 2% (wt/wt soil). The C, N, and H contents were determined using a YX-CHN5000 elemental analyzer. Moisture content, volatile matter, and ash content were determined according to D1762–84 [23]. The volatiles were determined by weight loss upon heating to 800 °C for 15 min. The ash content was estimated by weight loss at 750 °C for 3 h [24]. Carbon dioxide flux was measured by a portable automatic soil CO2 infrared gas analyzer (GXH-3010E Beijing Zhongyi Kexin Technology Co., Ltd. China). A sealed container was designed for soil incubation experiments to determine the rate of CO2 emissions from the closed vessel.

2.3. Soil Incubation

The test soil was obtained from the Science and Education Park of Henan Agricultural University, Xuchang City, Henan Province, China (E: 114°36’, N: 34°22’). The basic physical and chemical properties of the soil refer to the test method of Wang J [24]. In a 1500 mL airtight container, 1000 g (dry weight) of soil was corrected with biochar and their raw materials (drying in an oven at 75 °C for 5 h). The soil without the added biomass or biochar was designated as the control group. The soil was sieved through a 3 mm mesh before incubation. Distilled water was added to achieve a moisture content of about 60%. The soil was then incubated for ten days in the dark at 25 ± 1 °C and 65 ± 5% relative humidity to establish microbial activity [24] in a plastic box with a soil depth of 10 cm. After ten days of pre-incubation, the soil was modified with wheat straw, peanut hulls, and biochar, respectively, in an amount of 2% (wt/wt soil). Control (not amended) soil, biochar-corrected soil, and biomass-corrected soil were placed in a locally designed CO2 chamber. Incubation was carried out at 25 ± 1 °C and 65 ± 5% relative humidity for 100 days to compare the effects of physical and chemical properties of soils conditioned with biochar or biomass. This operation was based on an earlier study [25]. However, this study further determined the biomass correction of soil and biochar-corrected soil CO2 emissions. A CO2 chamber was used for CO2 flux measurement. A gas-tight round polypropylene box was purchased, and two metal plugs inserted into the finished holes in the lid and sealed with a silicone sealant. The inlet and outlet metal plugs were connected to the soil-CO2 flux analyzer via a silicone tube and a GXH-3010E connector. A cock that plugs into the metal plug, and the GXH-3010E connector to control airflow was used. The CO2 flux was measured at 10, 20, 30, 40, 50, 60, 70, 80, 100 days.

2.4. Pot Experiment

Tobacco had a strong genetic stability and was a model plant that could be easily planted. To ensure that the experiment was reproducible, this research chose tobacco as the experimental plant for this study. Soil samples (2 kg) were placed in plastic pots (15 cm wide and 20 cm deep) and then thoroughly mixed with 2% wt/wt biomass and biochar, respectively. We transplanted tobacco seedlings (45 days) one plant per pot. We made triplicates of each sample (totaling 21 samples) and irrigated with water daily to maintain soil moisture (70–80%). The experiment was carried out for 75 days, and the whole plant was harvested immediately after 75 days. A soil sample of 100 g was taken at 10 cm soil depth and the whole plant was harvested immediately after 75 days. We passed the naturally dried soil through a 0.25 mm millimeter sieve and took 15 g of soil as a sample. The soil sample was added to the potassium dichromate-sulfuric acid solution, and then it was organically carbonized under the condition of heating in an electric sand bath. The remaining potassium dichromate was titrated with ferrous sulfate, and the organic carbon was calculated from the difference between the oxidants before and after oxidation. The amount of organic carbon is then multiplied by 1.724 to get the amount of organic matter. When the plants were just harvested, their total fresh weight was measured immediately and heated in an oven at 105 °C for 25 min. After we adjusted the oven to 65 °C to dry, and the total dry weight of each tobacco was measured. The root activity of flue-cured tobacco was determined by the TTC (2,3,5-triphenyltetrazolium chloride) method. The most vigorous part of the vitality was polished with ethyl acetate, and the apical section of 0 to 1.0 cm was cut as the test material. The oxidation state of TTC was colorless and can be reduced by hydrogen to an insoluble red tribenzidine (TTF). The degree of staining was used to identify the vitality of the roots [26]. When harvesting the tobacco, the soil near the roots of the tobacco was collected and divided into two parts, 100 g each. One of which was naturally dry, and the soil physicochemical properties were measured, and the other was stored at −80 °C for determination of soil microorganisms.

2.5. Physical and Chemical Properties

The soil bulk density and water holding capacity of all soil samples were determined by the Mohan D method [3]. The ring knife method was used to measure the soil bulk density. After the soil surface is flattened, a 10 cm diameter and 10 cm high ring knife is inserted vertically into the soil. After the ring knife filling with soil, the ring knife was taken out and the two ring edges were repaired and leveled. This procedure was repeated three times. The soil bulk density was determined using the ring knife method, using the formula:
soil bulk density (%) = (1 − volume density/specific gravity) × 100
The method for determining the water holding capacity was as follows: we took 100 g of soil at a soil layer depth of 5–10 cm, weighed it, and then dried it at 100 ° C for 3 h, and weighed the dry soil. The calculation formula for soil water holding capacity is:
soil water holding capacity (%) = (wet soil weight-dry soil weight/dry soil weight) × 100
Using a pH/electrical conductance (EC) online monitor (Shanghai Shimeike Environmental Equipment Co., Ltd., PCE-11M, China) to measure the pH and EC of biochar, the pH of the aqueous solution containing biochar was measured at 1:20 (W/V) and stirred for 1 h, and the conductivity (EC) of the biochar/water suspension (1:10 wt/wt) was measured at 25 °C. Determination of soil organic carbon with a soil organic carbon analyzer followed (Lianhua Technology Co., Ltd., LH-SOC350, China).

2.6. Determination of Microbial Diversity

2.6.1. Total DNA Extraction

The DNA of each tobacco rhizosphere soil sample was extracted by the Omega D5625-01 Soil DNA Kit Soil Genomic DNA Extraction Kit and was dialyzed against 0.8% agarose gel and diluted to 1 ng/μL with sterile water.

2.6.2. Polymerase Chain Reaction (PCR) Extension of ITS2 Region and 16S rDNA-V4 Region

ITS2 region with tagged sequence (barcode) and 16S rDNA-V4 region-specific primers 3F (5′-GGAAGTAAAAGTCGTAACAAGG-3′) and 4R (5′-GCTGCGTTCTTCATCGATGC-3′) and 515F (5′-GTGCCAGCMGCCGCGGTAA-3′) and 806R (5′-GGACTACHVGGGTWTCTAAT-3′), using KODPlus-Neo a high-fidelity PCR enzyme for PCR, using 2. After 0% agarose gel electrophoresis, the company entered Shanghai Meiji Biomedical Technology Co., Ltd. for MiSeq sequencing.

2.6.3. Quality Control and Analysis of Lower Machine Data

The label sequence (barcode) and the primer sequence were eliminated, and the sequence was spliced by FLASH software [27]. The sequence obtained by the Qiime software [28] was compared with the known sequence in the Gold database. UCHIME software [29] removed the chimeric sequence and obtained an effective sequence. The operational classification unit was divided by the Uparse software [30] at a similarity level of 97%, and the sequence annotation was performed using the RDP classifier software [31] and the Green Gene database [32]. The polymerase chain reaction (PCR)of the sample operational taxonomic unit (OUT)and the difference analysis map between the groups (between groups) were extracted by R language analysis.

2.7. Statistical Analysis

We drew on Origin 20.0 and performed data analysis on spss10.0.

3. Results and Analysis

3.1. Comparative Analysis of Basic Physical and Chemical Properties of Different Biochars and Biomass

Based on the weight of the original biomass, 24.6 wt% of wheat straw biochar (WB), 32.5 wt% of peanut shell biochar (PB), and 30.7 wt% of rice husk biochar (RB) were obtained upon slow pyrolysis. Biochar properties depended on feedstocks and pyrolysis conditions (temperature, residence time, and reactor type), and raw material was the most important factor [9]. Table 1 shows the basic elemental analysis of biomass feedstock, biochar, and soil. WB, PB and RB were both prepared at 450 °C, which contributed to the higher carbon content in biochar [33]. The H/C molar ratio can reflect the degree of carbonization of biochar. The H/C molar ratios of WS, PS and RS are 1.11%, 0.81% and 1.28%, respectively, while WB, PB and SB are 21.73, %, 18.46%, 28.84%, respectively (Table 1). The decrease in the H/C ratio in biochar illustrates the high carbonation of the original lignocellulosic (organic) residue structure [34]. The WB, PB, and SB micrographs (Figure 1) illustrate their highly porous structure. The microscopic examinated at the same time illustrates the microstructural differences between these biochars.
This table shows the amount of CO2 produced by the production of 1 kg of biochar. According to the research conclusion of Zhang [35], the production of 1 kWh electricity can emit 860 g of CO2, and from the conclusion of Toyama’s research [36], the production of 1 L N2 can emit 0.12 g of CO2.

3.2. Soil CO2 Emissions

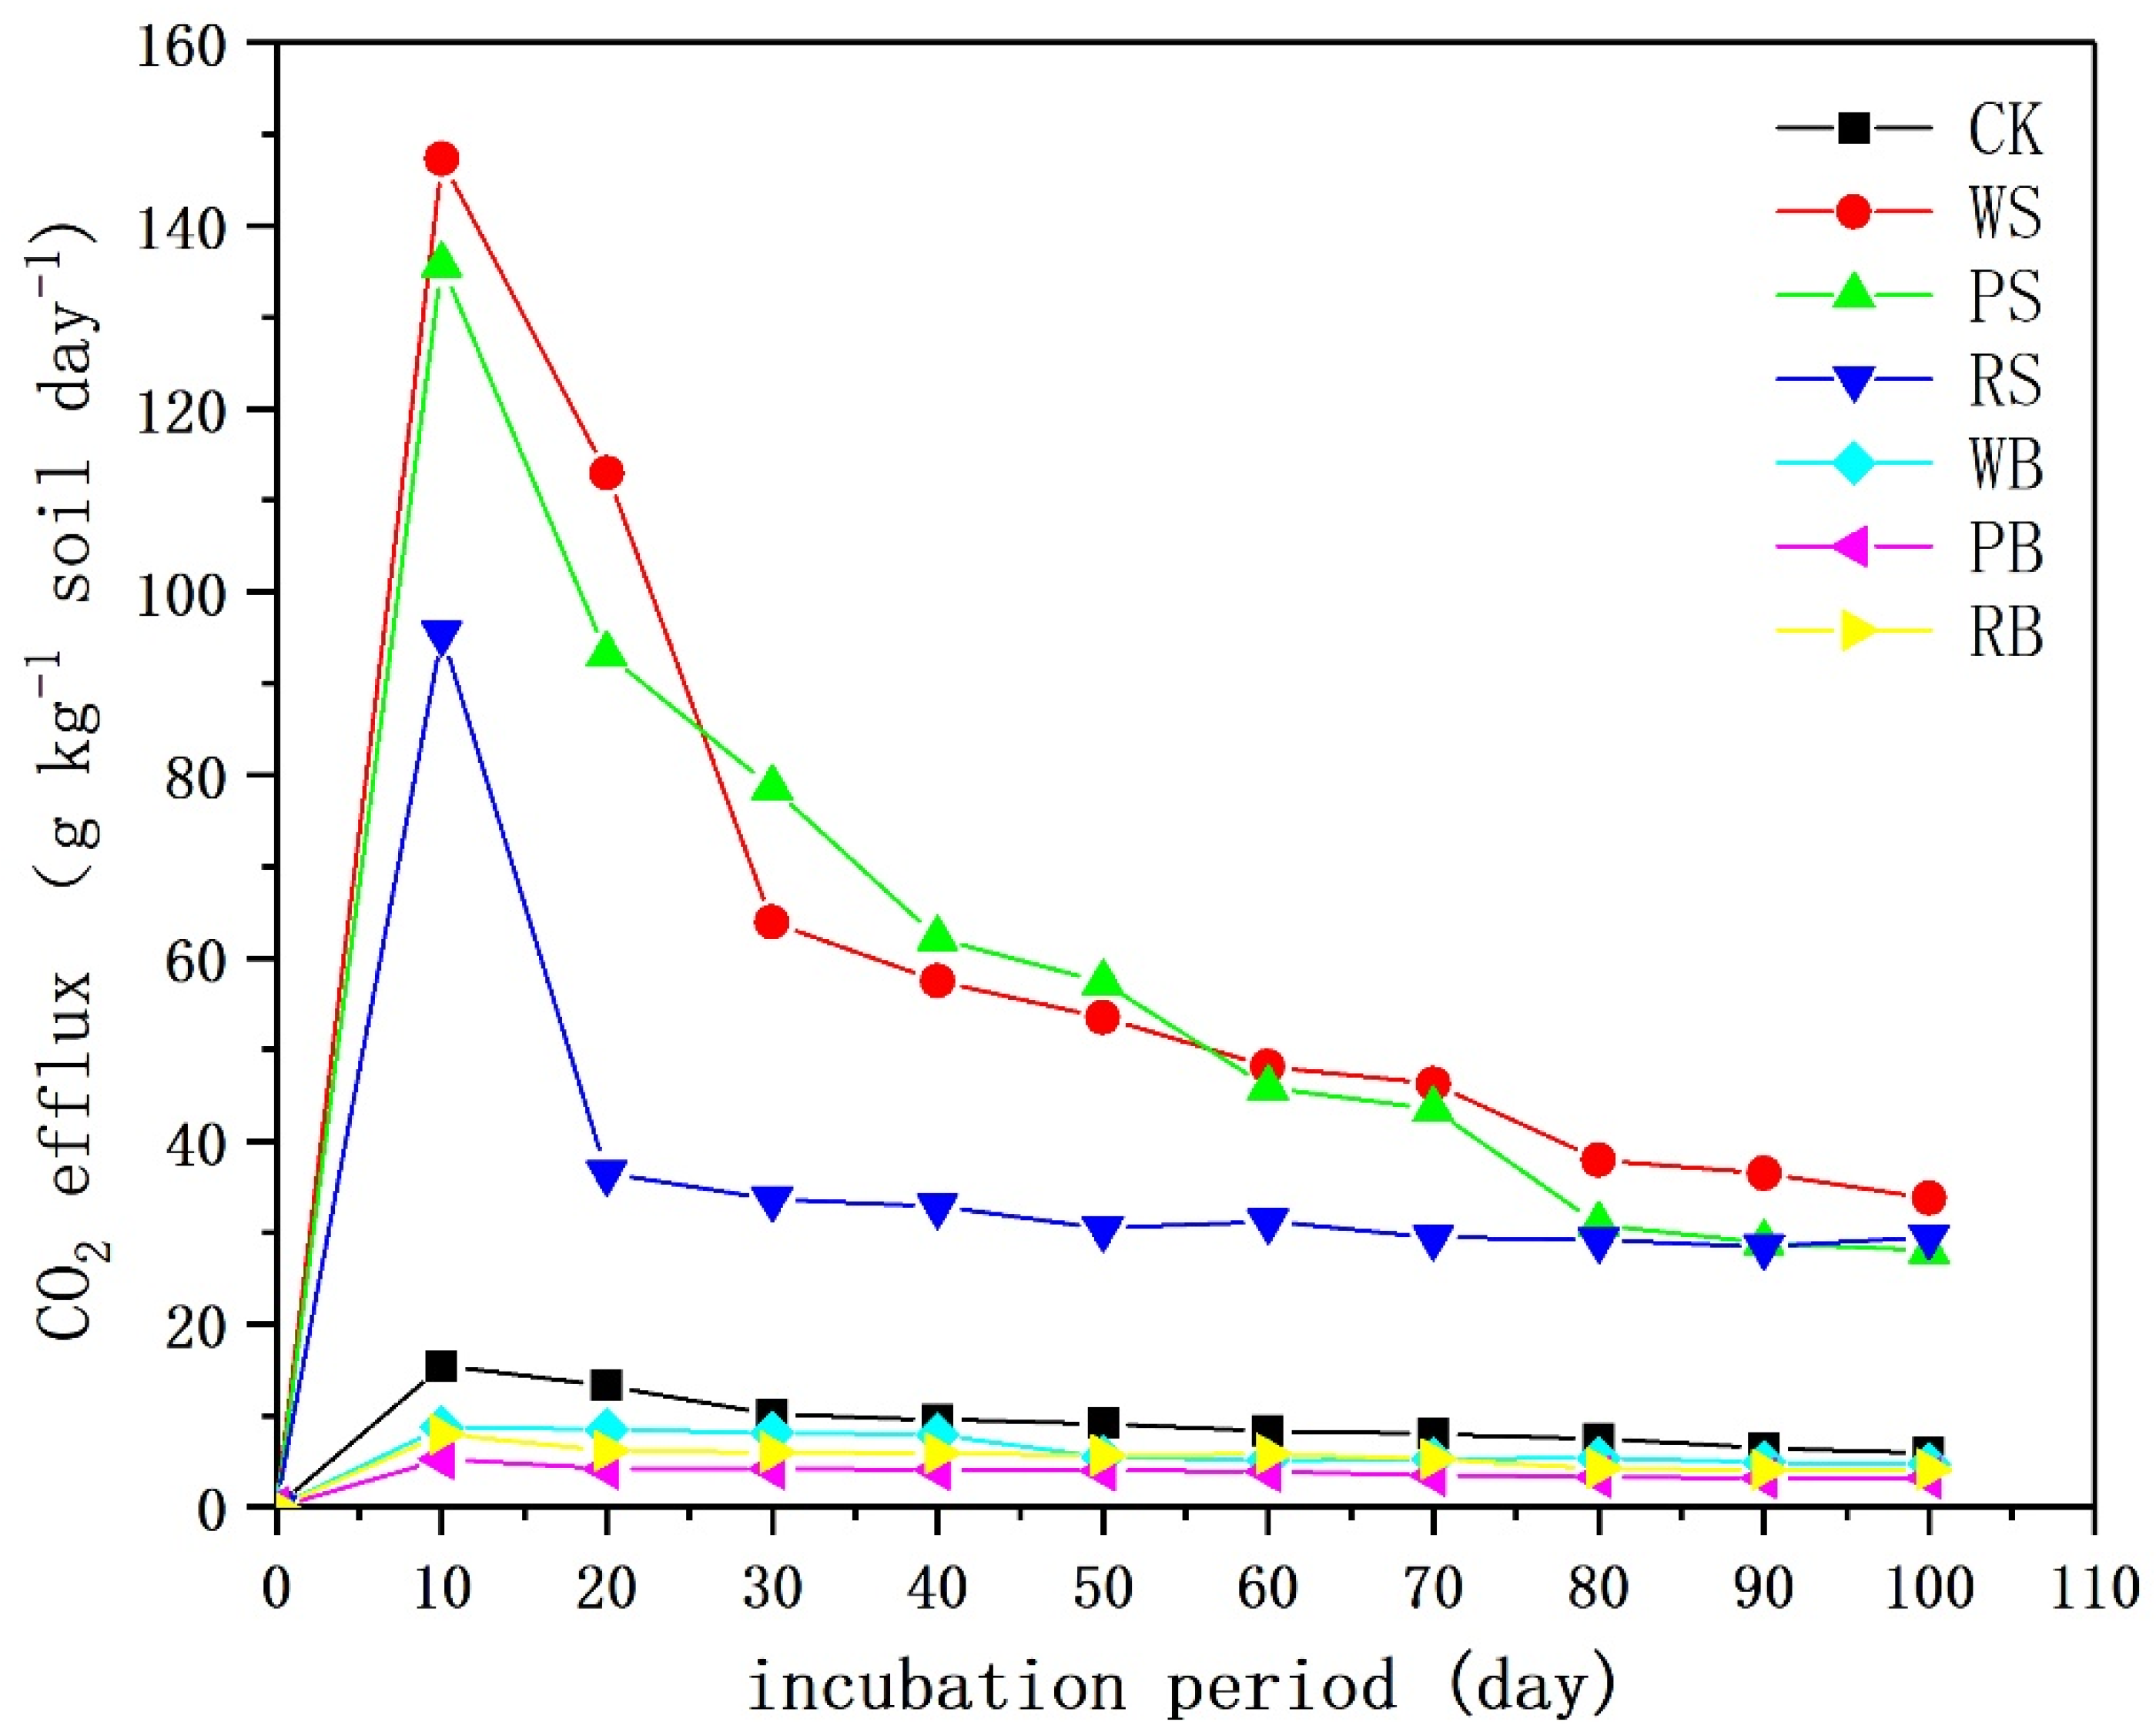
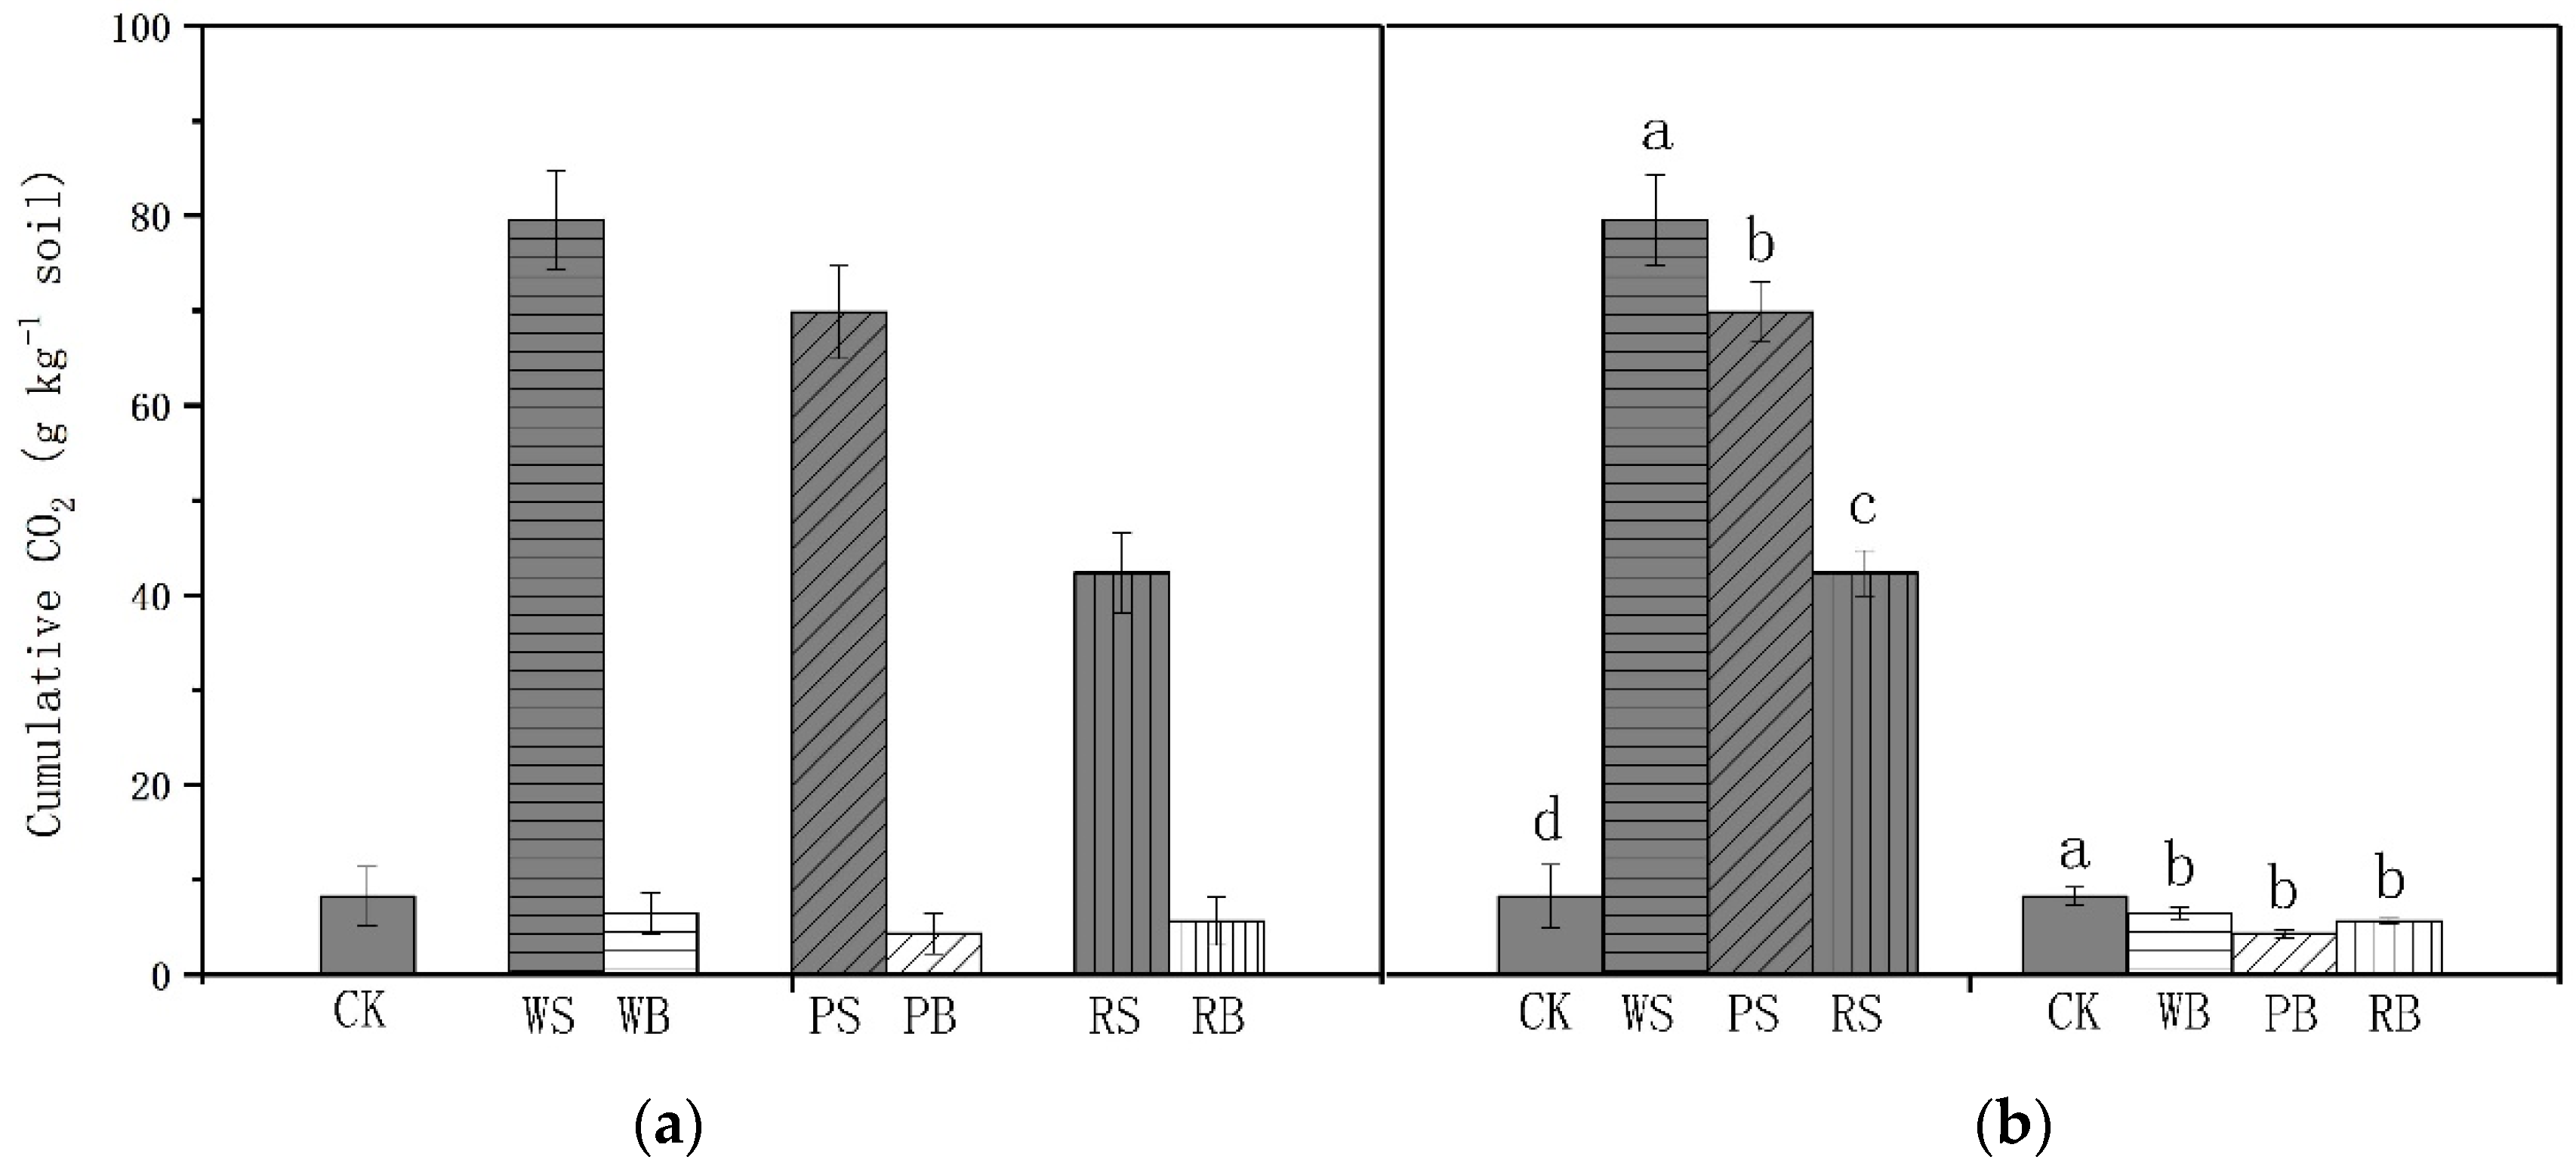
The effect of adding biochar (WB, PB, RB) and its precursor biomass (WS, PS, RS) on soil CO2 emissions during the 100-day incubation period is shown in Figure 2. Figure 2 summarizes the cumulative CO2 emissions. The addition of wheat straw, peanut hulls, and rice husks to the soil resulted in higher CO2 emissions and this result was higher than any biochar-modified soil or control soil. The order of CO2 emissions was WS > RS > PS > CK > WB > PB > SB. During the first 30 days of culture, the CO2 emission rate of Ws, Ps, and Rs increased significantly. Moreover, they reached the maximum CO2 emission rate on the 10th day of culture, and the CO2 emission rate of WS was the largest, followed by PS and RS. After ten days of incubation, all of the treated CO2 effluxes decreased with increasing incubation time (Figure 2). After 100 days, the cumulative CO2 emissions from the WS modified soil reached a maximum (Figure 3). Biomass corrected soils provided higher total CO2 emissions. In contrast to the addition of biomass, the addition of biochar reduced CO2 emissions. The WB, PB, and RB added to the soil reduced the cumulative CO2 emissions of the soil and were lower than Ws, Ps, Rs, and CK (Figure 3a). The CO2 outflow rate increased during the first 0–10 days of WB, PB, RB modified soil culture. This result is similar to published articles [4]. After 30 days of incubation, there was no significant change in the total CO2 emission rate corrected for biochar (Figure 2). After reaching a maximum level, the CO2 emissions decreased over longer incubation time. After 100 days, biomass-improved soils had higher total CO2 emissions compared to control or biochar-modified soils (Figure 3b). Biochar did not “rot” or degrade very rapidly and can remain in the soil for long periods [37,38]. The higher the degree of carbonization, the slower the rate of oxidation (for example, in extreme cases, graphite and diamond are quite inert in the soil) [38]. The chemical properties of slow pyrolysis biochar were stable in the soil [26], because of the carbonation of Ca2+ and Mg2+ in biochar to CaCO3 and MgCO3, respectively [39,40]. During cultivation, a CO2 balance was established between the air and the water phase. Under more alkaline conditions, more CO2 was dissolved in the aqueous phase [41]. Biochar from wheat (pH 9.83), peanut shell (pH 9.36), and rice husk (pH 8.65) were highly alkaline, when they were applied to the soil (pH 6.09), the pH of the soil environment will increase, thereby becoming closer to neutral or alkaline [25], while soil microorganisms prefer a neutral environment [21]. At the same time, most plants also prefer a neutral environment [9]. When the soil was affected by biochar and became more neutral, the growth of soil microorganisms and plants was promoted, which in turn increased the ability of the soil environment (soil, microorganisms, plants) to fix CO2. Thus, CO2 emissions in the soil in biochar reduced.

3.3. Soil Fertility

3.3.1. pH and Conductivity (EC)

The soil pH of WB, PB, and SB was higher than the others, and the difference was significant compared with other treatments. The soil pH of these three biochar treatments was 4.5%, 5.1%, 3.8% higher than CK, respectively. The soil pH of the control (CK) was lower than that of the other treatments, but the difference was not significant compared with WS, PS, and RS (Table 3). The high pH of biochar was due to the formation of alkaline ions, hydroxides, and carbonates formed by Na+, K+, Ca2+, and Mg2+ ions during pyrolysis to form biochar [42,43]. The soil EC values of WB, PB, and SB were also higher than other treatments, and the difference was significant compared with CK. Also, the soil EC of WB, PB, and SB was not significantly different from WS, PS, and RS (Table 3).

3.3.2. Soil Bulk Density, Water Holding Capacity, Temperature

The soil bulk density of biochar treatment was significantly lower than that of the control. The variation of treatment was: WB < RB < PB < RS < WS < PS < CK. Biochar itself has a small specific gravity and loose texture, which could directly improve soil tightness and reduce soil bulk density, thereby increasing total soil porosity [44,45]. Biochar could also promote the formation of agglomerates [46], and increase the number of soil microbes, promote microbial activity, improve soil structure, increase total soil porosity, and reduce soil bulk density [47]. After adding biochar to the soil, the soil water holding capacity increased significantly (Table 3). This may be because the addition of biochar can increase the contact between the soil particles, reduce the macroporosity, increase the small pores, and increase the soil water retention capacity [48,49]. Biochar had no significant effect on soil temperature.

3.3.3. Soil Organic Matter

Soil improvement with biochar can result in a significant increase in soil organic matter after a 75-day growth period, while biomass in the soil also had the same performance (Table 3). Biochar treatment (WB, PB, and SB) increased soil organic matter content by 220.69%, 331.96%, and 297.88%, respectively, at the end of the 100-day growth period, compared to the control soil. The processing of biomass (WS, PS, RS) increased by 106.23%, 136.62%, and 164.85%, respectively. Earlier studies have reported similar results [9]. At the same time, the soil organic matter after biochar treatment was higher than that after biomass modification, and the difference was significant. The soil organic matter after PB and RB correction was higher than that after WB correction, and the difference was significant. This may be because biochar itself contains a large amount of organic matter, which can rapidly increase soil organic matter content, or because biochar reduces soil respiration and promotes soil carbon fixation [50,51]. The carbon content of biochar was significantly higher than that of biomass (Table 1), so when biochar was applied to the soil, the soil organic matter was increased to a greater extent than biomass. There were differences in the physical and chemical properties of different biochars (Table 1), so the effects on soil organic matter were also different. Biochar had a large specific surface area and can adsorb a variety of ions after being applied to the soil. When the ions in the soil were adsorbed by the biochar, it can effectively prevent them from being leached into the ground, so that the ions stayed in the cultivated layer that the roots of the plant can contact, thereby improving the soil fertility [49], but it was selective adsorption of nutrients [52]. It had a strong adsorption effect on NH4+ and NO3 [53]. This study used biochar to significantly increase the available nitrogen, phosphorus, and potassium in the soil, and the increase was significant compared with the control, which was consistent with previous trials [54].

3.4. Microbial Diversity

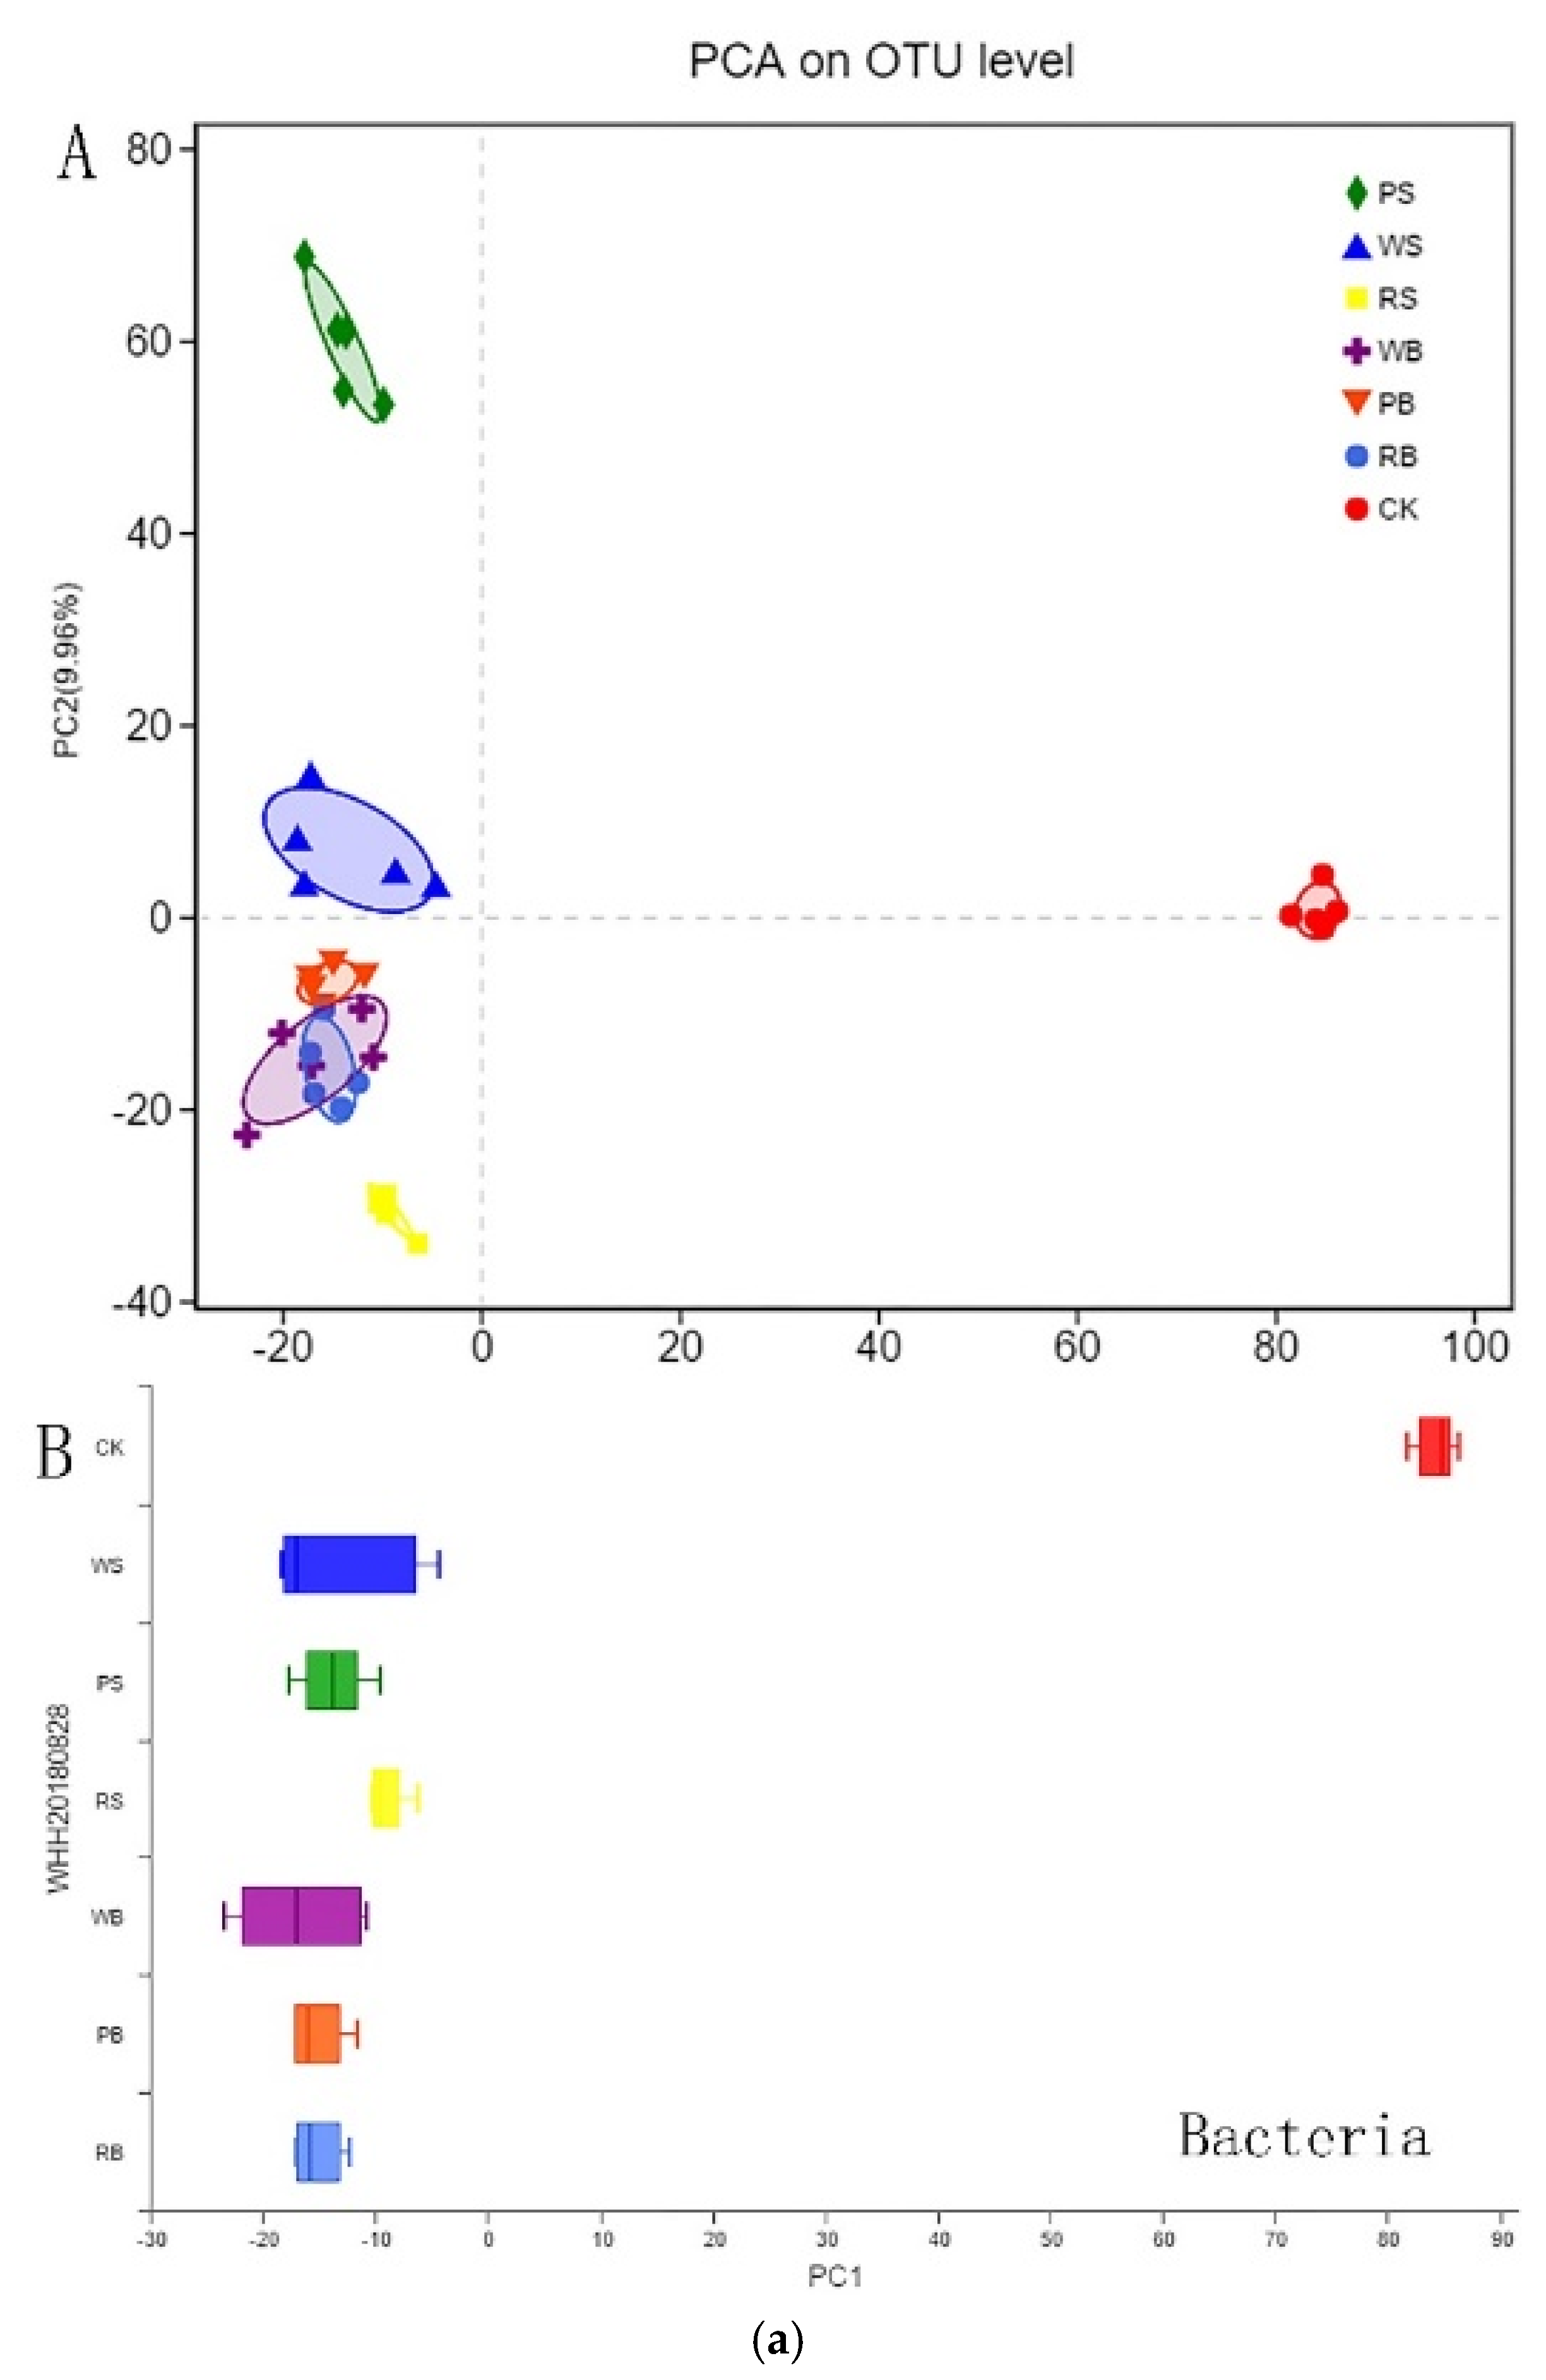
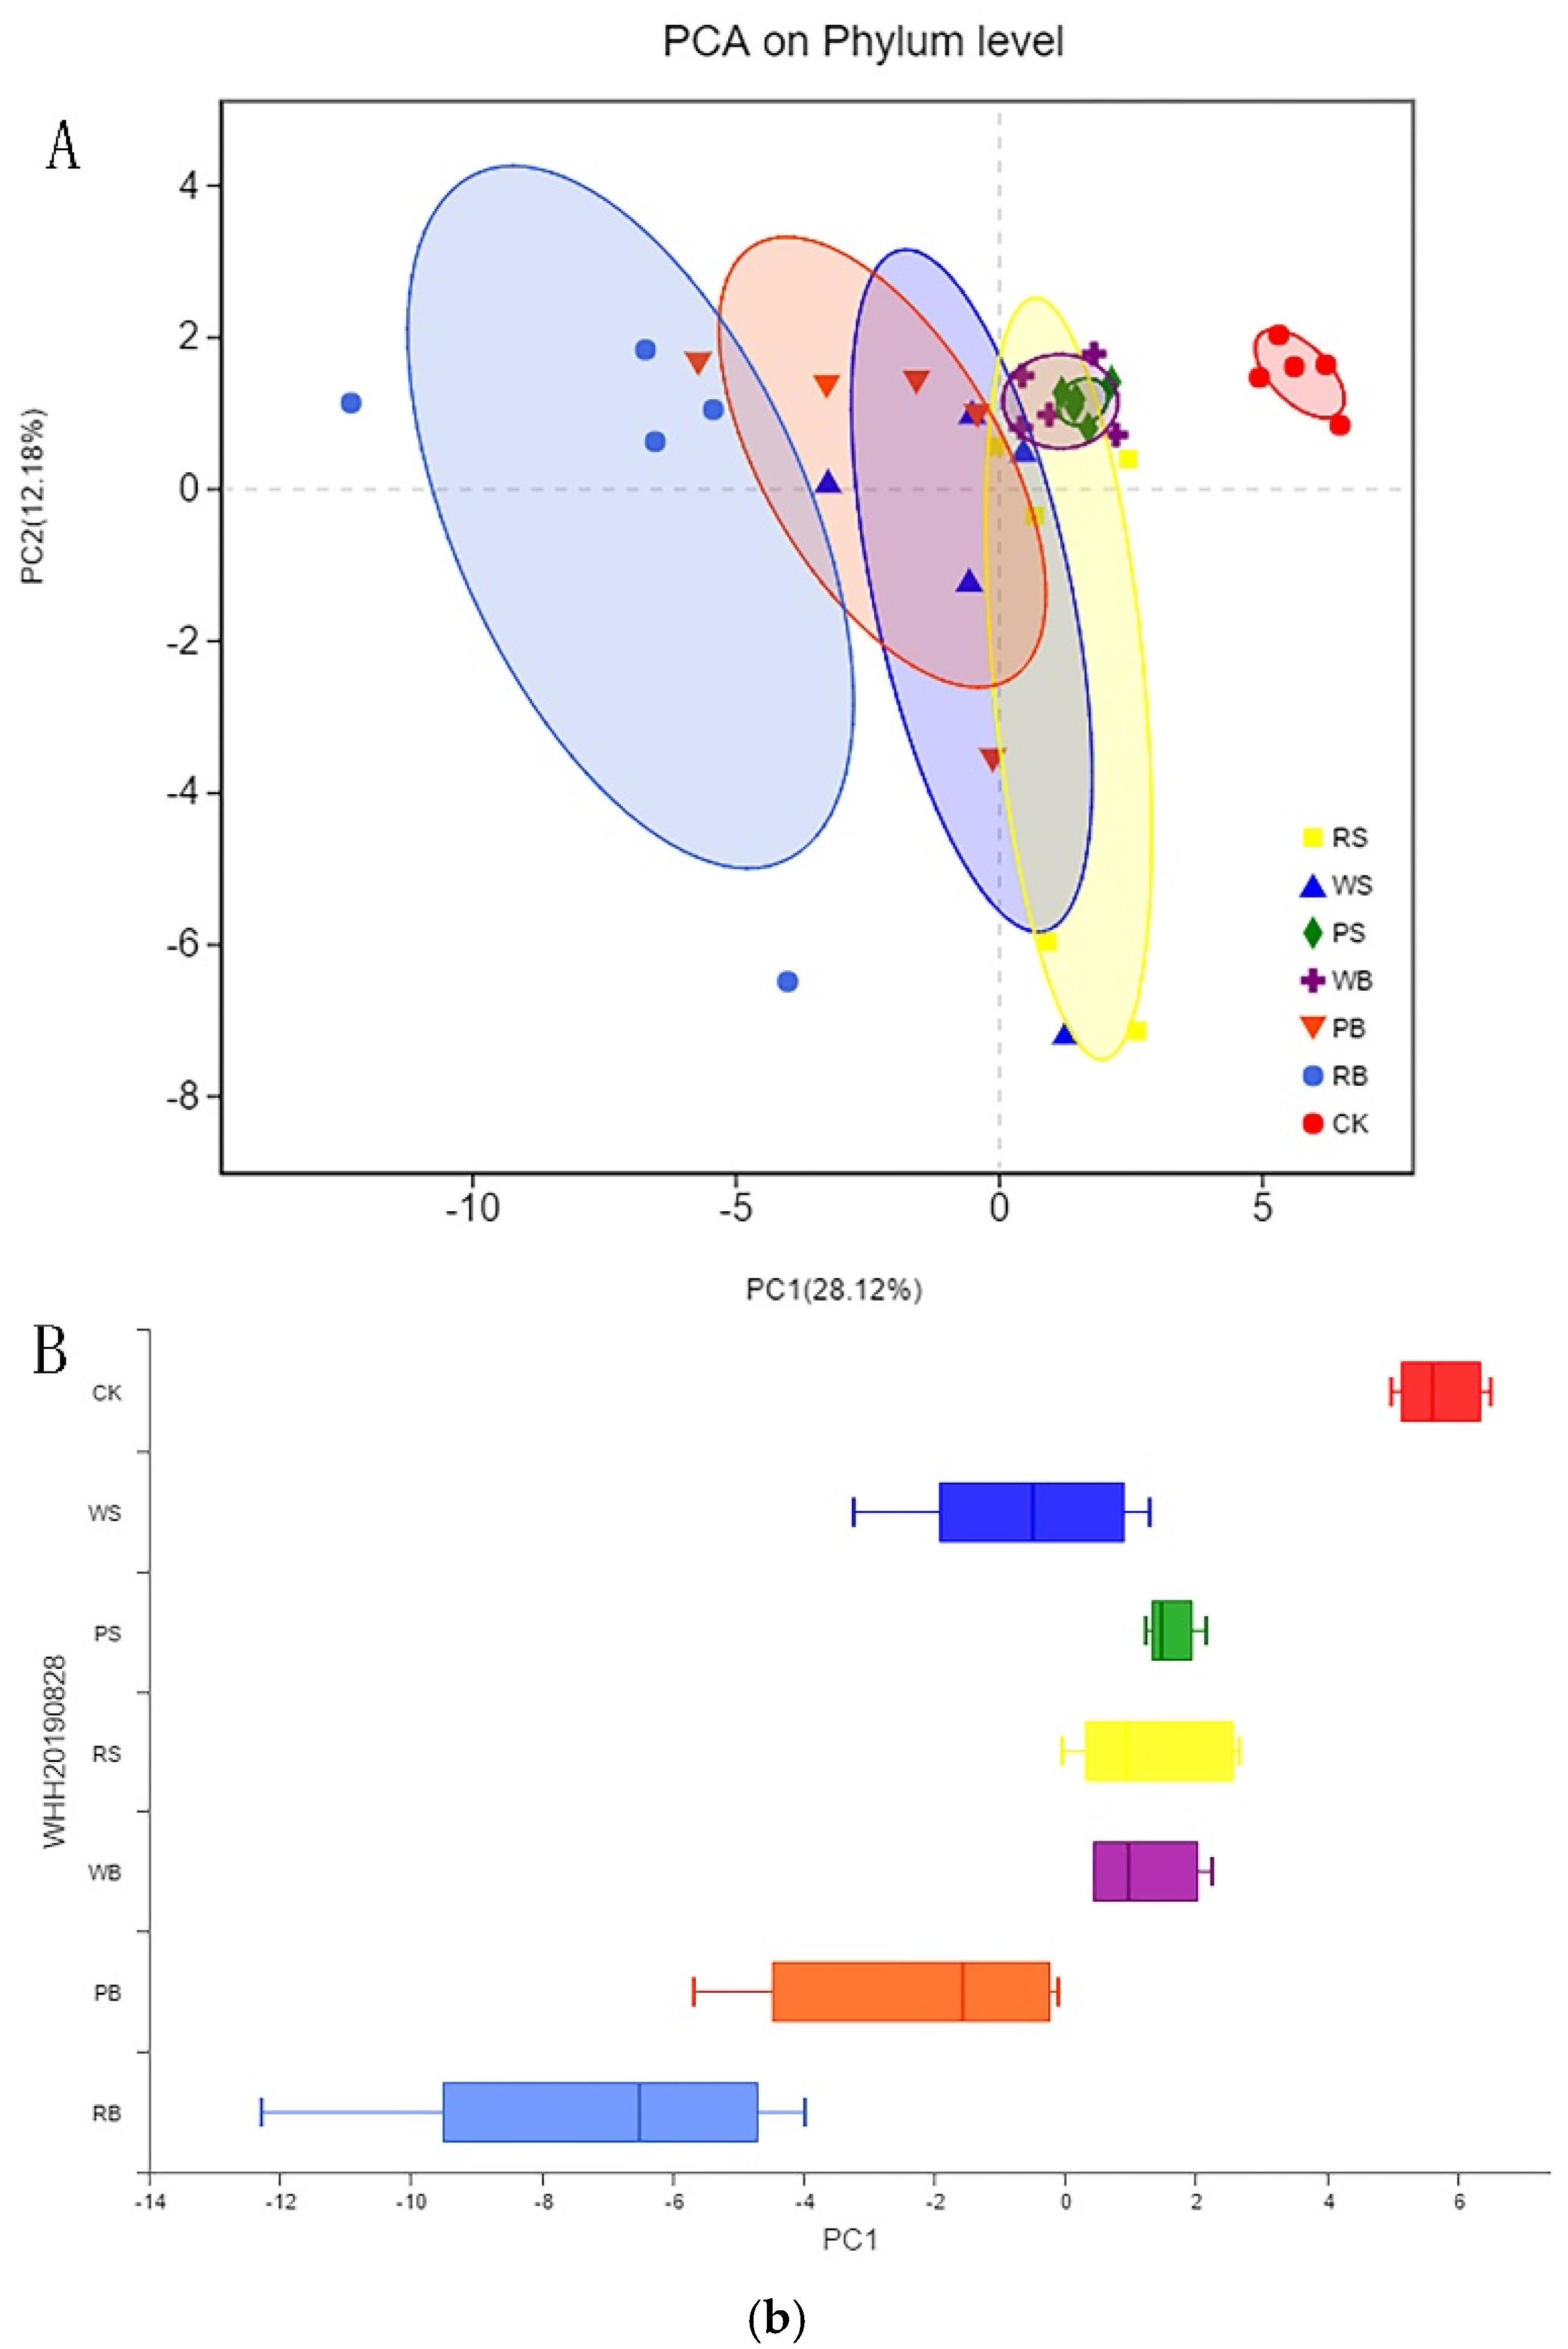
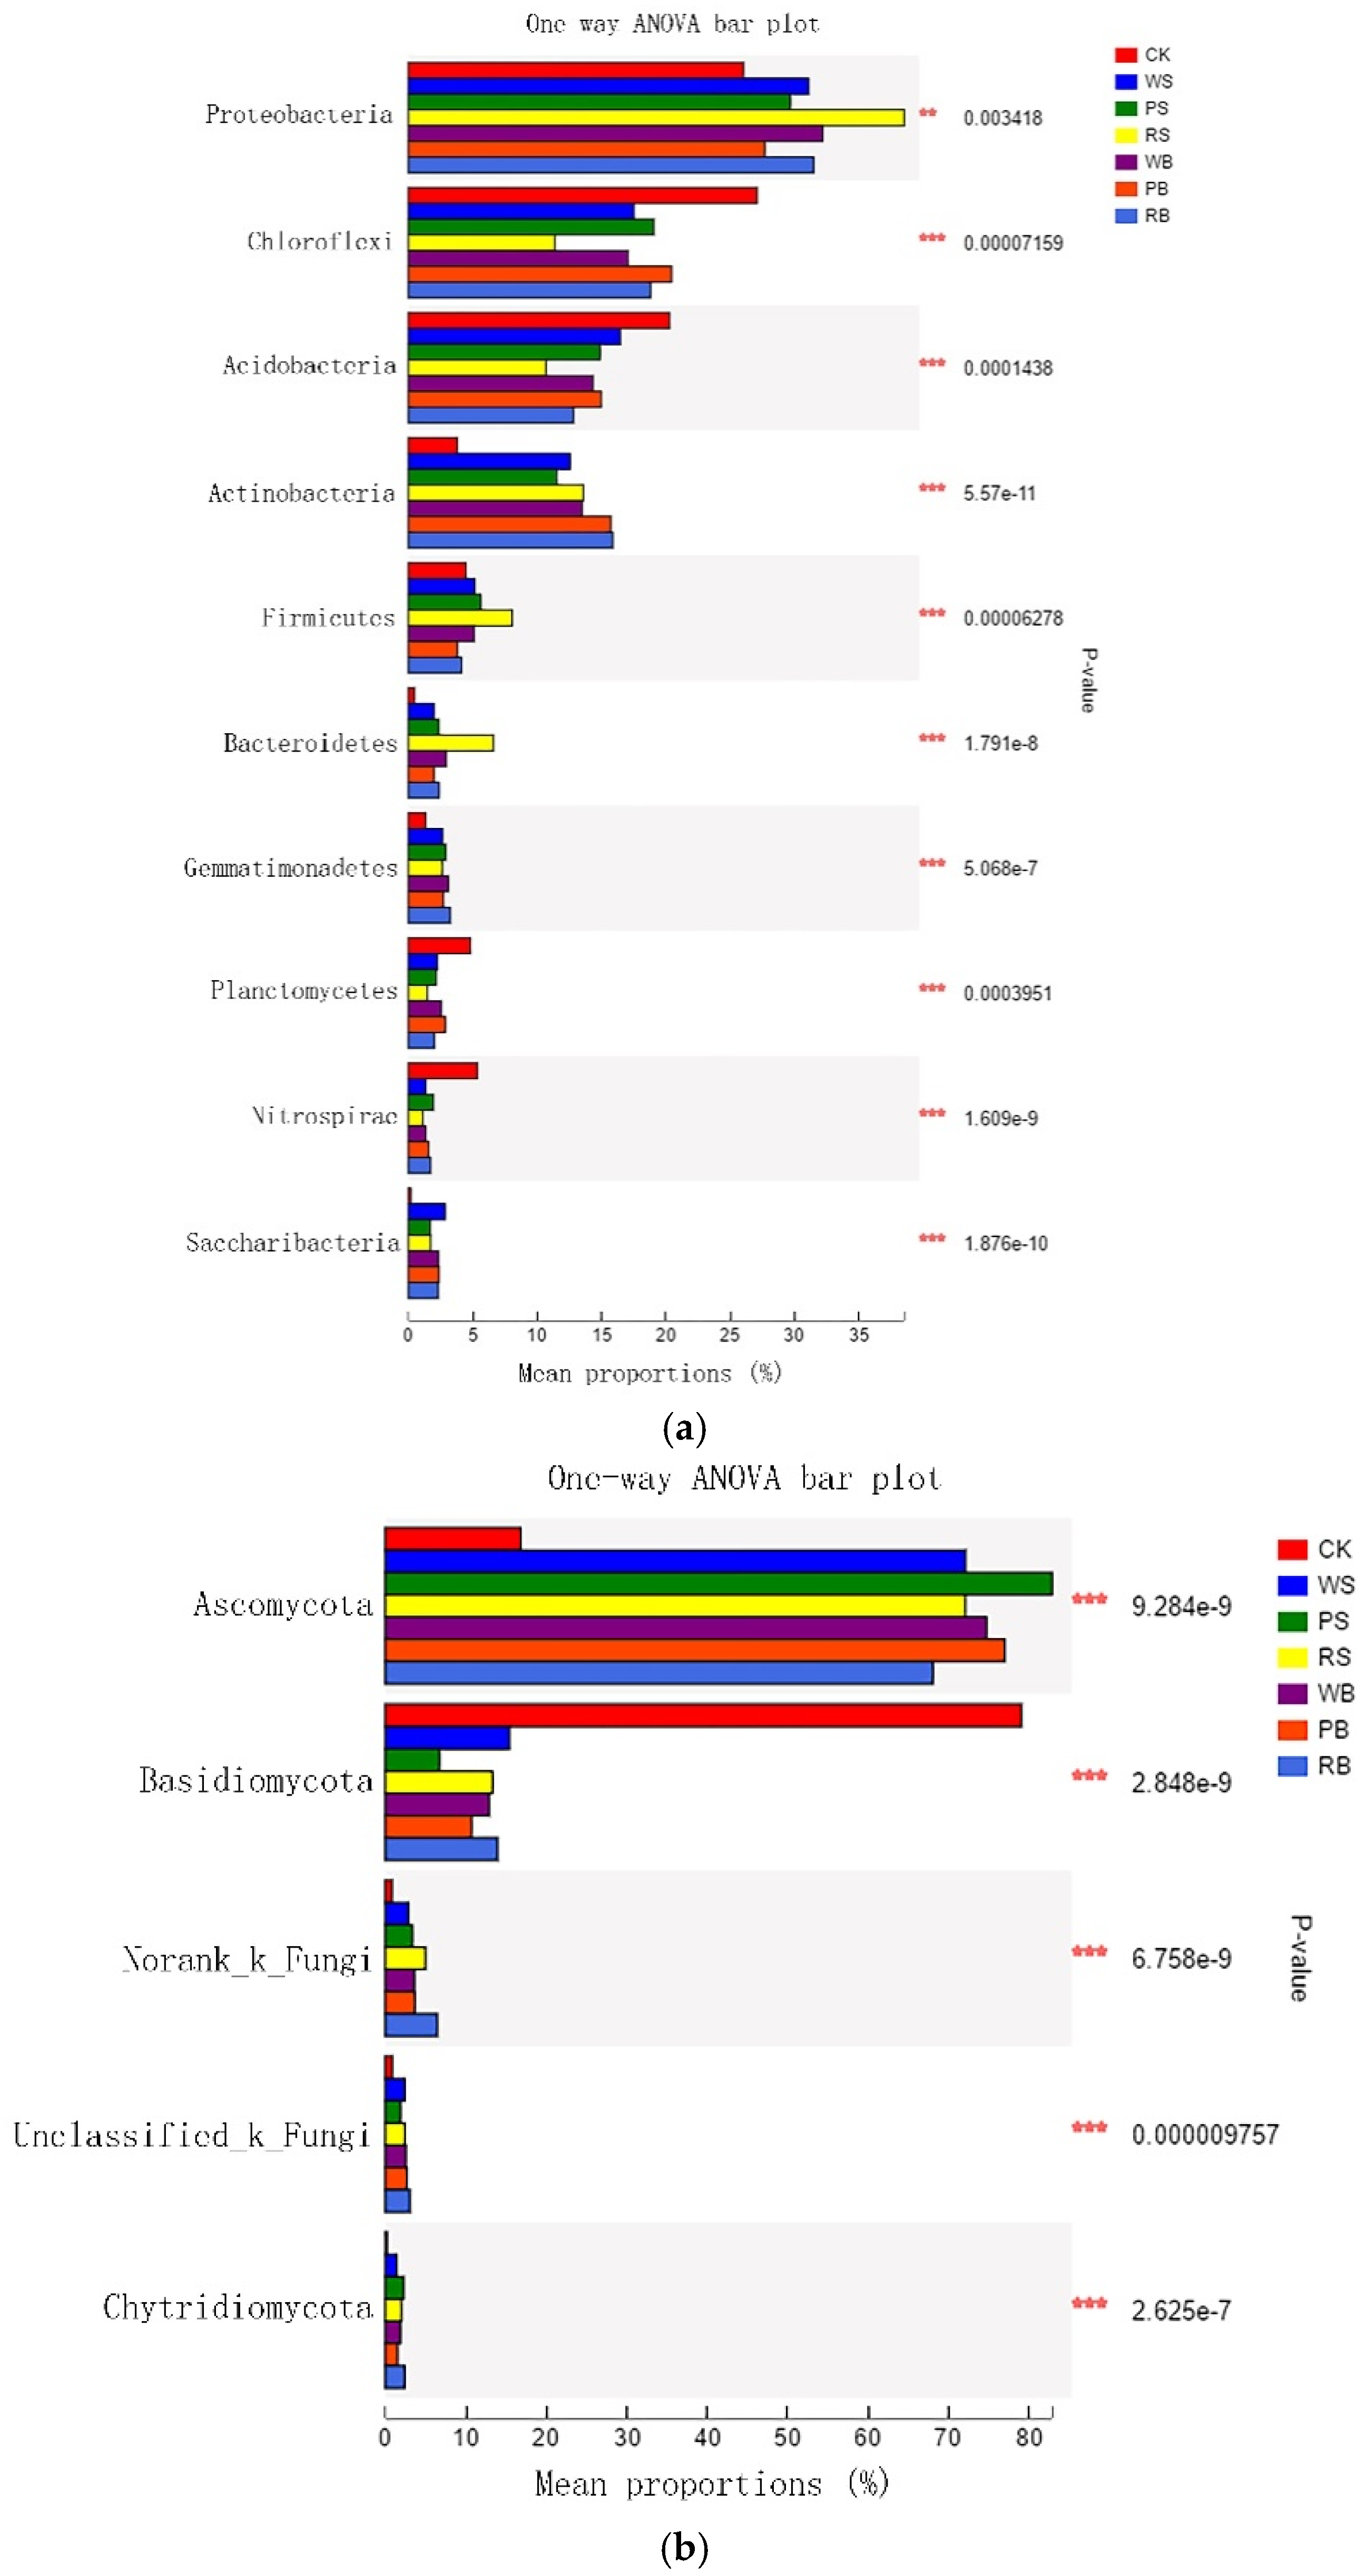
The beta diversity of fungi and bacteria was examined by PCA analysis. PCA classifies fungal and bacterial communities according to different protocols of experimental treatment (Figure 4). The dominant flora in soil bacterial and fungal communities was generally consistent across the four regimens, but the relative abundance, and each scheme had the unique microbial population (Figure 4). At the same time, this study also found that the bacterial community structure of WB, PB, RB had a high similarity, and whether it was bacteria or fungi, the community structure difference with CK treatment was relatively significant. The soil microbial community structure changed significantly with the addition of soil materials. Among them, proteobacteria and firmicutes in RS were significantly more than other treatments, but its chloroflexi and acidobacteria were significantly lower than other treatments; chloroflexi and acidobacteria in CK were significantly more than other treatments, but acidobacteria was significantly lower than other treatments. As it can be seen from Figure 5, ascomycola, norank-k-fungi, unclassified-k-fungi, and xhytridiomycota in CK were significantly lower than other treatments, but CK’s basidiomycota was far more than other treatments. Although the relative abundance and diversity of soil bacteria and fungi responded differently to different treatments (WS, PS, RS, WB, PB, RB). However, whether the addition of biomass or biochar in the soil had a more significant effect on the microbial community structure of the soil. This may be because the addition of biomass or biochar to the soil changed the physical and chemical properties of the soil, which in turn changes the living environment of the soil microbes. Soil microbes were susceptible to their living environment [2], and ultimately soil microbial community structure and abundance had changed.

3.5. Tobacco Biomass and Root Activity

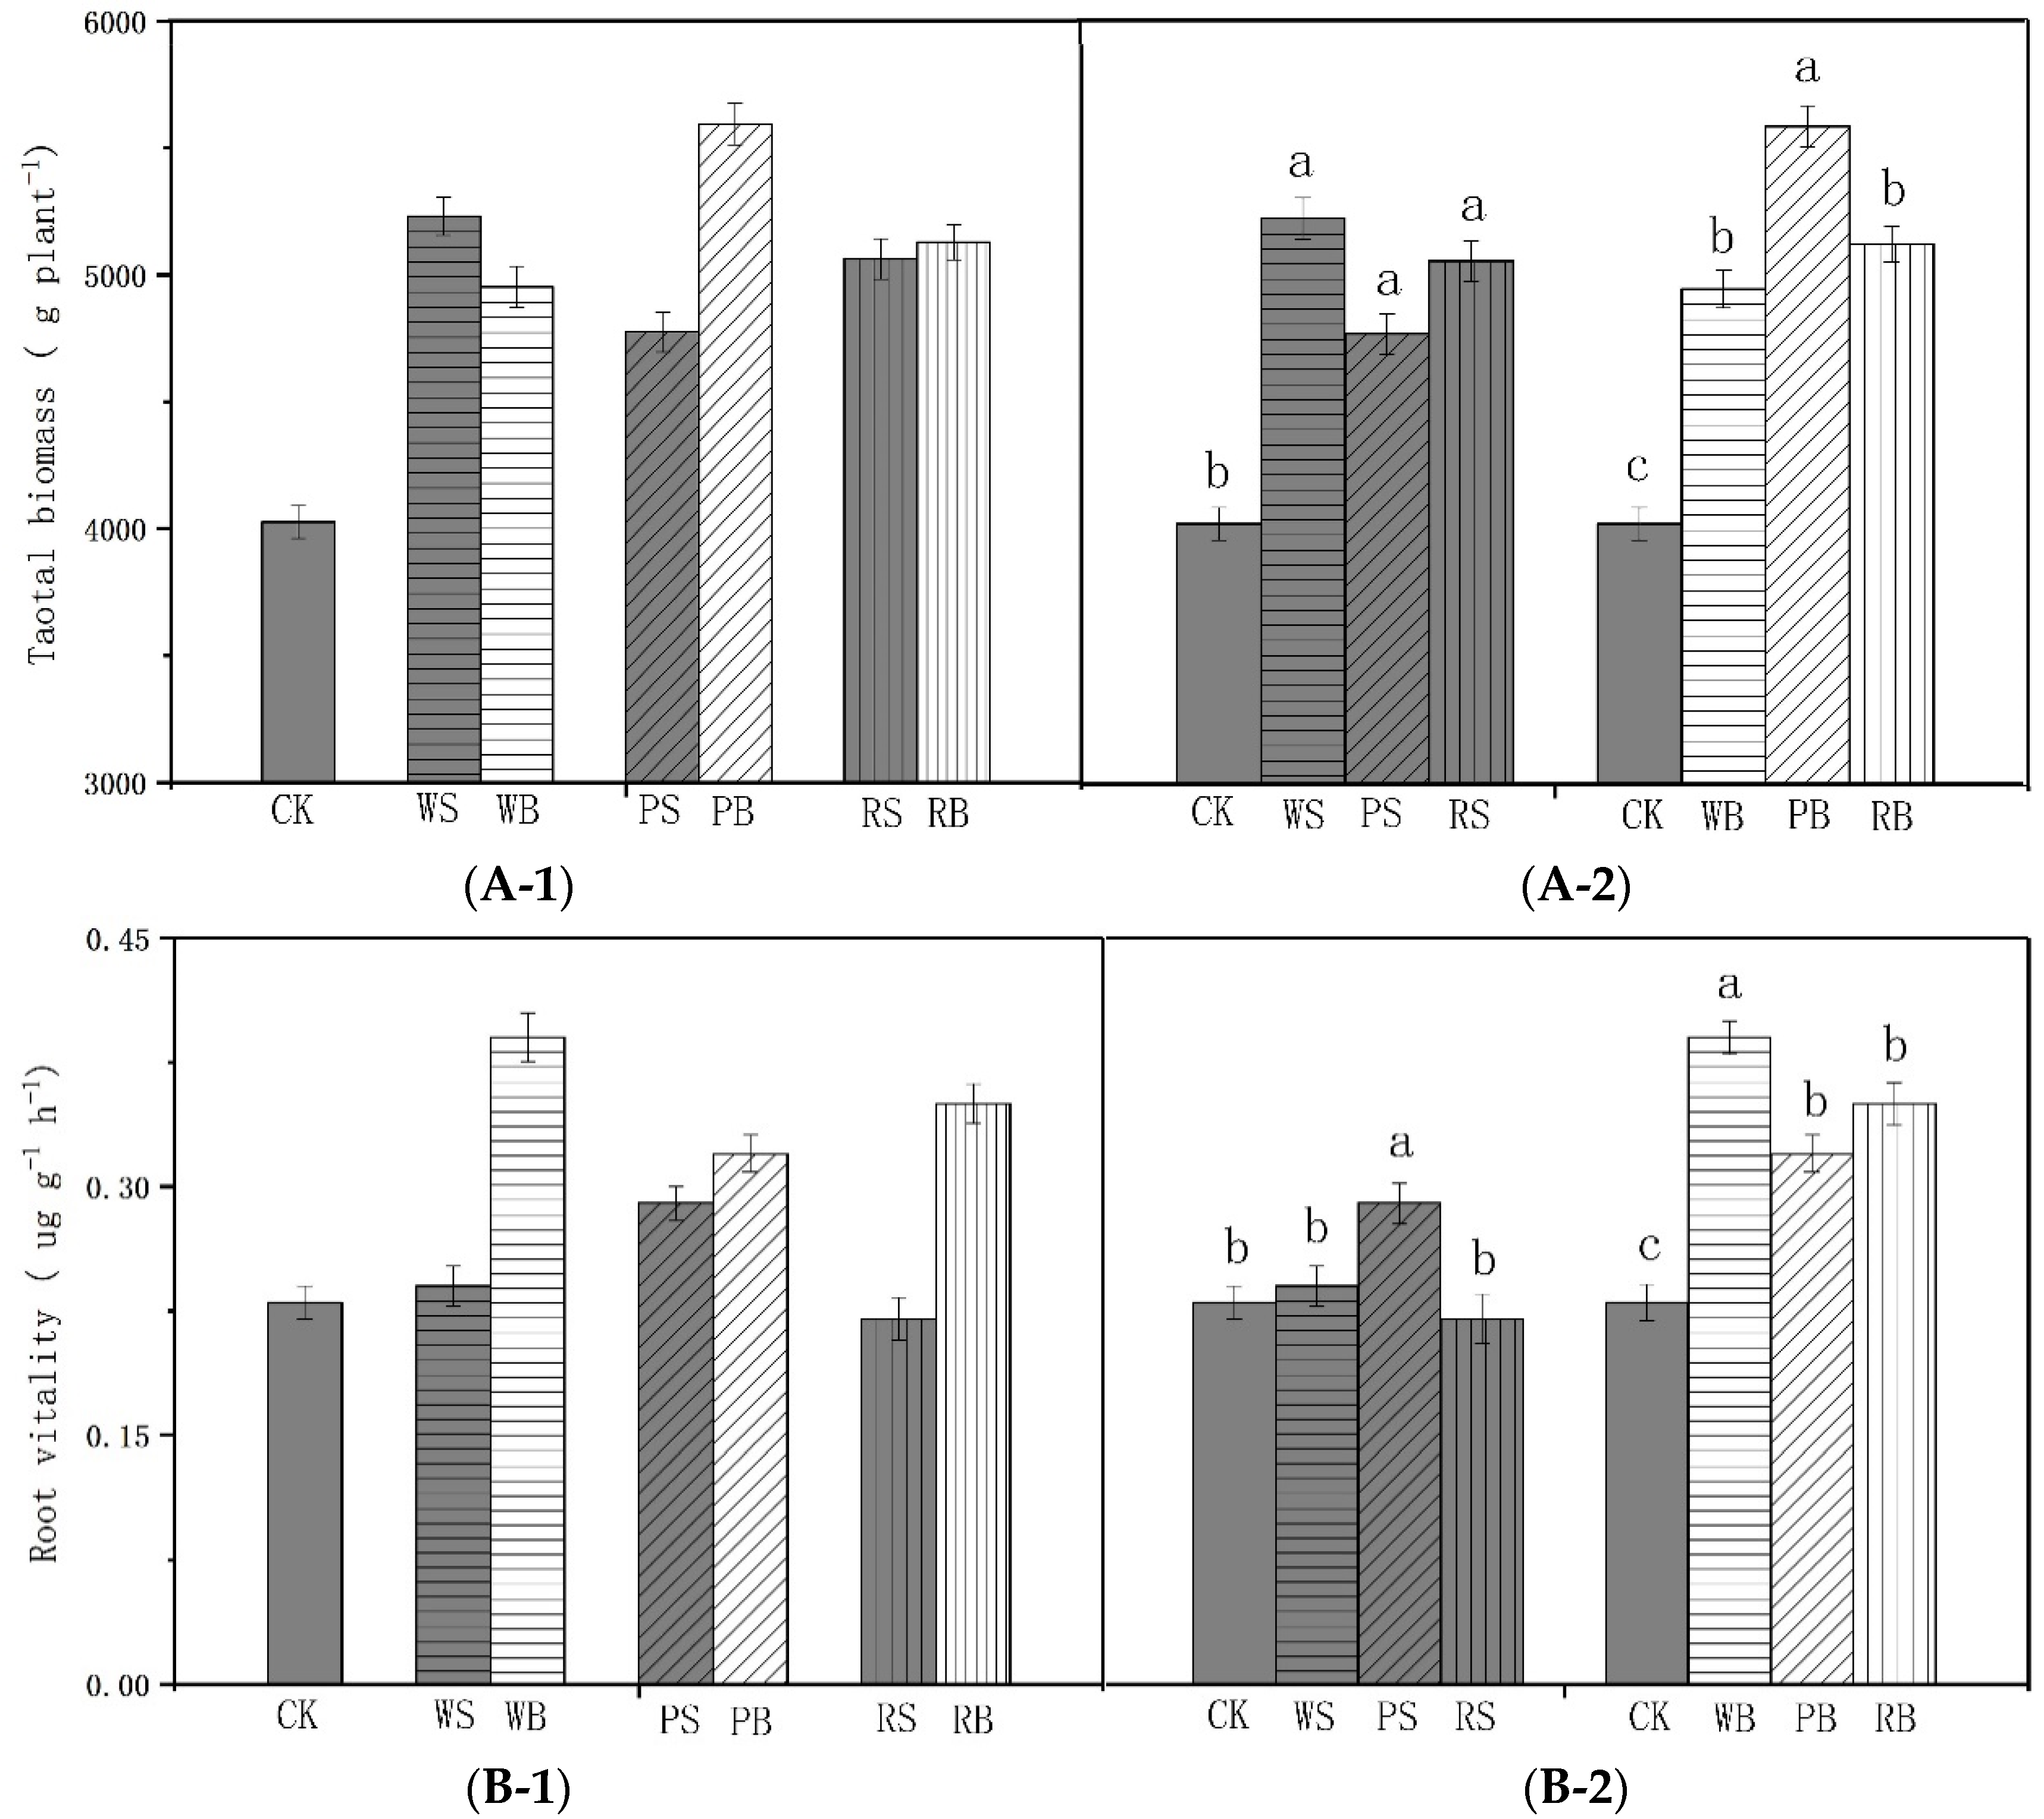
Compared with the control, the total biomass of tobacco was significantly increased in WB, PB, and RB, and increased by 39.9%, 25.8%, 27.4%, respectively; and the tobacco biomass of WS, PS, and RS was also significantly higher than that of the control, and increased by 29.9%, 23.0%, 18.6%, respectively (Figure 6A-1). However, the total biomass of PB and RB was higher than that of their raw materials, and increased by 2.2%, 7.4%, respectively (Figure 6A-2). This may be because biochar increased the soil organic matter content, and at the same time activated the nutrients in the soil and improved the nutrient absorption efficiency of tobacco roots [55]. It may also be thought that biochar improved soil porosity and aeration [21], and promotes the growth of beneficial rhizosphere microorganisms [2], which provided suitable conditions and material basis for tobacco growth. This study also found that biochar can significantly increase the root activity of tobacco. The root activity of WB, PB, and RB was higher than WS, PS, RS, and CK (Figure 6B-1), and significantly different from the control, and WB was higher than their raw materials and controls 69.6%, 71.4%, respectively (Figure 6B-2). This may be because biochar changes soil pH and density [56], which made the soil environment more conducive to the metabolism of tobacco roots. At the same time, the increase of biochar can increase the activity of micro-native growth in the rhizosphere, and the rhizosphere microorganisms and the root system were symbiotic, so they can promote root growth [44]. All the factors above promote the metabolic strength of the tobacco root system, which in turn increased the root activity of tobacco. Additional experiments will be necessary for tobacco growth parameters, such as photosynthetic characteristics, chlorophyll content, total root length, total root tip, and tobacco plant height.

4. Conclusions

Wheat straw, peanut shell, and rice husk were successfully transformed into slow pyrolysis biochar (WB, PB, RB), characterized and used in soil culture research. These biochar-modified soils and three parental biomass (wheat straw, peanut shell, and rice husk) were incubated for 100 days. The carbon dioxide emissions of WB improved soil decreased by 21.33% compared with the control soil and decreased by 91.82% compared with WS. Therefore, a large amount of carbon dioxide emissions can be avoided by first converting the straw into biochar instead of directly returning the straw to the farmland. In addition, biochar increased soil organic carbon, organic matter, pH, EC, cation exchange capacity, and water holding capacity. The total biomass and root activity of tobacco increased compared to the control soil.
If the agricultural biomass waste currently burning in China was pyrolyzed into biochar and used to improve the soil, significant benefits to the atmospheric environment and soil quality would be realized. First, carbon dioxide emissions would decrease, and then carbon dioxide produced by the open burning of residues and waste would also decrease. A portion of this carbon would be returned to the soil as biochar. Similarly, biochar contains micronutrients in the ash, which improves the soil and provides nutrients for the crop. Because biochar is chemically stable, it is preserved in the soil for long a time while resisting global warming. Finally, biochar improves the soil while reducing soil carbon dioxide emissions through many known mechanisms (water retention, enhanced cation exchange capacity (CEC), providing microbes and beneficial fungal surfaces, converting some biochar to organic carbon, etc.); this should be the purpose of converting agricultural waste into biochar rather than burning it. Furthermore, this study still needs to verify these points thoroughly through years of positioning experiments. If farmers are aware of this, they can reduce open burning, reduce the accompanying air pollution, and adopt large-scale carbon sequestration methods in agricultural practices, while increasing crop yields.

Author Contributions

Conceptualization: H.W., T.R. and H.S.; Methodology: H.W., T.R., H.F., G.L. and H.Y.; Data collection: Y.F., H.S., Q.Y., H.W. and T.R.; Formal analysis: H.F. and H.W.; Supervision: T.R. and H.S.; Funding acquisition: H.S. and T.R.; Writing—original draft preparation: H.W.; Writing—review and editing: H.S. All authors have read and agreed to the published version of the manuscript.

Funding

This research was funded by the Topics of the National Key R&D Program: Integration and Application of Fertilizer Reduction Technology in Crop Production under High Efficiency Utilization of Green Manure, China.

Acknowledgments

The authors wish to thank Ondřej Mašek and Qiaona Pan for their analyses of the samples. We would also like to extend our appreciation to all members of the UK Biochar Research Centre for their helpful suggestions and support of this study.

Conflicts of Interest

The authors declare no conflict of interest. The funders had no role in the design, execution, and report of the study.

References

  1. Graber, E.R.; Harel, Y.M.; Kolton, M.; Cytryn, E.; Silber, A.; David, D.R.; Tsechansky, L.; Borenshtein, M.; Elad, Y. Biochar impact on development and productivity of pepper and tomato grown in fertigated soilless media. Plant Soil 2010, 337, 481–496. [Google Scholar] [CrossRef]
  2. Steinbeiss, S.; Gleixner, G.; Antonietti, M. Effect of biochar amendment on soil carbon balance and soil microbial activity. Soil Boil. Biochem. 2009, 41, 1301–1310. [Google Scholar] [CrossRef]
  3. Mohan, D.; Abhishek, K.; Sarswat, A.; Patel, M.; Singh, P.; Pittman, C.U. Biochar production and applications in soil fertility and carbon sequestration—A sustainable solution to crop-residue burning in India. RSC Adv. 2018, 8, 508–520. [Google Scholar] [CrossRef] [Green Version]
  4. D’Alessandro, D.M.; Smit, B.; Long, J.R. Carbon Dioxide Capture: Prospects for New Materials. Angew. Chem. Int. Ed. 2010, 49, 6058–6082. [Google Scholar] [CrossRef] [Green Version]
  5. Gadalla, M.; Olujić, Ž.; Jobson, M.; Smith, R. Estimation and reduction of CO2 emissions from crude oil distillation units. Energy 2006, 31, 2398–2408. [Google Scholar] [CrossRef]
  6. Lehmann, J.; Rillig, M.C.; Thies, J.; Masiello, C.A.; Hockaday, W.; Crowley, D. Biochar effects on soil biota—A review. Soil Boil. Biochem. 2011, 43, 1812–1836. [Google Scholar] [CrossRef]
  7. Jeffery, S.; Verheijen, F.G.; Van Der Velde, M.; Bastos, A.C. A quantitative review of the effects of biochar application to soils on crop productivity using meta-analysis. Agric. Ecosyst. Environ. 2011, 144, 175–187. [Google Scholar] [CrossRef]
  8. Spokas, K. Impact of biochar field aging on laboratory greenhouse gas production potentials. GCB Bioenergy 2012, 5, 165–176. [Google Scholar] [CrossRef]
  9. Lehmann, J.; da Silva, J.P., Jr.; Steiner, C.; Nehls, T.; Zech, W.; Glaser, B. Nutrient availability and leaching in an archaeological Anthrosol and a Ferralsol of the Central Amazon basin: Fertilizer, manure and charcoal amendments. Plant Soil 2003, 249, 343–357. [Google Scholar] [CrossRef]
  10. Glaser, B.; Lehmann, J.; Zech, W. Ameliorating physical and chemical properties of highly weathered soils in the tropics with charcoal—A review. Boil. Fertil. Soils 2002, 35, 219–230. [Google Scholar] [CrossRef]
  11. Ghani, W.A.W.A.K.; Mohd, A.; Da Silva, G.; Bachmann, R.; Taufiq-Yap, Y.H.; Rashid, U.; Al-Muhtaseb, A.H. Biochar production from waste rubber-wood-sawdust and its potential use in C sequestration: Chemical and physical characterization. Ind. Crop. Prod. 2013, 44, 18–24. [Google Scholar] [CrossRef]
  12. Busch, D.; Kammann, C.I.; Grünhage, L.; Muller, C. Simple Biotoxicity Tests for Evaluation of Carbonaceous Soil Additives: Establishment and Reproducibility of Four Test Procedures. J. Environ. Qual. 2012, 41, 1023–1032. [Google Scholar] [CrossRef] [PubMed]
  13. Kammann, C.; Ratering, S.; Eckhard, C.; Muller, C. Biochar and Hydrochar Effects on Greenhouse Gas (Carbon Dioxide, Nitrous Oxide, and Methane) Fluxes from Soils. J. Environ. Qual. 2012, 41, 1052–1066. [Google Scholar] [CrossRef] [PubMed]
  14. Karhu, K.; Mattila, T.; Bergström, I.; Regina, K. Biochar addition to agricultural soil increased CH4 uptake and water holding capacity—Results from a short-term pilot field study. Agric. Ecosyst. Environ. 2011, 140, 309–313. [Google Scholar] [CrossRef]
  15. Baronti, S.; Vaccari, F.P.; Miglietta, F.; Calzolari, C.; Lugato, E.; Orlandini, S.; Pini, R.; Zulian, C.; Genesio, L. Impact of biochar application on plant water relations in Vitis vinifera (L.). Eur. J. Agron. 2014, 53, 38–44. [Google Scholar] [CrossRef]
  16. Yanai, Y.; Toyota, K.; Okazaki, M. Effects of charcoal addition on N2O emissions from soil resulting from rewetting air-dried soil in short-term laboratory experiments. Soil Sci. Plant Nutr. 2007, 53, 181–188. [Google Scholar] [CrossRef]
  17. Marchetti, C. On geoengineering and the CO2 problem. Clim. Chang. 1977, 1, 59–68. [Google Scholar] [CrossRef] [Green Version]
  18. Sissoko, A.; Kpomblekou-A, K. Carbon decomposition in broiler litter-amended soils. Soil Boil. Biochem. 2010, 42, 543–550. [Google Scholar] [CrossRef]
  19. Rillig, M.; Wagner, M.; Salem, M.; Antunes, P.; George, C.; Ramke, H.-G.; Titirici, M.; Antonietti, M. Material derived from hydrothermal carbonization: Effects on plant growth and Arbuscular mycorrhiza. Appl. Soil Ecol. 2010, 45, 238–242. [Google Scholar] [CrossRef]
  20. Li, H.; Dong, T.; Wang, M. Effects of Biochar on Microbial Communities and Metabolic Activity in Rhizospheric Soil of Banana Seedlings. J. Microbiol. 2016, 36, 42–48. [Google Scholar]
  21. Chen, Z.B.; Gao, X.; Wang, D.B.; Guo, L.H.; Wang, D.K.; Xu, S.G. Effects of Different Biochar Application Rates on Rhizosphere Soil Microbial Diversity of Tobacco. Acta Agric. Boreali.-Sin. 2018, 33, 224–232. [Google Scholar]
  22. Sheng, Y.; Zhu, L. Biochar alters microbial community and carbon sequestration potential across different soil pH. Sci. Total Environ. 2018, 622–623, 1391–1399. [Google Scholar] [CrossRef] [PubMed]
  23. Clemensson-Lindell, A. Triphenyltetrazolium chloride as an indicator of fine-root vitality and environmental stress in coniferous forest stands: Applications and limitations. Plant Soil 1994, 159, 297–300. [Google Scholar] [CrossRef]
  24. Maiti, S.; Dey, S.; Purakayastha, S.; Ghosh, B. Physical and thermochemical characterization of rice husk char as a potential biomass energy source. Bioresour. Technol. 2006, 97, 2065–2070. [Google Scholar] [CrossRef] [PubMed]
  25. Caporaso, J.G.; Lauber, C.L.; Walters, W.A.; Berg-Lyons, D.; Lozupone, C.A.; Turnbaugh, P.J.; Fierer, N.; Knight, R. Global patterns of 16S rRNA diversity at a depth of millions of sequences per sample. Proc. Natl. Acad. Sci. USA 2011, 108, 4516–4522. [Google Scholar] [CrossRef] [PubMed] [Green Version]
  26. Hess, M.; Sczyrba, A.; Egan, R.; Kim, T.-W.; Chokhawala, H.; Schroth, G.; Luo, S.; Clark, D.S.; Chen, F.; Zhang, T.; et al. Metagenomic Discovery of Biomass-Degrading Genes and Genomes from Cow Rumen. Science 2011, 331, 463–467. [Google Scholar] [CrossRef] [Green Version]
  27. Edgar, R.C.; Haas, B.J.; Clemente, J.C.; Quince, C.; Knight, R. UCHIME improves sensitivity and speed of chimera detection. Bioinformatics 2011, 27, 2194–2200. [Google Scholar] [CrossRef] [Green Version]
  28. Edgar, R.C. UPARSE: Highly accurate OTU sequences from microbial amplicon reads. Nat. Methods 2013, 10, 996–998. [Google Scholar] [CrossRef]
  29. Wang, Q.; Garrity, G.M.; Tiedje, J.M.; Cole, J.R. Naïve Bayesian Classifier for Rapid Assignment of rRNA Sequences into the New Bacterial Taxonomy. Appl. Environ. Microbiol. 2007, 73, 5261–5267. [Google Scholar] [CrossRef] [Green Version]
  30. DeSantis, T.Z.; Hugenholtz, P.; Larsen, N.; Rojas, M.; Brodie, E.L.; Keller, K.; Huber, T.; Dalevi, D.; Hu, P.; Andersen, G.L. Greengenes, a chimera-checked 16S rRNA gene database and workbench compatible with ARB. Appl. Environ. Microbiol. 2006, 72, 5069–5072. [Google Scholar] [CrossRef] [Green Version]
  31. Kuhlbusch, T. Method for Determining Black Carbon in Residues of Vegetation Fires. Environ. Sci. Technol. 1995, 29, 2695–2702. [Google Scholar] [CrossRef] [PubMed]
  32. Mukome, F.N.D.; Parikh, S.J. Chemical, physical, and surface characterization of biochar. In Biochar: Production, Characterization and Applications; Ok, Y.S., Uchimiya, S.M., Chang, S.X., Bolan, N., Eds.; CRC Press: Boca Raton, FL, USA, 2015. [Google Scholar]
  33. Zhang, M.; Liu, X.; Wang, W.; Zhou, M. Decomposition analysis of CO2 emissions from electricity generation in China. Energy Policy 2013, 52, 159–165. [Google Scholar] [CrossRef]
  34. Toyama, A.; Matsumoto, I.; Izumichi, T. Method of Producing the Gaseous and Liquefied Nitrogen and an Apparatus Used Therefor. U.S. Patent No. 3,736,762, 5 June 1973. [Google Scholar]
  35. Martin, S.L.; Clarke, M.L.; Othman, M.; Ramsden, S.; West, H.M. Biochar-mediated reductions in greenhouse gas emissions from soil amended with anaerobic digestates. Biomass Bioenergy 2015, 79, 39–49. [Google Scholar] [CrossRef]
  36. Singla, A.; Iwasa, H.; Inubushi, K. Effect of biogas digested slurry based-biochar and digested liquid on N2O, CO2 flux and crop yield for three continuous cropping cycles of komatsuna (Brassica rapa var. perviridis). Boil. Fertil. Soils 2014, 50, 1201–1209. [Google Scholar] [CrossRef]
  37. Lim, S.-S.; Choi, W.-J.; Lee, K.-S.; Ro, H.-M. Reduction in CO2 emission from normal and saline soils amended with coal fly ash. J. Soils Sediments 2012, 12, 1299–1308. [Google Scholar] [CrossRef]
  38. Ohlsson, K.E.A. Carbonation of Wood Ash Recycled to a Forest Soil as Measured by Isotope Ratio Mass Spectrometry. Soil Sci. Soc. Am. J. 2000, 64, 2155–2161. [Google Scholar] [CrossRef]
  39. Liu, Y.; Yang, M.; Wu, Y.; Wang, H.; Chen, Y.; Wu, W. Reducing CH4 and CO2 emissions from waterlogged paddy soil with biochar. J. Soils Sediments 2011, 11, 930–939. [Google Scholar] [CrossRef]
  40. Libra, J.; Ro, K.; Kammann, C.; Funke, A.; Berge, N.D.; Neubauer, Y.; Titirici, M.-M.; Fühner, C.; Bens, O.; Kern, J.; et al. Hydrothermal carbonization of biomass residuals: A comparative review of the chemistry, processes and applications of wet and dry pyrolysis. Biofuels 2011, 2, 71–106. [Google Scholar] [CrossRef] [Green Version]
  41. Van Zwieten, L.; Kimber, S.; Morris, S.; Downie, A.; Berger, E.; Rust, J.; Scheer, C. Influence of biochars on flux of N2O and CO2 from Ferrosol. Soil Res. 2010, 48, 555–568. [Google Scholar] [CrossRef]
  42. Chan, K.Y.; Van Zwieten, L.; Meszaros, I.; Downie, A.; Joseph, S. Agronomic values of greenwaste biochar as a soil amendment. Soil Res. 2007, 45, 629. [Google Scholar] [CrossRef]
  43. Herath, H.; Arbestain, M.C.; Hedley, M. Effect of biochar on soil physical properties in two contrasting soils: An Alfisol and an Andisol. Geoderma 2013, 209, 188–197. [Google Scholar] [CrossRef]
  44. Soinne, H.; Hovi, J.; Tammeorg, P.; Turtola, E. Effect of biochar on phosphorus sorption and clay soil aggregate stability. Geoderma 2014, 219, 162–167. [Google Scholar] [CrossRef]
  45. Steiner, C.; Das, K.; Garcia, M.; Förster, B.; Zech, W. Charcoal and smoke extract stimulate the soil microbial community in a highly weathered xanthic Ferralsol. Pedobiologia 2008, 51, 359–366. [Google Scholar] [CrossRef]
  46. Devereux, R.C.; Sturrock, C.; Mooney, S.J. The effects of biochar on soil physical properties and winter wheat growth. Earth Environ. Sci. Trans. R. Soc. Edinb. 2012, 103, 13–18. [Google Scholar] [CrossRef]
  47. Tryon, E.H. Effect of Charcoal on Certain Physical, Chemical, and Biological Properties of Forest Soils. Ecol. Monogr. 1948, 18, 81–115. [Google Scholar] [CrossRef]
  48. Wang, H.; Ren, T.; Zhang, Z.; Yuan, Y.; Wang, B.; Kuang, G.; Liu, D.; Liu, G. Effects of Biochar on Tobacco-planting Soil Improvement and Tobacco Quality in Mudanjiang Area. Agric. Sci. Technol. 2017, 18, 820–826. [Google Scholar]
  49. Kolb, S.E.; Fermanich, K.J.; Dornbush, M.E. Effect of charcoal quantity on microbial biomass and activity in temperate soils. Soil Sci. Soc. Am. J. 2009, 73, 1173–1181. [Google Scholar] [CrossRef] [Green Version]
  50. Palumbo, A.V.; Porat, I.; Phillips, J.R.; Amonette, J.E.; Drake, M.M.; Brown, S.D.; Schadt, C.W. Leaching of mixtures of biochar and fly ash. In Proceedings of the Report of World of Coal Ash (WOCA) Conference, Lexington, KY, USA, 4–7 May 2009. [Google Scholar]
  51. Kimetu, J.M.; Lehmann, J. Stability and stabilisation of biochar and green manure in soil with different organic carbon contents. Soil Res. 2010, 48, 577. [Google Scholar] [CrossRef]
  52. Ding, Y.; Liu, Y.-X.; Wu, W.; Shi, D.; Yang, M.; Zhong, Z.-K. Evaluation of Biochar Effects on Nitrogen Retention and Leaching in Multi-Layered Soil Columns. Water Air Soil Pollut. 2010, 213, 47–55. [Google Scholar] [CrossRef]
  53. Rondon, M.A.; Lehmann, J.; Ramírez, J.; Hurtado, M. Biological nitrogen fixation by common beans (Phaseolus vulgaris L.) increases with bio-char additions. Boil. Fertil. Soils 2006, 43, 699–708. [Google Scholar] [CrossRef]
  54. Prendergast-Miller, M.; Duvall, M.; Sohi, S.; Prendergast-Miller, M.T. Biochar-root interactions are mediated by biochar nutrient content and impacts on soil nutrient availability. Eur. J. Soil Sci. 2013, 65, 173–185. [Google Scholar] [CrossRef]
  55. Whitman, T.; Singh, B.P.; Zimmerman, A.R.; Lehmann, J.; Joseph, S. Priming effects in biochar-amended soils: Implications of biochar-soil organic matter interactions for carbon storage. Biochar Environ. Manag. Sci., Technol. Implement. 2015, 2, 455–488. [Google Scholar]
  56. Verheijen, F.; Jeffery, S.; Bastos, A.C.; Van der Velde, M.; Diafas, I. Biochar Application to Soils–A Critical Scientific Review of Effects on Soil Properties; European Commission: Brussels, Belgium, 2010. [Google Scholar]
Figure 1. (a) Scanning electron microscope (SEM) micrographs of wheat straw biochar (WB), (b) peanut shell biochar (PB), and (c) rice hull biochar (SB).
Sustainability 12 01922 g001
Figure 2. Rate of soil CO2 emissions versus time. WS, PS, and RS are used to indicate wheat straw, peanut shell, and rice husk respectively; WB, PB, and RB represent wheat straw biochar, peanut shell biochar, and rice husk biochar respectively; CK is the control, the same below.
Sustainability 12 01922 g002
Figure 3. Analysis of the effect of different treatments on the total amount of CO2 emitted by soil. (a) Comparative analysis of the effects of biochar and their raw materials treatment on total amount of CO2 emitted; (b) Comparison and analysis of the effects of different biochar and different biochar raw material treatments on total amount of CO2 emitted. Error bars represent the standard deviation of the mean, p > 0.05.
Sustainability 12 01922 g003
Figure 4. Principal coordinates analysis of bacterial (a) and fungal (b) communities. The values of axes 1 and 2 are the percentages that can be explained by the corresponding axis.
Sustainability 12 01922 g004aSustainability 12 01922 g004b
Figure 5. Significant differences between groups were analyzed for bacterial (a) and fungal (b) communities. The vertical axis represents the species name at a certain classification level. The column length corresponding to the species indicates the average relative abundance of the species in each sample group, and the different colors indicate different groupings. The rightmost side is the p-value, ** 0.001 < p ≤ 0.01, *** p ≤ 0.001. Phylum level.
Sustainability 12 01922 g005
Figure 6. Difference analysis of total biomass and root activity between tobacco undergoing different treatments. (A-1) Comparison and analysis the effects of biochar and their raw materials treatment on total biomass; (A-2) comparison and analysis of the effects of different biochar treatments on total biomass, and the effects of different biochar raw material treatments on total biomass. (B-1) Comparison the effects of biochar and their raw materials on root vitality; (B-2) comparison and analysis of the effects of different biochar treatments on root vitality, and the effects of different biochar raw material treatments on root vitality. Error bars represent the standard deviation of the mean, p > 0.05.
Sustainability 12 01922 g006
Table 1. Analysis of the constituent elements of biomass, biochar, and tested soil.
SamplepHN %P %K %C %H %C/NH/CMoisture Content (%)Ash (%)Volatile Matter (%)Fixed Carbon (%)Biochar Yield (%)
WS7.670.650.181.2642.585.9265.511.115.282.0342.9311.97-
PS8.021.580.381.3365.185.1141.250.815.0121.3475.9412.67-
RS7.950.970.302.2859.624.8261.461.286.3416.7564.9610.05-
WB9.830.370.975.9474.892.36202.4121.730.495.178.4968.2924.6
PB9.360.761.826.2787.651.72115.3318.460.8110.4515.6496.4832.5
RB8.650.471.3510.5681.271.54172.9128.840.642.3913.9483.0730.7
Soil6.090.050.020.030.680.8511.60.810.45---
Table 2. The CO2 value from consuming electricity and the production of N2 gas for carbonization during the manufacture of biochar.
ProductUnitElectricityN2Total CO2 Emissions
Consumed ElectricityCO2 from Electricity ProductionConsumed N2CO2 from N2 Production
Biochar1 kg0.027 kWh23.22 g15.7 L1.88 g25.02 g
Table 3. Difference analysis of soil physical and chemical properties between different treatments. ρb represents soil bulk density. EC represents soil electrical conductance. Different small and uppercase letters in the same column in the table indicate a significant difference (p < 0.05) and extremely significant (p < 0.01).
ParameterspHpb (g/m3)Water Capacity (%)EC (uS/cm)Temperature (°C)Available Nitrogen (mg/kg)Available Phosphorus (mg/kg)Available Potassium (g/kg)Soil Organic Matter (g/kg)
CK6.15 ± 0.47aB1.34 ± 0.26aA54.32 ± 2.14cC35.97 ± 2.42bC27.55 ± 0.26aA82.95 ± 1.69cD21.91 ± 0.87cC157.49 ± 0.37cC7.54 ± 0.22eE
WS6.2 ± 0.36aAB1.12 ± 0.15aA56.48 ± 2.05cC40.15 ± 1.64aAB27.64 ± 0.39aA141.54 ± 0.24abAB37.21 ± 0.64aA368.59 ± 2.39aA15.55 ± 0.15dD
PS6.25 ± 0.15aAB1.28 ± 0.19aA55.82 ± 1.38cC39.87 ± 1.25aAB27.98 ± 0.84aA144.62 ± 2.31aA37.94 ± 0.59aA277.21 ± 0.57bB17.69 ± 0.09cCD
RS6.19 ± 0.32aAB1.06 ± 0.11abA55.35 ± 0.89cC41.20 ± 2.39aA28.01 ± 1.21aA139.01 ± 075aAB38.45 ± 0.96aA264.61 ± 1.33bB19.97 ± 0.05cC
WB6.44 ± 0.37aA0.82 ± 0.23bb60.89 ± 1.23bB41.65 ± 0.86aA28.45 ± 0.77aA132.59 ± 0.29bC35.21 ± 0.33abB288.61 ± 1.54bB24.18 ± 0.21bB
PB6.48 ± 0.45aA0.98 ± 0.10bAB66.02 ± 1.82aA42.56 ± 0.97aA28.11 ± 0.68aA134.81 ± 0.03bBC35.79 ± 0.08abB276.82 ± 0.21bB32.57 ± 0.29aA
RB6.39 ± 0.28aA0.95 ± 0.09bAB65.28 ± 2.17aA42.11 ± 2.33aA28.95 ± 1.54aA136.59 ± 0.18abB34.88 ± 0.19bB270.52 ± 1.09bB30.09 ± 0.13aA