Abstract
The high economic development in Vietnam contributes much momentum to boost the estate industry in this country. However, competition in this market is also increased. To survive better in this industry, the estate companies in the Vietnam estate industry can apply strategic alliance which, however, depends heavily on forming the right partnership. For this purpose, a hybrid approach combining Grey Theory with Data Envelopment Analysis (DEA) has been proposed in this research to assess and predict the performance of some Vietnamese estate companies, in addition to helping to form the right partnership. For empirical study, 16 companies in the Vietnam estate industry have been selected as Decision Making Units (DMUs). After collecting these DMUs’ historical data in the time period 2012-2017, the grey model GM (1,1) was first used to forecast the performance of these DMUs in 2018-2020. Then, the slacks-based measure (SBM) super efficiency (super SBM) model was used to assess their performance. To initiate partnerships, Becamex Infrastructure Development Joint Stock Company (IJC) has been selected as a target company and it can develop 15 different strategic alliance scenarios. The experimental results show that only some of the scenarios are beneficial. Thus, prudence is a necessity when using strategic alliance.
1. Introduction
Vietnam has achieved high economic development in recent years. The GDP growth of Vietnam hit 7.08% in 2018, which is the highest since 2008. The high economic development has also helped sustain the growth of Vietnam asset market. The solid supply and demand across residential, office, and industrial sectors have paved a solid foundation for the Vietnam estate market, making 2018 being a good year for the real estate market in Vietnam. The prosperous outlook in the Vietnam estate market is expected to continue for many years [1].
The Vietnam real estate outlook 2019 report gives more details about the Vietnam estate market. In terms of apartment, the supply in Q4 2017 increased by 8559 units, which is a 12% quarter-on-quarter increase [1]. In 2018, the apartment supply for the middle class increased while high-end and luxury apartment supply increased slightly. In addition, high-value transactions of merger and acquisition (M&A) in the residential, commercial, and industrial segments also increased, showing that real estate in Vietnam is attractive to foreign investors. In the M&A market, real estate, consumer goods, banking, and finance are main subjects to acquires. Those properties in big cities or new urban areas with high population and resorts and hotels in the city center are popular products to investors [2]. The excess demands and less supplies make more successful deals in the estate market. Specifically, housing, industrial area estate, and resort have attracted Korean and Japanese. This trend is expected to continue in many coming years and the M&A activities are expected to grow [3]. In 2017, the rapid growth in the real estate sector has attracted many investors worldwide [4].
However, one challenge faced by estate companies in Vietnam is increasing competition. For the Vietnam estate companies, how to better survive in the estate industry is an emerging issue. There are different approaches for an estate company to improve its competitiveness, including scaling up its business operation by self-expansion and using the strategy of alliance. In the past, companies, especially those of small sizes, focused on using the approach of self-expansion to achieve economies-of-scale that could offer competitiveness. The use of strategic alliance has been mostly neglected, especially in an emerging estate market. However, compared with self-expansion, the strategy of alliance appears to provide more benefits, such as fast to scale up its operations, lower cost, and complimentary to weak company. The use of strategic alliance appears to be able to gain competitiveness with a relatively lower cost and less time due to a joint effort. For a company that has nearly approached its economies of scale, this strategy becomes more important because of fewer solutions available. However, one essential key to the success of a strategic alliance is the formation of a right partnership that indeed depends on a scientific and systematic approach. Literature shows that almost all of the past researches were dedicated to the assessment of the efficiency for estate companies, and the use of strategic alliance for estate companies to improve competitiveness has been rarely appeared. One possible reason is the lack of a concrete and systemic approach to assist estate companies to implement the strategy of alliance. As the competition in the Vietnam estate market becomes increasingly fierce, such an approach has become important for estate companies to gain competitive advantage and survive better in this industry.
Literature also shows that various approaches have been proposed to assess the operational efficiency of real estate companies, such as the translog cost function [5], traditional Data Envelopment Analysis (DEA) [6,7,8], super-slacks-based measure (SBM) DEA [8], and stochastic frontier models [9]. However, each of these tools alone cannot help the implementation of a strategic alliance on a reasonable basis as they are mainly used to assess the past performance of a company. For a strategic alliance, the partnership based on future performance is more meaningful. Thus, the combination with a forecast model is reasonable and necessary. Thus, in this research, a hybrid approach combining Data Envelopment Analysis (DEA) with grey forecast is used. In addition, a concrete and systematic approach is proposed to facilitate the implementation of the strategy of alliance.
For empirical study, 16 companies in the Vietnam estate industry were selected as Decision Making Units (DMUs). Having determined the input and output variables, the historical data of these DMUs in the time period 2013–2017 were collected. Then, the GM(1,1) was employed to predict their future performance (data) in the time period 2018–2019. Then, the super-SBM DEA was used to evaluate the past, current, and future performance for these DMUs. For strategic alliance, one of the DMUs, Becamex Infrastructure Development Joint Stock Company (IJC), was selected as the target company to illustrate the formation of right partnerships from 5 available scenarios for a strategic alliance. The results showed that the company Kinh Bac City Development Share Holding Corporation (KBC) is the best partner for the company IJC. In addition, it is found that not all partnerships are beneficial for the allied members, suggesting that prudence is still required when using the strategy of alliance.
The rest of this paper is organized as follows. Section 2 includes a literature review, including some definitions of strategic alliance, DEA, and grey systems theory, and definition of mean absolute percentage error (MAPE). Section 3 introduces the methodology. Section 4 includes an empirical study and an analysis of results. Section 5 gives a conclusion and suggests future research direction.
2. Background and Literature Review
2.1. Strategic Alliance
Some scholars have defined the meaning of strategic alliance. Das and Teng [9] defined strategic alliance as “brings together otherwise independent firms to share resources in product design, production, marketing, or distribution.” This simply means that strategic alliance is sometimes just regarded as a “partnership” that offers businesses a chance to join efforts for a mutually beneficial opportunity and sustained competitive advantage. Zikmund et al. [10] considered key coalition as “lasting helpful assertion between the organizations, including the inflow and connecting of assets, and its agreeable object is completing their organization missions in key coalition.” Though with different statements, these authors share the common view of benefits for allied members with partnership. The joint effort can offer a better achievement for all allied members.
In this research, the strategic alliance is defined as “collaboration among independent companies to achieve higher business objectives or business results.” Common objectives of the strategic alliance include expanding market channels, increasing production capacity, or improving a company’s operational efficiency, etc. These benefits have attracted the uses of strategic alliance in many different areas. However, a scientific and systematic approach is definitely necessary for the evaluation of the performance of enterprises and forming the right partnership.
2.2. Data Envelopment Analysis (DEA)
In 1957, Farrell [11] proposed a concept for efficiency evaluation using multiple inputs and one single output. Based on that, Charnes et al. [12] proposed a mathematical model with linear combination to convert accumulated statistics into practical inputs and outputs. Being a data-oriented model, this approach can be used to evaluate peer entities, which are especially termed as Decision Making Units (DMUs). A DMU can be a bank, manager, or a shipping company, etc., which converts multiple inputs to multiple outputs. The measurements resulted from the DEA approach are relative efficiency scores of these selected DMUs and their values are within the interval [0, 1].
The DEA has been recognized as a useful tool for performance measurement. It has been widely used by economists and politicians in both private and public sectors [13]. For example, Färe et al. [14] used an input-based Malmquist productivity index, which is a non-parametric (linear programming) method, to assess Swedish pharmacies in the time period 1980–1989. In Färe et al. [15], the authors used DEA to assess 17 OECD countries in 1979-1988. This study found that productivity growth in the U.S. was slightly above average while Japan had the highest performance due to better technical efficiency.
The common advantages for the DEA include:
- Multiple outputs and inputs, each being stated in different units, may be included simultaneously to produce a single measure.
- A priori weights are not required for outputs or inputs.
- Specific output increases, input reductions, or both needed to achieve efficiency are provided.
- DEA focuses on the achievable best performance.
2.3. Grey Systems Theory
Grey System Theory was proposed by Deng in 1982 [16]. This theory aims to extract realistic governing laws of the system based on available data, which is a process known as “generation of grey sequence.” This theory is logical and reliable and has been widely used in various application domains [17,18,19]. The relational analysis of this theory has been used in decision-making process in various industries. For example, Wu et al. [20] used this theory to develop clustering algorithms. This theory can be used to acquire bioinformatics information, sales statistics, and marketing performance measure. In short, this theory is very useful and demonstrates many benefits for industries and few drawbacks regarding data input and output.
Grey model, which is one of the tools of Grey System Theory, can be used for forecasting. However, there are different types of grey models. In this research, the type of GM(1,1) is used. The GM(1,1) is further detailed in Section 3.2.
2.4. Relevant Studies
Some past studies were devoted to investigating the operational efficiency of Real Estate Investment Trusts (REITs). Bers and Springer [5] used the translog cost function to estimate economies of scale for some REITs in the time period 1992–1994. They found that economies of scale exist for REITs can be affected by characteristics such as type of management and degree of leverage. Using the DEA approach, Anderson et al. [6] estimated economies of scale and inefficiency for REITs based on their historical data in 1992–1996. They found poor input utilization and failure to operate at a constant returns-to-scale as two factors of technical inefficiency for the REITs, which suggests that company expansion can improve the technical inefficiency of these REITs. Using the stochastic frontier models and panel data, Miller and Springer [21] estimated the operational efficiencies of REITs. This model was able to identify frontier cost improvements, returns to scale, and cost inefficiencies over time. However, this model normally focuses on single input and not capable of dealing with multiple outputs at a time. Although these researches have addressed operational efficiency of REITs, there is still a lack of systematic analysis for the listed real estate companies.
Using the style analysis approach, Chau et al. [22] analyzed the returns of 12 listed property companies and one property company in Hong Kong. They found that indirect and direct real estate are becoming closer substitutes for each other. Moreover, the investment style, which is mainly characterized by the implied portfolio instead of management skills, can affect the results for property company considerably. Hui et al. [23] investigated the performance of some Hong Kong property companies in terms of economic value added (EVA). Those companies diversified into other sectors were found to have a better result than that only focus on the real estate sector. From an EVA perspective, they concluded that the property companies in Singapore and Hong Kong have not performed well. However, this does not necessarily mean that they are poorly managed. The empirical results show that the performance of a company is influenced dramatically by profits generated from the sale of non-property assets. Using the DEA approach, Wang and Wang [7] analyzed 20 Listed Real Estate Companies (LRECs) in China in the time period 2000-2007. They found that control policies can affect the real estate industry greatly. However, that study cannot identify those companies with extreme efficiency. In addition, that study only covers some but not all well-known LRECs in China, which might lead to incomplete and somehow biased analysis because the reputation and scale of a company do not necessarily mean a higher level of operational efficiency. Chau et al. [24] investigated the linkage between direct and indirect real estate in terms of corporate governance structures. Compared with the companies in Hong Kong, they found that the China-listed property companies had a weaker linkage between direct and indirect real estate. Using the three types of DEA models, CCR-DEA, BCC-DEA, and Super-Efficiency DEA, Zhen et al. [8] measured the performance and efficiency of the 94 LRECs in China stock markets based on their 2009 Annual Financial Statements. In that study, Registered Capital, Asset Value, Employee Number, and Operation Cost are used as input factors, while Revenue and Profit were used as output factors. In addition, an integrated assessment system was applied and generated a performance ranking for these LRECs. In that study, information such as Overall Efficiency (OE), Pure Technical Efficiency (PTE), and Scale Efficiency (SE) of the LRECs were derived. They found 69% of the inefficient LRECs are classified as increasing returns to scale and could further increase operating efficiency by scale expansion. Finally, they found that the inefficient LRECs have an employee slack prevalent at 18.96%. Bello et al. [25] conducted a study measuring the contribution of real estate to GDP in Nigeria. A total of 44 of the 108 industries in the industrial town of Ota in Nigeria were randomly sampled. Then, data between 2008 and 2012 were collected and analyzed using descriptive statistics. This result provides guidance for industrial investors to measure past achievements and provide a basis for planning and control decisions. The results showed that at an aggregate level, industrial properties in Ota, Nigeria contributed 19% performance to the manufacturing success of industrial establishments.
3. Methodology
3.1. Research Procedure
This research uses a procedure with 9 steps. Each of the steps is detailed as follows.
Step 1: Data collection.
The data of DMUs were collected from the General Statistics Office of Vietnam, and some financial reports were collected from VietStock and CafeF, which are two famous stock markets in Vietnam. In this research, one DMU was selected and is defined as a target company that is a basic company that selects other companies as partners for a strategic alliance.
Step 2: Selection of input/output variables.
Inputs and outputs are main impact factors used by DEA model to measure the relative efficiency of a DMU to other DMUs.
Step 3: Forecasting.
Grey Prediction is to forecast the results of enterprises based on historical data. In this research, the GM(1,1) was used for forecasting.
Step 4: Forecast accuracy analysis.
The error in prediction is unavoidable. Therefore, the MAPE (Mean outright percent blunder) was used to gauge the exactness esteems in measurements. The smaller the MAPE indicates the higher prediction accuracy. In case of high forecasting error, it needs to reselect the information sources. Mean absolute percentage error (MAPE):
Mean absolute percentage error (MAPE) is a measurement that can be used to measure the accuracy between the actual and forecasting data. The smaller the MAPE, the higher the forecasting accuracy is. Equation (1) shows the formula for calculating the MAPE
where the Actualt are Forecastt observations at the time period t and n is the total number of observations. Lewis [26] defined the four classes of reliability for MAPE to help understand the level of reliability of the forecasted data (see Table 1).

Table 1.
Accuracy classes of MAPE.
Step 5: Selection of DEA model.
In this step, the Super-SBM-I-V was used to measure the efficiency of different DMUs.
Step 6: Pearson correlation analysis.
DEA was used for incompetency estimation for DMUs by developing a comparative effectiveness score through the change of the multiple foundation data into a ratio of a single virtual output to a single virtual input. Subsequently, correlation testing for collected input and output is quite important. In this research, the Pearson Correlation Coefficient Test was used to check the suitability of selected input and output variables.
Step 7: Analysis before strategic alliance.
This step aimed to select one target company and understand its performance before applying strategic alliance with allied members. This helped to understand the performance of the target company after applying the strategic alliance in the next step.
Step 8: Analysis after strategic alliance.
This step aimed to analyze the performances of various alliances available for the target company selected in the previous step. From the results available from different strategies of alliance, we can identify the best one for a selected target company. The performance of each strategic alliance can be estimated by using the supper-SBM-I-V model.
Step 9: Summary.
This step aimed to summarize a suggestion, based on the previous step. Basically, the strategic alliance should result in positive results that can benefit all allied members.
3.2. The Grey Forecasting Model GM(1,1)
The grey model GM(1,1) associates with time series and includes some differential equations that have structure varying with time. It has been widely used for forecasting. One advantage of the GM(1,1) is computational efficiency, another advantage is that only a few series of data are required. Basically, at least 4 consecutive data with equal time intervals are required for the GM(1,1) to obtain a reasonably accurate prediction. Figure 1 shows the procedure of Grey prediction.
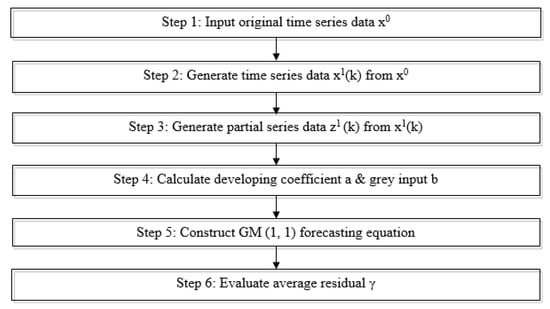
Figure 1.
The procedure of grey prediction using GM(1,1).
The procedure of grey prediction using GM(1,1) is detailed as follows. Given the variable primitive series as Equation (2), the construction of the GM(1,1) model is detailed as follows.
where is a non-negative sequence and is the total number of data observations.
The Accumulating Generation Operator (AGO) is one of the most important characteristics of grey theory, which can be used to eliminate uncertainty of these primitive data and smooth randomness. The AGO is defined in Equation (3).
where X(1)(1) = X(0)(1), = , and k = 1, 2, …, n.
The is defined in Equation (4).
where Z(1) (k) is the mean value of adjacent data defined in Equation (5)
Based on the , a GM(1,1) model that corresponds to the first order different equation can be constructed by the Equation (6).
where parameters and are called developing coefficient and grey input, respectively.
In practice, parameter and grey input are not calculated directly from Equation (6). Instead, the solution of the above equation is obtained using the least square method, i.e., Equation (7).
where denotes the prediction X at time point k + 1 and the coefficients can be obtained by the Ordinary Least Squares (OLS) method as defined in Equations (8), (9), and (10).
and
where Y is called data series, B is called data matrix, and is called parameter series.
We obtained (k) as follows. Let be the fitted and predicted series.
where
Applying the inverse accumulated generation operation (IAGO), i.e., Equation (11).
3.3. Non-Radial Super Efficiency Model (Super-SBM)
In this study, the non-radial Slack-based measure of super-efficiency (super SBM) of DEA is used. This model was introduced by Tone in 2001 [27].
In the super SBM model, given n DMUs with the input and output matrices X = and Y = , respectively. Let be a non-negative vector in . The vectors and indicate the input excess and output shortfall, respectively. This model provides a constant return to scale. It is defined in Equation (12) that subjects to Equation (13) [27].
The variables S+ and S− measure the distance of inputs Xλ and outputs Yλ of a virtual unit from those of the unit evaluated. The numerator and the denominator in the objective function measure the average distance of inputs and outputs, respectively, from the efficiency threshold.
Let an optimal solution for SBM be (). A DMU ( is SBM-efficient, if . This condition is equivalent to and , no input excesses and no output shortfalls in any optimal solution. The SBM model is non-radial and deals with input/output slacks directly. The SBM returns and efficiency measure is between 0 and 1.
The best performers have the full efficient status denoted by unity. The super SBM model is based on the SBM model. Tone (2001) [27] discriminated these efficient DMUs and ranked the efficient DMUs by super-SBM model. Assuming that the DMU is SBM-efficient, , super-SBM model is defined in Equation (14) and subject to Equation (15).
The input-oriented super SBM model is derived from Equation (14) with the denominator set to 1. The super SBM model returns a value of the objective function that is greater or equal to 1. The higher the value, the more efficient the unit is.
3.4. Company Selection
In this research, 20 household recorded land organizations with the most noteworthy market capitalization were initially targeted as DMUs due to their significance in the real estate industry in Vietnam.
However, four of these companies, including C.E.O Group Joint Stock Company, LDG Investment Joint Stock Company, NoVa Land Investment Group Corporation, and Vincom Retail Joint Stock Company, were excluded due to the unavailability of their historical data. As a result, only 16 of 20 companies were included and listed in Table 2.
Table 2.
List of 16 real estate companies and their capitals, unit: VND (millions).
3.5. Input and Output Variables Selection
The input and output variables selected for evaluating DMUs are important. These selected variables should be able to reveal the performance of DMUs. In this research, some past researches in the real estate area were referred in order to find suitable variables as inputs and outputs. Table 3 shows the summary of input and output variables used in some past research for the assessment of DMUs.
Table 3.
Summary of input and output variables used in previous studies.
In this research, charter capital, asset value, selling expense, and general and administrative expenses are selected as input variables, while revenue from sales of goods and services and profit before Tax (PBT) are selected as output variables. These variables are further detailed as follows:
- Charter capital (I): is capital stated in company’s charter as a reflection of its business scale to investors. Capital includes both tangible assets, such as factories or manufacturing facilities, and financial value of the firm’s intangible assets.
- Asset Value (I): this is the total asset value the enterprise owns, which is an internal resource that can be used to create benefits in the future.
- Selling Expense (I): this refers to costs occurred when selling products, both directly and indirectly. Direct expenses include costs for delivery or sales commissions. Indirect expenses can be put as expenditure spent to earn sales. Some typical categories of indirect expense are budget for marketing and salaries of sales and marketing staff.
- General and Administrative Expense (I): this refers to costs a firm needs for daily operation and business administration. These expenses are incurred regardless of no production or sales occur. This means companies with centralized management have a tendency to have higher G&A expense.
- Revenue from Sales of Goods and Services (O): this is an output variable about the revenue firms generated from selling their products and services. The term is also referred as Operating revenue because the revenue is generated from the company’s daily business operation.
- Profit before tax (PBT) (O): this is an output variable that refers to a company’s profit before subjected to corporate income tax, with all expenses generated from revenue deducted, including interest expenses and operating expenses.
Table 4 shows the data of these input and output variables collected from the Vietstock Website [34].
Table 4.
Collected Data of all Decision Making Units (DMUs) in 2013.
4. Empirical Results and Discussion
4.1. Data Processing
Table 5 shows the collected data of Chartered Capital for the company TDH (DMU16) in the time period 2013–2017 (Source: Vietstock [34]).
Table 5.
Collected data for the TDH (DMU16) (2013-2017).
Based on Table 5, the forecast data of CCL for the company TDH in the year of 2018 by using GM(1,1) are derived and illustrated as follows. The primitive series of data is as follows.
Using the AGO, we can derive the accumulated values as follows.
Each of the data is derives as follows.
The accompanying mean means can be then derived as follows.
Substitute the crude arrangement esteems to Gray differential conditions, we can derive the following equations.
Linear equation is rewritten in matrix form as follows:
Least square method is then applied to find a and b
Apply a and b determined an incentive to the differential condition to create the brightening condition
Prediction model is as the formula.
By substituting different values of k into the equation, we can derive the forecast data in 2018 as shown in Table 6.
Table 6.
Forecast data of Chartered Capital for the company TDH (DMU16) in 2018.
All DMUs information sources and yields information in the period 2018–2021 can be determined by utilizing the above computational process. A case of conjecture layout can be seen beneath and all the forecasted results are shown in the Appendix as references.
Table 7 shows the forecast data for all the input/output variables in the year of 2018, and the forecast data of the years from 2019 to 2021 are listed in Table A1, Table A2, and Table A3 in Appendix, respectively. However, due to space limitations, we only illustrate the computational process by using the data of the year 2018.
Table 7.
Forecast data of all DMUs in the year 2018.
In this paper, Mean Absolute Percent Error (MAPE) defined in Equation (1) is used to assess the accuracy of forecasting data. Table 8 shows the MAPE results of the DMUs.
Table 8.
MAPE Results of all DMUs based on forecast data in 2018.
Some of the 16 DMUs are found with an average MAPE greater than 20%, due to remarkable changes in their business data in recent years. The change in the estate market in 2013–2017 is found big. Real estate prices have been rising robustly in recent years, propelled by Vietnam’s recovery from the housing bust of 2009–2013 and by a booming economy. For example, in Q4 of 2017, the primary market apartment prices in Ho Chi Minh City (HCMH) went up by 3.6%, according to Jones Lang LaSalle. Secondary market apartment prices witness an increase of 0.5% yearly during the same period. The average asking price of HCMC villas and townhouses rose by 13.6% in Q4 of 2017. In the secondary market, asking prices of villas and townhouses went up by 4.5% annually, rose by 44% in Q4 of 2017. Villas and townhouse sales in HCMC increased by 25% both from the previous quarter and from the same quarter last year, according to Savills World Research. In Hanoi, apartment prices fell during the year to Q4 of 2017. Primary market apartment prices fell by 2.5% during the year to Q4 of 2017, according to Jones Lang LaSalle. Secondary market apartment prices fell by 6.6%. The continuous growth of supply in Hanoi, as well as a shift in buyer interest to mid-end and affordable segments, in part, might have contributed to the softening of property prices in the capital [31]. With the exception of these companies, the average MAPE of all DMUs is around 11% that is acceptable for this research.
4.2. Pearson Correlation Analysis for Input and Output Data
One prerequisite of the input and output data for the DEA is the existence of isotonicity relationship among them, which means more input will lead to more output, or at least the same level of output, under the same operation condition. To check the isotonic relationship, Pearson correlation coefficients are used in this research. Table 9 shows the degree of correlation between two variables.
Table 9.
Degree of correlation.
A correlation coefficient > 0.8 means a very high correlation between two variables, a correlation coefficient between 0.6–0.8 means a high correlation, a correlation coefficient between 0.4–0.6 means a medium correlation, a correlation coefficient between 0.2–0.4 means a low correlation, and a correlation coefficient < 0.2 means a very low correlation.
Table 10 shows the results of Pearson correlation coefficients obtained from the year 2013 to 2017.
Table 10.
Pearson correlation coefficients of inputs and outputs in 2013–2017.
Table 11 shows the results of Pearson correlation coefficients obtained from the year 2018 to 2020.
Table 11.
Pearson correlation coefficients of inputs and outputs (forecasted for 2018–2020).
These Pearson correlation coefficients show solid isotonic relationships between the input and output variable in each year, which indicates the suitability of these input and output variables used in this research.
4.3. Performance Analysis before Strategic Alliance
In this section, the Becamex Infrastructure Development Joint Stock Company (IJC) is selected as the target company that is supposed to form a partnership with other companies in the Vietnam estate industry. The IJC is an estate company established in 2007 in Vietnam. This company owns capital about VND 2,741,945,250,000 and focuses on investing assets of transport infrastructure, real estate, and service business, etc.
The software Super-SBM-I-V was used to obtain the efficiency scores DMUs before applying strategic alliance. Table 12 shows the ranking and efficiency scores of the 16 DMUs in the year 2017 (before applying strategic alliance).
Table 12.
Efficiency scores and rankings of the DMUs in 2017 (before strategic alliance).
Table 12 shows that in the year 2017 the company ITA performed the best with the efficiency score (9.0987132), while the IJC performed poorly due to being ranked to 12. For further investigation, we run the software again to understand the rankings of these DMUs in the time period 2013–2016. Table 12 shows the rank (R) and score (S) of each DMU (D).
Table 13 shows that about half of the DMUs perform efficiently as their efficiency scores are greater than 1, implying they are efficient in the time period 2013–2016.
Table 13.
The efficiency scores and rankings of 16 DMUs from in the time period 2013–2016.
As the company (IJC) once again shows a poor ranking number, which implies that this company requires a change on its current status, thus in this research the IJC was selected as the “target company” to investigate opportunities (partnerships) to change its current status and improve its efficiency.
4.4. Performance Analysis after Strategic Alliance
As a target company, the IJC is used to combine with other DMUs to form a different partnership for strategic alliance. A total of 31 scenarios (16 of them are individual DMUs and 15 of them are combinations of the IJC with other DMUs) are initiated for comparison. Table 14 shows the efficiency scores and rankings derived for these scenarios, after applying a strategic alliance based on the data in 2017.
Table 14.
Rankings and efficiency scores of different strategic alliance scenarios in 2017.
These scenarios of strategic alliance can be separated into two groups: Good alliance partnership and Bad alliance partnership. For the IJC, the Good alliance partnership includes the alliances with the following companies: KBC, DXG, FLC, KDH, KLC, and NLG. Especially, the alliance with the KBC company is the best partner for IJC as this alliance can improve the ranking of the IJC from 21 to 6. The bad partnerships include the alliances with SJC, NBB, TDH, QCG, PDR, HDG, SCR, DIG, and ITA as these alliances recess the efficiency for the IJC.
For further investigation, we have run the software to understand the performance of different scenarios of strategic alliance in the future time period from 2018 to 2020. Table 15 shows the efficiency scores and rankings of different scenarios in the year 2018.
Table 15.
Rankings and efficiency scores of different strategic alliance scenarios in 2018.
Table 15 shows that for the IJC company the alliances with companies KDH, DXG, KBC, NLG, and FLC can lead to good partnerships. Especially, this result ensures again that, for the IJC company, the alliance with the KBC can achieve the best result. Table 16 shows the results of these scenarios in the year 2019.
Table 16.
Rankings and efficiency scores of different strategic alliance scenarios in 2019.
Table 16 once again shows that for the IJC company good partners include companies KBC, TDH, KDH, DXG, NLG, and FLC due to improved efficiency from these partnerships. The company KBC once again is the best partner for the IJC company. In fact, this alliance can benefit both allied companies. The partnerships IJC+TDH, IJC+KDH, and IJC+DXG are found beneficial for the IJC company as these strategic alliances can improve its efficiency and ranking. Table 17 shows the efficiency scores of different scenarios in the year 2020.
Table 17.
Rankings and efficiency scores of different strategic alliance scenarios in 2020.
Table 17 shows that KBC, TDH, KDH, NLG, and FLC are good partners for the IJC company in 2020 due to improved efficiency. Again, the company KBC is the best partner for the IJC company and both companies can benefit from this alliance.
4.5. Discussion
- (1)
- From Table 14, Table 15 and Table 16, we know that for the IJC the company KBC is not the best partner in the year 2018, but the KBC becomes the best partner in the years of 2019 and 2020. This indicates that the KBC is a good long-term partner for the IJC. In 2020, the strategic alliance of IJC+KBC can benefit both companies as the efficiency score of this alliance is 1.88931 that is better than the individual efficiency scores 0.56375 and 1.46558 for the IJC and KBC, respectively.
- (2)
- From Table 16, we know that for the IJC the company TDH is the 2nd best partner in the year 2020 as the efficiency of the IJC can be improved from 0.56375 to 1.60734. However, the individual efficiency of the TDH this year is 4.19987 that is much higher than that of the alliance with the IJC. Consequently, the TDH is expected to be reluctant to an alley with the IJC.
- (3)
- Reference [8] is one rare research that has employed the super-SBM DEA model to assess the performance of real estate companies in China. One merit of the super-SBM DEA model is that it can better discern companies at the frontier. In this present research, we have employed this kind of model to assess the performance of estate companies in Vietnam. To our best knowledge, this is the first paper employing this kind of model to assess the real estate companies in Vietnam. In addition, in this present research, the super-SBM DEA has combined with the grey model GM(1,1) as a hybrid approach to assess the forecast performance for the estate companies. In Reference [8], it only includes the super-SBM DEA model. This present research is one step forward to better utilize this model for an advanced purpose.
- (4)
- The approaches proposed in past researches, such as the translog cost function [5], traditional DEA [6,7,8], super-SBM DEA [8], and stochastic frontier models [9], have been only focused on evaluating companies in terms of past performance. They have not been promoted to support the implementation of a strategic alliance based on more reasonable data.
- (5)
- This hybrid approach is a systemic methodology as it can implement the strategic alliance step by step. Not only for the real estate industry but this approach can also be applied to other industries to extend its applications and impacts.
- (6)
- This research focused on a new emerging real estate market in Vietnam. No such assessment has been performed in this market. Therefore, this research has its specific application domain.
- (7)
- In this research, we focus on using the strategic alliance to improve efficiency for companies or the competitiveness for companies. Essentially, this strategy can be regarded as a fast way to scale up the operation of a company at a fast speed. In Reference [6], the authors found that economies of scale of a company may improve the company’s technical efficiency. We consider the strategic alliance is one fast approach to achieve the economies of scale for a company and at a lower cost.
- (8)
- The real estate industry in Vietnam is still at an early stage and has much potential to be further developed. In this research, we have identified and quantified the input factors that affect the efficiency of real estate companies in Vietnam. This essentially helps individual companies improve their input efficiency and enhance their chance of survival in the current competitive environment.
- (9)
- In Reference [23], the authors found that those estate companies diversified into other sectors had a better result than that only focus on the real estate sector. Therefore, the strategic alliance with companies in a different industry, i.e., horizontal strategic alliance, can be a future research direction.
5. Conclusions
Along with high economic development, the real estate industry in Vietnam grew very fast in recent years. However, this also introduces fierce competition into this industry. Advanced management becomes increasingly essential for Vietnam estate companies to gain competitiveness and survive. To achieve this, a strategic alliance is one applicable approach. For a strategic alliance, a concrete and systematic approach is necessary.
In this research, we have proposed concrete and systematic procedure implementing strategic alliance. A hybrid approach combining GM(1,1) with super-SBM DEA model has been used to forecast and assess the past, current, and future performance. In addition, the bad and right partnerships have been identified, from which a target company can find the right partner for a strategic alliance. For empirical study, 16 estate companies have been selected from the estate industry in Vietnam as DMUs. Furthermore, 4 inputs and 2 outputs have been used as variables and the data of these DMUs in 2012–2017 were collected. The Pearson correlation test confirms the isotonic relationships of these variables. Then, the GM(1,1) forecasts the future performance of these DMUs in 2018–2020. The MAPE shows acceptable accuracy of the forecasting data. Then, the Super-SBM model assesses the performance of these DMUs and gives a “past-current-future” view from 2012 to 2020.
The IJC company is selected as the target company applying the strategic alliance. This initiates 15 possible partnerships for the IJC company. With the efficiency scores, it is concluded that the partnership IJC+KBS is the best as it improves both companies. In addition, the results also show that only some of the scenarios beneficial, implying that prudence is still required when applying the strategic alliance. A right partnership is a key to the success of a strategic alliance. The contributions of this research are summarized as follows:
- (1)
- This research proposes a hybrid approach combining GM(1,1) and super-SBM DEA models for assessing business performances of DMUs.
- (2)
- This research conducts an assessment of the real estate companies in Vietnam, giving a “past-present-future” insight view for these companies. In addition to understanding their past performances, these companies can predict their future performances. Such information facilitates companies to initiate a strategic alliance based on a reasonable basis. The formation of a good partnership enables companies to improve their performances and gain competitive advantage. A concrete procedure for forming the right partnership has been provided.
- (3)
- Though there are some past studies devoting to the assessment of the real estate companies, there is still a lack of concrete and systemic approaches for them to implement the strategic alliance. This research provides a concrete and systemic approach.
- (4)
- The approach proposed in this research can be applied to other areas to extend its impacts on different industries.
Though with some research results, still the following directions can be focused to advance the current research. First, only some of the estate companies in Vietnam have been included in this research due to the limitations of research resources and data availability. Thus, including more Vietnam estate companies to give a whole picture in the Vietnam estate industry can be focused. Second, only some specific input and output variables have been selected and used in this research. The use of other input and output variables may provide another view to better understand these companies. Third, comparing the domestic Vietnam estate companies with worldwide estate companies can understand the performance of these Vietnam estate companies on a global basis. Forth, the extension to horizontal strategic alliance can be a future research direction. Finally, the comparison to other approaches can be performed in future research.
Author Contributions
Conceptualization, C.-N.W.; methodology, C.-N.W.; software, T.-P.N.; validation, Y.-C.K.; formal analysis, H.-P.H; investigation, J.-W.W.; resources, C.-N.W.; data curation, T.-P.N.; writing—original draft preparation, T.-P.N.; writing—review and editing, H.-P.H.; visualization, Y.-C.K. and J.-W.W.; supervision, C.-N.W.; project administration, C.-N.W. and H.-P.H. All authors have read and agreed to the published version of the manuscript.
Funding
This research was supported by National Kaohsiung University of Science and Technology, and Taiwan Ministry of Sciences and Technology with project number 108-2622-E-992-017-CC3.
Conflicts of Interest
The authors declare no conflict of interest.
Appendix A
Table A1.
Forecast data of all DMUs in the year 2019.
Table A1.
Forecast data of all DMUs in the year 2019.
| DMU | CCL | AVE | SCT | CCT | NRE | PBX |
|---|---|---|---|---|---|---|
| VIC | 1,785,824,801 | 5,639,183,301 | 1,129,298,741 | 587,962,672 | 8,579,411,754 | 637,655,287 |
| KDH | 300,756,116 | 707,152,175 | 11,519,287 | 12,359,034 | 365,125,860 | 85,286,043 |
| DXG | 262,960,690 | 1,150,432,970 | 31,396,613 | 21,465,711 | 312,707,011 | 147,185,175 |
| PDR | 131,452,426 | 605,671,574 | 29,024,667 | 4,661,415 | 142,744,858 | 29,713,789 |
| KBC | 134,217,728 | 776,806,396 | 1,326,227 | 10,450,574 | 78,592,870 | 59,760,132 |
| DIG | 122,428,371 | 307,160,975 | 4,819,607 | 5,541,173 | 30,314,834 | 6,807,286 |
| NLG | 79,651,398 | 538,886,181 | 19,154,046 | 10,708,227 | 321,491,963 | 125,502,025 |
| FLC | 33,882,539 | 2,368,850,377 | 87,043,762 | 52,414,692 | 1,180,935,014 | 43,178,333 |
| HDG | 37,909,160 | 880,757,727 | 99,801,293 | 9,305,505 | 134,315,106 | 20,178,916 |
| QCG | 180,224,327 | 658,730,869 | 3,334,217 | 1,263,982 | 77,612,946 | 2,818,614,571 |
| SCR | 22,813,636 | 640,505,060 | 9,006,319 | 5,462,101 | 117,698,441 | 24,479,244 |
| SJS | 67,108,864 | 300,820,435 | 565,002 | 364,508 | 3,314,351 | 8,402,933 |
| ITA | 501,492,719 | 595,717,069 | 165,455 | 18,357,738 | 30,671,722 | 621,512 |
| NBB | 56,316,608 | 314,621,745 | 12,713,448 | 964,243 | 7,088,719,583 | 4,146,543 |
| IJC | 60,321,042 | 431,513,818 | 1,375,115 | 4,721,478 | 66,004,093 | 6,261,162 |
| TDH | 62,698,549 | 141,866,411 | 153,169 | 6,300,028 | 162,468,309 | 16,755,738 |
Table A2.
Forecast data of all DMUs in the year 2020.
Table A2.
Forecast data of all DMUs in the year 2020.
| DMU | CCL | AVE | SCT | CCT | NRE | PBX |
|---|---|---|---|---|---|---|
| VIC | 2,163,475,404 | 20,021,070,825 | 1,875,732,799 | 814,000,000 | 13,128,805,639 | 855,288,367 |
| KDH | 441,822,057 | 895,055,225 | 15,555,269 | 17,405,342 | 540,294,242 | 133,903,909 |
| DXG | 417,822,906 | 1,948,019,542 | 47,532,152 | 30,585,094 | 470,972,288 | 238,189,126 |
| PDR | 150,859,870 | 709,790,543 | 64,878,013 | 6,385,828 | 209,540,071 | 41,647,286 |
| KBC | 134,217,728 | 828,804,384 | 1,373,788 | 13,140,988 | 84,018,172 | 72,778,097 |
| DIG | 132,545,254 | 329,931,631 | 5,361,271 | 6,375,676 | 182,330,272 | 14,561,181 |
| NLG | 86,031,520 | 678,202,420 | 26,567,147 | 12,204,566 | 484,436,397 | 232,739,221 |
| FLC | 522,691,039 | 3,593,112,208 | 184,913,473 | 81,073,109 | 1,887,334,092 | 44,840,630 |
| HDG | 40,302,889 | 1,349,231,286 | 233,866,490 | 12,003,748 | 156,837,833 | 24,160,744 |
| QCG | 211,750,012 | 778,860,142 | 4,997,294 | 1,515,665 | 96,779,609 | 11,696,013,275 |
| SCR | 136,752,747 | 806,990,421 | 13,694,426 | 5,656,005 | 223,763,486 | 33,927,021 |
| SJS | 33,554,432 | 315,714,962 | 780,973 | 207,084 | 1,889,630 | 8,075,908 |
| ITA | 546,400,205 | 609,612,087 | 187,854 | 32,124,280 | 33,900,977 | 380,558 |
| NBB | 68,340,547 | 370,470,028 | 41,481,724 | 986,805 | 24,772,422,757 | 4,852,229 |
| IJC | 51,777,401 | 462,599,279 | 1,312,468 | 6,539,155 | 71,340,075 | 5,695,868 |
| TDH | 82,557,542 | 150,490,654 | 122,847 | 7,250,229 | 240,204,112 | 25,635,517 |
Table A3.
Forecast data of all DMUs in the year 2021.
Table A3.
Forecast data of all DMUs in the year 2021.
| DMU | CCL | AVE | SCT | CCT | NRE | PBX |
|---|---|---|---|---|---|---|
| VIC | 2,620,988,253 | 25,630,703,936 | 3,115,538,346 | 1,126,931,021 | 20,090,600,898 | 1,147,200,071 |
| KDH | 649,053,236 | 1,132,887,495 | 21,005,328 | 24,512,103 | 799,499,296 | 210,236,706 |
| DXG | 663,886,227 | 3,298,566,916 | 71,960,163 | 43,578,708 | 709,337,777 | 385,460,423 |
| PDR | 173,132,600 | 831,808,255 | 145,019,981 | 8,748,158 | 307,591,055 | 58,373,453 |
| KBC | 268,435,456 | 884,283,021 | 1,423,054 | 16,524,028 | 89,817,985 | 88,631,855 |
| DIG | 143,498,146 | 354,390,335 | 5,963,810 | 7,335,857 | 255,107,780 | 31,147,214 |
| NLG | 92,922,694 | 853,535,570 | 36,849,305 | 13,910,000 | 729,967,306 | 431,606,938 |
| FLC | 629,677,154 | 5,450,093,202 | 392,825,307 | 125,400,890 | 3,016,279,416 | 46,566,922 |
| HDG | 42,847,767 | 2,066,885,146 | 548,024,314 | 15,484,379 | 183,137,300 | 28,928,291 |
| QCG | 248,790,319 | 920,896,755 | 7,489,899 | 1,817,463 | 120,679,516 | 48,533,321,274 |
| SCR | 152,273,920 | 1,016,750,031 | 20,822,858 | 5,856,792 | 425,410,032 | 47,021,172 |
| SJS | 33,554,432 | 331,346,962 | 1,079,498 | 117,648 | 1,077,345 | 7,761,610 |
| ITA | 595,329,051 | 623,831,204 | 213,285 | 56,214,408 | 37,470,221 | 233,020 |
| NBB | 82,931,671 | 436,231,900 | 135,347,500 | 1,009,895 | 86,570,349,136 | 5,678,013 |
| IJC | 44,443,849 | 495,924,079 | 1,252,674 | 9,056,602 | 77,107,434 | 5,181,613 |
| TDH | 108,706,627 | 159,639,176 | 98,527 | 8,343,744 | 355,133,969 | 39,221,175 |
References
- CB Richard Ellis Group (CRRE). Real Estate Market Outlook Vietnam 2019. 2019. Available online: http://www.cbrevietnam.com/?useful=vietnam-market-outlook-2019 (accessed on 18 September 2019).
- Kim, S.; Agrusa, J.; Lee, H.; Chon, K. Effects of Korean television dramas on the flow of Japanese tourists. Tour. Manag. 2007, 28, 1340–1353. [Google Scholar] [CrossRef]
- Nguyen, T.K. The Significance and Performance of Listed Property Companies in Vietnam. Pac. Rim Prop. Res. J. 2010, 16, 221–245. [Google Scholar]
- Haila, A. Real Estate in Global Cities: Singapore and Hong Kong as Property States. Urban Stud. 2000, 37, 2241–2256. [Google Scholar] [CrossRef]
- Bers, M.; Springer, T. Economies-of-scale for real estate investment trusts. J. Real Estate Res. 1997, 14, 275–290. [Google Scholar]
- Anderson, R.I.; Fok, R.; Springer, T.; Webb, J. Technical efficiency and economies of scale: A non-parametric analysis of REIT operating efficiency. Eur. J. Oper. Res. 2002, 139, 598–612. [Google Scholar] [CrossRef]
- Wang, T.; Wang, G. Empirical analysis of operating efficiency of China’s real estate industry. Sci. Technol. Ind. 2009, 9, 39–43. (In Chinese) [Google Scholar]
- Zheng, X.; Chau, K.-W.; Hui, E.C.M. Efficiency assessment of listed real estate companies: an empirical study of China. J. Int. J. Strat. Prop. Manag. 2011, 15, 91–104. [Google Scholar] [CrossRef]
- Das, T.K.; Teng, B.S. A resource-based theory of strategic alliances. J. Manag. 2000, 26, 31–61. [Google Scholar] [CrossRef]
- Zikmund, W.G.; Babin, B.J.; Carr, J.C.; Griffin, M. Business Research Methods; Cengage Learning: Boston, MA, USA, 2013. [Google Scholar]
- Farrell, M.J. The Measurement of Productive Efficiency. J. Royal Stat. Soc. 1957, 120, 253–290. [Google Scholar] [CrossRef]
- Charnes, A.; Cooper, W.W.; Rhodes, E. Measuring the efficiency of decision making units. Eur. J. Operational Res. 1978, 2, 429–444. [Google Scholar] [CrossRef]
- Hotelling, H. The economics of exhaustible resources. J. Political Econ. 1931, 39, 137–175. [Google Scholar] [CrossRef]
- Färe, R.; Grosskopf, S.; Lindgren, B.; Roos, P. Productivity changes in Swedish pharamacies 1980–1989: A non-parametric Malmquist approach. J. Prod. Anal. 1992, 3, 85–101. [Google Scholar] [CrossRef]
- Färe, R.; Grosskopf, S.; Lindgren, B.; Roos, P. Productivity developments in Swedish hospitals: a Malmquist output index approach. In Data Envelopment Analysis: Theory, Methodology, and Applications; Springer: Dordrecht, The Netherlands, 1994; pp. 253–272. [Google Scholar]
- Deng, J. Control problems of grey system. Syst. Control Lett. 1982, 1, 288–294. [Google Scholar]
- Liu, S.; Forrest, J. The current developing status on grey system theory. J. Grey Syst. 2007, 19, 111–123. [Google Scholar]
- Wang, C.N.; Nguyen, N.T.; Tran, T.T. Integrated DEA models and grey system theory to evaluate past-to-future performance: A case of Indian electricity industry. Sci. World J. 2015, 2015, 638710. [Google Scholar] [CrossRef]
- Nguyen, N.T.; Tran, T.T. Optimizing mathematical parameters of Grey system theory: An empirical forecasting case of Vietnamese tourism. Neural Comput. App. 2017, 31, 1075–1089. [Google Scholar] [CrossRef]
- Wu, A.L.; Wu, S.J.; Lin, S.L. Grey relational analysis of students’ behavior in LMS. In Proceedings of the International Conference on Machine Learning and Cybernetics (ICMLC), Singapore, 26–28 February 2011; IEEE: Piscataway, NJ, USA, 2011; Volume 2, pp. 597–602. [Google Scholar]
- Miller, S.; Springer, T. Cost Improvements, Returns to Scale, and Cost Inefficiencies for Real Estate Investment Trusts; Department of Economics Working Papers Series; University of Connecticut: Storrs, CT, USA, 2007. [Google Scholar]
- Chau, K.W.; Wong, S.; Newell, G. Performance of property companies in Hong Kong: A style analysis approach. J. Real Estate Portf. Manag. 2003, 9, 29–44. [Google Scholar]
- Hui, E.C.M.; Ooi, J.T.L.; Wong, K. Economic performance of property companies in Hong Kong. J. Prop. Res. 2007, 24, 139–157. [Google Scholar] [CrossRef]
- Chau, K.W.; McKinnell, K.; Wong, S.; Wei, Q.; Newell, G. Impact of corporate governance structures on the relationship between direct and indirect real estate in China. J. Real Estate Portf. Manag. 2010, 16, 9–19. [Google Scholar]
- Bello, N.A.; Bello, I.K.; Elegbede, O.T. Performance Assessment of Industrial Real Estate Contribution to Nigerian Economy. J. Investig. Manag. 2015, 4, 132–140. [Google Scholar] [CrossRef]
- Lewis, C.D. International and Business Forecasting Methods; Routlege: London, UK, 1982. [Google Scholar]
- Tone, K.A. Slacks-based measure of efficiency in data envelopment analysis. Eur. J. Operat. Res. 2001, 130, 498–509. [Google Scholar] [CrossRef]
- Jiang, Y.-Y.; Li, L.-X.; Li, E.-Y. Analysis on the efficiency of real estate industry based on DEA in Ningbo City. In Proceedings of the 2010 International Conference on Management Science and Engineering, ICMSE 2010, Wuhan, China, 17–18 October 2010. [Google Scholar]
- Chen, Q.T.; Li, F.D. Empirical Analysis on Efficiency of Listed Real Estate Companies in China by DEA. iBusiness 2017, 9, 49–59. [Google Scholar] [CrossRef]
- Wai, P.W.; Gholipour, H.F.; Ebrahim, B. How efficient are real estate and construction companies in Iran’s close economy? Int. J. Strateg. Prop. Manag. 2012, 16, 392–413. [Google Scholar]
- Nyden, P.; Maly, M.; Lukehart, J. The emergence of stable racially and ethnically diverse urban communities: A case study of nine US cities. Housing Policy Debate. 1997, 8, 491–534. [Google Scholar] [CrossRef]
- Qi, W.; Jia, S. The empirical study on productivity of Chinese real estate enterprises based on DEA-based Malmquist model. In Proceedings of the 2010 Second International Conference on Communication Systems, Networks and Applications, Hong Kong, China, 29 June–1 July 2010. [Google Scholar]
- Herniza, M.T.; Zati, A.Z. Measuring Efficiency of Real Estate Investment Trust Using Data Envelopment Analysis Approach. In Proceedings of the 2010 Second International Conference on Communication Systems, Networks and Applications, Hong Kong, China, 29 June–1 July 2010. [Google Scholar]
- Company Data of Input and Output Variables. Available online: https://vietstock.vn/ (accessed on 20 February 2020).
© 2020 by the authors. Licensee MDPI, Basel, Switzerland. This article is an open access article distributed under the terms and conditions of the Creative Commons Attribution (CC BY) license (http://creativecommons.org/licenses/by/4.0/).