Article

Spatial Patterns of Knowledge-Intensive Business Services in Cities of Various Sizes, Morphologies and Economies

1
Department of Human Geography and Regional Development, University of Ostrava, Ostrava 702 00, Czech Republic
2
Department of Geoinformatics, VSB-Technical University of Ostrava, Ostrava 708 00, Czech Republic
*
Author to whom correspondence should be addressed.
Sustainability 2020, 12(5), 1845; https://doi.org/10.3390/su12051845
Submission received: 16 January 2020 / Revised: 24 February 2020 / Accepted: 25 February 2020 / Published: 1 March 2020
(This article belongs to the Special Issue New Concepts for Regeneration of Industrial Cities)

Abstract

:
We compare intra-urban localization patterns of advertising and IT companies in three large Czech cities. The main aim of our analysis is an empirically-based contribution to the question to what extent do knowledge bases affect the spatial distribution of various knowledge-intensive business industries. The central research question is: To what extent is the localization of these two industries influenced by different modes of innovation/knowledge bases (symbolic vs. synthetic) and to what extent by contextual factors, such as urban size, morphology, position in the urban hierarchy and economic profile of the given city. We found that the urban contexts shape the localization patterns of advertising and IT companies more than differences in knowledge bases—both industries cluster primarily in the inner cities and urban cores. Formation of more suburban IT “scientific neighborhoods” is limited.

1. Introduction

There is a consensus that companies in knowledge-intensive business services (KIBS) cluster in large cities that offer a critical mass of capital, knowledge, institutions, and infrastructure [1,2,3]. Far less is known about the spatial distribution of KIBS at the intra-urban level. There is, however, a consensus: (i) High-order KIBS concentrate in central business districts and inner cities with secondary concentrations in suburban areas [4,5,6,7,8,9]; (ii) their spatial patterns are shaped by the transport infrastructure, such as airports, highways or subways [10,11]; (iii) KIBS with symbolic, synthetic and analytical knowledge may differ significantly from each other in their spatial distribution and collocation patterns [12]. Despite the growing body of research on localization factors of KIBS at the intra-urban level, there is a certain lack of empirical evidence on the question of how localization patterns of KIBS differ between various urban contexts.
Our primary research goal is to empirically evaluate the extent to which different knowledge bases (synthetic and symbolic) affect localization patterns of KIBS firms in large cities. Therefore, we compare localization patterns of advertising and market research companies (NACE 73) representing the symbolic knowledge base and computer programming-consultancy-related activities and information service activities (IT: NACE 62 and 63) representing the synthetic knowledge base in three large Czech cities (Praha, Brno, Ostrava) to illustrate how various urban contexts may influence the spatial distribution of companies with different knowledge bases. These industries constitute a significant portion of employment in all of these cities (see Table 1). Especially the IT sector has contributed significantly to the economic transformation of formerly industrial cities (considering IT, Brno is now the most specialized city in Czechia and Ostrava is the third) [13,14,15].
Advertising is a representative of KIBS with a purely symbolic knowledge base. These companies should require tight geographical proximity to their customers, suppliers or rivals [16,17], and cluster in urban cores and dense inner cities, close to the headquarters of large corporations and public institutions. By contrast, services with a predominantly synthetic knowledge base (such as IT) rely primarily on knowledge sourcing and innovation collaboration with partners inside value chains, which are not necessarily local [18,19]. IT companies should, thus, exhibit more dispersed spatial patterns (However, Zook [20] documented clustering of internet companies in the inner city, close to the financial institutions, Spencer [12] also noted this possible location pattern), although they may cluster at the neighborhood level as well [12].
Méndez-Ortega and Arauzo-Carod [21] stated that “… in addition to industry-specific characteristics that determine some external requirements by these firms (such as accessibility to skilled labour or specialized IT suppliers), there are some city-specific characteristics (e.g., urban policies, spatial distribution of economic activity) that also matter, and which shape the location decisions taken by these firms.” We aim to analyze exactly these city-specific characteristics and their effects on the spatial distribution of firms. Our central research question is: To what extent are localization patterns of selected KIBS influenced by their distinct modes of innovation (knowledge bases) and to what extent by the city-specific characteristics?

2. Spatial Distribution of KIBS at Intra-Urban Level: Theoretical Discussion

To explain the causes of intra-urban clustering/dispersion of KIBS we employ two basic concepts: The knowledge bases [22], and the creative/scientific neighborhoods [12]. The concept of knowledge bases distinguishes between three types of companies/industries according to their prevailing mode of innovation: An analytical, a synthetic, or a symbolic knowledge base [23]. Knowledge bases differ from each other in the importance: (i) Personal communication (F2F) for knowledge sourcing; (ii) local or global sources of knowledge and mechanisms for acquiring knowledge; (iii) codified or tacit knowledge for the creation of innovations [24]. Therefore, “industries that are primarily based on tacit knowledge show a higher degree of geographic clustering than sectors based on codified knowledge, ceteris paribus” [25]. The analytical knowledge base is the least sensitive to geographical proximity. Innovation activities in sectors with analytical knowledge base are mainly based on codified knowledge that is sourced at global level [26], the role of F2F contact, "local buzz" [27], and geographical proximity is, thus, limited, but still may be relevant [28]. Quality of the site (laboratories, technological parks, research centers) is of key importance, urban agglomeration as a whole is less important [29], the same holds for urban structure. The symbolic knowledge base is the most sensitive to geographical proximity [30], while the synthetic knowledge base is characterized by a differentiated role of geographical distance [24]. However, it is important to note here that most industries innovate in all types of knowledge bases [31,32]. Even a single firm may combine two or three knowledge bases, and many firms in a particular (KIBS) industry differ in their prevailing knowledge base from the majority of firms in that industry [33].
Service companies with a synthetic knowledge base (such as IT, finance, and insurance companies) collaborate and source knowledge (the DUI model—doing, using, interacting) [34] mainly within the production chain (regional or national networks) [26] in the form of medium and long-term relationships with customers, suppliers or parent companies. A high share of the knowledge transferred is codified. Proximity to suppliers and customers is more important than colocation with producers. Companies with a synthetic knowledge base may exhibit various localization patterns and strategies depending on the spatial distribution of their key customers and suppliers [35]. Therefore, we expect that IT (service) companies will be concentrated in the urban cores and inner cities only if their principal suppliers, customers or parent companies are there [36]. Otherwise, they should prefer less dense suburban locations to: (i) Avoid high rents; (ii) collocate with IT manufacturing companies as their customers [8]; and (iii) reside in or close to the science parks and large university campuses that are often located in suburban areas near the junctions of major highways and close to the residential neighborhoods where their employees live [12].
On the other hand, several authors [6,8,37] suggested the trend of increasing spatial concentration of some knowledge-intensive business services and the digital economy into the inner city “creative neighborhoods”. Factors that may foster such concentration of the digital economy into the inner city’s neighborhoods include: (i) A growing symbiosis between arts and IT (digital content), where the reinforcement of supplier-customer relationships between creative industries and IT may lead to a collocation of companies; (ii) the increasing localization flexibility of IT companies that “… are starting to resemble financial and other high-order services, able to generate high income streams with little floor space, in turn enabling them to afford high real estate costs typical of central locations” [8]; (iii) “cool neighborhoods” attracting a highly-skilled, creative and talented workforce—this seems to be the key localization factor [8]. Therefore, while suburban scientific parks and other types of IT clusters are certainly not disappearing, there are also arguments for the clustering of IT companies in inner cities, close to cultural industries.
The organization of production and the innovation process in companies with a symbolic knowledge base are based on face-to-face communication and local buzz [38]. Their products/services are developed within highly localized and flexible temporary projects that draw on rapidly changing tacit knowledge [39]. At the same time, these industries depend on culturally embedded and highly contextual specific knowledge [26,40]. Perhaps most importantly, companies with a symbolic knowledge base face steep transaction costs [41] related to their innovation process and supplier relationships. Transaction costs may be significantly reduced by collocation of companies in the same industry, their customers and/or suppliers. Various mechanisms may reduce transaction costs—the learning by monitoring [42], learning by interacting [43], the know-who effect [44], reduction of the adaption costs [45], and communication costs, or generally strengthening the so-called “untraded interdependencies” [46]. Out of these, the most important mechanisms, through which the transactions costs can be reduced are [47,48]:
i.
Reduction of information costs by learning through the vertical interaction between companies organized within the production chain, learning through monitoring (horizontal interaction) and the "neighborhood effect", which relates more to the social dimension of proximity, wherein spatial proximity increases the likelihood of accidental or unexpected encounters.
ii.
Reduction of adaptation costs of firms linked into a value chain: Spatial proximity is essential for firms with a symbolic knowledge base (e.g., in advertising or media) that are predominantly organized under the so-called "project ecology" [16], where full-time employees, part-time employees and freelance professionals bring together and pool their expertise and talent [49].
iii.
Reduction of communication costs through the trust building and longer-term communication channels allowing for the transmission of the tacit knowledge.
It is, however, necessary to consider that firms combine and integrate various knowledge bases in their innovation process [50], and industries might show relatively high internal heterogeneity of innovation modes.
There are also other arguments supporting the necessity of company collocation for knowledge sourcing and innovation performance. Many authors emphasize the positive role of density (buildings, population, economic activities, and institutions) on clusterings of KIBS companies [51]. Density shortens the distance and increases the ease of face-to-face meetings, and the frequency of ad hoc encounters in public space. The economic value of the density effect comes from both the reduction of distance and from the spillover of tacit knowledge created [52]. Perhaps more importantly, Rosenthal and Strange [53] or Arzaghi and Henderson [54] found that the magnitude of localization economies rapidly dissipates with increasing distance, pushing companies to concentrate in relatively small urban areas—streets, districts or quarters. Due to the limited territorial impact of localization economies, many service industries are heavily concentrated in some districts, quarters or streets, sometimes labeled as “creative fields” [45,55] or “creative neighborhoods” [12].
Previous approaches are valuable for the explanation of the spatial concentration of economic activities at the intra-urban level [56] or "hot spots" [57]. However, to answer the question of where and in which parts of cities KIBS clusters are located, it is necessary to focus on physical, functional and social-spatial structures [58]. Creative industries generally tend to be localized in amenity rich inner cities (see He et al. 2018), due to their “innovative milieu” [59], which can act as a kind of incubator for new businesses [60]. Within inner cities, the KIBS can draw on four basic competitive advantages in the form of [61]: (a) Strategic locations near the central business district [62]; (b) local demand, which is relatively unsaturated in comparison to the city center; (c) accessibility [63], and the connection to the companies in city centers that are linked to clusters at a regional, national or global level [64]; (d) the human resources available in these locations [6,11]. The last point is maybe the most important: Easy access to the (tacit) knowledge and information strongly determines the location of the knowledge based firms [62]. According to the amenity richness theory [65,66], highly educated and creative individuals prefer to live within walkable distances to retail, restaurants, educational and cultural institutions [51,52].
Besides, the localization of companies in inner cities is also motivated by lower rents compared to the city centers and availability of land and offices, which is a result of the relocation of housing and manufacturing companies from inner cities to suburbs [59]. The physical structure of these localities (creative neighborhoods: See Spencer [12]) is characterized by high density, walkability, and (older) buildings diverse in age, size, height and public-private interface [52,67] that are not always completely renovated [37]. The most important element of creative clusters is the mix of mixes [52]: The intersection of the morphological diversity, socio-economic diversity (services associated with bohemians, rich gentrifiers, and local communities with lower social status) and functional diversity (housing, consumer services, culture, amenities). As suggested above, bars, cafes, restaurants or public spaces, which can be collectively referred to as "third places" [68], play a key role in obtaining formal or informal contacts and dissemination of knowledge [69]. The interaction of physical, social and functional structures in the sense of certain dual reflexivity can form "creative fields" [55] that accelerate the creation of knowledge and innovation. Housing is mainly located outside the creative clusters, but in their immediate vicinity [70].
Apart from the knowledge bases, we also deal with the effects of geographical contexts that differ from city to city. We cannot expect the same location patterns of KIBS companies in cities that vary in their urban size/density/morphology, position in the urban hierarchy [71], historical and current economic performance and specialization [72]. Nevertheless, the question is: To what extent are the effects of geographical contexts on KIBS localization contingent and unpredictable and to what extent is it possible to find at least some basic regularities—that in a certain city type one specific location pattern of KIBS firms are more probable to occur than any other?
To answer this question, we departed from a simple taxonomy of co-clustering patterns at the intra-urban level proposed by Boix-Domenech et al. [30], and also discussed by Coll-Martinez et al. [73]. The authors explain the colocation and co-clustering of companies by two factors: (i) Urbanization economies that attract companies to the most central parts of the city with the highest density and diversity of producers, suppliers, customers and institutions; and (ii) land rents that dissipate with increasing distance from the central business district, pushing companies to less dense and less expensive suburban areas, thus, forming a polycentric structure of the city. Large cities generate urbanization economies allowing for the development of secondary clusters of KIBS outside the urban cores [30].
It is necessary to consider also another systematic factor—position of the city in the urban hierarchy [74]. KIBS firms in large global cities with a gateway function that concentrate the corporate headquarters, public institutions, research labs and universities should exhibit generally high proportion of the skilled and creative workforce, high value-added and innovation performance. Innovative KIBS firms in these cities should exhibit a higher propensity to cluster in inner cities. On the other hand, in smaller and economically worse-performing cities, KIBS firms would be on average, less innovative. Transmission of the tacit knowledge mediated by geographical and cognitive [75] proximity would be, thus, of lesser importance. KIBS firms oriented on rather standardized and less knowledge-intensive activities should be more spatially dispersed at the intra-urban level.
As suggested in Section 2, several factors affect the spatial distribution of KIBS at an intra-urban level. Therefore, we ask which one of the following idealized scenarios is more relevant for Praha, Brno, and Ostrava?
i.
There are similar localization patterns of KIBS in all three cities: Advertising companies are mostly concentrated in creative neighborhoods in the inner cities, and IT companies clustered in more suburban scientific neighborhoods [4,12].
ii.
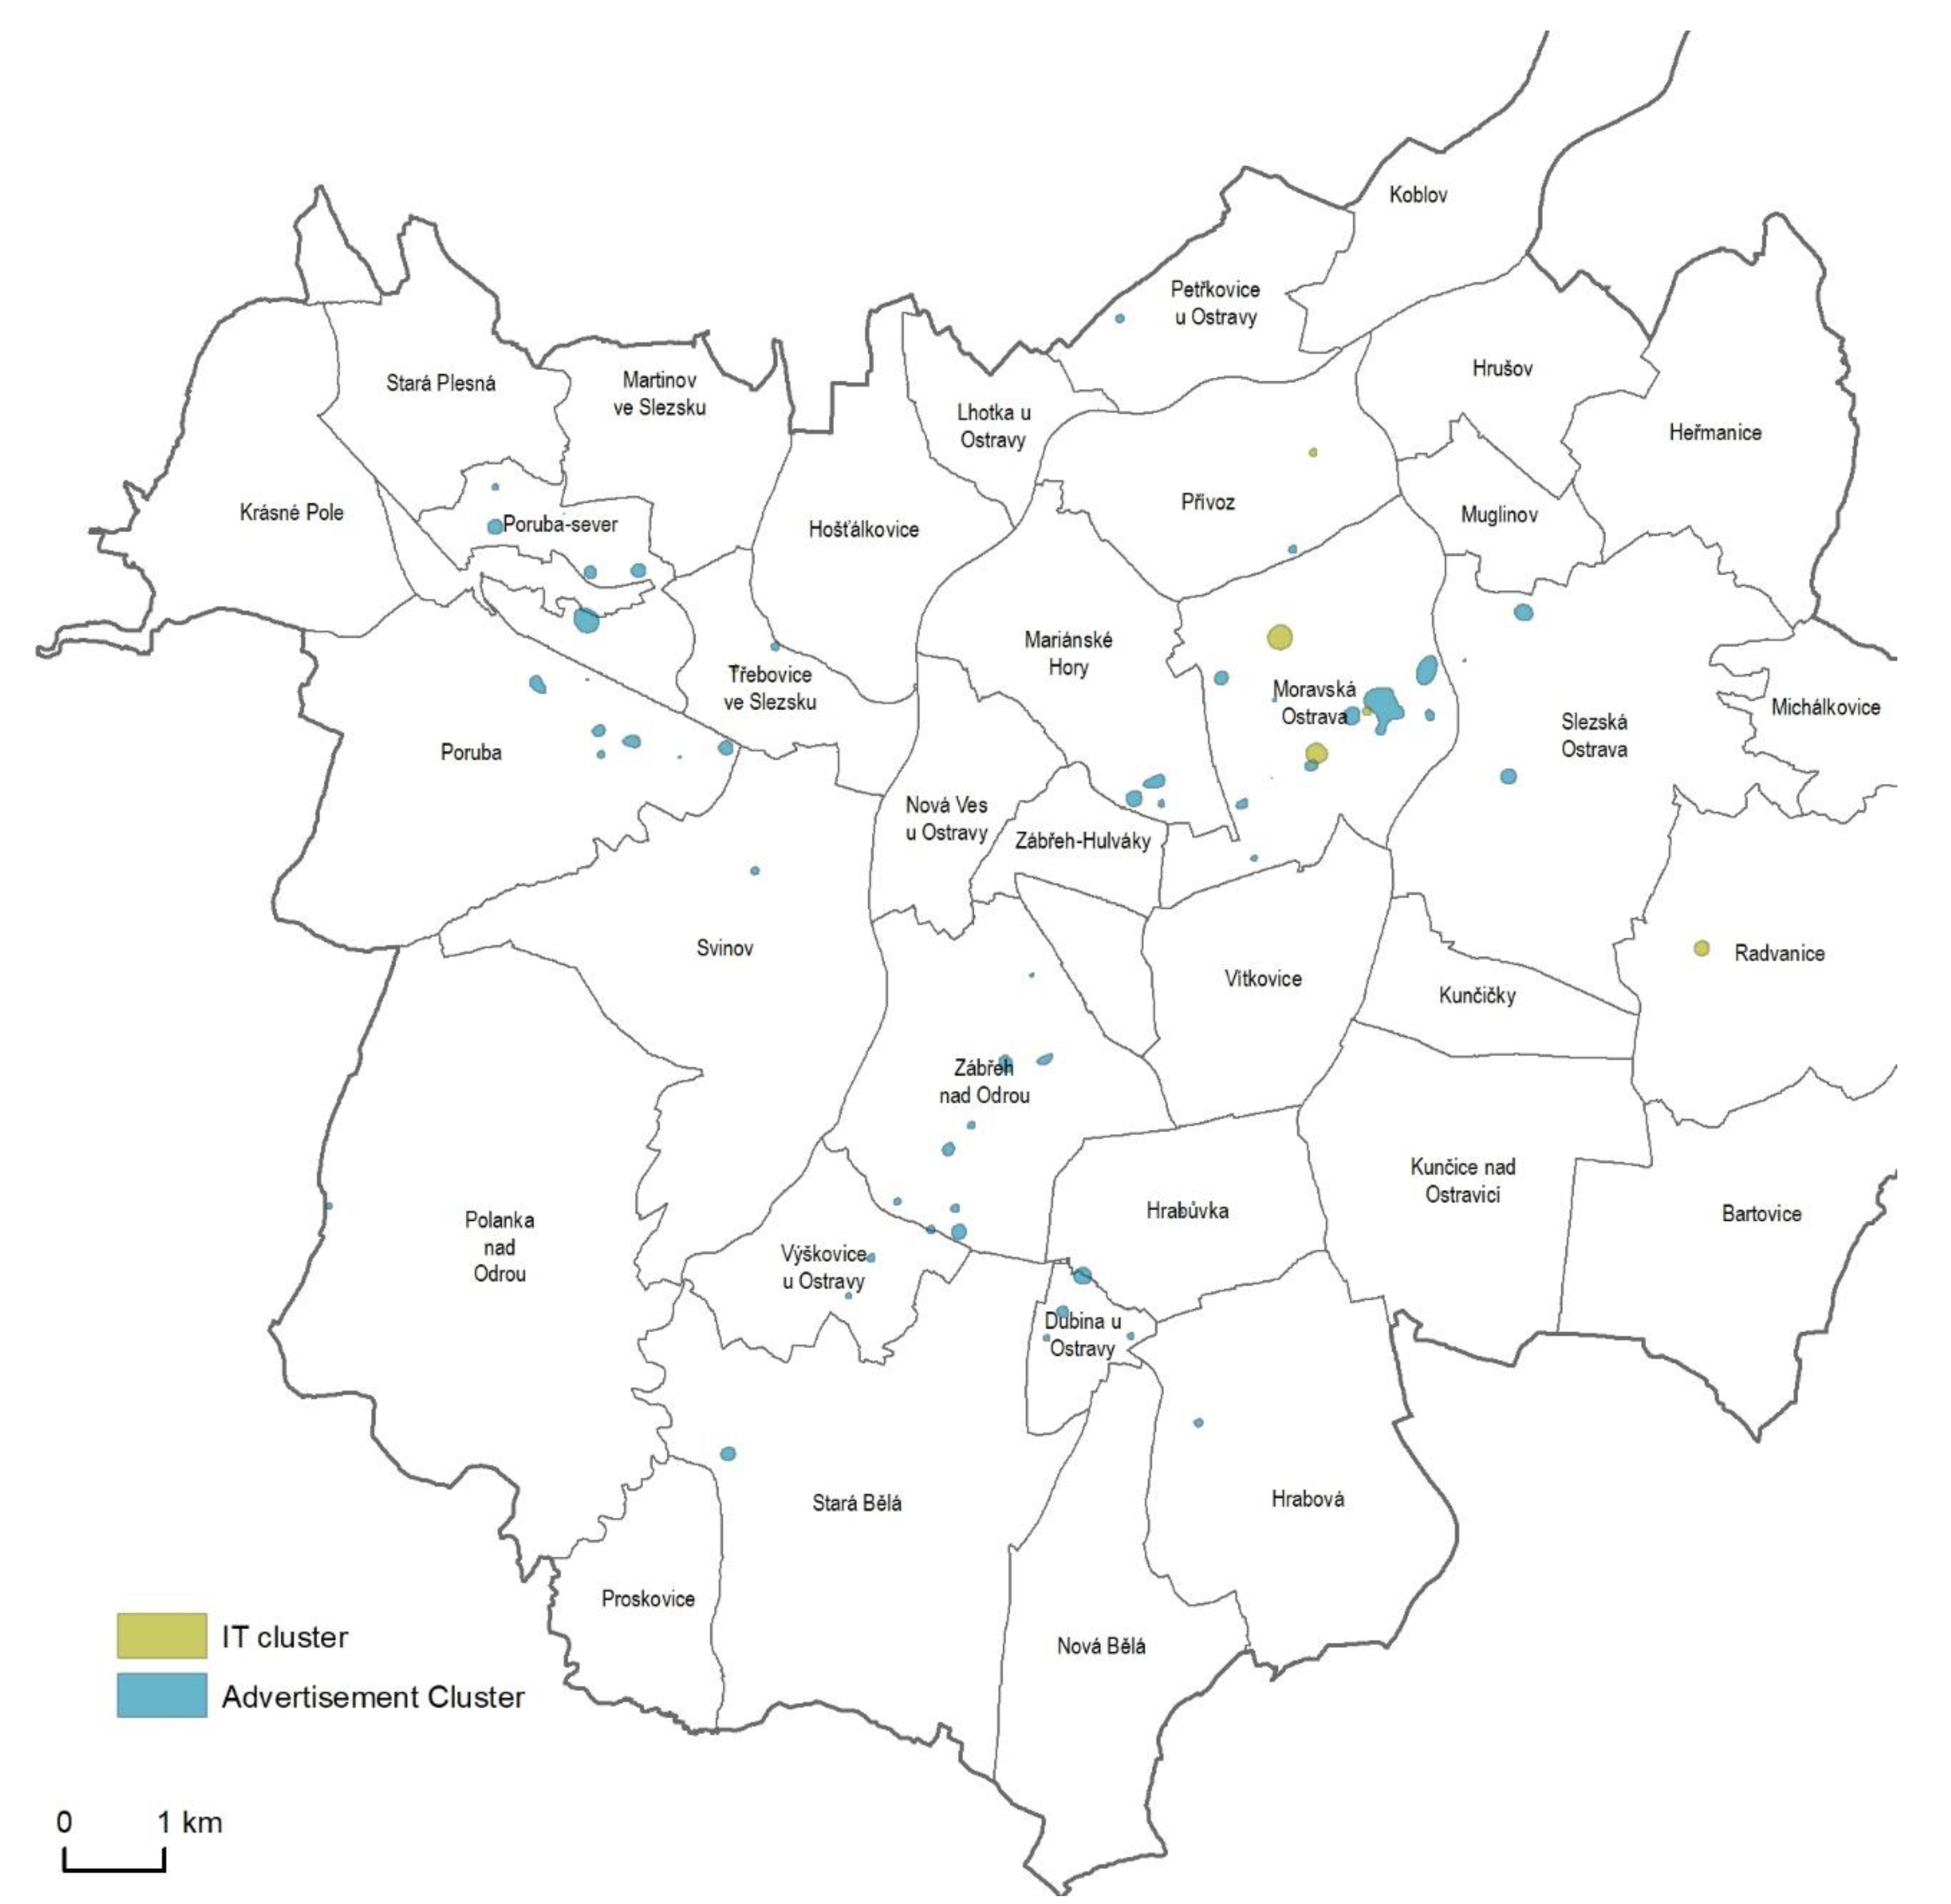
The cities differ significantly in their localization patterns of IT and advertising companies.
Similar localization patterns of advertising and IT in all three cities (first scenario) suggest the key role of knowledge bases in shaping localization patterns of KIBS. On the other hand, significant differences in the spatial distribution of KIBS among the three selected cities would imply that urban contextual factors affect localization patterns of KIBS more significantly than knowledge bases. Comparison of Praha (a global gamma city, the capital, a gateway function), Brno (a second-tier metropolitan with a high concentration of universities and IT companies) and Ostrava (an old industrial, shrinking city): Cities that share the same institutional context, but differ in their size/density, morphology, position in the urban hierarchy, industrial specialization, and economic performance should contribute to the theoretical debate contrasting the role of localization factors operating at the industry-level and the city-level in localization strategies of KIBS.

3. Case Studies of Praha, Brno and Ostrava: Characteristics and Motivation

There are several reasons why we picked Praha, Brno, and Ostrava for the case study. These cities represent three types of positions in the hierarchy of the settlement system: Praha is a global gama city with a strong capital effect and a high share of knowledge-intensive business services (finance, media) [76]; Brno is a successfully transformed second-tier metropolitan city with a high concentration of universities and successfully developing IT sector [77], while Ostrava is a shrinking city, the core of a metropolitan old industrial region that is still quite heavily specialized in traditional heavy manufacturing industries. Secondly, Praha and Brno differ significantly from Ostrava in urban morphology. The first two are radial-concentric cities with historic cores that have been surrounded by compact and dense residential areas and industrial zones [78,79,80]. Ostrava, on the other hand, is a classic example of a city with a polycentric structure formed by the rapid growth of the mining and heavy manufacturing industries [81,82], and later boosted by a construction boom in the period of the centrally planned economy [83]. Due to economic, social and political changes in the context of the so-called "multiple transformations" [84], Brno and especially Prague have moved towards more polycentric urban regions [78]. The already existing polycentric structure in Ostrava has been preserved. However, former mines and factories that had originally disturbed the compact urban structure were replaced by business centers and office complexes [85].
It is, thus, a question of how the spatial patterns of KIBS differ between Praha, Brno, and Ostrava. On the one hand, KIBS in Praha should be more spatially dispersed. The combination of growing polycentricity and high magnitude of urbanization economies stemming from the urban size/density and diversity of industries, workforce and institutions should allow for more creative neighborhoods/hubs to develop [30]. At the same time, the gateway function and high economic performance of the city, and its concentration of corporate headquarters, higher-order knowledge-intensive business services and skill-intensive non-routine KIBS push many companies to the secondary subcenters in the outer ring.
Following this logic, KIBS companies in Brno and Ostrava should be more concentrated in the inner city or even the urban core (despite Ostrava’s polycentricity), because low urbanization economies do not create favorable conditions for secondary city centers to develop and land rents in the inner city are less prohibitive than in Prague (see Boix et al. [30] for detailed theoretical argumentation). Nevertheless, in Brno and especially in Ostrava [18] the share of companies in KIBS that focus on relatively low-skilled and routine tasks (and on production rather than on development phase in the value chain: See also Stachowiak and Stryjakiewicz [89] for interesting discussion of spatial distribution of value chains in creative industries or Hnát and Sankot [90] for the role of institutional framework) significantly higher than in the capital city. For these companies, urbanization and localization economies related to the presence in the city center may not be sufficient to counterbalance the high rents and other costs—therefore, more spatially dispersed localization patterns may theoretically occur.

4. Data and Methods

The spatial distribution of KIBS companies was based on a unique company-level anonymized database called the “Annual register of economic subjects in selected production industries” provided by the Czech Statistical Office [86,87]. The register lists all economic subjects, including individual entrepreneurs, providing information about their employment and industry (3-digital NACE) for the year 2010. Therefore, we did not employ any sampling methods, because we were working with the population. KIBS companies were clustered into two groups, advertisement group defined by 3-digital NACE 73.1, and IT group (62.0, 63.0). The data were geocoded using the “Register of territorial identification and addresses” and also by Google API. One hundred percent of the economic subjects were precisely localized—assigned to the address points.
The localization patterns of companies were analyzed by several spatial statistic methods—the nearest neighbor method, K-function and kernel density. The nearest neighbor method [71,91] works with the distance to the nearest event and tries to determine if the given average distance corresponds to a concentrated or dispersed spatial pattern. The average closest distance between Ro events is compared to the expected average closest distance between Re events. This expected distance is defined as:
R e = 1 2 λ = 1 2 n A
where λ is the density of events, n is the number of the events, and A is the area of the locality. The proportion of an observed and expected average smallest distance is called the nearest distance index (NNI).
NNI = R o R e
Given that density is also included in the calculation of the expected distance, the results are significantly affected by the shape and size of the area (narrow, long, rectangular areas have a higher Ro). In this case, the size of the studied localities (areas of Prague, Brno and Ostrava) also entered into the calculation. Main drawbacks of the NNI method are exclusion of a part of information about the pattern and edge effects [92]. It summarizes all the nearest distances to a single value providing only first look on the spatial distribution of points.
An extension of the above-mentioned method is addressed in more recently developed approaches (G, F or K functions). The K-function [21,93,94,95] that considers all events and provides the standardized average number of events to the distance d from any event is used to provide greater detail on how the companies are clustered in space. Standardization is done by the intensity:
K ( d ) = a n 1 n i = 1 n # [ S C ( s i , d ) ]
where n equals the number of events, a is area, and C ( s i , d ) is a circle of the perimeter d above the point s i . The expected value is fully dependent on the distance d. Given that π d 2 is the area of the circle and λ is the density of the events, the expected value K-function equals to:
E ( K ( d ) ) = λ π d 2 λ = π d 2
Due to the squared distance d, the value of the expected and observed K-functions increases significantly with the increasing d. For this reason, the K-function is converted to the so-called L-function, which is a standardized K-function:
L ( d ) = K ( d ) π d
For the identification of hubs, the kernel density method was used (a 150-meter range and a cell size of 10 meters). Subsequently, only cells with the highest 5 percent of non-zero values are shown in the maps. These sites were subsequently converted to binary values: The cells that form the locality with high- intensity received a value of 1, and the other cells received 0. The resulting 13 layers were then summed up, and a layer was created where the cells could theoretically have values in the 0–13 range. To define a locality as an advertisement hub, companies in at least four different areas (according to 3 digital NACE) must be concentrated in a locality together. This limit of co-localization is considered as a minimal number (one third). These areas form only the core of the given hub, so the final hub is defined as a closed area around this area.

5. Results

We started with a comparison of the localization patterns of advertising and IT companies that was conducted using the Nearest Distance Method (NNI), K-Functions and kernel density. In Prague, the intensities of clustering (indicated by the NNI values) for advertising and IT companies are almost the same, in Brno, advertising showed more intensive clustering than IT; in Ostrava the opposite (Table 2). The L-function shows significant differences in the degree of spatial clustering between Praha, Brno and Ostrava. The highest values of the L-function were found in Ostrava, which can be explained relatively simple; there are a few companies in a small number of locations.
The L-function shows significant differences in the degree of spatial clustering between Praha, Brno and Ostrava (Figure 1). The highest values of the L-function in shorter distances were found in Ostrava, which can be explained relatively simple; there are a few companies in a small number of locations.
The advertising industry in Praha is strongly concentrated in the hubs located in the urban core and inner city (Figure 2). By contrast, the IT industry is more spatially dispersed, but the inner city still dominates. The collocation with advertising is rather weak. In Brno the IT sector shows a much more pronounced tendency to cluster in hubs (Figure 3), especially in the inner city. On the other hand, we noticed a relatively low concentration of advertising with a certain degree of collocation with IT. In Ostrava, the main advertising hub is located in the urban core, with smaller hubs being located in the transition zone or compact inner city (Figure 4).
The comparison of two industries with different knowledge bases revealed some spatial variability. In Praha, the empirical results were the most consistent with the theoretical assumptions (see K-functions). The IT sector was dispersed, even though it was possible to find smaller hubs. The effects of localization economies and the necessity of spatial concentration were only limited. On the other hand, the advertising sector was highly spatially concentrated, which suggests the importance of localization economies (reduction of transaction costs) and their probable sharp attenuation with increasing distance [9,73]. The location of individual hubs indicates a positive effect of physical and functional structures, especially in the inner city (Holešovice, Karlín, Žižkov). The high level of concentration of advertising companies in the historic core indicates both the existence of a "creative zone" and an easier approach to management and development of global linkages [64] resulting from the internationalization of the sector and the position of Praha as a "gateway city". We cannot omit a supply factor: The presence of many customers who are concentrated in the historic core and inner city.
On the other hand, in Brno, the advertising industry showed a significantly higher rate of spatial concentration compared to IT sector, but the number and spatial extent of advertising hubs were significantly smaller than IT hubs. The most significant concentration of hubs in IT is located in the inner city. With the increasing distance from the urban core, the rate of spatial concentration of IT falls. The largest IT hubs are located in the areas that have undergone a regeneration process, either by adapting older buildings or by building office complexes) [96]. The morphology of the second hub partly corresponds with the character of a “scientific neighborhood" [12]. There are two colleges with IT faculties in the northern part of the inner city (Masaryk University, Brno University of Technology), whose importance cannot be overlooked. The overall spatial patterns suggest that the advertising sector is more of a local significance, which is reflected in a lower degree of clustering, pointing to a limited ability to generate localization economies.
The low number of companies and their over-representation in the centre of Ostrava (see Rumpel et al. [97] for similar finding) and in the other two sub-centers (Poruba, Ostrava-Jih) results in a high concentration (the highest NNI value), but the existence of localization economies is weak. We did not record virtually any major IT hubs, which may indicate a lower knowledge intensity of activities in Ostrava and maybe also lack of knowledge linkages at a local level [98]. In the case of advertising, the main hub spreads around the city core, but its size and scope seem to provide limited localization economies.
Now we will try to briefly characterize the location, structure and character of the hubs. If we compare the identified patterns of colocation of clusters of KIBS by Boix et al. [30] with a certain degree of caution (see Figure 2, Figure 3 and Figure 4), we can state the following. The distribution of hubs in Prague indicates the existence of urbanization economies, whose intensity is not strong enough to give rise to a fully polycentric pattern of distribution. According to the location and character of hubs, Brno can be classified into the upper right quadrant (urbanization economies and low polycentricity), which is typical for medium-sized cities. The small clusters in the center of Ostrava place this city to the lower left quadrant (low polycentricity and low urbanization economies), which is in a direct contradiction to its polycentric character.
The spatial distribution of the hubs largely reflects the differences in the economic position of the cities. Prague is characterized by a combination of diversified specialization, offering both urbanization and localization economies. In Brno, the results rather exhibit the effects of urbanization economies, although less intensive than in Prague. Empirical evidence of localization economies in Brno is rather weak. The results for Ostrava confirm the negative impact of specialization in the manufacturing industry on the presence of creative industries [99], and also KIBS. This finding contrasts with the fact that the IT sector in Ostrava has originally developed thanks to the branching from manufacturing (in this case metallurgy), similarly like in other industrial cities in Central Europe [100]: For example in Košice [101]. Above all, however, they point to the limits of the absence of localization and urbanization economies linked to the development of creative industries in cities experiencing economic stagnation, such as Halle [102]. The distribution of hubs in all three cities unambiguously confirms the “inner-city preferences” of the sector with a symbolic knowledge base.

6. Discussion and Conclusions

In this paper, we compared the localization patterns of advertising and IT companies in three Czech metropolitan cities (Praha, Brno, Ostrava) that differ in their size, morphology, position in the urban hierarchy and economic profile. Our principal research question asked whether the spatial patterns of these industries are primarily shaped by their knowledge bases (symbolic vs. synthetic) or by the role of urban contexts. In the first case, the spatial distribution of advertising and IT companies should be similar in all three cities, and in the second case, they should be different. Assumption of a tight theoretical relationship between the mode of innovation/knowledge base and localization has not been confirmed, no supposed sharp polarity between the advertising companies concentrated in the inner-city creative neighborhoods and IT over-represented in more suburban scientific neighborhoods [12,103] has been found. On the contrary, both advertising and IT companies were heavily concentrated in the inner cities and to a lesser extent also in the urban cores of Praha, Brno and Ostrava—despite significant differences in urban morphology: See Reference [51] for similar finding. This conclusion is different from the findings of Méndez-Ortega and Arauzo-Carod [21], who analyzed the localization of software and video games firms in Barcelona, Lyon and Hamburg. They found three different spatial patterns of firms that were probably shaped by the urban structures, local policies and path dependence. Smaller differences between Czech metropolitan cities may be explained by a relatively strong effect of “hard” localization factors: See the last paragraph.
The highest number of hubs located in the inner cities close to the historical urban cores indicates the validity of the inner city’s innovative environment, as well as competitive advantages (strategic location, market demand, integration with regional clusters and human resources). The physical spatial structure is, in practically all cases, characterized by an older dense street network and compact buildings (apartment houses). Organic urban structure (walkable historic city centers with irregular streets) and urban block structure: (For description see References [104,105]) prevail. The houses in these locations usually do not exceed several floors. Further, these are locations with a varied functional mix, characterized by the concentration of cultural industries [106]: Cafes, bars, and restaurants or parks—corresponding to the creative neighborhoods described by Spencer [12] or Wood and Dovey [52]. Not only the morphology and the mix of functions but also the spatial structure in these localities largely correspond to the outlined concept of the creative neighborhoods [12,52]. The spatial distribution of hubs also largely overlaps or neighbors with localities that undergo a process of gentrification [107,108,109], and are also relatively ethnically diverse. The colocation of the functional and social structure indicates the likelihood of a reduction of information costs (the “neighborhood effect” and the social dimension) and the cost of adapting to the labor market.
The high rate of spatial concentration also suggests that central localities “add value for knowledge hubs relying on symbolic knowledge” [19] thanks to a high density of a built-up area and (more importantly) spatial proximity that is vital for innovation spillovers based on face-to-face contact. At the same time, IT companies were present in newly constructed office buildings more often than advertising companies that rather adapted older mix-used neighborhoods [110]. The collocation of advertising and IT companies with cultural industries and other functions in the urban cores/inner cities (e.g., gastronomy, public spaces, universities) indicates high importance of neighborhood “coolness’’ [8], and amenities for the localization of KIBS at the intra-urban level [111,112]. Correspondingly, the spatial overlap of KIBS hubs and gentrified neighborhoods suggests the importance of the social milieu for labor market matching, creation and dissemination of information and knowledge [12].
Nevertheless, it is also necessary to consider the role of the hard localization factors that may attract companies to the inner-city hubs: Lower rents, accessibility and reduction of transport costs resulting from the collocation of companies [113]. A significant portion of KIBS in Czech cities (especially in Ostrava [18]) are characterized by low value-added, low knowledge-intensity, a focus on standardized services and also by prevalence of extra-regional knowledge sourcing [18,114]. This conclusion is also supported by Bumberová and Milichovský [115], who did not identify the most radical form of service innovativeness (newness to the market) in the group of Czech KIBS firms. Companies characterized by lower knowledge intensity are not likely to significantly capitalize on the effects of the innovative inner-city milieu. Their concentration in the inner cities and also urban cores (rather than dispersion in the suburbs) can be explained by: (i) The image effect and prestige of the central locality (Praha, Brno); (ii) the connection to the global communication links (Praha) and regional links (Brno, Ostrava) and (iii) the combination of relatively weakly developed urban core industries (finance, insurance) and a relative decline of historical cores/inner cities as the result of commercial and residential sub-urbanization (Brno, Ostrava). In case of Ostrava (and advertising in Brno) the spatial patterns of companies are also clearly constrained by relatively weak urbanization and localization economies (nevertheless, some effects of localization economies, such as easier access to information and data for IT firms were recorded [14,30]), relatively high concentration of manufacturing firms [95], and industrial brownfields in the inner city [116,117], most of them not revitalized despite their central position [118]. Obviously, the urban contextual factors, such as the position in the urban hierarchy and inherited economic profile may significantly alter the theoretically expected localization patterns of advertising and IT.
Empirical results clearly showed an excessive spatial concentration of firms in selected KIBS into the urban cores and inner cities. Several policy implications may be derived from this finding. Firstly, urban cores/inner cities are highly attractive not only for creative industries, but also for firms in technology-based industries, such as IT. Therefore, not only suburban technological/scientific parks and university campuses, but also urban centers should be the targets of large ICT and other smart infrastructural projects. Secondly, clustering of KIBS is (among other factors) significantly driven by the neighborhood coolness. Therefore, municipal or private projects leading to the higher aesthetic value of buildings, improved walkability and establishment of places allowing for meetings (bars, cafes, restaurants...) and provision of affordable commercial spaces should be supported. More generally, regeneration, maintenance and the development of public spaces, green and blue infrastructure, cultural and other activities increasing the residential attractiveness are of key importance. Thirdly, projects aimed at improving transport accessibility dealing with an increasing spatial mismatch between localization of KIBS and labor force are needed. Fourthly, regeneration of industrial brownfields from the 19th and the first half of 20th century may significantly support the clustering of KIBS, because these localities are considered to be cool by many (potential) entrepreneurs and skilled millennials [6].
Future research should be focused on possible application of other methods analyzing point pattern such as spatial autocorrelation, Duranton and Overman’s Kd function [92] or W function [95]. Additionally, the multiscale assessment of the role of factors, mechanisms and actors that shape intra-urban hubs of KIBS companies should be studied. At the moment, we lack detailed neighborhood-level data covering spatial distribution of firms in other industries, morphology, labor force, accessibility and other factors at an intra-urban level in three selected cities. Classification of firms (not industries) according to their prevailing knowledge base and an econometric analysis capturing the localization determinants of these firms will be the next step.

Author Contributions

Conceptualization, O.S. and J.Ž.; methodology, I.I. and J.Ž.; software, I.I.; validation, O.S., J.Ž. and I.I.; formal analysis, I.I.; investigation, O.S., J.Ž., I.I.; resources, O.S., J.Ž., I.I.; data curation, I.I.; writing—J.Ž. and O.S.; original draft preparation, J.Ž. and O.S.; writing—review and editing, J.Ž.; visualization, I.I.; supervision, J.Ž.; project administration, On O.S. and J.Ž.; funding acquisition: O.S. and J.Ž. All authors have read and agreed to the published version of the manuscript.

Funding

This research wJan Žas funded by the Ministry of Education, Youth and Sports through a research grant “SMART technologies to improve the quality of life in cities and regions” (no. CZ.02.1.01/0.0/0.0/17_049/0008452).

Conflicts of Interest

The authors declare no conflict of interest.

References

  1. Aslesen, H.W.; Isaksen, A. New perspectives on knowledge-intensive services and innovation. Geogr. Ann. Ser. B Hum. Geogr. 2007, 89, 45–58. [Google Scholar] [CrossRef]
  2. Shearmur, R.; Doloreux, D. Urban hierarchy or local buzz? High-order producer service and (or) knowledge-intensive business service location in Canada, 1991–2001. Prof. Geogr. 2008, 60, 333–355. [Google Scholar] [CrossRef]
  3. Gallego, J.; Maroto, A. The specialization in knowledge-intensive business services (KIBS) across Europe: Permanent co-localization to debate. Reg. Stud. 2015, 49, 644–664. [Google Scholar] [CrossRef]
  4. Moriset, B. The new economy in the City: Emergence and location factors of internet-based companies in the metropolitan area of Lyon, France. Urban Stud. 2003, 40, 2165–2186. [Google Scholar] [CrossRef]
  5. Óhuallacháin, B.; Leslie, T.F. Rethinking the regional knowledge production function. J. Econ. Geogr. 2007, 7, 737–752. [Google Scholar] [CrossRef]
  6. Shearmur, R. The geography of intrametropolitan KIBS innovation: Distinguishing agglomeration economies from innovation dynamics. Urban Stud. 2012, 49, 2331–2356. [Google Scholar] [CrossRef]
  7. Sigler, T.; Searle, G.; Martinus, K.; Tonts, M. Metropolitan land-use patterns by economic function: A spatial analysis of firm headquarters and branch office locations in Australian cities. Urban Geogr. 2016, 37, 416–435. [Google Scholar] [CrossRef]
  8. Duvivier, C.; Polèse, M. The great urban techno shift: Are central neighbourhoods the next silicon valleys? Evidence from three Canadian metropolitan areas. Pap. Reg. Sci. 2018, 97, 1083–1111. [Google Scholar] [CrossRef]
  9. Coll-Martínez, E.; Moreno-Monroy, A.I.; Arauzo-Carod, J.M. Agglomeration of creative industries: An intra-metropolitan analysis for Barcelona. Pap. Reg. Sci. 2019, 98, 409–431. [Google Scholar] [CrossRef]
  10. Inkinen, T.; Kaakinen, I. Economic geography of knowledge-intensive technology clusters: Lessons from the helsinki metropolitan area. J. Urban Technol. 2016, 23, 95–114. [Google Scholar] [CrossRef]
  11. Duvivier, C.; Polèse, M.; Apparicio, P. The location of information technology-led new economy jobs in cities: Office parks or cool neighbourhoods? Reg. Stud. 2018, 52, 756–767. [Google Scholar] [CrossRef]
  12. Spencer, G.M. Knowledge neighbourhoods: Urban form and evolutionary economic geography. Reg. Stud. 2015, 49, 883–898. [Google Scholar] [CrossRef]
  13. Ženka, J.; Novotný, J.; Slach, O.; Ivan, I. Spatial distribution of knowledge-intensive business services in a small post-communist economy. J. Knowl. Econ. 2017, 8, 385–406. [Google Scholar] [CrossRef]
  14. Turečková, K. Localization theory of regional development and agglomeration effects: A case study of the ICT sector in the Czech Republic. Geogr. Tech. 2018, 13, 119–129. [Google Scholar] [CrossRef] [Green Version]
  15. Turečková, K.; Nevima, J. Disparities in the sector of information and communication technologies in the Nuts3 regions in the Czech Republic. Acta Acad. Karviniensia 2018, 18, 58–69. [Google Scholar] [CrossRef] [Green Version]
  16. Grabher, G. Cool projects, boring institutions: Temporary collaboration in social context. Reg. Stud. 2002, 36, 205–214. [Google Scholar] [CrossRef]
  17. Asheim, B. Differentiated knowledge bases and varieties of regional innovation systems. Innovation 2007, 20, 223–241. [Google Scholar] [CrossRef]
  18. Blažek, J.; Žížalová, P.; Rumpel, P.; Skokan, K. Where does the knowledge for knowledge-intensive industries come from? The case of biotech in Prague and ICT in Ostrava. Eur. Plan. Stud. 2011, 19, 1277–1303. [Google Scholar] [CrossRef]
  19. van Winden, W.; Carvalho, L. Urbanize or perish? Assessing the urbanization of knowledge locations in Europe. J. Urban Technol. 2016, 23, 53–70. [Google Scholar] [CrossRef] [Green Version]
  20. Zook, M.A. Grounded capital: Venture financing and the geography of the internet industry, 1994–2000. J. Econ. Geogr. 2002, 2, 151–177. [Google Scholar] [CrossRef] [Green Version]
  21. Méndez-Ortega, C.; Arauzo-Carod, J.M. Do software and video game firms share location patterns across cities? Evidence from Barcelona, Lyon and Hamburg. Ann. Reg. Sci. 2019, 1–26. [Google Scholar] [CrossRef]
  22. Asheim, B.T.; Gertler, M.S. The geography of innovation: Regional innovation systems. In The Oxford Handbook of Innovation; Oxford University Press: Oxord, UK, 2004; Volume 3, pp. 53–60. ISBN 3904144987. [Google Scholar]
  23. Plum, O.; Hassink, R. Knowledge bases, innovativeness and competitiveness in creative industries: The case of Hamburg’s video game developers. Reg. Stud. Reg. Sci. 2014, 1, 248–268. [Google Scholar] [CrossRef]
  24. Blažek, J.; Uhlíř, D. Teorie Regionálního Rozvoje; Karolinum: Praha, Czechia, 2011; ISBN 9788024619743. [Google Scholar]
  25. Davids, M.; Frenken, K. Proximity, knowledge base and the innovation process: Towards an integrated framework. Reg. Stud. 2018, 52, 23–34. [Google Scholar] [CrossRef] [Green Version]
  26. Martin, R. Differentiated knowledge bases and the nature of innovation networks. Eur. Plan. Stud. 2013, 21, 1418–1436. [Google Scholar] [CrossRef] [Green Version]
  27. Bathelt, H.; Malmberg, A.; Maskell, P. Clusters and knowledge: Local buzz, global pipelines and the process of knowledge creation. Prog. Hum. Geogr. 2004, 28, 31–56. [Google Scholar] [CrossRef]
  28. Aldieri, L.; Kotsemir, M.N.; Vinci, C.P. Knowledge spillover effects: Empirical evidence from Russian regions. Qual. Quant. 2018, 52, 2111–2132. [Google Scholar] [CrossRef]
  29. Ibert, O. Towards a geography of knowledge creation: The ambivalences between “knowledge as an object” and “knowing in practice”. Reg. Stud. 2007, 41, 103–114. [Google Scholar] [CrossRef] [Green Version]
  30. Boix, R.; Hervás-Oliver, J.L.; De Miguel-Molina, B. Micro-geographies of creative industries clusters in Europe: From hot spots to assemblages. Pap. Reg. Sci. 2015, 94, 753–772. [Google Scholar] [CrossRef]
  31. Strambach, S. Knowledge-intensive business services (KIBS) as drivers of multilevel knowledge dynamics. Int. J. Serv. Technol. Manag. 2008, 10, 152–174. [Google Scholar] [CrossRef] [Green Version]
  32. Asheim, B.T.; Boschma, R.; Cooke, P. Constructing regional advantage: Platform policies based on related variety and differentiated knowledge bases. Reg. Stud. 2011, 45, 893–904. [Google Scholar] [CrossRef]
  33. Pina, K.; Tether, B.S. Towards understanding variety in knowledge intensive business services by distinguishing their knowledge bases. Res. Policy 2016, 45, 401–413. [Google Scholar] [CrossRef] [Green Version]
  34. Jensen, M.B.; Johnson, B.; Lorenz, E.; Lundvall, B.Å. Forms of knowledge and modes of innovation. Res. Policy 2007, 36, 680–693. [Google Scholar] [CrossRef]
  35. Isaksen, A. Knowledge-based clusters and urban location: The clustering of software consultancy in Oslo. Urban Stud. 2004, 41, 1157–1174. [Google Scholar] [CrossRef]
  36. Musil, R.; Eder, J. Towards a location sensitive R&D policy. Local buzz, spatial concentration and specialisation as a challenge for urban planning—Empirical findings from the life sciences and ICT clusters in Vienna. Cities 2016, 59, 20–29. [Google Scholar]
  37. Hutton, T.A. Spatiality, built form, and creative industry development in the inner city. Environ. Plan. A 2006, 38, 1819–1841. [Google Scholar] [CrossRef]
  38. Asheim, B.; Coenen, L.; Vang, J. Face-to-face, buzz, and knowledge bases: Sociospatial implications for learning, innovation, and innovation policy. Environ. Plan. C Gov. Policy 2007, 25, 655–670. [Google Scholar] [CrossRef]
  39. Storper, M.; Venables, A.J. Buzz: Face-to-face contact and the urban economy. J. Econ. Geogr. 2004, 4, 351–370. [Google Scholar] [CrossRef] [Green Version]
  40. Martin, R.; Moodysson, J. Innovation in symbolic industries: The geography and organization of knowledge sourcing. Eur. Plan. Stud. 2011, 19, 1183–1203. [Google Scholar] [CrossRef]
  41. Growe, A. Raummuster unterschiedlicher Wissensformen. Der Einfluss von Transaktionskosten auf Konzentrationsprozesse wissensintensiver Dienstleister im deutschen Städtesystem. Raumforsch. Raumordn. 2012, 70, 175–190. [Google Scholar] [CrossRef]
  42. Rantisi, N.M. The competitive foundations of localized learning and innovation: The case of women’s garment production in New York City. Econ. Geogr. 2002, 78, 441–462. [Google Scholar] [CrossRef]
  43. Grabher, G. Learning in projects, remembering in networks? Communality, sociality, and connectivity in project ecologies. Eur. Urban Reg. Stud. 2004, 11, 103–123. [Google Scholar] [CrossRef]
  44. Christopherson, S. Project work in context: Regulatory change and the new geography of media. Environ. Plan. A 2002, 34, 2003–2015. [Google Scholar] [CrossRef]
  45. Chapain, C.; Stachowiak, K. Innovation dynamic in the film industry: The case of the Soho cluster in London. In Creative Industries in Europe: Drivers of New Sectoral and Spatial Dynamics; Springer: Berlin/Heidelberg, Germany, 2017; pp. 65–94. [Google Scholar]
  46. Storper, M. The Regional World: Territorial Development in a Global Economy; Guildford Press: New York, NY, USA, 1997. [Google Scholar]
  47. Bathelt, H.; Glückler, J. Wirtschaftsgeographie: Ökonomische Beziehungen in Räumlicher Perspektive; Ulmer UTB: Stuttgart, Germany, 2012. [Google Scholar]
  48. Pavlínek, P.; Ženka, J. The 2008–2009 automotive industry crisis and regional unemployment in Central Europe. Camb. J. Reg. Econ. Soc. 2010, 3, 349–365. [Google Scholar] [CrossRef] [Green Version]
  49. Scott, A.J. Creative cities: Conceptual issues and policy questions. J. Urban Aff. 2006, 28, 1–17. [Google Scholar] [CrossRef] [Green Version]
  50. Manniche, J. Combinatorial knowledge dynamics: On the usefulness of the differentiated knowledge bases model. Eur. Plan. Stud. 2012, 20, 1823–1841. [Google Scholar] [CrossRef]
  51. Zandiatashbar, A.; Hamidi, S. Impacts of transit and walking amenities on robust local knowledge economy. Cities 2018, 81, 161–171. [Google Scholar] [CrossRef]
  52. Wood, S.; Dovey, K. Creative multiplicities: Urban morphologies of creative clustering. J. Urban Des. 2015, 20, 52–74. [Google Scholar] [CrossRef]
  53. Rosenthal, S.S.; Strange, W.C. Geography, industrial organization, and agglomeration. Rev. Econ. Stat. 2003, 85, 377–393. [Google Scholar] [CrossRef] [Green Version]
  54. Arzaghi, M.; Henderson, J.V. Networking off madison avenue. Rev. Econ. Stud. 2008, 75, 1011–1038. [Google Scholar] [CrossRef]
  55. Scott, A.J. Entrepreneurship, innovation and industrial development: Geography and the creative field revisited. Small Bus. Econ. 2006, 26, 1–24. [Google Scholar] [CrossRef]
  56. Scott, A.J. The craft, fashion, and cultural-products industries of Los Angeles: Competitive dynamics and policy dilemmas in a multisectoral image-producing complex. Ann. Assoc. Am. Geogr. 1996, 86, 306–323. [Google Scholar] [CrossRef]
  57. Currid, E.; Connolly, J. Patterns of knowledge: The geography of advanced services and the case of art and culture. Ann. Assoc. Am. Geogr. 2008, 98, 414–434. [Google Scholar] [CrossRef]
  58. Sýkora, L. Klasifikace změn v prostorové struktuře poskomunistických měst. Folia Geogr. 2001, 4, 194–204. [Google Scholar]
  59. Hutton, T.A. The New Economy of the Inner City; Elsevier: Amsterdam, The Netherlands, 2004; Volume 21, ISBN 2007029758. [Google Scholar]
  60. Kloosterman, R.C. Window on the netherlands recent employment trends in the cultural industries in Amsterdam. Tijdschr. Voor Econ. En Soc. Geogr. 2004, 95, 243–252. [Google Scholar] [CrossRef] [Green Version]
  61. Brien, L.O.; Jones, C.; Porter, M.E. The competitive advantage of the inner city. Harv. Bus. Rev. 1995, 73, 55–71. [Google Scholar]
  62. Shearmur, R. Scale, distance and embeddedness: Knowledge-intensive business services location and growth in Canada. Knowl.-Intensive Bus. Serv. Geogr. Innov. 2010, 43–74. [Google Scholar]
  63. Credit, K. Transit-oriented economic development: The impact of light rail on new business starts in the Phoenix, AZ Region, USA. Urban Stud. 2018, 55, 2838–2862. [Google Scholar] [CrossRef]
  64. Nachum, L.; Keeble, D. Neo-marshallian clusters and global networks: The linkages of media firms in central London. Long Range Plan. 2003, 36, 459–480. [Google Scholar] [CrossRef]
  65. Florida, R. The economic geography of talent. Ann. Assoc. Am. Geogr. 2002, 92, 743–755. [Google Scholar] [CrossRef]
  66. Trip, J.J. Assessing quality of place: A comparative analysis of Amsterdam and Rotterdam. J. Urban Aff. 2007, 29, 501–517. [Google Scholar] [CrossRef]
  67. Montgomery, J. Cultural quarters as mechanisms for urban regeneration. Part 1: Conceptualising cultural quarters. Plan. Pract. Res. 2003, 18, 293–306. [Google Scholar] [CrossRef]
  68. Oldenburg, R. The Great Good Place: Cafes, Coffee Shops, Bookstores, Bars, Hair Salons, and Other Hangouts at the Heart of a Community; Da Capo Press: Boston, MA, USA, 1999. [Google Scholar]
  69. Heebels, B. Place-making in publishing: Dutch trade book publishers and the meaning of place in establishing reputation and trust. Geoforum 2013, 45, 248–258. [Google Scholar] [CrossRef]
  70. Markusen, A. Urban development and the politics of a creative class: Evidence from a study of artists. Environ. Plan. A 2006, 38, 1921–1940. [Google Scholar] [CrossRef] [Green Version]
  71. Clark, P.J.; Evans, F.C. Distance to nearest neighbor as a measure of spatial relationships in populations published by: Ecological society of America Stable. Ecology 1954, 35, 445–453. [Google Scholar] [CrossRef]
  72. Bontje, M.; Musterd, S. The multi-layered city: The value of old urban profiles. Tijdschr. Voor Econ. En Soc. Geogr. 2008, 99, 248–255. [Google Scholar] [CrossRef]
  73. Coll-Martínez, E. Creativity and the City: Testing the Attenuation of Agglomeration Economies in Barcelona; Springer: Berlin/Heidelberg, Germany, 2019; Volume 43, ISBN 0123456789. [Google Scholar]
  74. Shearmur, R.; Doloreux, D. Knowledge-intensive business services (KIBS) use and user innovation: High-order services, geographic hierarchies and internet use in Quebec’s manufacturing sector. Reg. Stud. 2015, 49, 1654–1671. [Google Scholar] [CrossRef]
  75. Boschma, R.A. Proximity and innovation: A critical assessment. Reg. Stud. 2005, 39, 61–74. [Google Scholar] [CrossRef]
  76. Viturka, M.; Pařil, V.; Tonev, P.; Šašinka, P.; Kunc, J. The metropolisation processes: A case of central Europe and the Czech Republic. Prague Econ. Pap. 2017, 26, 505–522. [Google Scholar] [CrossRef] [Green Version]
  77. Beblavý, M.; Kureková, L.M. Into the first league: The competitive advantage of the antivirus industry in the Czech Republic and Slovakia. Compet. Chang. 2014, 18, 421–437. [Google Scholar] [CrossRef]
  78. Sýkora, L.; Ouředníček, M. Sprawling post-communist metropolis: Commercial and residential suburbanization in Prague and Brno, the Czech Republic. In Employment Deconcentration in European Metropolitan Areas. Market Forces Versus Planning Regulations; Dijst, M., Vázquez, C., Eds.; Springer: Berlin/Heidelberg, Germany, 2007; pp. 209–234. [Google Scholar]
  79. Mulíček, O. Prostorové aspekty současného vývoje brněnské maloobchodní sítě. Urban územní Rozv. 2007, X, 14–20. [Google Scholar]
  80. Bednář, P. The Transformation of Retailing in the City of Ostrava: A Geographical Analysis; Charles University: Prague, Czechia, 2008. [Google Scholar]
  81. Kunc, J.; Martinát, S.; Tonev, P.; Frantál, B. Destiny of urban brownfields: Spatial patterns and perceived consequences of post-socialistic deindustrialization. Transylvanian Rev. Adm. Sci. 2014, 10, 109–128. [Google Scholar]
  82. Ivan, I.; Horák, J.; Zajíčková, L.; Burian, J.; Fojtík, D. Factors influencing walking distance to the preferred public transport stop in selected urban centres of Czechia. GeoScape 2019, 13, 16–30. [Google Scholar] [CrossRef] [Green Version]
  83. Rumpel, P.; Slach, O. Governance of Shrinkage of the City of Ostrava; European Science and Art Publishing: Prague, Czechia, 2012. [Google Scholar]
  84. Sýkora, L.; Bouzarovski, S. Multiple transformations: Conceptualising the post-communist urban transition. Urban Stud. 2012, 49, 43–60. [Google Scholar] [CrossRef] [Green Version]
  85. Zarecor, K.E. What was so socialist about the socialist city? Second world urbanity in Europe. J. Urban Hist. 2018, 44, 95–117. [Google Scholar] [CrossRef]
  86. Czech Statistical Office. Czech Statistical Office Annual Register of Economic Subjects in Selected Production Industries 2010; Czech Statistical Office: Prague, Czechia, 2010. [Google Scholar]
  87. Czech Statistical Office. Czech Statistical Office Annual Register of Economic Subjects in Selected Production Industries 2014; Czech Statistical Office: Prague, Czechia, 2014. [Google Scholar]
  88. Czech Statistical Office. Czech Statistical Office Public Database 2019; Czech Statistical Office: Prague, Czechia, 2019. [Google Scholar]
  89. Stachowiak, K.; Stryjakiewicz, T. The rise of film production locations and specialised film services in European semi-peripheries. Hungarian Geogr. Bull. 2018, 67, 223–237. [Google Scholar] [CrossRef] [Green Version]
  90. Hnát, P.; Sankot, O. European imbalances and shifts of global value chains to the Central European periphery: Role of institutions. AUC Geogr. 2019, 54, 221–231. [Google Scholar] [CrossRef] [Green Version]
  91. Chovanec, M.; Rehák, Š. Exploring spatial patterns of creative industries with firm level micro geographic data. Reg. Direct 2012, 6, 10–35. [Google Scholar]
  92. O’Sullivan, D.; Unwin, D.J. Geographic Information Analysis; John Wiley & Sons: Hoboken, NJ, USA, 2010; p. 432. [Google Scholar]
  93. Duranton, G.; Overman, H.G. Testing for localization using micro-geographic data. Rev. Econ. Stud. 2005, 72, 1077–1106. [Google Scholar] [CrossRef] [Green Version]
  94. Méndez-Ortega, C.; Arauzo-Carod, J.M. Locating software, video game, and editing electronics firms: Using microgeographic data to study barcelona. J. Urban Technol. 2019, 26, 81–109. [Google Scholar] [CrossRef]
  95. Kukuliač, P.; Horák, J. W Function: A new distance-based measure of spatial distribution of economic activities. Geogr. Anal. 2017, 49, 199–214. [Google Scholar] [CrossRef]
  96. Šuleřová, M. Proměny vnitřní struktury Brna z pohledu vlivů globálních trendů. Urban. územní Rozv. 2006, IX, 9–10. [Google Scholar]
  97. Rumpel, P.; Slach, O.; Koutský, J. Creative industries in spatial perspective in the old industrial Moravian-Silesian region. E M Ekon. Manag. 2010, 13, 31–46. [Google Scholar]
  98. Micek, G. Geographical proximity paradox revisited: The case of IT service SMEs in Poland. Sustainability 2019, 11, 5770. [Google Scholar] [CrossRef] [Green Version]
  99. Slach, O.; Koutský, J.; Novotný, J.; Ženka, J. Creative industries in the Czech Republic: A spatial perspective. E M Ekon. Manag. 2013, 16, 14–29. [Google Scholar]
  100. Hlaváček, P.; Markowska, M.; Sobczak, E. Knowledge intensive business services (KIBS) and potential of regions in Visegrad Group countries. In Proceedings of the 22nd International Colloquium on Regional Sciences, Velké Bílovice, Czechia, 12–14 June 2019; Volume 6, pp. 46–52. [Google Scholar]
  101. Pástor, R.; Šipikal, M.; Rehák, Š. Knowledge creation and knowledge acquisition in the software industry in Slovakia: The case study of Košice region. Reg. Sci. Policy Pract. 2013, 5, 401–415. [Google Scholar] [CrossRef]
  102. Rosenfeld, M.T.W.; Hornych, C. Could cities in de-industrialized regions become hot spots for attracting cultural businesses? The case of media industry in Halle an der Saale (Germany). Eur. Plan. Stud. 2010, 18, 371–384. [Google Scholar] [CrossRef]
  103. Kinne, J.; Resch, B. Analyzing and predicting micro-location patterns of software firms. ISPRS Int. J. Geo-Inf. 2018, 7, 1. [Google Scholar] [CrossRef] [Green Version]
  104. Hudeček, T.; Hnilička, P.; Dlouhý, M.; Leňo Cutáková, L.; Leňo, M. Urban structures, population density and municipal expenditures: An empirical study in the Czech Republic. Urban Stud. 2019, 56, 3450–3465. [Google Scholar] [CrossRef]
  105. Slach, O.; Bosák, V.; Krtička, L.; Nováček, A.; Rumpel, P. Urban shrinkage and sustainability: Assessing the nexus between population density, urban structures and urban sustainability. Sustainability 2019, 11, 4142. [Google Scholar] [CrossRef] [Green Version]
  106. Ivan, I.; Raabová, T.; Slach, O.; Žáková, E. Kulturní a kreativní průmysly v Brně a Ostravě: Specializovaná mapa s odborným obsahem; Institut umění – Divadelní ústav: Praha, Czech Republic, 2015. [Google Scholar]
  107. Musil, J.; Ivan, I. Studie o změnách sociálně prostorové struktury Ostravy mezi rokem 1966 a 2010. In Industriální Město V Postindustriální Společnosti, 2. Díl; Accendo: Ostrava, Czechia, 2012. [Google Scholar]
  108. Špačková, P.; Pospíšilová, L.; Ouředníček, M. The long-term development of socio-spatial differentiation in socialist and post-socialist Prague. Sociol. Cas. 2016, 52, 821–860. [Google Scholar] [CrossRef]
  109. Brožovičová, K. Proměny městské části zábrdovice v brně—Možnosti integrace v procesu gentrifikace. Lidé města 2017, 19, 19–38. [Google Scholar]
  110. He, J.L.; Gebhardt, H. Space of creative industries: A case study of spatial characteristics of creative clusters in Shanghai. Eur. Plan. Stud. 2014, 22, 2351–2368. [Google Scholar] [CrossRef]
  111. Wenting, R.; Atzema, O.; Frenken, K. Urban amenities and agglomeration economies? The locational behaviour and economic success of Dutch fashion design entrepreneurs. Urban Stud. 2011, 48, 1333–1352. [Google Scholar] [CrossRef]
  112. Kiroff, L. Auckland and the creative industries: The spatial distribution of the design subsector. Urban Geogr. 2017, 38, 1573–1602. [Google Scholar] [CrossRef]
  113. Branzanti, C. Creative clusters and district economies: Towards a taxonomy to interpret the phenomenon. Eur. Plan. Stud. 2015, 23, 1401–1418. [Google Scholar] [CrossRef]
  114. Tödtling, F.; Skokan, K.; Höglinger, C.; Rumpel, P.; Grillitsch, M. Innovation and knowledge sourcing of modern sectors in old industrial regions: Comparing software firms in Moravia-Silesia and Upper Austria. Eur. Urban Reg. Stud. 2013, 20, 188–205. [Google Scholar] [CrossRef]
  115. Bumberová, V.; Milichovský, F. Sustainability development of knowledge-intensive business services: Strategic actions and business performance. Sustainability 2019, 11, 5136. [Google Scholar] [CrossRef] [Green Version]
  116. Navratil, J.; Krejci, T.; Martinat, S.; Pasqualetti, M.J.; Klusacek, P.; Frantal, B.; Tochackova, K. Brownfields do not “only live twice”: The possibilities for heritage preservation and the enlargement of leisure time activities in Brno, the Czech Republic. Cities 2018, 74, 52–63. [Google Scholar] [CrossRef] [Green Version]
  117. Frantál, B.; Greer-Wootten, B.; Klusáček, P.; Krejčí, T.; Kunc, J.; Martinát, S. Exploring spatial patterns of urban brownfields regeneration: The case of Brno, Czech Republic. Cities 2015, 44, 9–18. [Google Scholar] [CrossRef]
  118. Turečková, K.; Nevima, J.; Škrabal, J.; Martinát, S. Uncovering patterns of location of brownfields to facilitate their regeneration: Some remarks from the Czech Republic. Sustainability 2018, 10, 1984. [Google Scholar] [CrossRef] [Green Version]
Figure 1. L-function for advertising and IT in Praha, Brno and Ostrava. Note.: L-function is a standardized K-function. Source: Reference [86]; (n = 13,697 subjects).
Sustainability 12 01845 g001
Figure 2. Spatial distribution of advertising and IT hubs in Praha. Source: Reference [86]; (IT = 5924 subjects, advertising = 4470 subjects).
Sustainability 12 01845 g002
Figure 3. Spatial distribution of advertising and IT hubs in Brno. Source: Reference [86]; (IT = 1206 subjects, advertising = 774 subjects).
Sustainability 12 01845 g003
Figure 4. Spatial distribution of advertising and IT hubs in Ostrava. Source: Reference [86]; (IT = 494 subjects, advertising = 399 subjects).
Sustainability 12 01845 g004
Table 1. Praha, Brno and Ostrava: Basic characteristics.
PrahaBrnoOstrava
Area (km2)496230214
Population (2019)1309292377319298335
Population density (2018)264016411394
Number of IT firms (2010)7478598115
Number of advertising firms (2010)4432764399
Employment in IT (2010)2586185333873
Employment in advertising (2010)71501072479
Share of IT in employment in [(%, 2014)]7,79,84,5
Share of advertising in employment [(%, 2014)]2,11,00,6
Notes: For 2014, only the share of IT/advertising in the employment in production industries is available. Firm-level data are available only for the year 2010. Source: References [13,86,87,88].
Table 2. Nearest neighbor index for the advertisement and IT clusters.
CityType of ClusterNNIZ-scoreN of Companies
PragueAdvertisement cluster0.485−65.94470
IT cluster0.482−76.25924
BrnoAdvertisement cluster0.517−35.3774
IT cluster0.469−25.71206
OstravaAdvertisement cluster0.552−17.5399
IT cluster0.589−17.1494
Source: The Authors.

