Abstract
Urban buses have energy and environmental impacts because they are mostly equipped with heavy-duty diesel engines, having higher emission factors and pollution levels. This study proposed a mean distribution deviation (MDD) method to identify bus pollutant emissions including CO, CO2, HC, and NOX at road sections, intersections, and bus stops for different fuel types; and explore the changes in emissions for different locations in the road sections, bus stops, and intersection influence areas. Bus speed, acceleration, and emissions data were collected from four fuel types in China. For different locations and fuel types, the differences in emissions were all statistically significant. MDD values for different locations indicated that there were more obvious differences in emissions between road sections and intersections. In addition, heat maps were applied in this study to better understand changes in bus emissions for different locations in the bus stop influence areas, intersection influence areas, and road sections.
1. Introduction
Emissions from motor vehicles are a major source of urban air pollutant emissions, such as nitric oxides, carbon monoxide, hydrocarbons, and carbon dioxide [,,,,]. For instance, relevant research studies indicated that about 45% of the pollutant emissions in the United States were a direct consequence of vehicle operations []. In urban road areas, compared with private motor vehicles, public transportation plays an important role in resident trips and sustainable transportation [,,,,]. By optimizing the public transit infrastructure layout and dispatching schemes, the sharing rate of public transit is increasing significantly in many cities. In the U.S., buses have taken around a 20% share of transit market in recent years []. As for China, public transport also accounted for around half of daily trips in 2018 in many first-tier cities such as Beijing, Shanghai, and Chongqing []. Although emissions and energy consumption per passenger mile of public transportation vehicles are significantly lower than those of other vehicle types [], exhaust fumes from public transportation are still one of the most relevant environmental problems [,,]. Most urban transit buses are equipped with heavy-duty diesel engines, which have higher emission factors and pollution levels [,,,]. To alleviate this shortcoming, there is an increasing number of buses that are switching to use new energy power. The U.S. Federal Transit Administration (FTA) has provided several grants for the purchase of new energy buses []. China has 340,000 new energy buses, which account for around half of the total number of buses []. Because public transportation is being extensively used and the proportion of new energy vehicles in buses is largely increasing, it is necessary to re-estimate the emissions characteristics of public transport vehicles, especially for new energy buses. In particular, intersection and bus stop areas can create congestion and further increase emission rates due to speed changes and stop-and-go operations [,,,]. In light of these considerations, measuring and comparing bus emissions at different locations are one of the emphases of this study.
The first category of vehicle emission analysis methods is aimed at analyzing exhaust fumes for large areas and regions. This kind of emission analysis is regarded as a “macro” scale and is combined with the average values of influencing variables []. The second category aims to develop models to provide more precise knowledge about vehicle emissions in easily identifiable environments, which are called “micro” or “local” scale models. This approach offers the chance to acquire vehicle emissions data in real-world conditions [,]. Zhang et al. investigated the emission characteristics of transportation vehicles using real data []. From the results, the problem of NOX emissions is still confronted with severe challenges. For different locations, the performance of pollutant emissions may vary. In the relevant reference [], approximately half of bus emissions were produced in and around intersection/stop areas. In addition, the use of alternative fuels, such as compressed natural gas, biodiesel, and hybrid technology (diesel/electric) reduced carbon emissions, leading to improved air quality [,,,]. For instance, Dreier et al. found an absolute reduction of 1115 g CO2 per kilometer when using plug-in hybrid-electric city buses []. It should be noted that if the available data and information about the application system and technologies (such as bus emissions) are incomplete, imprecise, and uncertain, then technology identification could be very difficult. Liu et al. introduced a simple yet systematic interval–parameter-based methodology for identifying quickly superior solutions under uncertainty for sustainability performance improvement. The methodology was general enough for the study of sustainability enhancement problems of any size and scope [,].
From the above analysis of the literature review, there are two primary problems that have not been addressed. First of all, the existing research studies fail to adequately compare the emissions changes in road sections, bus stops, and intersection influence areas. In addition, previous studies fail to adequately investigate the different fuel types and make a resulting comparison of bus emissions for them. Under the current urban transit systems, four fuel types of buses are dominant in China: i) diesel engine buses complying with EURO-IV emission standard (EURO-IV bus); ii) compressed natural gas buses (CNG bus); iii) diesel engine buses complying with EURO-V emission standard (EURO-V bus); and iv) gas–electric hybrid electric buses (GEHE bus). The vehicle parameters of GEHE buses include rated power (155@2300 kW@r/min), maximum torque (800@1600 Nm@r/min), energy capacity of the battery (24.85 kWh), and rated voltage (3.7 V). Full-electric buses are not considered in this study, because they are near-zero emission and have no potential influence on the emission results [,]. The emissions will be reduced by about 75% if the fuel is switched from diesel engine buses to hybrid electric buses. However, it is difficult to achieve that all buses in China are GEHE buses, due to budget constraints and different city sizes. According to the relevant references [], in China, the percentage of hybrid electric buses will be 40% to 50% in 2030. In addition, according to the relevant references [,], the main sources of particulate matter (such as PM2.5) in urban areas are soil dust, coal combustion, biomass burning, industrial pollution, and secondary inorganic aerosol, with contributions of 16%, 14%, 13%, 28%, and 26%, respectively. The particulate matter from traffic and waste incineration emission accounts for merely 3%. Thus, particulate matter is not included in this study.
As mentioned above, this study includes the following three tasks: 1) collect the instantaneous data of speed, acceleration, and emissions under real conditions; 2) identify and compare the pollutant emissions at different locations; and 3) utilize heat maps to explore the changes in emissions for bus stop influence areas, intersection influence areas, and road sections, respectively. The structure of the paper is as follows: Section 2 introduces the proposed methodologies and data collection; Section 3 describes the results and performances by comparison and analysis; and Section 4 summarizes the findings of this study.
2. Data and Methods
2.1. T-Test and Mean Distribution Deviation Methods
To explore the changes in emissions at different locations in the bus stop influence area, intersection influence area, and road section, t-test and mean distribution deviation methods were used:
(1) Testing differences in speed, acceleration, and emission values: A t-test was conducted to test the significance of the differences between bus stop influence areas, intersection influence areas, and road sections.
(2) Mean distribution deviation (MDD): This value was calculated by taking the difference in cumulative emission distributions for the two different samples. Higher mean distribution deviation values indicate that there are more obvious differences between the two samples []. It can be expressed as follows:
2.2. Data Collection and Analysis
The research team collected the field data for four bus lines in Zhenjiang, China, and line features were displayed in Figure 1. As seen in Figure 1 and Table 1, these lines were similar in terms of traffic volume, number of lanes, degree of roads, length of lines, number of stops, and line features. Such selected routes consist of major transit corridors, which connect the relatively prosperous districts in the city. In addition, they also penetrate into dwelling districts, filling in the gaps of the backbone of urban bus. The data collection was conducted from 11 to 15 April 2016 under good weather conditions. The field data consisted of two parts: (1) bus vehicle characteristic data include fuel type, vehicle speed, and acceleration; and (2) emission situation data include bus pollutant emissions of carbon monoxide (CO), carbon dioxide (CO2), hydrocarbon (HC), and nitric oxides (NOX). Among them, bus pollutant emissions were measured by an AUTOplus automotive gas emission analyzer unit []. The AUTOplus automotive gas emission analyzer unit was employed to measure the second-by-second gaseous exhaust emissions from vehicle exhaust pipes including CO, HC, NOX, and CO2. Standard calibration gases were used to verify the accuracy of the system before each individual test, and to set the target pollutants to zero. With the help of an automatic vehicle location system, we also collected bus speed and acceleration values every second.
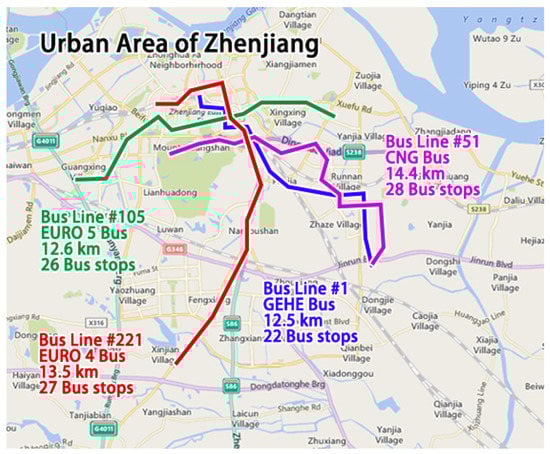
Figure 1.
Experimental routes selected for field data collection.

Table 1.
Characteristics of selected bus lines.
3. Results and Discussion
Table 2 presents the vehicle and emission characteristics for GEHE, CNG, EURO-V, and EURO-IV buses. The speed was calculated by measuring the elapsed time to travel a specific distance (typically approximately 4.5 m). From Table 2, for different fuel types, the performance of pollutant emissions varied. Diesel engine buses complying with EURO-IV and EURO-V emission standards were prone to have higher CO and NOX emissions. On the contrary, CO and NOX levels for compressed natural gas buses were lower, but CO2 and HC levels were higher. By contrast, gas–electric hybrid electric buses performed best, with lowest emission values. In addition, for four fuel types, there was no obvious difference in speed and acceleration, excluding the potential influences of confounding factors on the emission results.
Table 2.
Site, vehicle, and emission characteristics of buses.
A bus stop influence area includes three sections: bus entry area, alighting and boarding areas for passengers, and exit area. In general, a stopped bus will slow from its running speed about 50 m before the bus stop, and accelerate back to its running speed about 30 m after the stop [,]. Thus, in this study, such a range of areas was regarded as the bus stop influence area, as shown in Figure 2a. An intersection influence area was divided into an inside area (D1) and intersection-related area (D2), as shown in Figure 2b. The existing research studies generally designated the road section ranging from a 150 ft (45 m) to a 250 ft (76 m) radius from the center of the intersection as the intersection influence area [,,,,].
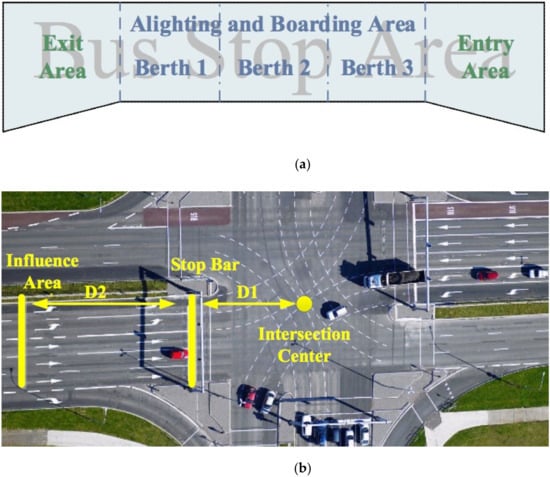
Figure 2.
The structure of the bus stop and intersection influence areas. (a) bus stop influence area, (b) intersection influence area.
The bus emissions and time proportions at road sections, intersection, and bus stop influence areas are shown in Figure 3. The figure shows the total emissions of CO, CO2, HC, and NOX produced in and around bus stops, which accounted for 24%, 20%, 24%, and 17%, respectively, while intersections shared about 30% of all the emissions during the whole trip. Although the road sections accounted for higher proportions of emissions than other locations (with proportions of 46% for CO, 49% for CO2, 45% for HC, and 51% for NOX, respectively), the bus spent much more time on road sections. The findings showed that the emissions at bus stop and intersection influence areas led to a high exposure level of pollution in a short time.
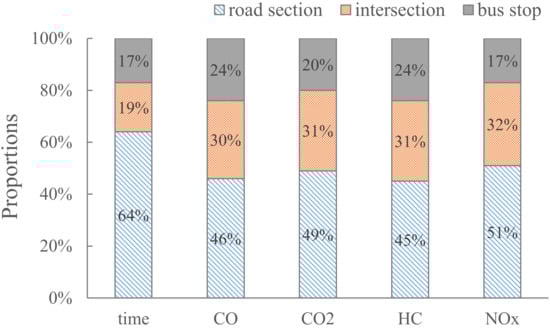
Figure 3.
Bus emissions and time proportions for different locations.
In order to show the differences better, the research team added results of t-tests for the differences in speed, acceleration, and emissions between different fuel types of buses. As seen in Table 3, there was no significant difference in emissions between bus stop influence areas and intersection influence areas, with p-values exceeding 0.050 (varying between 0.087 and 0.357). However, between bus stop influence areas and road segments, or between intersection influence areas and road segments, p-values (<0.050) showed that differences were statistically significant. This may be due to the fact that for intersection and bus stop influence areas, vehicles may conduct a complete stop to wait for traffic signals and service boarding and alighting passengers. Thus, the whole process included cruising, deceleration, idling, acceleration, and cruising modes []. In addition, results of t-tests (p-values < 0.050) displaying the differences between EURO-IV, EURO-V, CNG, and GEHE buses were all statistically significant. The findings showed significant effects of fuel types on bus emissions.
Table 3.
t-Tests for the emission differences in terms of location and fuel type.
A t-test was utilized to judge if there was a significant difference between different fuel types and locations. In order to further explore the degree of difference, mean distribution deviation (MDD) was used in this study—the higher the values, the more obvious the differences. MDD values for different locations and fuel types are compared in Table 4. As seen in Table 4, the MDD values between intersection influence areas and road segments were higher than the values between bus stop influence areas and intersection influence areas, and bus stop influence areas and road sections. The finding indicated that there were more obvious differences in emissions between intersections and road segments. As for different fuel types, however, the performance of MDD values varied. For CO and CO2, the MDD values between GEHE/CNG buses and EURO-IV/EURO-V buses were the highest; and for HC and NOX, the differences between EURO-IV buses and EURO-V buses were the most obvious.
Table 4.
Mean distribution deviation (MDD) values for different locations and fuel types.
In order to better understand changes in bus emissions at the bus stop influence areas, intersection influence areas, and road sections, heat maps were introduced in this study using the measured data of total emissions including CO, CO2, HC, and NOX, as shown in Figure 4 (EURO-IV buses), Figure 5 (EURO-V buses), Figure 6 (CNG buses), and Figure 7 (GEHE buses). To generate a continuous surface from these collected discrete samples, Kriging interpolation was introduced to meet the rigorous demands of practical applications [,]. Choosing the appropriate variogram is the most important step in implementing Kriging interpolation. The spherical variation was applied here because it is the most widely used function of Kriging interpolation and it also basically meets the diffusion characteristics of gas. As shown in Figure 4, Figure 5, Figure 6 and Figure 7, different concentrations of pollutant emissions are depicted by different colors; the deeper the colors, the higher the pollutant emissions. From Figure 4a, Figure 5a, Figure 6a, Figure 7a, the results of the heat maps for bus stop influence areas showed that for different fuel types, the maximum emissions occurred at the bus stops and in the vicinity of them. This is because buses spend a long time conducting a complete stop and serving the alighting and boarding passengers. In addition, the downstream areas generated more emissions than the upstream areas for bus stop influences areas. This may be due to the fact that vehicle emission rates during the acceleration mode are comparatively higher than the deceleration mode. In the acceleration process, the engine needs more fuel to generate enough power to accelerate. The higher the acceleration rates, the more emissions are generated. In the upstream area, using regenerative breaking for the GEHE bus, the energy consumption and pollutant emission can be reduced, but cannot reach zero emissions. For intersection influence areas, as shown in Figure 4b, Figure 5b, Figure 6b, Figure 7b, the upstream areas generated more emissions than the downstream areas. This occurs because buses joining a queue must come to a stop and undergo several stop-and-go cycles until passing the intersection. As a result, emissions increase because of excessive delays and speed change cycles for approaching traffic. In contrast with bus stop and intersection influence areas, there was no obvious difference in emissions at different locations for road sections, as shown in Figure 4c, Figure 5c, Figure 6c, Figure 7c. Figure 8, Figure 9 and Figure 10 compared the average values and standard deviations of emissions for different fuel type buses in each location. It can be seen from the figure that the emission results at different locations were similar. EURO4 buses exhausted more than other types of buses, which indicated that the emissions of EURO5 buses were greatly improved compared to EURO4 buses in all driving conditions. CNG buses emitted slightly more than EURO4 vehicles. The emissions of GEHE vehicles were significantly smaller than other models, only about half of those of EURO4 and CNG buses, and its emissions fluctuated less than other models.
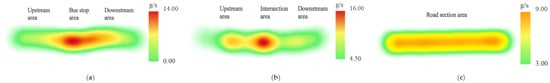
Figure 4.
Heat maps for bus emissions of EURO-IV. (a) Bus stop influence areas, (b) Intersection influence areas, (c) Road sections.
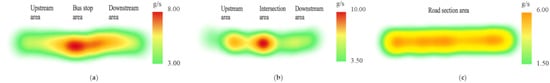
Figure 5.
Heat maps for bus emissions of EURO-V. (a) Bus stop influence areas, (b) Intersection influence areas, (c) Road sections.
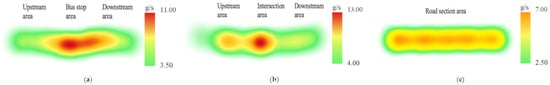
Figure 6.
Heat maps for bus emissions of CNG. (a) Bus stop influence areas, (b) Intersection influence areas, (c) Road sections.
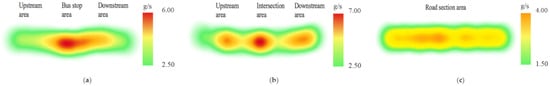
Figure 7.
Heat maps for bus emissions of GEHE. (a) Bus stop influence areas, (b) Intersection influence areas, (c) Road sections.
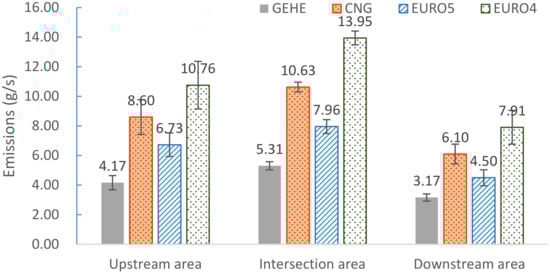
Figure 8.
Bar chart of emissions at intersection for buses with different fuel types.
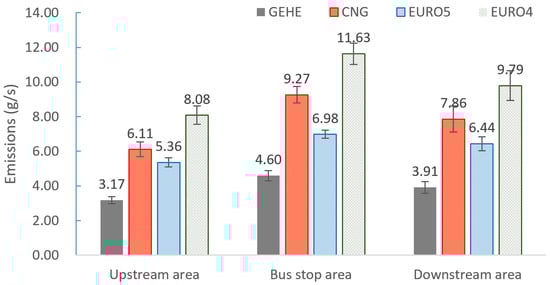
Figure 9.
Bar chart of emissions at bus stop for buses with different fuel types.
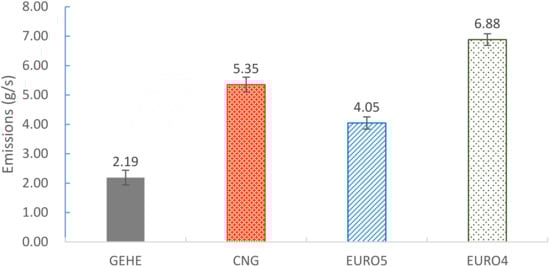
Figure 10.
Bar chart of emissions at road section for buses with different fuel types.
4. Conclusions
This study proposed a mean distribution deviation (MDD) method to evaluate bus emission characteristics at bus stop influence areas, intersection influence areas, and road sections for different fuel types. Three issues were addressed: (1) collection of instantaneous data of speed, acceleration, and emissions under real conditions; (2) identification and comparison of the pollutant emissions at different locations; and (3) utilization of heat maps to explore the changes in emissions for bus stop influence areas, intersection influence areas, and road sections, respectively.
For different locations, no significant difference existed between stop influence areas and intersection influence areas, with p-values varying between 0.087 and 0.357. By contrast, the differences between bus stop influence areas and road segments, and between intersection influence areas and road segments were statistically significant (p-values < 0.050). In addition, results of t-tests (p-values < 0.050) displayed that the differences between EURO-IV, EURO-V, CNG, and GEHE buses were all statistically significant. The findings showed significant effects of fuel types on bus emissions. A t-test was utilized to judge if there was a significant difference between different fuel types and locations (qualitative analysis). In order to further explore the degree of difference (quantitative analysis), MDD was used in this study—the higher the values, the more obvious the differences. MDD values for different locations indicated that there were more obvious differences in emissions between intersections and road segments. For fuel type, the performance of MDD values varied. For CO and CO2, the MDD values between GEHE/CNG buses and EURO-IV/EURO-V buses were the highest; and for HC and NOX, the differences between EURO-IV buses and EURO-V buses were the most obvious.
Furthermore, using the measured data of total emissions, heat maps were introduced to explore changes in emissions for different locations in bus stop influence areas, intersection influence areas, and road sections. To generate a continuous surface from these collected discrete samples, Kriging interpolation was utilized to meet the rigorous demands of practical applications. For bus stop influence areas, from the heat maps, the maximum emissions occurred at the bus stops and in the vicinity of them. Meanwhile, the downstream areas generated more emissions than the upstream areas. For intersection influence areas, however, this trend did not occur. The upstream areas generated more emissions than the downstream areas, because buses joining a queue must come to a stop and undergo several stop-and-go cycles until passing the intersection. In contrast with bus stop and intersection influence areas, for road sections, there was no obvious difference in emissions at different locations. We also compared the average values and standard deviations of bus emissions for different fuel types in each location. It can be seen from the figure that the emission results at different locations are similar. EURO4 buses exhaust more than other types of buses, which indicate that the emissions of EURO5 buses are greatly improved compared to EURO4 buses in all driving conditions. CNG buses emit slightly more than EURO4 vehicles. The emissions of GEHE vehicles are significantly smaller than other models, only about half of those of EURO4 and CNG buses, and its emissions fluctuate less than other models.
From the results of this study, the emissions at bus stop and intersection influence areas led to a high exposure level of pollution in a short time. Therefore, transportation agencies could consider the implementation of countermeasures to control the delay time and update the bus facilities to improve the traffic operations at bus stops and intersections, such as exclusive bus lanes, off-line (bay-style) stops, and GEHE/CNG buses for key areas. Using exclusive bus lanes as an example, relevant research studies showed that delay time and bus speed have obvious impacts on bus emissions. For heavy pollutant emission areas and more than two lanes one way, utilizing exclusive bus lanes could reduce bus delay times by 20%–25%, and further control bus emissions.
With the proposed method, it is feasible to conduct the bus emission comparison for diverse locations and fuel types in China. As for different countries, especially for other developed countries, the bus-operation characteristics may be different. Thus, the proposed method can be applied in other countries; to adapt the method, transportation scholars or agencies will need to collect the traffic data in those countries to obtain the corresponding characteristics, such as the bus travel time for different locations.
In addition, the primary objective in this study was to conduct the bus emission comparison for different fuel types. Thus, the selected routes were similar in terms of traffic volume, number of lanes, degree of roads, length of lines, number of stops, and line features. In order to exclude the impacts of other confounding factors on bus emissions and better explore the emission differences in fuel types, the negative externalities of other modes of transport on public transport emissions have been treated as a control variable. It should be noted that the negative externality of other modes on public transport may also increase the emissions (such as at intersections before traffic signal or during peak hour). This important influencing factor will be considered when we explore the influence of contributing factors and impact degree on bus emissions in future research.
Author Contributions
Conceptualization, C.W.; Data curation, C.W., Z.S.; Formal analysis, C.W., Z.S.; Funding acquisition, Z.Y.; Methodology, C.W., Z.S.; Resources, Z.Y.; Supervision, Z.Y.; Validation, C.W., Z.S.; Writing—original draft, C.W.; Writing—review and editing, Z.S., Z.Y. All authors have read and agreed to the published version of the manuscript.
Funding
National Key Research and Development Program of China under Grant 2018YFB1601000.
Acknowledgments
This study was sponsored by the National Key R&D Program of China (No. 2018YFB1601000).
Conflicts of Interest
There is no conflict of interest.
References
- Wang, C.; Ye, Z.; Wang, W.; Jin, M. Traffic-related heavy metal contamination in urban areas and correlation with traffic activity in China. Transp. Res. Rec. J. Transp. Res. Board 2016, 2571, 80–89. [Google Scholar] [CrossRef]
- Wang, C.; Wu, Y.; Jiang, J.; Zhang, S.; Li, Z.; Zheng, X.; Hao, J. Impacts of load mass on real-world PM1 mass and number emissions from a heavy-duty diesel bus. Int. J. Environ. Sci. Technol. 2015, 12, 1261–1268. [Google Scholar] [CrossRef][Green Version]
- Tong, Y.H.; Hung, W.T.; Cheung, C.S. On-road motor vehicle emissions and fuel consumption in urban driving conditions. J. Air Waste Manag. Assoc. 2000, 50, 543–554. [Google Scholar] [CrossRef]
- Zhang, Y. Analyzing truck fleets’ acceptance of alternative fuel freight vehicles in China. Renew. Energy 2019, 134, 1148–1155. [Google Scholar] [CrossRef]
- Smieszek, M.; Dobrzanska, M.; Dobrzanski, P. Rzeszow as a city taking steps towards developing sustainable public transport. Sustainability 2019, 11, 402. [Google Scholar] [CrossRef]
- Ahn, K.; Rakha, H.; Trani, A.; van Aerde, M. Estimating vehicle fuel consumption and emissions based on instantaneous speed and acceleration levels. J. Transp. Eng. 2002, 128, 182–190. [Google Scholar] [CrossRef]
- Yuan, Y.; Yang, M.; Wu, J.; Rasouli, S.; Lei, D. Assessing bus transit service from the perspective of elderly passengers in Harbin, China. Int. J. Sustain. Transp. 2019, 13, 761–776. [Google Scholar] [CrossRef]
- Ji, Y.; Ma, X.; Yang, M.; Jin, Y.; Gao, L. Exploring spatially varying influences on metro-bikeshare transfer: A geographically weighted Poisson regression approach. Sustainability 2018, 10, 1526. [Google Scholar] [CrossRef]
- Ji, Y.; Fan, Y.; Ermagun, A.; Cao, X.; Wang, W.; Das, K. Public bicycle as a feeder mode to rail transit in China: The role of gender, age, income, trip purpose, and bicycle theft experience. Int. J. Sustain. Transp. 2017, 11, 308–317. [Google Scholar] [CrossRef]
- Fu, X.; Lam, W.H.K. Modelling joint activity-travel pattern scheduling problem in multi-modal transit networks. Transportation 2018, 45, 23–49. [Google Scholar] [CrossRef]
- Zhang, L.; Lu, J.; Yue, X.; Zhou, J.; Li, Y.; Wan, Q. An auxiliary optimization method for complex public transit route network based on link prediction. Mod. Phys. Lett. B 2018, 32, 1850066. [Google Scholar] [CrossRef]
- Rodrigue, J.P. Urban Mobility. In The Geography of Transport Systems; Routledge Publishing: New York, NY, USA, 2020; ISBN 978-0-367-36463-2. [Google Scholar]
- Li, G. Green Transportation Mode Trend Report. Available online: https://m21jingji.com/article/20180207/b1ec6afcb398d41c846d1a28887ef938.html (accessed on 7 December 2018).
- Updated Comparison of Energy Use & Emissions from Different Transportation Modes. Available online: http://www.trb.org/Main/Blurbs/170644.aspx (accessed on 27 February 2020).
- Bel, G.; Holst, M. Evaluation of the impact of bus rapid transit on air pollution in Mexico City. Transp. Policy 2018, 63, 209–220. [Google Scholar] [CrossRef]
- Pan, Y.; Chen, S.; Qiao, F.; Ukkusuri, S.V.; Tang, K. Estimation of real-driving emissions for buses fueled with liquefied natural gas based on gradient boosted regression trees. Sci. Total Environ. 2019, 660, 741–750. [Google Scholar] [CrossRef]
- Xu, X.; Lv, X.; Han, L. Carbon asset of electrification: Valuing the transition from fossil fuel-powered buses to battery electric buses in Beijing. Sustainability 2019, 11, 2749. [Google Scholar] [CrossRef]
- Yu, Q.; Li, T. Evaluation of bus emissions generated near bus stops. Atmos. Environ. 2014, 85, 195–203. [Google Scholar] [CrossRef]
- Song, G.; Zhou, X.; Yu, L. Delay correction model for estimating bus emissions at signalized intersections based on vehicle specific power distributions. Sci. Total Environ. 2015, 514, 108–118. [Google Scholar] [CrossRef]
- Wang, C.; Ye, Z.; Yu, Y.; Gong, W. Estimation of bus emission models for different fuel types of buses under real conditions. Sci. Total Environ. 2018, 640–641, 965–972. [Google Scholar] [CrossRef]
- Shan, X.; Chen, X.; Jia, W.; Ye, J. Evaluating urban bus emission characteristics based on localized MOVES using sparse GPS data in Shanghai, China. Sustainability 2019, 11, 2936. [Google Scholar] [CrossRef]
- U.S. Electric Bus Market. Available online: https://www.psmarketresearch.com/market-analysis/us-electric-bus-market (accessed on 29 September 2019).
- Green Travel Promotion Month 2019 and Public Transport Travel Promotion Week 2019 Launch Ceremony Held in Tianjin. Available online: http://www.ggj.gov.cn/xwzx/ggjxw/201909/t20190917_28939.html (accessed on 12 February 2020).
- Li, J.; Gupta, S.D.; Zhang, L.; Zhou, K.; Zhang, W. Evaluate bus emissions generated near far-side and near-side stops and potential reduction by ITS: An empirical study. Transp. Res. Part. D 2012, 17, 73–77. [Google Scholar] [CrossRef]
- Moore, A.M.; Figliozzi, M.; Monsere, C.M. Bus stop air quality: An empirical analysis of exposure to particulate matter at bus stop shelters. In Proceedings of the 91st Transportation Research Board Annual Meeting, Washington, DC, USA, 22–26 January 2012. [Google Scholar]
- Lv, J.; Zhang, Y. Effect of signal coordination on traffic emission. Transp. Res. Part. D 2012, 17, 149–153. [Google Scholar] [CrossRef]
- Du, M.; Cheng, L. Better understanding the characteristics and influential factors of different travel patterns in free-floating bike sharing: Evidence from Nanjing, China. Sustainability 2018, 10, 1244. [Google Scholar] [CrossRef]
- López-Martínez, J.M.; Jiménez, F.; Páez-Ayuso, F.J.; Flores-Holgado, M.N.; Arenas, A.N.; Arenas-Ramirez, B.; Aparicio-Izquierdo, F. Modelling the fuel consumption and pollutant emissions of the urban bus fleet of the city of Madrid. Transp. Res. Part. D 2017, 52, 112–127. [Google Scholar] [CrossRef]
- Liu, D.; Lou, D.; Liu, J.; Fang, L.; Huang, W. Evaluating nitrogen oxides and ultrafine particulate matter emission features of urban bus based on real-world driving conditions in the Yangtze River Delta Area, China. Sustainability 2018, 10, 2051. [Google Scholar] [CrossRef]
- Zhang, Q.; Wu, L.; Yang, Z.; Zou, C.; Liu, X.; Zhang, K.; Mao, H. Characteristics of gaseous and particulate pollutants exhaust from logistics transportation vehicle on real-world conditions. Transp. Res. Part. D 2016, 43, 40–48. [Google Scholar] [CrossRef]
- American Public Transportation Association. More than 35% of Public Transit Buses Use Alternative Fuels or Hybrid Technology Transit News. Available online: http://www.apta.com/mediacenter/pressreleases/2013/Pages/130422_Earth-Day.aspx (accessed on 22 April 2013).
- Bitzan, D.J.; Ripplinger, D.G. Public transit and alternative fuels-The costs associated with using biodiesel and CNG in comparison to diesel for U.S. public transit systems. Transp. Res. Part. A 2016, 94, 17–30. [Google Scholar] [CrossRef]
- Sun, Z.; Wang, C.; Ye, Z.; Bi, H. Long short-term memory network-based emission models for conventional and new energy buses. Int. J. Sustain. Transp. 2020. [Google Scholar] [CrossRef]
- Bak, B.D.; Bak, J.S.; Kim, S.Y. Strategies for implementing public service electric bus lines by charging type in Daegu Metropolitan city, South Korea. Sustainability 2018, 10, 3386. [Google Scholar] [CrossRef]
- Dreier, D.; Silveira, S.; Khatiwada, D.; Fonseca, K.V.O.; Nieweglowski, R.; Schepanski, R. Well-to-Wheel analysis of fossil energy use and greenhouse gas emissions for conventional, hybrid-electric and plug-in hybrid-electric city buses in the BRT system in Curitiba, Brazil. Transp. Res. Part. D 2018, 58, 122–138. [Google Scholar] [CrossRef]
- Liu, Z.; Huang, Y. Technology evaluation and decision making for sustainability enhancement of industrial systems under uncertainty. AIChE J. 2012, 58, 1841–1852. [Google Scholar] [CrossRef]
- Nocera, S.; Galati, O.I.; Cavallaro, F. On the uncertainty in the economic evaluation of carbon emissions from transport. J. Transp. Econ. Policy 2018, 52, 68–94. [Google Scholar]
- Yulianto, A.M.; Simic, D.; Taylor, P. Trivailo. Modelling of full electric and hybrid electric fuel cells buses. Procedia Comput. Sci. 2017, 112, 1916–1925. [Google Scholar] [CrossRef]
- Herrera, I.V.; Milo, A.; Gaztanage, H.; Camblong, H. Multi-objective optimization of energy management and sizing for a hybrid bus with dual energy storage system. In Proceedings of the IEEE Vehicle Power and Propulsion Conference (VPPC), Hangzhou, China, 17–20 October 2016. [Google Scholar]
- Fu, Z.; Sun, Y.; Weng, M.; He, H. Strategic Research on Transportation Power; China Communication Press: Beijing, China, 2019. [Google Scholar]
- Zhang, R.; Jing, J.; Tao, J.; Hsu, S.C.; Wang, G.; Gao, J.; Lee, C.S.L.; Zhu, L.; Chen, Z.; Zhao, Y.; et al. Chemical characterization and source apportionment of PM2.5 in Beijing: Seasonal perspective. Atmos. Chem. Phys. 2013, 13, 7053–7074. [Google Scholar] [CrossRef]
- Wang, C.; Ye, Z.; Wang, X.; Li, W. Effects of speed-control measures on the safety of unsignalized midblock street crossings in China. Traffic Inj. Prev. 2017, 18, 774–779. [Google Scholar] [CrossRef]
- Shahinian, V.D. On-Vehicle Diesel Emission Analyzer: Semtech-DS User Manual: Revision 1.14; Elsevier: Alpharetta, GA, USA, 2007. [Google Scholar]
- Wang, C.; Ye, Z.; Wang, Y.; Xu, Y.; Wang, W. Modeling bus dwell time and time lost serving stop in China. J. Public Transp. 2016, 19, 55–77. [Google Scholar] [CrossRef][Green Version]
- Wang, C.; Ye, Z.; Chen, E.; Xu, M.; Wang, W. Diffusion approximation for exploring the correlation between failure rate and bus-stop operation. Transp. A Transp. Sci. 2019, 15, 1306–1320. [Google Scholar] [CrossRef]
- Wang, X.; Abdel-Aty, M.; Nevarez, A.; Santos, B.J. Investigation of safety influence area for four-legged signalized intersections: Nationwide survey and empirical inquiry. Transp. Res. Rec. J. Transp. Res. Board 2008, 2083, 86–95. [Google Scholar] [CrossRef]
- Mitra, S.; Washington, S.P.; van Schalkwyk, I. Important omitted spatial variables in safety models: Understanding contributing crash causes at intersections. In Proceedings of the 86th Annual Meeting of the Transportation Research Board, Washington, DC, USA, 21–25 January 2007. [Google Scholar]
- Liu, P.; Wu, J.; Zhou, H.; Bao, J. Estimating queue length for contraflow left-turn lane design at signalized intersections. J. Transp. Eng. 2019, 145, 04019020. [Google Scholar] [CrossRef]
- Guo, Y.; Liu, P.; Wu, Y.; Chen, J. Evaluating how right-turn treatments affect right-turn-on-red conflicts at signalized intersections. J. Transp. Saf. Secur. 2018, 2018, 1–22. [Google Scholar] [CrossRef]
- Chen, J.; Li, Z.; Wang, W.; Jiang, H. Evaluating bicycle-vehicle conflicts and delays on urban streets with bike lane and on-street parking. Transp. Lett. Int. J. Transp. Res. 2018, 10, 1–11. [Google Scholar] [CrossRef]
- Sampson, P.D.; Richards, M.; Szpiro, A.A.; Bergen, S.; Sheppard, L.; Larson, T.V.; Kaufman, J.D. A regionalized National Universal Kriging Model Using Partial Least Squares Regression for Estimating Annual PM2.5 Concentrations in Epidemiology. Atmos. Environ. 2013, 75, 383–392. [Google Scholar] [CrossRef]
© 2020 by the authors. Licensee MDPI, Basel, Switzerland. This article is an open access article distributed under the terms and conditions of the Creative Commons Attribution (CC BY) license (http://creativecommons.org/licenses/by/4.0/).