Article

Empirical Evaluation of the Impact of Resilience and Sustainability on Firms’ Performance

1
Department of Sciences and Methods for Engineering, University of Modena and Reggio Emilia, Via Amendola 2–Padiglione Morselli, Reggio Emilia, 42100 Modena, Italy
2
Mona School of Business and Management, The University of the West Indies, Mona 876, Jamaica
3
UQ Business School, The University of Queensland, Brisbane, QLD 4072, Australia
*
Author to whom correspondence should be addressed.
Sustainability 2020, 12(5), 1742; https://doi.org/10.3390/su12051742
Submission received: 31 January 2020 / Revised: 19 February 2020 / Accepted: 24 February 2020 / Published: 26 February 2020

Abstract

:
The concepts of resilience and sustainability appear multi-dimensional and correlated, depending on the context. Operational sustainability practices can enhance the resilience of a firm, and support its growth. This study aims at analyzing the impact of a sustainability strategy, measured by means of a sustainability maturity index (SMI), on the financial performance of a company. Since the SMI is strictly correlated to resilience capabilities, the performed analysis represents a first level integration of the sustainability and resilience indicators in a common framework. A data sample from 53 organizations was collected through structured interviews and analyzed to identify possible relationships between the SMI and the financial performance indexes. The analysis does not support commonly reported arguments: we show that profitability does not show a significant relationship with sustainable strategic intent. Interestingly, firm country of origin, size of the organization, and market focus, likewise, do not have a significant relationship with SMI. Arguably, multi-dimensional company performance, including both financial and non-financial measures, should be considered to assess the impact of sustainability practices. Moreover, further investigations are needed to capture firms’ nonfinancial indicators of performance that are related to sustainability and resilience, for building up a unified framework enabling trade-off analysis.

1. Introduction

Resilience and sustainability are multifaceted paradigms that are defined depending on the field of application [1,2]. As a general concept, sustainability deals with reducing negative impacts on environment—both business and natural—resilience captures adaptation and recovery from imposed change. Drawing from the literature, the two concepts are related, sharing similar goals and some common approaches, even if the range of the relationship extends to considering them as synonyms, to regarding them as distinct notions [3]. At a small scale there are trade-offs between sustainability and resilience [4] that should be analyzed building up a common framework [5]. In the fields of business management and supply chain management, sustainability is considered a component of resilience, that is, increasing sustainability of the system makes the system more resilient.
We argue that the principles of operational sustainability, should embrace economic, environmental and social impacts of a company’s operations, can improve the resilience of the company, supporting its growth and survival.
This research identifies the sustainable maturity index (SMI), derived from populating an operations sustainability maturity model (OSMM), using data from different industry sectors and countries. The SMI measures the company sustainability intent and progress along a maturity trajectory. Our sustainability model includes a set of common resilience indicators, supporting the hypothesis that sustainability practices result in improved resilience performance [6].
The aim of the paper is twofold: it addresses a gap in the literature, and explores the notion that any company that has a strategy to improve its SMI may not necessarily financially benefit from improved resources utilization, such as operating income, return on assets (ROA), return on equity (ROE), and earnings before tax (EBT); although, as frequently proffered, these should be consequences of sustainable [7]. It also represents a first-level integration of the sustainability and resilience indicators in a common framework, to investigate the relationship between resilience capabilities and firms’ financial performance.
The paper begins by overviewing the relationship among resilience, sustainability practices and firms’ performance in Section 2; then, Section 3 describes the research methodology, Section 4 presents the research results and Section 5 discusses the results.

2. Resilience, Sustainability, and Firms’ Performance Relationship: An Overview

The concepts of resilience and sustainability are considered strictly correlated [7]. However, the multidimensionality of the two concepts, the different definitions and fields of applicability bring about a complex relationship that can vary depending on the context [8].
Essentially, resilience can be defined as the capacity of a system to absorb disturbances while retaining its structure and function [9]. However, its definition strongly depends on the domain of application [10,11] and there is not a common view on how resilience can be measured [12] since it is a complex multidimensional socio-technical phenomenon [13]. Moreover, many definitions overlap with other concepts such as, among others, robustness, fault-tolerance, flexibility, survivability, and agility [2]. Engineering resilience draws attention to the ability of a resilient system to return to its pre-disturbance state as quickly as possible [14], implying a focus on efficiency of function [15]. It contributes to organizational resilience, which focus on the adaptive capacity of the organizations and is a dynamic process that implies the ability of developing capabilities to face new situations [13].
Hollnagel [16] considers resilience as a functional characteristic of a system, referring to a system’s resilient performance rather than a system’s resilience; in this perspective resilience magnitude cannot be measured in a simply way. Conversely, companies willing to invest to become more resilient need to evaluate progress [17].
The complexity of defining a metric for analyzing and measuring the resilience of organizations or engineering systems is mainly due to the diversity of domains and objectives [10,15]. There is not a widely accepted methodology for organizational or engineering resilience assessment [18,19]: different approaches can be found in the literature. Hosseini et al. [2] provide a classification of the qualitative and quantitative metrics, focusing on engineering systems: qualitative assessment approaches include the definition of a conceptual framework and the aggregation of expert opinion along multiple dimensions into an index; quantitative assessment can involve the comparison of the system’s performance before and after the disrupting event or the analysis through the definition of structural models. Similarly, organizational resilience is assessed in the literature by developing models or by identifying, quantifying, and ranking proper indicators [20].
A challenge in defining resilience-related metrics is to ensure that these metrics are relevant to the main goals and objectives of the organization [15].
For companies with a strong approach to sustainability, the pursued goals are consistent with resilience goals, so sustainability indicators can be used as guiding indicators accounting for the resilience of the organization [6]. In the fields of business management and supply chain management, sustainability is commonly considered a contributing factor to resilience, as illustrated in Figure 1. This means that sustainable-enhanced systems recover quicker in response to disturbances. In this context, the resilience can be viewed as the capacity of maintaining some primary goals or functionalities (e.g., profit, safety, performance) during and after disturbances [8].
Sustainability measures can identify in management practices, an intrinsic approach to resilience [21].
Moreover, the development of business continuity strategies can be built on a continuous management set of responsibilities, structures and activities [9,22], such as operational sustainability. A wide debate is ongoing with regard to sustainability’s definition in the field of operations management [23]. We define the operational sustainability as a state of operational maintenance and viability that demonstrates the inclusion of a corporation’s economic, social, and environmental performance which then reflects the value created from the optimal use of resources, the responsibility upheld towards the community’s well-being, and the conservation efforts from responsible decision-making [2]. The concept considers simultaneously economic, environmental and social impacts of a company’s operations, in a triple bottom line approach, as well as the interactions with stakeholders. The principles of operational sustainability are key factors to provide a prompt and dynamic response to frequent and unpredictable changes, and provide support to firms’ growth and survival contributing to organizations’ resilience [19].
According to Lee et al. [13], metrics for measuring and evaluating organizational resilience should contribute to, among others, the need to link improvements in organizational resilience with competitiveness. Prayag et al. [24] demonstrate that the adaptive component of organizational resilience is a significant predictor of financial performance for tourism firms, while Gunasekaran et al. [25] observe how the capacity of generating capital influence the resilience of SMEs. On the other hand, the impact analysis of a strategy based on operational sustainability practices can be measured through financial performance [23,26].
A growing interest in investigating the relationship between corporate sustainable practices and financial performance has developed over the last two decades, and a number of recent literature reviews try to summarize the research results on this issue, to draw consistent conclusions. Contradictory results are reported by review papers, highlighting a lack of consensus among research studies [27].
Alshehhi et al. [28] found that 78% of analyzed publications report a positive relationship between corporate sustainability and financial performance. The authors argued that results can be influenced by the sustainability definition, if the environmental or the social dimension is emphasized, by research methodology and the considered variables. In addition, the industry sector, firm size or the examined market seem to impact on the results. A meta-analysis of the correlations between sustainable operations practices (SOP) and firms’ performance has been performed by D’Agostini et al. [14]. In the study, after a systematic literature review, 15 selected SOP are compared with environmental, economic, operational and organizational performance. On an aggregated basis, a positive relationship has been identified, even if moderating factors influence 12 of the relationships.
Firms’ financial performance is measured both through accounting-based and market-based indexes. Accounting-based measures are considered less noisy than market-based indicators that can be influenced by market perceptions or speculations [29]. The most used accounting-based variables are return on assets (ROA) and return on equity (ROE) [30]. Financial performance is also correlated to innovation, a capability supporting firms’ resilience since it enables organizations to renew over time, foresee changes and proactively learn [31,32]. A wide selection of quantitative methodologies is adopted in the literature to investigate the relationship between sustainable practices and financial performance, such as partial least square, structural equation modeling, correlation and regression analysis, and analysis of variance [33]. The methodology approach varies widely among studies; most of the articles use regression analysis [28].
Some studies demonstrate how sustainable practices are linked in complex ways to financial performance [34], since they produce also other performance outcomes such as corporate reputation, customer satisfaction, long-term shareholders, and stakeholders’ value. Thus, a multi-dimensional company performance should be considered [31], including both financial and non-financial measures. Moreover, research suggests that sustainability and resilience indicators should be combined into a unified framework to provide a more comprehensive understanding of the relevant capabilities [3] and to align the objectives of sustainability and resilience to gather the benefits of both the practices [35].

3. Methodology

The research methodology comprises a literature review on sustainability goals and practices within companies to develop a conceptual framework (the operations sustainability maturity model—OSMM), structured interviews and statistical analysis.

3.1. Operations Sustainability Maturity Model and SMI Definition

An operations sustainability maturity model was developed [22]. It allowed measurement of the corporate sustainability intent and progress along a maturity trajectory through the definition of a sustainability maturity index (SMI), described in detail in [22] and [26]. The initial testing of the methodology, generalizability and rigor of the OSMM was conducted in financial services organizations, located in developed and developing countries [22]. The introduced SMI accounts for the multi-dimensionality of the operational sustainability in companies. Five domains were considered:
  • Corporate sustainability (CS). Reflecting the extent of the economic, social and environmental value being created from the optimal use of resources, the responsibility upheld towards the community’s well-being and the conservation efforts from responsible decision-making.
  • Economic capital (EC). An illustration of the organization’s efforts in instigating value-creating strategies, resource optimization and creating value-adding activities.
  • Societal capital (SC). An accumulation of the corporation’s public networks and social relations in the community in which it operates. It can be acquired through the corporation’s efforts to address societal concerns and the maximizing of social benefits to the community.
  • Human capital (HC). An accumulation of knowledgeable, skillful, and competent individuals in the corporation. Human capital can be acquired through the corporation’s efforts to encourage internal and external learning, and the building of internal loyalty.
  • Natural capital (NC). An illustration of its conservation efforts aimed to reduce environmental impacts and initiation of responsible decision-making to promote or maintain the well-being of the planet.
Each domain was numerically assessed against a scale of 1 to 5 to indicate relative progression towards to an optimum maturity and the aggregated metric indicated the SMI.

3.2. Questionnaire Design

To evaluate the SMI within companies, a questionnaire was designed following the procedure described in [22]. It included 95 items, split into five sections each of one aimed at measuring one domain of operations sustainability: corporate sustainability (34 items), the economic capital (19 items) domain, societal capital (12 items), human capital (22 items) and natural capital (8 items). An additive score was calculated for each sustainability domain and for the SMI.

3.3. Interview Structure

Interviews were conducted during a three-years period, from February 2017 to September 2019, at 53 companies’ headquarters. The questionnaires were also submitted to executives and managers, as they play a prominent role in developing of sustainability. Each company agreed in writing to be part of this research if their anonymity could be guaranteed. In addition to the surveys, qualitative information was also recorded for each organization, since during the panel interviews, often taking several hours, the topic of operational sustainability generated a wide range of discussion. The 53 companies’ span seven SIC sector classification and are located in Australia, Italy, Jamaica, the UK, Marshall Islands, the Republic of Kiribati, and Tuvalu. Table A1 in Appendix A shows their profiles. As Table A1 illustrates, the companies differ by capital size, market focus and financial performance. Moreover, they belong to different geographic regions, allowing meta-analysis by country, SIC, and development. The current data set represents early development of the research; with selection of organizations and country of origin being arbitrary, and accessible.

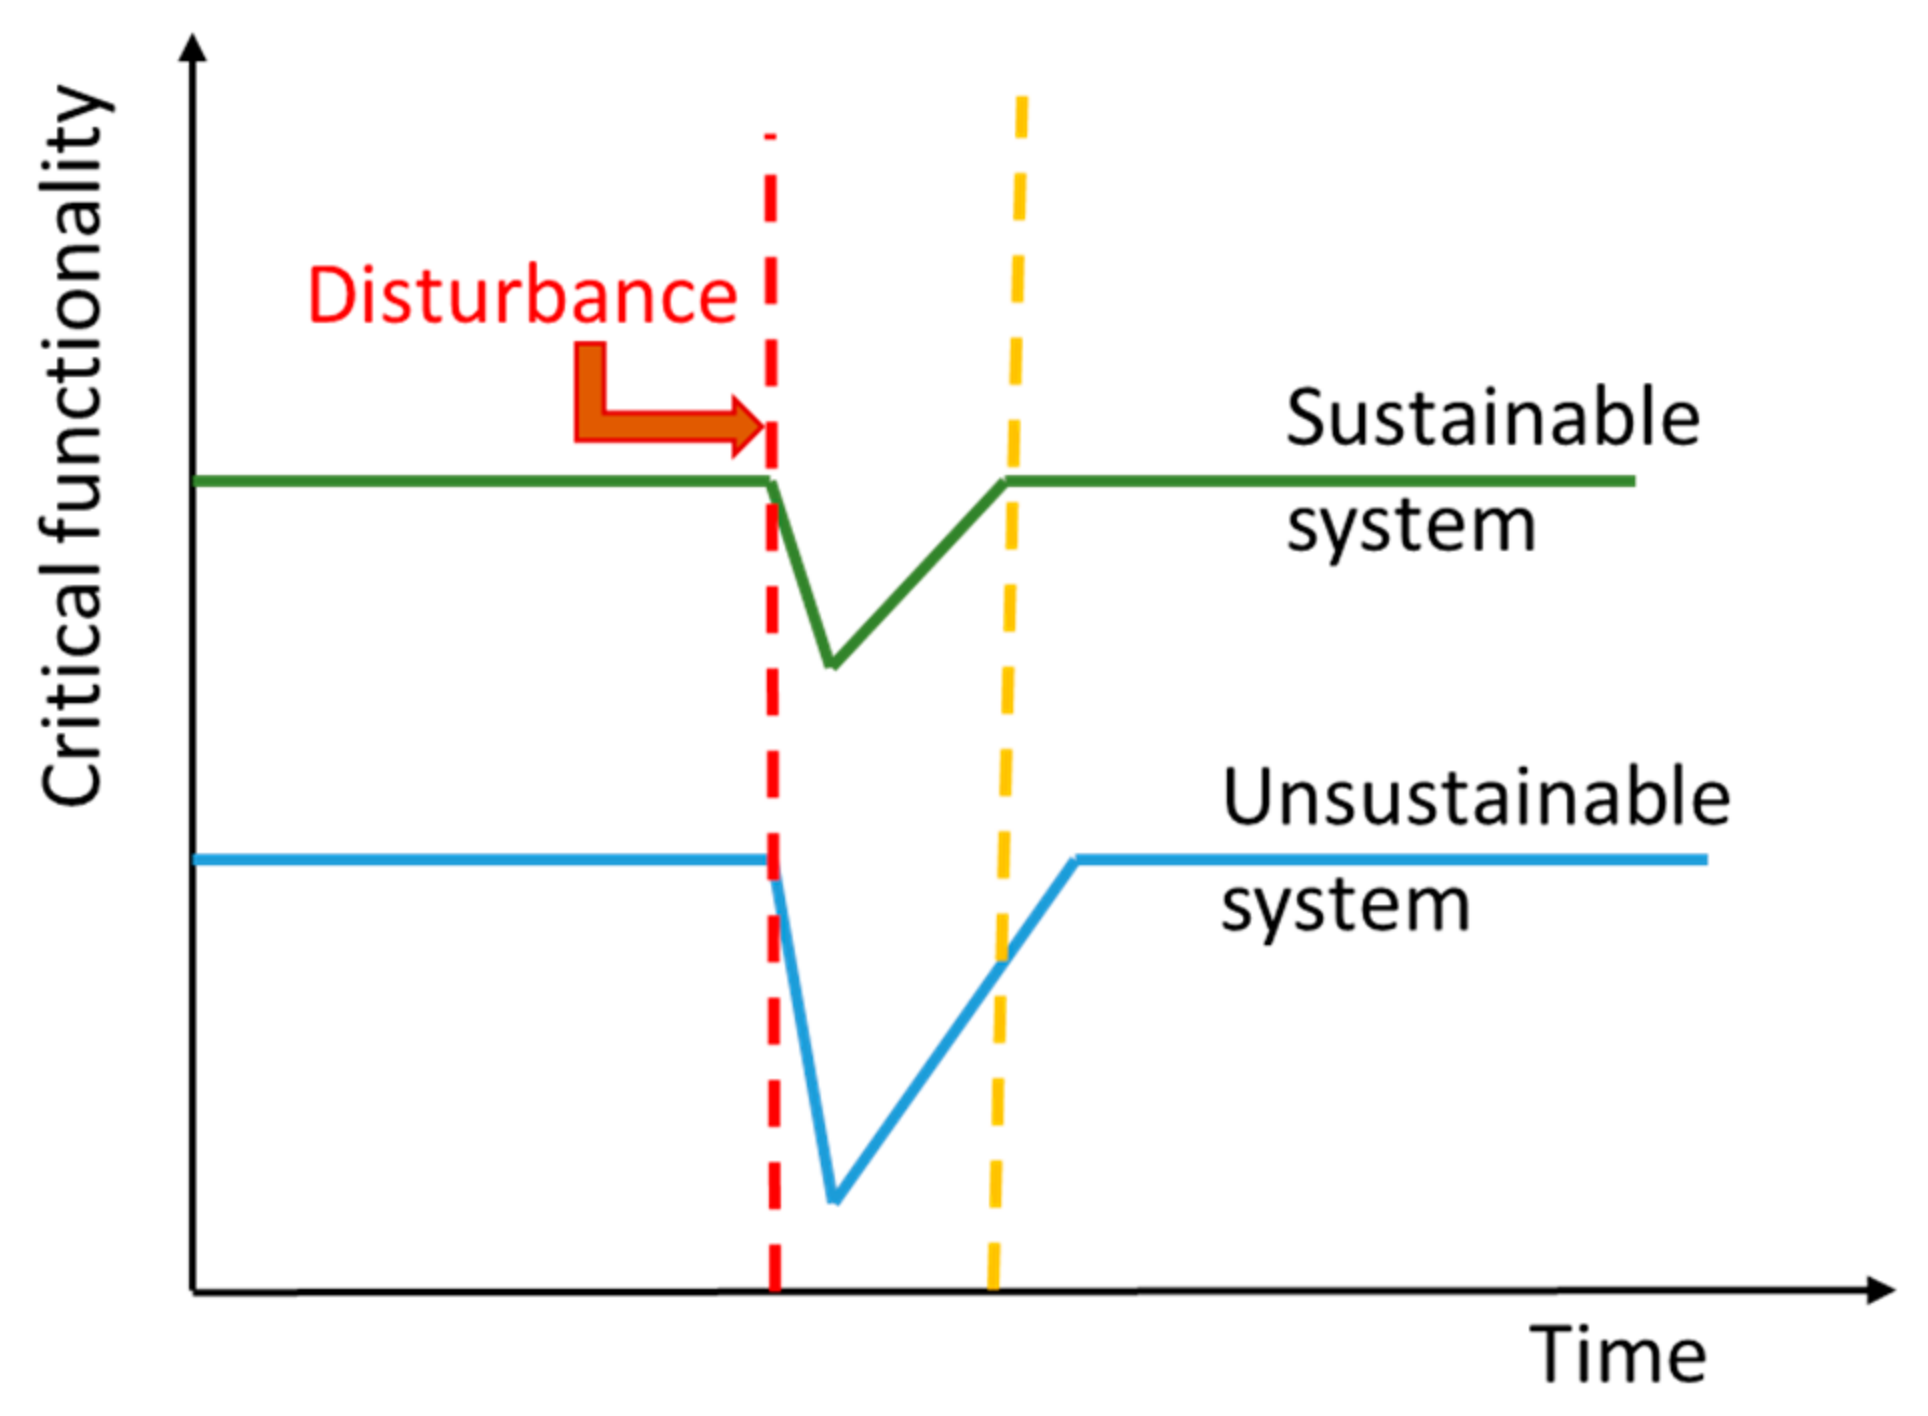
3.4. OSMM as a Resilience Driver

As the literature review identified, sustainability and resilience both focus on system survivability, sharing common goals and research methodologies [8]. Our OSMM framework includes items directly related to resilience indicators and capabilities, as reported in the literature. Table 1 lists the items and the source of the corresponding resilience indicators.
We assume that the sustainable operations defined in our model impacts positively on the resilience of the investigated companies. Thus, the potential impact of sustainable practices on financial performance should be compatible, on first approximation, with an impact of resilience capabilities on competitiveness.

3.5. Statistical Analysis

The data were analyzed to identify possible relationships between the SMI and the financial indexes. The main techniques used were:
  • Principal component analysis (PCA).
  • Simple linear regression.
  • Simple robust linear regression.
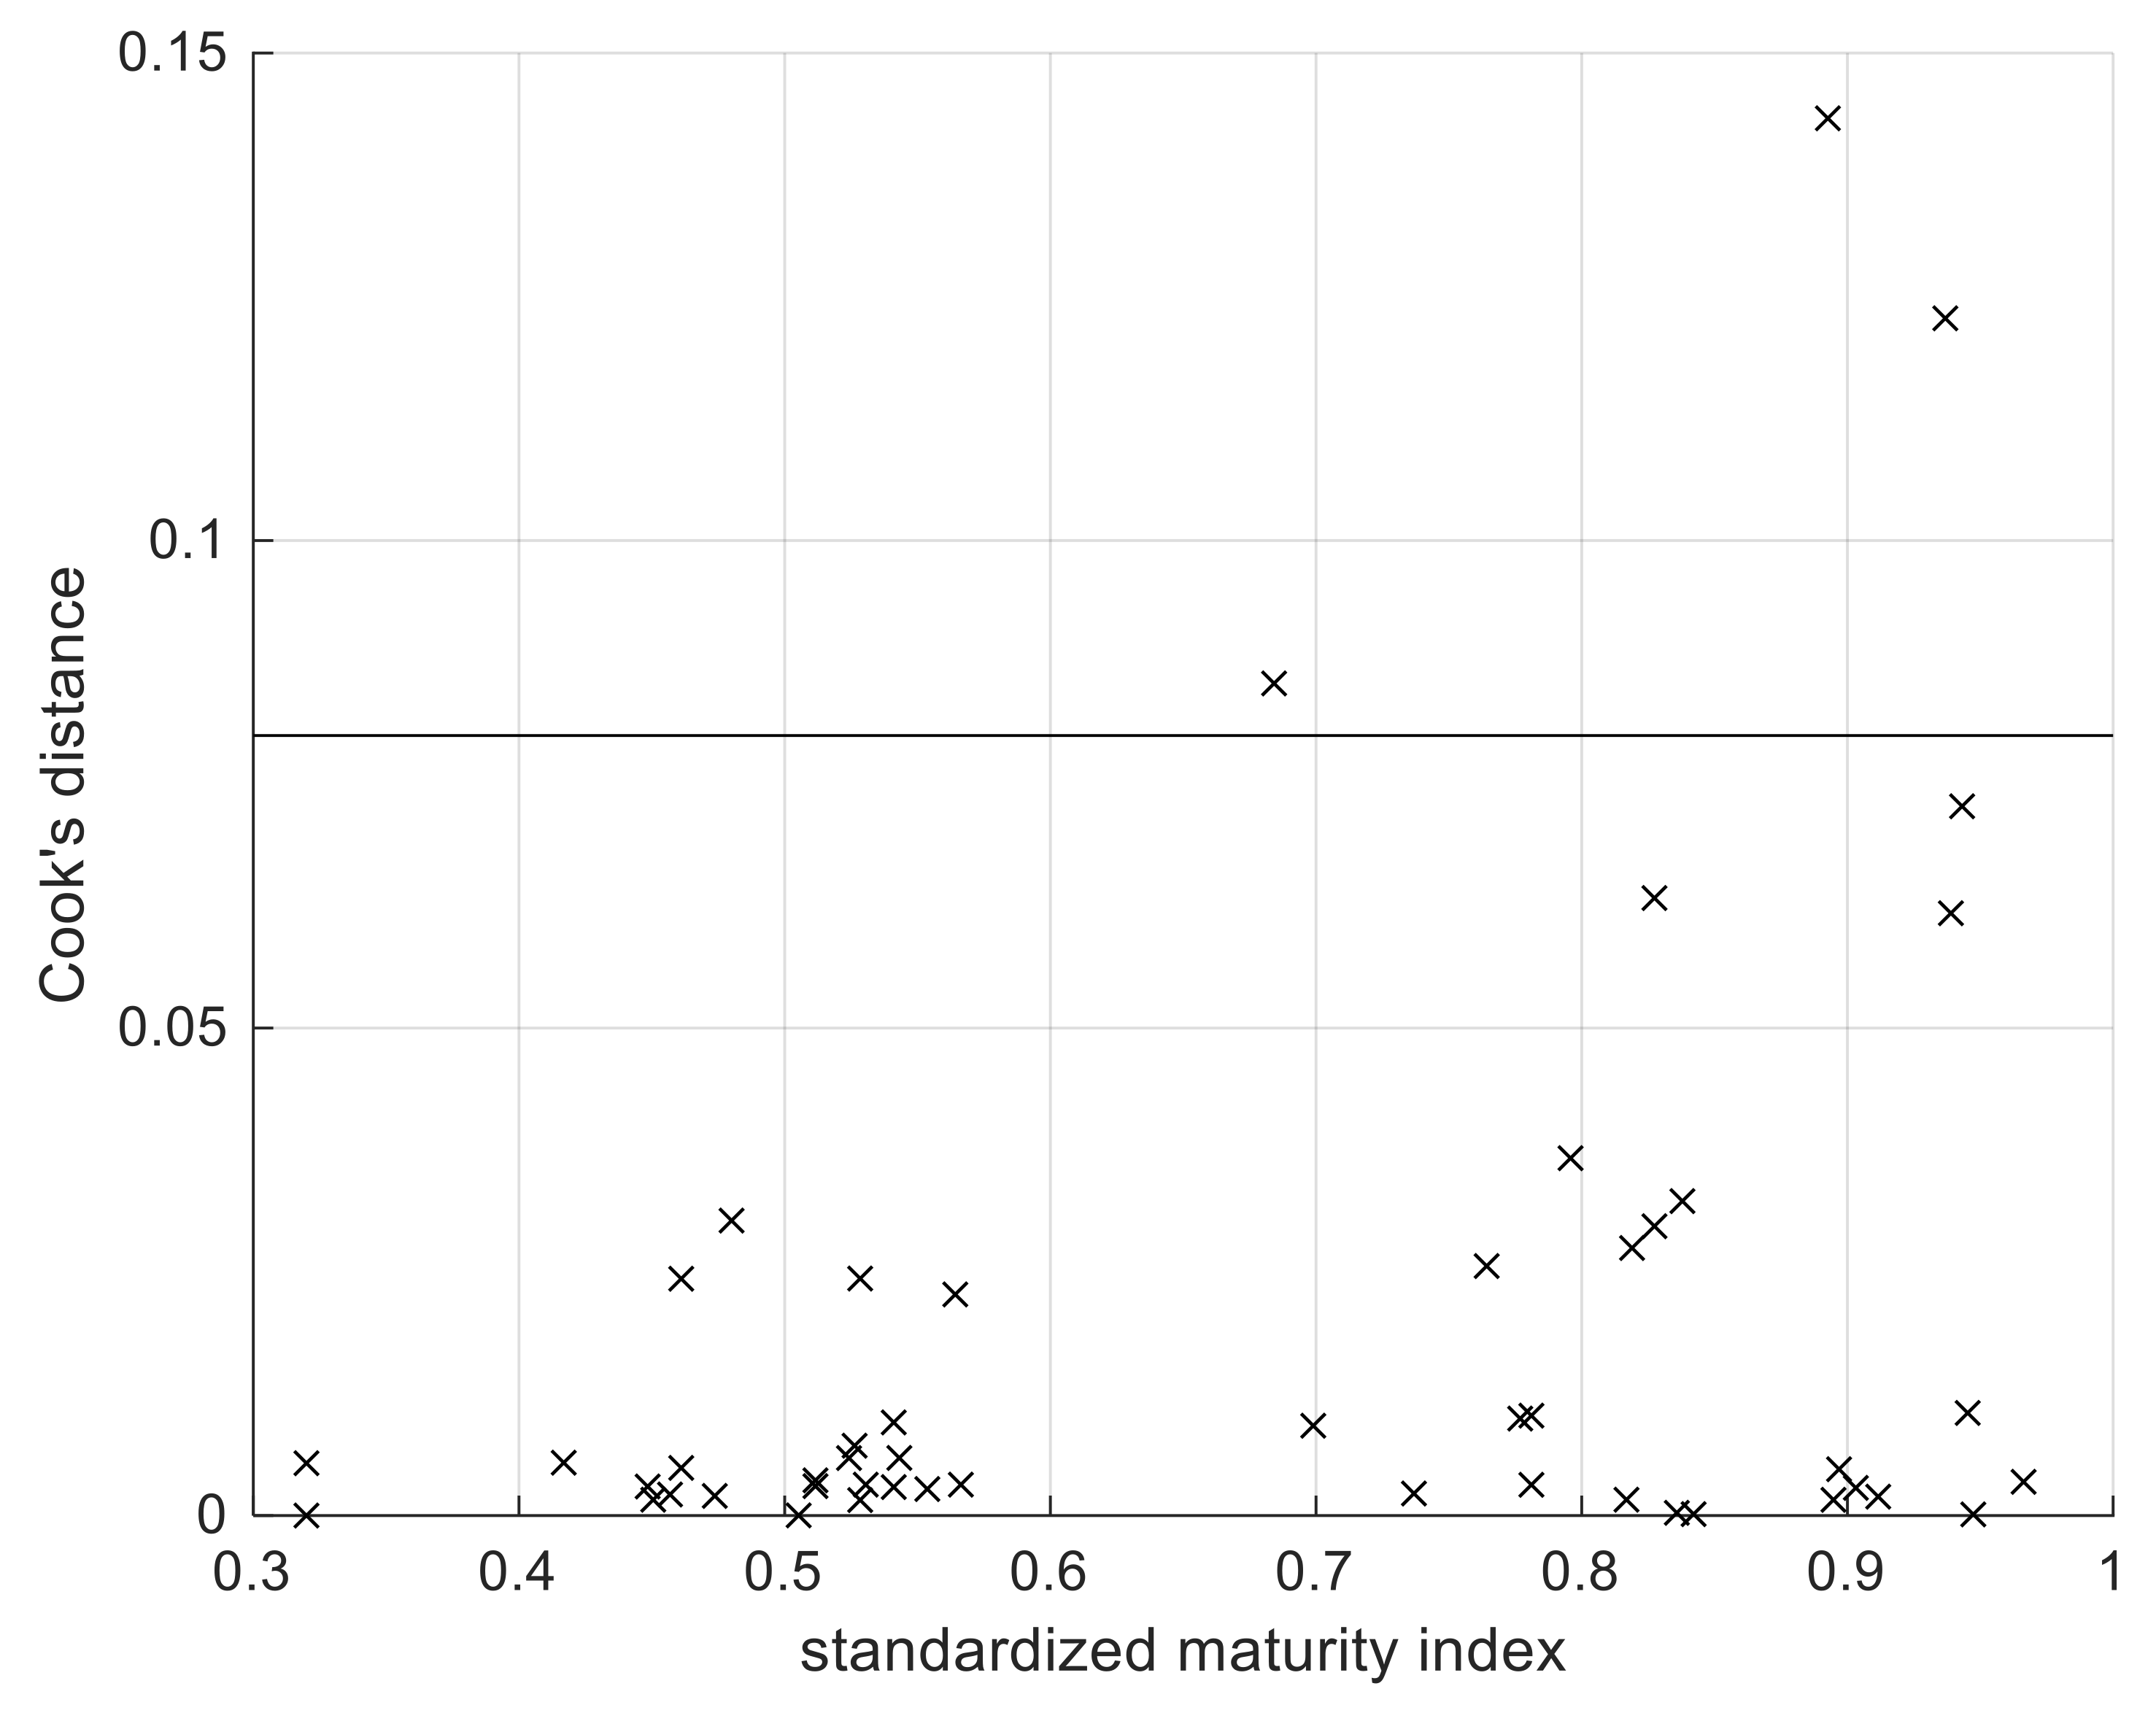
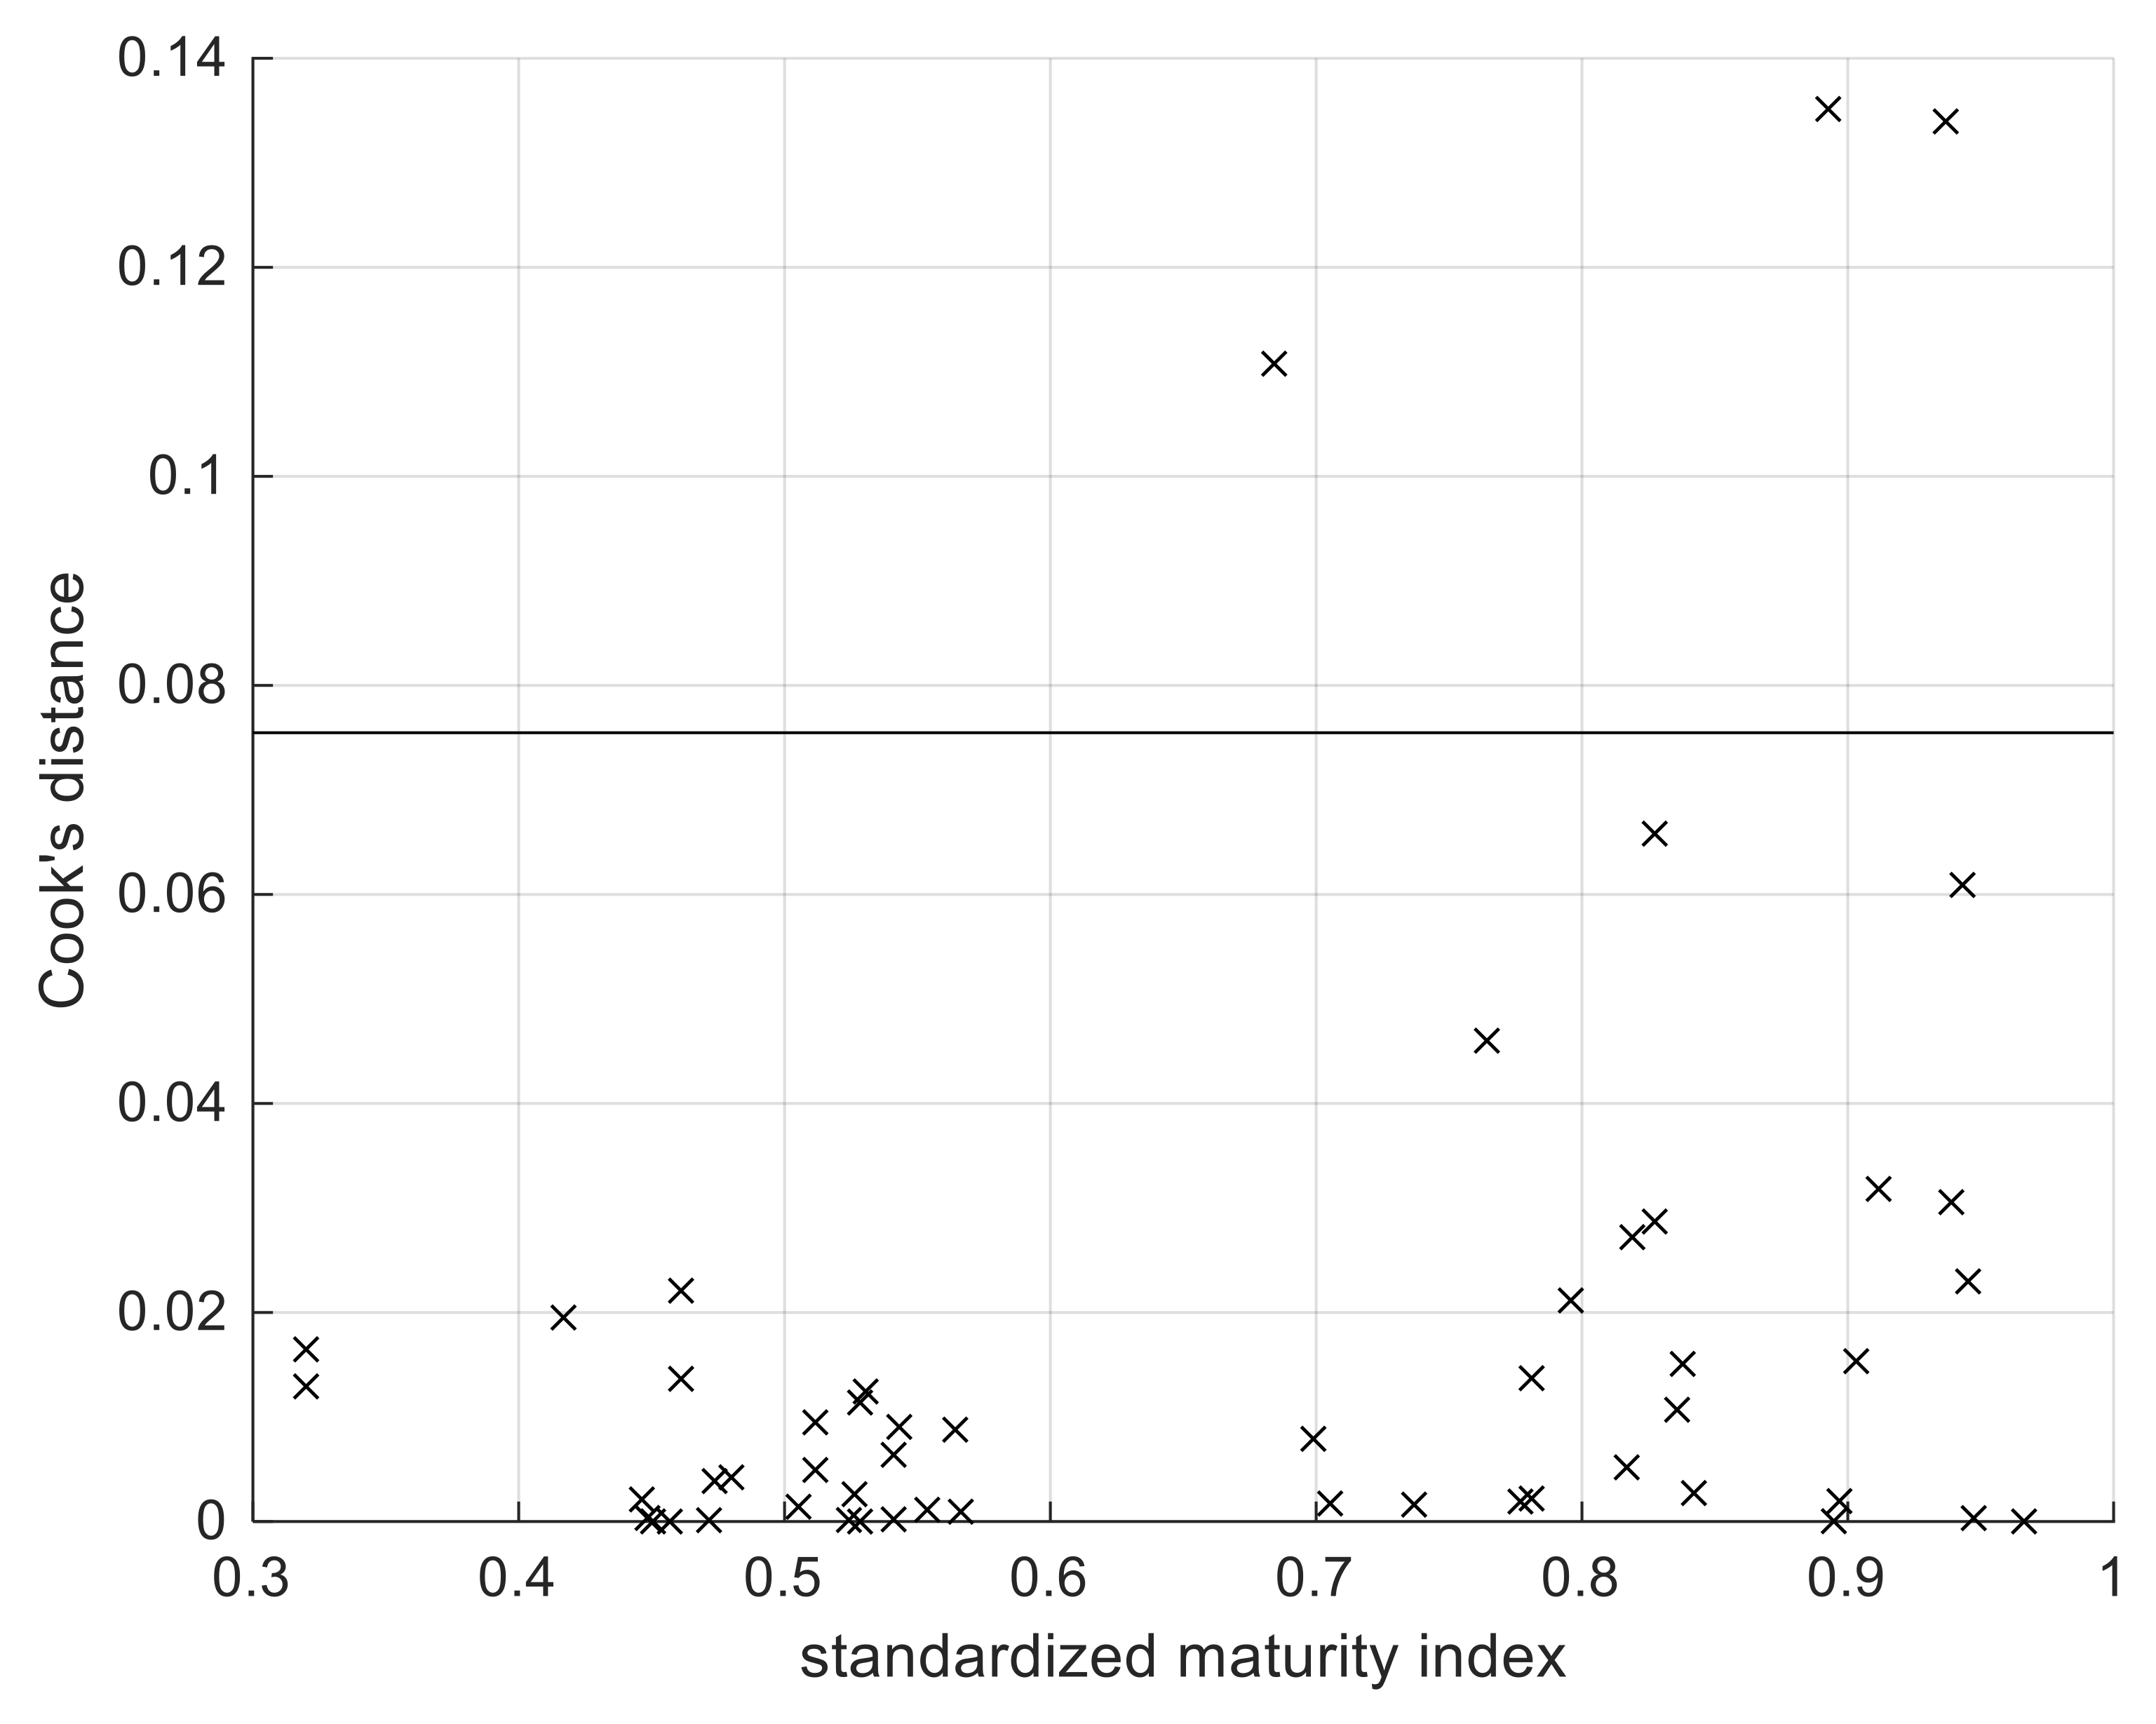
  • Simple linear regression’s Cook’s distance.
  • Simple linear regression’s t-test.
  • Simple robust linear regression’s t-test.

4. Results

4.1. Data Structure

Structured interviews and questionnaires resulted in five sustainability indices and eight features:
  • SIC classification.
  • Country.
  • Employees.
  • Operating income.
  • Net margin.
  • EBT.
  • Return on assets.
  • Return on equity.
Table A2 in Appendix A shows the five sustainability indices and the aggregate the SMI index.

4.2. Sustainability Indices PCA

Each sustainability index was divided by the maximum score it could achieve, based on its relative number of items, and analyzed via PCA. Figure 2 shows that 85% of the variability could be attributed to a single principal component, Figure 3 shows how the standardized maturity index, divided by the maximum score it could achieve, correlated with the principal component. The maturity index could be used for all the calculations, avoiding a choice between the single correlated indices.
The PCA assessed that most of the total sustainability indices variance could be explained by a single principal component, a linear combination of those indices. The principal component was then compared with the SMI to verify that such an index could be used instead. Given a feature, instead of individual linear regressions for each sustainability index a linear regression was developed for the whole SMI.

4.3. Outlier Analysis

Simple linear regressions were fitted using the SMI index as the independent variable and in turn some of the eight features as dependent variables. A visual inspection of the regressions scatter plots revealed many potential outliers.
Figure 4a–f plots the standardized maturity index against economic features and the number of employees respectively. In Figure 4a the companies having negative operating income were removed and the feature was log-transformed to manage the high scale difference between data points, in Figure 4f the employees were log-transformed as well. Figure 4b–e present potential outliers that could tip the scale of a regression analysis.
Not all the points furthest from the regression line are outliers and not all the outliers are influential enough to significantly affect the regression line. The Cook’s distance was computed for each point and each regression, it identified which points were influential enough to significantly affect the regression line if deleted. Most of the regressions presented multiple influential points.
Figure 5a–d depicts the Cook’s distance of the maturity index regression against net margin, EBT, return on equity and return on assets respectively. Figure 6 and Figure 7 depict the Cook’s distance of the maturity index regression against log-transformed operating income and log-transformed employees. The solid lines refer to the 4 n threshold, with n = 53 , usually applied for such visual inspections. Figure 5, Figure 6 and Figure 7 identify most of the potential outliers detected in Figure 4b–e as influential, Figure 6 and Figure 7 identify influential point for the log-transformed data. Table 2 lists those influential points for each feature.
If in Table 2 the influential point was removed and the regression lines were refitted, the Cook’s distance threshold criterion would identify other influential points. In the following section the same regression models were applied both to the original dataset and to ones with the influential points removed, to gauge how such an operation impacts on the results.

4.4. Regression

Given multiple influential points and a difficulty in assessing which ones were actual outliers, different scenarios were run:
  • Simple linear regressions on the original database.
  • Simple linear regressions of the database without the influential points.
  • Simple robust linear regression on the original database.
Table 3 presents the linear regression results for the original dataset, Table 4 for the dataset without the influential points. In both cases the slopes were never significantly different from 0 and, while the t-test normality assumptions are violated, it suggested lack of dependence between standardized maturity index, and economic performance and employees respectively. Table 5 proposes alternative robust regressions results, bisquare-weighting function, and they too suggested no dependence.
The regression on the original database is proposed as an optimistic scenario, where all the potential outliers are kept, potentially leading to spurious correlations. The regression on the original database without influential points is proposed as a pessimistic scenario, where all the potential outliers are removed, and the regression slope is less evident. The robust linear regression is proposed as an intermediate scenario, the robust construction automatically weighted the potential outliers. A t-test was run for each scenario and regression to identify which regression slopes were significantly different from zero. The results suggested against the linear models hypothesis.

5. Discussion

The research undertaken, aimed at measuring the impact of specific sustainability strategies, as underlying components of resilience, on financial performance of the companies. It can be considered a first level joint assessment of the impact of sustainability practices and resilience capabilities on companies’ financial performance. It can be placed within a research context where some inconsistencies are still found: many of the studies on sustainability assessment issues concern the manufacturing industry, while the service sector, despite its growing impact on global economy, is still under-investigated [27]; moreover, the analyses mainly refer to developed countries [29], while only few papers analyze the relationship between sustainability practices and firms’ performance in the developing countries [22]. Our studied sample includes a wide variety of companies, allowing a broad range analysis even if the current data-set represents early development of the research
The performed analysis shows that our aggregate sustainability index SMI, incorporating five main sustainability domains, correlated to operational resilience capabilities, can be appropriately and effectively used to analyze the correlation between sustainability practices and the range of financial indexes. The regression results suggest that there is no dependence between SMI and economic performance of the companies. Accordingly, we cannot prove any relationship between sustainability practices, resilience and economic performance.
While much of the literature proffers a sustainable strategic imperative results in financial benefits, our empirical research on 53 organizations does not support this view: profitability does not show a significant relationship with sustainability. Interestingly, country of origin, size of the organization, and market focus, likewise, do not have a significant relationship with our sustainability metric.
However, arguably, there might be additional business imperatives to bolster sustainable operations, such as recognizing market sentiment in favor of a socially responsible organization; that may result in increased market share. Sustainability-oriented organizations consider as positive performances both performing the set of sustainable actions and the return of image among their stakeholders [38]. Berns et al. [39] survey of 1500 global executives and managers concerning their perspectives on the intersection of sustainability and business strategy identifies two tangible benefits of sustainable developments including cost savings and new sources of revenue. They also list six benefits as follows:
1.
Improved brand image.
2.
Employees’ satisfaction, morale and retention.
3.
Product, service and market innovation.
4.
Business process and model innovation.
5.
Effective risk management.
6.
Enhanced stakeholder relations.
Moreover, according to Hillman and Keim [40], sustainable strategies can increase demand for products and services, attract more socially responsible consumers and reduce prices. The need for identifying nonfinancial indicators of performance connected to sustainability practices is stressed by some authors [41,42].

6. Conclusions

This empirical research is based on a data set under-development including, by now, 53 organizations differing by capital size, market focus, financial performance and geographic regions, the selection of organizations and country of origin being arbitrary, and accessible. It identifies a sustainable maturity index, derived from populating an operations sustainability maturity model. The initial testing of the methodology, generalizability and rigor of the OSMM was conducted in financial services organizations, located in developed and developing countries [22].
The performed data analysis does not support commonly reported arguments: we show that profitability does not show a significant relationship with sustainable strategic intent. Accordingly, as we showed that our model is consistent with resilience goals, we cannot suppose that resilience capabilities impact on firms’ competitiveness.
The main limit of this study is related to the limited data sample size, representing early development of the research. The long-term goal of the research is to allow a meta-comparative analysis of SMI and its relationship with financial performance in various organizations and countries. The research will continue collecting data in as many countries as possible. The granularity of analysis, by country and industry sector, will test several hypotheses: for example, do particular countries or Industry sectors have better SMIs and improved financial performance?
We also made an attempt of validating a relationship between organizational resilience and firms’ performance. The explored hypothesis will be further investigated for building up a framework unifying sustainability and resilience indicators to be applied to different countries, and sectors, facing different threats.
Lastly, further investigations will explore firms’ nonfinancial indicators of performance that are connected to sustainability practices and which support firms’ resilience.

Author Contributions

In the development and completion of this research paper, that covered the model development and validation, data collection, evaluation of hypotheses testing, and drafting and writing of the paper, the contribution made by each of the contributing authors is as follows: Conceptualization phase (E.B., M.A.B., D.C., D.P., B.R.), Methodology (E.B., M.A.B., D.P., B.R.), Software application analytics (E.B., D.P.), Validation (E.B., D.P.), Formal analysis (E.B., D.P.), Investigation (E.B., M.A.B., D.C., D.P., B.R.), Resources (D.P., B.R.), Data Curation (E.B., D.C., D.P., B.R.), Writing—Original Draft preparation (E.B., M.A.B., D.C., D.P., B.R.), Writing—Review and Editing (E.B., M.A.B., D.C., D.P., B.R.), Visualization (E.B., M.A.B., D.P., B.R.), Supervision (D.P., B.R.), and Project Administration (D.P., B.R.). All authors have read and agreed to the published version of the manuscript.

Funding

This research received no external funding.

Conflicts of Interest

The authors declare no conflict of interest.

Appendix A

The Appendix A contains the companies’ profiles (Table A1) and the calculated sustainability indexes (Table A2).
Table A1. The profiles of the 53 companies included in this study.
Co.
No.
Company SIC CodeCountry 1Employees
(No.)
Operating Income (AUS $)Net Margin
(%)
EBT
(%)
ROA (%)ROE (%)
16162AUS41,849795523.3033.370.6712.87
26162GBR24,600244323.8035.410.5211.66
36162GBR264,00029,70622.6025.040.527.35
46311AUS96322011.7017.288.9712.79
56282AUS120044332.2135.039.5818.92
66035AUS5033507.8643.042.114.99
76311AUS160017320.5034.636.4415.45
86321AUS473820.0629.733.953.97
96189AUS541626.0023.009.4515.75
106022JAM2600524.0020.0026.782.4014.45
116162JAM160032.21.6720.481.512.76
122711JAM600−2.71−7.30−7.30−16.80−32.80
132000JAM194058.675.106.903.9010.00
142080JAM34029.3718.0023.0022.0024.00
152851JAM1261.416.007.0012.0020.00
162033JAM609.837.008.0010.008.00
176199JAM2292139.7319.0024.003.3020.00
186162JAM65050.0919.4017.001.239.91
196199JAM30026.3111.9013.501.0010.10
203540GBR23838.2017.850.10−0.45−0.54
213600GBR150051.000.3243.000.540.87
223679GBR1907.128.797.6911.3117.21
233490GBR787.0115.3116.1213.4716.14
243679GBR225−0.25−66.89−70.02−47.53−85.90
253640GBR343−1.64−0.14−0.34−0.22−1.03
261540MHL5764.25212110.0020.00
276022MHL13610.840.644.33.4011.80
288700MHL9031.986.888.986.8085.80
296022MHL200.2559.61489.0013.30
302711MHL200.446151411.0016.00
311540MHL1204.34551090.0060.00
325140MHL11016.5935308.009.00
333490ITA325.2163.44.833.001.54
347380KIR50.08422.82.81.801.80
358741KIR356.62.903.21.601.80
360900KIR28015.4415.0027.504.006.50
375141TUV450.45810.007.00
385080TUV200.4271086
395080TUV50.326998
403640GBR1958.019.27.513.218.4
413640GBR135548.51.137.21.20.9
426199GBR1233372.328.127.37.612.3
436199GBR655.213.214.712.915.7
442870ITA230.20652321.82.5
453560AUS11002.9325.122.53.29.4
464941AUS1224.235.110.427.216.7
476500AUS1624.82.2−0.4−8.4−0.23
483620AUS424.711.74.84.15.3
496199AUS1164.82.63.72.81.6
506199AUS204672.24.41.42
513640AUS1673.21.96.91.51.8
523640AUS872.733.60.21.5
536199AUS521.91.10.20.30.6
1 The country code is assigned according to the ISO 3166-1 (alpha-3 codes).
Table A2. Calculated data for the five operation sustainability domains and SMI.
Company
No.
Total CSTotal ECTotal SCTotal HCTotal NCSMI Total
115677559838424
2159905710336445
311372417326325
47454235414219
59457286920268
67254216813228
712073378022332
8483215498152
94632174611152
10159925610435446
11150915810327429
1211566477928335
13156916010933449
14161945810640459
1513577418135369
1614181518737397
1713985517620371
1812088549415371
1915688579232425
205359256313213
217147206813219
227740186319217
237241247711225
247049226617224
256943256114212
26142905610335426
2713377579934400
2813473538939388
29150945810640448
3013685489030389
3111972478131350
3210043394018240
337045185312198
3413687439334393
3515690559438433
36162835810839450
3713873539836398
38139754510133393
3911376508935363
407040216221214
418253247122252
428745317018251
438137318113243
4413590319230378
4510445354925258
468857326725269
478451316526257
488354315322243
499647296130263
5010123336034251
519832455222249
526736428718250
537840397822257

References

  1. Feil, A.A.; Schreiber, D.; Haetinger, C.; Strasburg, V.J.; Barkert, C.L. Sustainability Indicators for Industrial Organizations: Systematic Review of Literature. Sustainability 2019, 11, 854. [Google Scholar] [CrossRef] [Green Version]
  2. Hosseini, S.; Barker, K.; Ramirez-Marquez, J.E. A review of definitions and measures of system resilience. Reliab. Eng. Syst. Saf. 2016, 145, 47–61. [Google Scholar] [CrossRef]
  3. Roostaie, S.; Nawari, N.; Kibert, C.J. Integrated sustainability and resilience assessment framework: From theory to practice. J. Clean. Prod. 2019, 232, 1158–1166. [Google Scholar] [CrossRef]
  4. Faber, M.H. On sustainability and resilience of engineered systems. In Routledge Handbook of Sustainable and Resilient Infrastructure; Routledge: Abingdon, UK, 2019; pp. 28–49. [Google Scholar]
  5. Fahimnia, B.; Jabbarzadeh, A. Marrying supply chain sustainability and resilience: A match made in heaven. Transp. Res. Part E Logist. Transp. Rev. 2016, 91, 306–324. [Google Scholar] [CrossRef]
  6. Milman, A.; Short, A. Incorporating resilience into sustainability indicators: An example for the urban water sector. Glob. Environ. Chang. 2008, 18, 758–767. [Google Scholar] [CrossRef]
  7. Redman, C.L. Should sustainability and resilience be combined or remain distinct pursuits? Ecol. Soc. 2014, 19, 37. [Google Scholar] [CrossRef] [Green Version]
  8. Marchese, D.; Reynolds, E.; Bates, M.E.; Morgan, H.; Clark, S.S.; Linkov, I. Resilience and sustainability: Similarities and differences in environmental management applications. Sci. Total Environ. 2018, 613, 1275–1283. [Google Scholar] [CrossRef]
  9. Herbane, B. A Business Continuity Perspective on Organisational Resilience. In IRGC Resource Guide on Resilience; Florin, M.-V., Linkov, I., Eds.; EPFL International Risk Governance Center (IRGC): Lausanne, Switzerland, 2016; Volume 1. [Google Scholar]
  10. Francis, R.; Bekera, B. A metric and frameworks for resilience analysis of engineered and infrastructure systems. Reliab. Eng. Syst. Saf. 2014, 121, 90–103. [Google Scholar] [CrossRef]
  11. Annarelli, A.; Nonino, F. Strategic and operational management of organizational resilience: Current state of research and future directions. Omega 2016, 62, 1–18. [Google Scholar] [CrossRef]
  12. Bhamra, R.; Dani, S.; Burnard, K. Resilience: The concept, a literature review and future directions. Int. J. Prod. Res. 2011, 49, 5375–5393. [Google Scholar] [CrossRef]
  13. Lee, A.V.; Vargo, J.; Seville, E. Developing a tool to measure and compare organizations’ resilience. Nat. Hazards Rev. 2013, 14, 29–41. [Google Scholar] [CrossRef]
  14. D’Agostini, M.; Tondolo, R.D.R.P.; Camargo, M.E.; Dullius, A.I.D.S.; Tondolo, R.D.R.P.; Russo, S.L. Relationship between sustainable operations practices and performance: A meta-analysis. Int. J. Prod. Perform. Manag. 2017, 66, 1020–1042. [Google Scholar] [CrossRef]
  15. Dalziell, E.P.; Mcmanus, S.T. Resilience, vulnerability, and adaptive capacity: Implications for system performance. Int. Forum Eng. Decis. Mak. 2004, 17. Available online: https://ir.canterbury.ac.nz/handle/10092/2809 (accessed on 25 February 2020).
  16. Hollnagel, E. Introduction to the Resilience Analysis Grid (RAG). 2015, pp. 1–16. Available online: https://erikhollnagel.com/onewebmedia/RAG%20Outline%20V2.pdf (accessed on 25 February 2020).
  17. Li, X.; Wu, Q.; Holsapple, C.W.; Goldsby, T. An empirical examination of firm financial performance along dimensions of supply chain resilience. Manag. Res. Rev. 2017, 40, 254–269. [Google Scholar] [CrossRef]
  18. Yarveisy, R.; Gao, C.; Khan, F. A simple yet robust resilience assessment metrics. Reliab. Eng. Syst. Saf. 2020, 197, 106810. [Google Scholar] [CrossRef]
  19. De Mandojana, N.O.M.; Bansal, P. The long-term benefits of organizational resilience through sustainable business practices. Strateg. Manag. J. 2015, 37, 1615–1631. [Google Scholar] [CrossRef]
  20. Macuzić, I.; Tadic, D.; Aleksic, A.; Stefanovic, M. A two step fuzzy model for the assessment and ranking of organizational resilience factors in the process industry. J. Loss Prev. Process. Ind. 2016, 40, 122–130. [Google Scholar] [CrossRef]
  21. Fiksel, J. Sustainability and resilience: Toward a systems approach. IEEE Eng. Manag. Rev. 2007, 35, 5. [Google Scholar] [CrossRef]
  22. Parker, D.W.; Loh, A.; Chevers, D.; Minto-Coy, I.; Zeppetella, L. Operations sustainability maturity model: Preliminary findings of financial services in developing and developed countries. Meas. Bus. Excel. 2017, 21, 309–336. [Google Scholar] [CrossRef]
  23. Magon, R.B.; Thomé, A.M.T.; Ferrer, A.L.C.; Scavarda, L.F. Sustainability and performance in operations management research. J. Clean. Prod. 2018, 190, 104–117. [Google Scholar] [CrossRef]
  24. Prayag, G.; Chowdhury, M.; Spector, S.; Orchiston, C. Organizational resilience and financial performance. Ann. Tour. Res. 2018, 73, 193–196. [Google Scholar] [CrossRef]
  25. Gunasekaran, A.; Rai, B.K.; Griffin, M. Resilience and competitiveness of small and medium size enterprises: An empirical research. Int. J. Prod. Res. 2011, 49, 5489–5509. [Google Scholar] [CrossRef]
  26. Loh, A.; Parker, D. Corporate Sustainability Maturity Model: The Development of a Framework and Standardised Assessment Instrument; Working Paper Series; The University of Queensland: Brisbane, QLD, Australia, 2016. [Google Scholar]
  27. Goyal, P.; Rahman, Z.; Kazmi, A.A. Corporate sustainability performance and firm performance research: Literature review and future research agenda. Manag. Decis. 2013, 51, 361–379. [Google Scholar] [CrossRef]
  28. Alshehhi, A.; Nobanee, H.; Khare, N. The Impact of Sustainability Practices on Corporate Financial Performance: Literature Trends and Future Research Potential. Sustainability 2018, 10, 494. [Google Scholar] [CrossRef] [Green Version]
  29. Aggarwal, P. Impact of Sustainability Performance of Company on its Financial Performance: A Study of Listed Indian Companies. Glob. J. Manag. Bus. Res. Financ. 2013, 13, 61–70. [Google Scholar]
  30. Lassala, C.; Apetrei, A.; Sapena, J. Sustainability matter and financial performance of companies. Sustainability 2017, 9, 498. [Google Scholar] [CrossRef] [Green Version]
  31. De Carvalho, A.O.; Ribeiro, I.; Cirani, C.B.S.; Cintra, R.F. Organizational resilience: A comparative study between innovative and non-innovative companies based on the financial performance analysis. Int. J. Innov. 2016, 4, 58–69. [Google Scholar] [CrossRef]
  32. Springer Nature Switzerland AG. Revisiting Supply Chain Risk; Zsidisin, G.A., Henke, M., Eds.; Springer: Cham, Switzerland, 2019; Volume 7. [Google Scholar]
  33. Prashar, A.; Sunder M, V. A bibliometric and content analysis of sustainable development in small and medium-sized enterprises. J. Clean. Prod. 2020, 245, 118665. [Google Scholar] [CrossRef]
  34. Avery, G.C.; Bergsteiner, H. Sustainable leadership practices for enhancing business resilience and performance. Strateg. Leadersh. 2011, 39, 5–15. [Google Scholar] [CrossRef] [Green Version]
  35. Rajesh, R. On sustainability, resilience, and the sustainable–resilient supply networks. Sustain. Prod. Consum. 2018, 15, 74–88. [Google Scholar] [CrossRef]
  36. Sabahi, S.; Parast, M.M. Firm innovation and supply chain resilience: A dynamic capability perspective. Int. J. Logist. Res. Appl. 2019, 1–16. [Google Scholar] [CrossRef]
  37. Golicic, S.L.; Flint, D.J.; Signori, P. Building business sustainability through resilience in the wine industry. Int. J. Wine Bus. Res. 2017, 29, 74–97. [Google Scholar] [CrossRef]
  38. Carmeli, A.; Dothan, A.; Boojihawon, D.K. Resilience of sustainability-oriented and financially-driven organizations. Bus. Strateg. Environ. 2019, 29, 154–169. [Google Scholar] [CrossRef]
  39. Berns, M.; Townend, A.; Khayat, Z.; Balagopal, B.; Reeves, M.; Hopkins, M.S.; Kruschwitz, N. The Business of Sustainability: What it Means to Managers Now. MIT Sloan Management Review 2009, 51, 20–26. [Google Scholar]
  40. Hillman, A.J.; Keim, G.D. Shareholder value, stakeholder management, and social issues: what’s the bottom line? Strateg. Manag. J. 2001, 22, 125–139. [Google Scholar] [CrossRef]
  41. Porter, M.E.; Kramer, M.R. The Big idea Creating Shared Value how to reinvent capitalism-and unleash a wave of innovation and growth. Harvard Business Review, January–February 2011; 1–17. Available online: https://hbr.org/2011/01/the-big-idea-creating-shared-value (accessed on 25 February 2020).
  42. Sroufe, R.; Gopalakrishna-Remani, V. Management, Social Sustainability, Reputation, and Financial Performance Relationships: An Empirical Examination of U.S. Firms. Organ. Environ. 2018, 32, 331–362. [Google Scholar] [CrossRef] [Green Version]
Figure 1. Sustainability as a component of resilience (adapted from [8]).
Sustainability 12 01742 g001
Figure 2. Principal component analysis (PCA) on the standardized sustainability indices.
Sustainability 12 01742 g002
Figure 3. Standardized sustainability principal component and standardized maturity index.
Sustainability 12 01742 g003
Figure 4. Standardized maturity index vs. respectively, (a) operating income; (b) net margin; (c) EBT; (d) return on assets; (e) return on equity; (f) employees.
Sustainability 12 01742 g004
Figure 5. (a) Net margin Cook’s distance; (b) EBT Cook’s distance; (c) return on assets Cook’s distance; (d) return on equity Cook’s distance.
Sustainability 12 01742 g005
Figure 6. Log-transformed operating income Cook’s distance.
Sustainability 12 01742 g006
Figure 7. Log-transformed employees Cook’s distance.
Sustainability 12 01742 g007
Table 1. Operation sustainability maturity model items related to resilience capabilities.
Operations Sustainability DomainOSSM Items
Related to Resilience Indicators and Capabilities
References
Corporate sustainabilityNetwork perspective[13]
Effective planning[13]
Staff engagement/sense of teamwork[10,13,36]
Economic capitalLong-term perspective[34]
Innovation and creativity[31,32,36]
Flexibility/adaptability[10]
Information and knowledge[13]
Societal capitalOrganizational connectivity and relationships[10,13]
Stakeholders involvement[13]
Human capitalCommunications and relationship[37]
Information and knowledge[13]
Natural capital--
Table 2. The influential points for each feature according to Cook’s distance.
FeatureInfluential Points
Log(operating income)1, 2, 3
Net margin24, 28
EBT24, 28
Return on assets24, 28, 29, 31
Return on equity24, 28
Log(Employees)1, 2, 3
Table 3. Linear regression results for the original database.
FeatureParameterEstimateSquared Errort-Statisticp-Value
Log(Operating income)Intercept2.901.382.100.04
Slope−0.341.97−0.170.86
Net marginIntercept1.119.540.120.91
Slope18.9213.741.380.17
EBTIntercept3.9010.070.390.70
Slope18.0314.501.240.22
Return on assetsIntercept−8.8810.81−0.820.42
Slope26.4215.561.700.10
Return on equityIntercept−7.499.97−0.750.46
Slope24.6114.351.710.09
Log(Employees)Intercept4.671.044.500.00
Slope1.231.500.820.41
Table 4. Linear regression results for the database without the influential points.
FeatureParameterEstimateSquared Errort-Statisticp-Value
Log(Operating income)Intercept3.651.123.270.00
Slope−2.091.62−1.290.20
Net marginIntercept10.366.251.660.10
Slope5.288.990.590.56
EBTIntercept13.646.752.020.05
Slope3.819.710.390.70
Return on assetsIntercept5.163.571.440.16
Slope−0.215.19−0.040.97
Return on equityIntercept3.045.820.520.60
Slope9.368.371.120.27
Log(Employees)Intercept5.270.816.510.00
Slope−0.171.18−0.140.89
Table 5. Robust linear regression results for the original database.
FeatureParameterEstimateSquared Errort-Statisticp-Value
Log(Operating income)Intercept3.021.362.220.03
Slope−0.931.93−0.480.63
Net marginIntercept9.906.371.550.13
Slope4.729.170.520.61
EBTIntercept12.387.451.660.10
Slope4.9110.730.460.65
Return on assetsIntercept5.244.041.300.20
Slope−0.715.81−0.120.90
Return on equityIntercept3.374.480.750.46
Slope8.456.451.310.20
Log(Employees)Intercept4.790.964.970.00
Slope0.801.390.580.57

