1. Introduction
The inclusion of the space variable in economic analyses is becoming an increasing habitual practice, especially in the case of activities, which, owing to their very nature, have a close relationship with their development in a given territory, as with tourism. As pointed out by Sánchez [
1], a tourist destination cannot be analysed in isolation without taking into account the influence on it of proximal destinations and vice versa. The presence of a tourist business in a certain location will determine aspects as essential as the resources available; these are understood to be the presence of attractions and their exploitation [
2,
3], as at the same time this affects the occupation level, that of seasonality, and that of competitive intensity, among others [
4]. Moreover, the satisfactory progress of tourist activities will also be influenced by factors such as accessibility or the supply of accommodation or complementary services [
5].
The ways in which the location of an establishment in a given geographical area may influence the satisfactory progress of the activity are therefore diverse. For this reason it is not surprising that the conceptualisation of distance must be included in the statistical analyses to be performed in order to obtain an exhaustive vision of the tourist situation, and this is possible thanks to the application of the techniques of spatial statistics. This statistical tool is characterised by going further than conventional statistical analyses, including the space variable and spatial relations gathered by means of the design of a matrix of spatial weights as another parameter to be taken into account in the analysis to be performed; its use in social science is becoming more and more frequent.
This growth in the use of techniques of spatial statistics has not occurred in isolation but has been encouraged by the greater dissemination of geographic information systems (GIS) in the field of economic analysis in general and in particular, in the case of tourism. As pointed out by Anselin [
6], the application of techniques of spatial statistics together with GIS extends the limits of the types of analysis that may be carried out in a realistic environment, such as those orientated towards supporting the analysis of policies or the making of decisions. It is therefore possible to synthesise the factors which have had an influence on the fact that the space variable is becoming more important in social science in the following ways: the greater importance of spatial interaction in social science, the greater availability of georeferenced databases, and the development of GIS software including specific modules allowing the statistical analysis of spatial data [
7].
For all these reasons, GIS are beginning to be recognised as valuable tools for arranging, analysing, and expounding large volumes of data for any local and regional planning activities; their use is becoming imperative in tourist planning and management [
8]. The main advantage of the application of GIS technology in tourist analysis is that it allows the acquiring of greater knowledge of the structure and the operation of the tourist system in a given area, either for the purpose of planning or with the objective of monitoring the development of the existing activity [
9].
The analysis of the distribution patterns of the variables related to tourism, identifying whether the variables tend to be concentrated or dispersed in the space, the finding of groups with characteristics similar to those of proximal locations, or on the contrary, the finding of observations of behaviour clearly differentiated from that of their neighbours, are some of the possibilities of spatial analysis. In other words, by means of spatial statistical analyses, two important spatial effects can be observed: dependence or autocorrelation and spatial heterogeneity, which will have important implications for tourist management.
The main implications of the finding of interdependence relationships in space lie in the geographic spillovers associated with them. This interdependence between regions has been analysed under the agglomeration economies approach [
10,
11,
12], which is based on the premise that the concentration or spatial proximity of economic activities can be beneficial due to externalities of the agglomeration for the whole economy as well as for the sectors and companies grouped in a particular location, highlighting the improvement of productivity, investments, labor market, knowledge transfer, among other aspects [
13]. In this line, the works carried out by Majewska [
14,
15] and Majewska & Trusklolaski [
16], which, based on this premise, analyse the geograhics spillovers of tourism activity in Poland and countries of central Europe, identifying the existence of different hot spots that represent essential knowledge for proper planning of these destinations.
In the same way, the works carried out by Yang and Wong [
17] that, with the object of study being China, identified the presence of different hot spots in coastal areas, mountainous regions, gateway cities or higher-hierarchy cities within the country that extend its effects beyond natural borders, as well as the existence of certain areas that constitute cold spots with a low level of tourism development. Alongside these, other works carried out for the same purpose stand out: the identification and description of the spatial pattern of tourism activity in particular territories [
1,
5,
8,
9,
10,
11,
12,
13,
14,
15,
16,
17,
18,
19,
20,
21,
22,
23,
24,
25,
26,
27,
28,
29,
30,
31,
32].
As a general conclusion of all these works, it can be confirmed that the distribution of tourist activities in a region is not homogeneous [
5,
9,
20,
25,
27,
29,
33,
34]. On the contrary, this spatial distribution is characterised by a series of patterns which must be identified and taken into account for the correct management and planning of a destination.
In general terms, in analysing the distribution of the demand from travellers in the territory, it can be expected that there will be a certain preference for those locations which have the most tourist attractions. In accordance with this premise, it can be anticipated that tourist lodgings have a greater supply of beds in those locations which are more attractive to the demand, or what amounts to the same, that the beds are concentrated in the locations of greater preference of the demand. This has been the approach used by a large proportion of the studies carried out to date to analyse the distribution of tourist activity in space, i.e., assimilating that supply and demand have the same distribution pattern. Therefore, the lack of specific details allowing the analysis of the behaviour of travellers may be compensated for by a detailed study of the behaviour of the supply [
1,
5,
9,
25].
It must, however, be taken into account that the creation of beds for tourists is not always a response to the prior existence of interest from the demand. This could be the case of the creation of beds in locations which lack a strong tourist tradition but which see in the development of this activity a good opportunity to generate wealth and employment.
This paper aims to investigate the degree of adjustment between supply and demand in a territory where, due to the particularities of the growth model implemented based on expansive policies, it has given rise to a strong imbalance between supply and demand, the region of Extremadura [
1,
5,
25,
28,
32] that needs to be studied and analyzed in order to implement the appropriate strategies to achieve growth sustainable tourism in the region.
The principles on which sustainable tourism development rests based on various institutional declarations of the World Tourism Organization (UNWTO) according to Cánoves, et. al [
35] can be synthesized as follows: giving optimum use to environmental resources, maintaining and helping to conserve natural resources and biological diversity, respect the cultural authenticity of host communities, conserve their cultural and architectural assets and their traditional values, and ensure long-term viable economic activities that benefit all agents and report socio-economic benefits. Therefore, the mere creation and provision of housing capacity is not enough, but for a truly sustainable economic system to be constituted, it is necessary that the distribution of these be adjusted correctly to the preferences of the demand, or what is the same, that these places obtain a sufficient occupancy rate to generate an economic benefit that allows the continuity of the business without exceeding maximum saturation levels that hinder the correct conservation of the main tourist attractions.
In this sense, the analysis of the occupation level seems to be a good option to generate knowledge from which to design development strategies that allow fulfilling the necessary objectives so that the sustainable tourism development of the area under study is possible.
Moreover, as some of the previous studies underline, one of the main weaknesses of the technique used is that the use of administrative boundary affects the results obtained [
14,
15], so some of the geographic spillovers could be covered up; in order to avoid this problem, it has been decided to use a global positioning system (GPS) coordinate reference unit for each of the observation units, that is, this analysis is performed from a territorial perspective disaggregated at the highest possible level, the very location of each establishment. This study uses in total as a sample, a set consisting of 270 accommodation establishments for which data are available on their beds and occupation levels for July 2015; all these establishments are located in the region of Extremadura. The use of the establishment itself as a unit of analysis will allow the identification of a set of lodgings with similar behaviour (spatial clusters), which in view of the management of the territory, allows the definition of joint planning strategies.
The novelty of the approach used in this article must be sought in the combination of the methodology and destination used. Most of the work done to date to analyse the distribution pattern is carried out at an intra-urban scale [
36,
37], also selecting destinations that are in the maturity phase. The peculiarity of the analysed destination lies in the fact that it is an emerging interior destination that, due to the characteristics of tourism products with development potential in these destination, requires sustainable tourism management. Therefore, using an analysis focused on the efficiency of the territory measured through the occupation level as a proxy indicator of tourism pressure is an important temporary spatial tool to locate possible locations that could present problems of excess load capacity. In the same way, it is essential to establish the appropriate development policies for the identification of possible locations that in the space and time analysed make less efficient use of their available resources. Therefore, it is considered that the analysis performed is a valuable tool for public and private managers in order to manage the destination that allows its sustainable development.
In order to achieve its objective, this study is structured as follows: after this introduction, the next section details what is meant by exploratory spatial data analysis (ESDA) and what has been its application in the field of tourism. The third section serves as a guide to the reader in the enumeration of some characteristics of the geographical scope of this study, the region of Extremadura. Subsequently, we describe in detail the methodology used in this research. Section five describes the results obtained, and finally this research is completed with a synthesis of the main conclusions and implications for the management of the results.
2. The ESDA and Its Application to the Tourist Sector
The tourist industry is characterised by a growing need for planning, which in its turn requires techniques capable of monitoring and analysing the flows of tourists [
38]. One of the characteristics traditionally attributed to tourism is its territorial dimension, which is also characterised by an unequal distribution within and between destinations [
27]. For this reason, finding out the distribution pattern of the data in a given territory is an essential task in the field of tourist management and planning.
The ESDA is a good tool for this purpose when no clear signs are present in the distribution patterns of a variable. The ESDA can be defined as a set of techniques which describe and visualise spatial distributions and at the same time identifies atypical locations (spatial outliers), discovers schemes of spatial association, groupings (clusters), or hotspots and also suggests spatial structures and other forms of spatial heterogeneity [
39].
The importance of GIS in this process lies in the possibility which GIS offer for statistical analysis using graphs, which gives rise to what some authors term “scientific visualisation” [
40].
By means of the exploratory study of spatial data, the so-called spatial effects can be identified: autocorrelation or dependence and spatial heterogeneity. Spatial heterogeneity can be defined as the variation of relationships in space. It is determined either by the presence of structural instability caused by the lack of stability in the space of the behaviour of the variable under study or by the presence of heteroscedasticity [
41]. The second of these effects, the so-called spatial dependence or autocorrelation, is confirmed when there is a relation between what occurs at a given point in the space and what occurs in other points of the same space [
42]. It is therefore in line with the contents formulated in the “first law of geography” of Tobler [
43], according to which “everything is related to everything else, but near things are more related than distant things”.
This study of dependence or spatial autocorrelation may result in three possible scenarios.
The first of these consists of the finding of the lack of spatial autocorrelation, i.e., when it is confirmed that the values of the variable are distributed at random in the territory analysed (random pattern of distribution).
The second of these scenarios is associated with the confirmation of positive spatial autocorrelation. This occurs when there is a direct relationship between similar values of a variable. It implies that the presence of a given phenomenon in a region means that it extends to other nearby regions [
44]. In the specific case of tourism, the presence of this type of autocorrelation involves the presence of similar values of the tourist variable among nearby destinations, which means that a “contagion” effect therefore exists [
1].
Finally, the third possible scenario is when the presence of negative spatial autocorrelation is confirmed. This occurs when nearby destinations present very different values of a variable, or what amounts to the same thing, when the presence of a phenomenon in a region prevents or hinders its appearance in neighbouring regions [
44]. In the specific field of tourism, this case generates what is known as the effect of the “absorption” of a given geographical space [
1].
Moreover, it must be taken into account that the study of spatial autocorrelation can be approached from two different perspectives: at a global level or a local level. The contrast from a global perspective pursues the objective of identifying spatial trends or structures in a specific geographical space, including the total of the observations of the variables in said space. In order to do so, the indicators proposed by Moran [
45] and Getis and Ord [
46] will be used. The main differentiating characteristic of these contrasts from local contrasts is that they allow the summarising of a general scheme of dependence on a single indicator [
41].
For its part, the local contrast of spatial dependence or autocorrelation is characterised because an indicator is calculated for each of the observation units, owing to which they allow the identification of in which of them higher (or lower) values than those expected in a homogenous distribution are concentrated. The most popular indexes for confirming the presence of local spatial autocorrelation include the local indicators of spatial association (LISA) proposed by Anselin [
47] and the G
i family of statistics of Getis and Ord [
46] and Ord and Getis [
48].
Although both tests can be considered complementary, their approach can be clearly differentiated. While the Getis–Ord Gi test concentrates on locating groupings of similar high or low values of the variable which are in accordance with the values of their neighbouring locations, Anselin’s local I test expands these results to locate not only these two types of groupings but also those other entities presenting anomalous values compared with those taken by their neighbouring locations. This test may therefore give rise to five different results: groupings of high or low values with neighbouring locations taking similar values (HH or LL), high-value groupings surrounded by low values (HL), low-value groupings surrounded by neighbours with high values (LH), and finally entities in which no significant relationship can be identified.
As can therefore be seen, the results obtained by the application of Moran’s local I test enriches the analysis and it is for this reason that this option has been selected to perform the analysis of local spatial distribution in this study.
On the other hand, the joint use of both types of contrasts, local and global, will allow the obtaining of exhaustive results in the spatial analysis carried out. In this sense, several authors point out that these are complementary techniques, as one of the main limitations of global autocorrelation tests is their incapacity to detect local spatial structures, hotspots or coldspots that may or may not extend to the global pattern structure [
44,
46,
47,
49,
50,
51,
52].
At the same time, both types of test, local and global, have a common problem which must be correctly approached and resolved prior to the application of these techniques; deciding what will be the conceptualisation of the relationship of proximity, i.e., how to distinguish which entities are to be considered neighbouring. In order to do so, various criteria have been established, which in turn will vary depending on the approach used: the lattice perspective or the geostatistical perspective.
In the specific case of the geostatistical perspective, which will be the approach used in this research, the relationship of proximity can be established by means of any of the following criteria: inverse distance, square inverse distance, and fixed distance band. In general terms, the fixed distance band criterion is the most frequently used in the existing literature [
53,
54]. Authors such as Sánchez et al. [
28] point out that it should be taken into account that each of the criteria listed establishes a relationship of proximity which has a significant effect on the results obtained; owing to this it is necessary to be cautious and carry out different tests before deciding on a criterion so as to ascertain which is best suited to the study area.
With regard to the possibilities of the application of these techniques to the specific field of tourism, it should be pointed out that this will allow the identification of the distribution pattern followed by the variable in the area analysed, with the implications for tourist planning which these findings involve. In this way the identification of a positive spatial autocorrelation pattern in a given region indicates the existence of a contagious effect among neighbouring destinations, which would make possible the existence of a common strategy for tourist development in neighbouring regions. At the same time, the existence of spatial autocorrelation at a local level will allow the identification of groups of municipalities with common characteristics regarding their tourist situation and therefore with similar needs as to the designing of strategies for future development.
The following section provides a series of characteristic features of the evolution of the tourist sector in Extremadura together with a reference to some studies carried out in this region which allow the reader to obtain further knowledge on the tourist situation of the region.
3. Case Study: Space and Tourism in Extremadura, Spain
Extremadura is a Spanish region in the southwest of the Iberian Peninsula which consists of the two largest provinces in Spain: Cáceres and Badajoz. The total surface area of the region is 41,633 km
2. Its economy has traditionally been characterised by a strong dependence on agro-forestry activities and by being that of the Spanish region with the lowest gross domestic product (GDP) per capita [
55]. Moreover, this is combined with a high rate of unemployment which was 19.68% in the third quarter of 2019 [
56]. Given this situation, the region has been obliged to create new productive activities to provide economic development by means of the creation of wealth and employment and has seen in the development of tourist activities a good ally to achieve this.
The potential of tourist activities for contributing to economic development, reducing regional asymmetries, creating employment, and generating positive external elements affecting other economic activities has been traditionally accepted [
57]. This characteristic becomes particularly relevant in the case of regions which owing to a geographically isolated location see in the tourist sector their only possibility of growth [
58] by means of the diversification of the existing incomes.
It is as a result of all this that at a European level a series of programmes have been developed with the ultimate aim of the diversification of economic activities in areas with a low level of economic development. The LEADER, LEADER II, and PRODER programmes are a good example of this, and their impact is particularly noteworthy in the region under study, Extremadura.
The result of these subsidies has been the rapid growth of the accommodation capacity of the region, especially in the case of rural lodgings. This growth has not been matched by a parallel increase in the number of visitors, which has therefore created considerable imbalances which must be analysed exhaustively in order to understand the current situation of the tourist sector in the region [
5].
In the year under study, the region had a total of 1296 accommodations that offered a total of 38,940 places. Of these, a total of 19,837 places were offered by the 471 hotel accommodations installed in the territory, the rest, 19,103 places, are the result of the offer of beds made by the 827 non-hotel accommodations located in the region in that year according to data provided by the Tourism Observatory of Extremadura. We find, therefore, a region that keeps a good balance between the number of places offered by hotel and non-hotel accommodation. However, the own peculiarities of extra-hotel accommodations, which offer on average a smaller number of places, entail a greater representativeness with respect to the number of accommodations, which in turn allows a better distribution throughout the territory.
The studies which have been carried out to date in order to find out the pattern of distribution of tourist activity in this space have taken as a reference variable the number of beds available, with these studies being limited to the analysis of the beds offered by rural tourism lodgings. In this way it has been possible to confirm the existence of different clusters of municipalities offering a high number of beds in comparison with what would be expected in a homogeneous distribution of the variable [
1,
5,
25,
28].
There is no doubt that these studies have helped to stress the importance of the analysis of spatial distribution patterns of tourism in the region as their results confirm the existence of groups of municipalities with a similar accommodation capacity and which can therefore develop common strategies of development and planning. As is stressed by the authors themselves, the existence of these similarities among territories allows a bid for joint policies to cover extensive proximal territories [
5].
However, up to now, the findings on the spatial behaviour of the tourist supply in the region have only served to emphasise the need for carrying out exhaustive spatial analyses of tourist activities and in particular to provide information on the behaviour of the demand from travellers to the region and its adjustment with respect to the places offered.
One of the common conclusions of the studies carried out to date on the distribution of the beds for tourists in the region is that the expansive policies used as strategies for developing the sector have given rise to unequal growth between the supply and the demand, with the result being the generation of imbalances in the activity [
1,
5,
25,
28]. This situation of imbalance appears to be preventing these beds from fulfilling their function of generating the economic growth for which they were created.
This imbalance may be represented by one of the variables habitually used in order to characterise the satisfactory performance of tourist activities, the occupation level. The occupation level of an accommodation establishment can be defined as the quotient between the beds which have actually been occupied in relation to those available. This variable can therefore be considered a good proxy indicator of the level of adjustment between the supply of and the demand for tourist activities in a given territory. The spatial analysis of the occupation level variable will allow us on the one hand to find out whether there is a general pattern of the grouping of the variable in the space and on the other to discover groups of lodgings showing similar behaviour in the space, i.e., having a satisfactory adjustment in their supply of beds (hotspot) or on the contrary, poor adjustment between supply and demand (coldspot).
The importance of the findings which we aim to discover with the performing of this analysis lies in the fact that as a consequence of the same it will be possible to group together those accommodation establishments which are near to each other and show similar behaviour; this in turn will allow the generalisation of the tendency identified in the territory in which they are located. In short, the groupings identified by this kind of analysis will permit the regional administration to establish common development strategies, making use of the synergy effect and the consequent scale economies, and designing joint planning to cover extensive territories with a similar characterisation and initial situation.
Given that the objective of this research is to help the regional administration to identify territories in which tourist lodgings are located that have an equal occupation level different from that to be expected in a homogeneous distribution of the activity, we decided to use as a reference the territorialisation created by the regional administration for the strategic planning of the region. Since the establishment of the Extremadura Observatory Tourism in 2013, the regional administration responsible for tourism has opted to use a territorial division that allows combining tourist regions that, because they have similarities in terms of their portfolio of tourism products, have been considered optimal to perform a joint analysis. It should be noted that this division is carried out on the basis of knowledge of each of the regions subject to territorialization but that it is not based on any study that has used ESDA techniques that have allowed us to verify the spatial grouping of accommodation whose behavior is similar and different from that expected under a homogeneous distribution pattern, and that therefore, supports the feasibility of using joint planning that allows optimizing the results of the policies implemented for joint development.
In the same way, the sample used to perform this analysis is that proposed by the Extremadura Tourism Observatory and guarantees the correct representation of the supply of beds existing in each of the territories used. Specifically, for the reference month and year, the sample consisted of a total of 270 lodgings that offered 15,966 places in the region. According to the total accommodation capacity indicated above formed by 38,940 places distributed among a total of 1298 accommodations, the sample obtained represents 20.8% of the establishments and a total of 41.0% of the total places. In addition, it should be noted that, as specified in the different reports published by the Tourism Observatory, the representativeness of the sample was determined for each of the territories, and given that sample is the sample used by the agency that is responsible for carrying out the official statistics of the region, and it is confirmed, the selected sample is considered representative of the tourist activity of Extremadura.
Figure 1 shows both the distribution of the sample of accommodation establishments used and the location of each of the territories which will subsequently be analysed.
Once the sample to be analysed has been presented, the following section explains in detail the methodology used to achieve the proposed objectives of this research.
4. Methodology
This study fits in with the techniques of the ESDA, concentrating particularly on the analysis of the phenomenon of spatial dependence or autocorrelation. In order to achieve this we have used the ArcGIS software in its 10.3 version, which from a geostatistical perspective allows the analysis of spatial dependence or autocorrelation by means of the most commonly used indexes.
The variables to analyse are on the one hand the beds offered by the various types of accommodation establishments in the region of Extremadura, and on the other hand the occupation level of the region, using for the purpose a sample consisting of a total of 270 tourist lodgings which provided their occupation details to the Extremadura Tourist Observatory in July 2015.
The month and year selected for carrying out this study depend on a strategic criterion within the general objective pursued by the authors. In this sense it should be emphasised that this study is part of a more extensive research project which aims to analyse the spatial patterns of distribution over a three-year period from 2015 to 2017. In this way the decision was made to perform the analysis using the first year of reference and within this year, July was chosen for being the first month of the quarter (the third of the year) recording the highest occupation levels in most of the territories to analyse. Also, this month is characterized by being among the two that present the highest occupancy, July and August, which has a lower variability. Once the reference quarter has been selected, the objective is to see which month meets the requirement to position itself as a month that presents a good performance for most of the territories under analysis and, in turn, does not present a great variability between the different months under study. For this, the study carried out on tourist seasonality between the different territories is taken as a reference [
59]. This study analyzes, among other aspects, the tourist density for the different tourist territories in which the region is divided and it is obtained that although August, together with the month of July, are the months that present maximum values for the greater part of the territories, August is also established as a minimum month for any of them; the same not happening with the month of July. Therefore, although the final objective is to analyze the tourism efficiency pattern in the territory in the entire annuity, it is decided to use the month of July to start as a basis for analysis and confirm if, depending on the results obtained after this first analysis between the different territories, it is worth extending the analysis to an annual scale.
The findings of this research therefore not only generate exhaustive knowledge of the distribution pattern of the supply and its satisfactory adjustment to the tourist demand in the region during the month and year selected but also allow the laying down of the methodological foundations for the analysis of the remainder of the period of time considered.
Within the range of the possible variables available for measuring tourist activities, the decision was made to select the two variables considered most suitable for the characterisation of tourist activities as a whole, as in this way the distribution pattern of the supply can be analysed and in turn, the satisfactory adjustment between supply and demand measured by the occupation level of each of the lodgings.
The study of the autocorrelation or spatial dependence of the variables mentioned in the territory of Extremadura is moreover analysed from a double perspective: global and local. The objective of the contrast of spatial dependence in the global perspective is to identify spatial trends or structures in a specific geographical space. The indicators proposed by Moran [
45] and Getis and Ord [
46] are used for this purpose. These indicators are the first formulations proposed in the literature as statistical measurements of the spatial autocorrelation effect. Moreover, they are characterised by their capacity to summarise a general outline of dependence in a single indicator [
44].
Both contrasts assume an objective statistical criterion which allows the confirmation or rejection of the presence of trends or spatial structures in the distribution of a variable. In both cases, the null hypothesis to confirm is the lack of spatial dependence, i.e., the randomness of the distribution of the variable in the territory selected.
Moran’s I test (1948) is given by the following, Equation (1):
where
is the element of the matrix of spatial weights corresponding to par (i, j);
: the sum of the spatial weights ;
: the average or expected value of the variable;
N: the number of observations.
Once one proceeds to standardisation by rows of the matrix of spatial weights
=
N, the statistic
I takes the form of the following, Equation (2):
According to Cliff & Ord [
60], when the sample is large enough this statistic is distributed as a standard rule
N (0.1). The inferential process uses the standardised values (
Z) of each of them, which are obtained by the quotient between the difference of the initial value and the theoretical average and the deviation, i.e.,
The values obtained by the test will be interpreted as follows: non-significant values of test I will involve the non-rejection of the null hypothesis of the random distribution of the variable in the space studied. For their part, significant values of the variable and positive values (values exceeding 1.96 at a significance level of 5%) will indicate the presence of positive spatial autocorrelation, i.e., they will identify values of the variable (high or low) specially grouped in the space to a greater extent than would be expected if they were following a random distribution pattern. The significant and negative values of the variable (values lower than −1.96 at a significance level of 5%) will reflect the existence of negative spatial autocorrelation, or what amounts to the same they will identify a non-grouping pattern of similar values (high or low) of the variable which is higher than normal in a random spatial pattern.
In order to complete the global analysis of the distribution of the variables, the family of indicators proposed by Getis and Ord [
46] is also used. They stand out by using a criterion which is different to those used up to now to measure spatial autocorrelation based on the distance or spatial concentration statistics.
The calculation of the statistic requires the definition of a critical distance (d), as from this distance a radius of influence is established from which it is determined which units are neighbours to others depending on whether they are within the radius of influence determined by the critical distance.
It is given as follows:
where two pairs of spatial units
i and
j are neighbours if they are found within a determined distance d, taking the
wij value of 1 when this is so or 0 when it is not.
The statistical significance is checked by means of the standardised statistic Z which is distributed at an asymptotic level according to a rule N (0.1). The interpretation of this test in those cases with statistical significance will be as follows: a positive (or negative) z value exceeding 1.96 for the absolute value will indicate a tendency to the concentration of similar high (or low) levels.
One of the main limitations of global autocorrelation tests is they are incapable of detecting local spatial structures, hotspots or coldspots, which may or may not extend to the global pattern structure [
41,
46,
47,
48,
49,
50,
51,
52]. It was in order to overcome this limitation that local spatial autocorrelation tests were developed. The objective of these tests is the detection of particularly high or low values (hotspots or coldspots) of a variable in comparison with its average values. They are characterised by being calculated for each of the spatial units to analyse, owing to which they allow the detection of those concentrating higher or lower values than what can be expected in a homogeneous distribution.
The analysis of local spatial autocorrelation may present two different scenarios in contrast to global spatial autocorrelation as is pointed out by Vayá and Suriñach [
52]. In the first place, it may occur that in a specific space as a whole a distribution pattern of the concentration or dispersal of values at a global level is not detected and indeed there are small clusters in which high (or low) values of the variable are concentrated. Secondly, it may also occur that given the existence of a global distribution pattern, some spatial units contribute to a greater extent to that global indicator.
For this reason, the analysis of autocorrelation at a local level constitutes a good complement to the study of global distribution.
The local indicators of spatial association (LISA) proposed by Anselin [
47] and the G
i family of statistics of Getis and Ord [
46] and Ord and Getis [
48] are the most frequently used indicators for the study of spatial autocorrelation at a local level. In this study, as is explained in section two, we decided to use the LISA maps of Anselin [
47] as a criterion as we consider that the results of this test give a wider interpretation.
Anselin [
47] proposes a set of local indicators of spatial association with the objective on the one hand of the determination of significant local spatial groupings (clusters) and on the other the detection of pockets of spatial instability, understood as the presence of atypical values.
Among the indicators proposed by the author, Moran’s local
Ii statistic stands out; its equation is as follows:
where
zi is the standardised value of the spatial unit
i and
ji the set of spatial units proximal to
i.
According to a random distribution hypothesis, the probability of the statistic is:
where
wi is the sum of all the elements corresponding to the row of unit
i.
The hypothesis assumed is that the standardised Ii statistic is distributed as an N (0.1) rule.
The standardised statistic is interpreted as follows: a high positive value (z-score) exceeding 1.96 at 5% of significance will indicate the presence of clusters of high or low values of the variable. For its part, a significant negative value (less than −1.96 at 5% of significance) indicates the existence of spatial outliers.
For each of the tests listed up to now, and as has been revealed in section two of this study, it is necessary to choose a proximity criterion that adjusts satisfactorily to the particularities of the area under study. In order to be able to make this choice, various tests have been carried out with each of the three possible criteria in accordance with the geostatistical perspective used. After they were carried out it was decided to use the criterion most frequently followed in the literature to date, the fixed band distance criterion; the distance used is that established by the programme by default to ensure that all spatial units have at least one neighbour, 15.79 miles.
Once the different contrasts to be used in this study have been presented, the following section gives the main results obtained from the analysis of spatial autocorrelation at both a local and global level of the variables of the beds available and the occupation level of the region of Extremadura.
5. Results
As has been mentioned, the final aim of this research is to determine the level of adjustment between tourist supply and demand in the region of Extremadura, describing the distribution pattern of this region and identifying groupings of establishments in a similar situation. In order to do so it uses a sample consisting of a total of 270 tourist establishments, which in July 2015 provided their occupation data to the Extremadura Tourism Observatory. Given the different data provided, it was decided to use two of the most representative variables with the aim of measuring tourist activities: on the one hand, the total number of beds offered by the various accommodation establishments during the period analysed, and on the other the average occupation level of each establishment (as an indicator of a satisfactory balance between the beds offered and those actually occupied).
Moreover, the study is carried out from a double perspective: on the one hand the existence of a global pattern of distribution of the variables being studied is contrasted and on the other the possible existence of local distribution patterns is examined. For the first objective we used the two most commonly used indexes, Moran’s global I test and the Getis–Ord general G (d) statistic.
The results obtained for the first variable analysed, the number of beds available, can be seen in
Figure 2.
As can be seen in graph 1, Moran’s global I statistic takes a value of 0.0271, with the score z being equal to 1.7239, owing to which at a significance level of 10% we can affirm that a pattern exists of the concentration of the values of the variable in the space. It is therefore confirmed that there is a slight tendency towards the concentration of the beds available in the space studied.
For its part, the Getis–Ord general G (d) test gives a value of the statistic G of 0.0829, which gives a score z of 1.6091, owing to which we cannot reject the null hypothesis of the random distribution of the variable in the space at a confidence level of 95%. In other words, with the results obtained in this test we cannot affirm that the beds for tourists are not distributed at random in the space analysed.
From the results obtained for each of these tests the lack of coincidence can be appreciated; this may be due to the weak relationship of the variable which means that this relationship is not maintained in all the tests carried out. In turn, this weak relationship may be a sign of an equal bid on the part of the public administration of Extremadura for the development of accommodation infrastructures apart from the resources and the tourist potential of each tourist territory in the region.
On the other hand, the study carried out up to now only takes into account the analysis of the beds at a global level, i.e., considering the whole of the target territory. The fact that a global distribution pattern is not identified, or that if it is identified it is weak, does not imply that it is impossible for there to be groups of lodgings at a local level with values of the variable which are very different from the average values of their neighbours. For this reason, Moran’s local I test has been calculated; this will allow us to obtain further knowledge on the distribution of beds for tourists at a local level. The results obtained can be observed in
Figure 3.
In view of
Figure 3, it can be concluded that certain areas exist in which groups of accommodation establishments offer a higher number of beds than those located in neighbouring areas. In the case of the two main towns of the region, both of which are provincial capitals, the existence of several accommodation establishments with high values of the variables in comparison with the value of neighbouring locations can be observed. In these two locations, therefore, one can speak of the existence of two clusters of high values of the variables, i.e., of two clusters in which the accommodation establishments offer a higher number of beds than those located in neighbouring areas.
In the same way, this technique will allow the identification of atypical spatial entities, i.e., those with a high (or low) value of the variable which are surrounded by low (or high) values. In this case, one can observe the existence of three accommodation establishments with a high number of beds compared with the average offered by neighbouring establishments. In turn, there are also two accommodation establishments which offer a small number of beds and are surrounded by neighbouring establishments offering on average a higher number. Finally, two isolated lodgings were also identified with a high number of beds in comparison with the average. In all cases, the results obtained will not be taken into consideration in the analysis performed as we are here concerned with findings related to isolated accommodation establishments, which although they are significant in terms of the administration of the same, do not allow the forming of accommodation groups which suggest that the results can be extended to the entire territory.
Once the analysis of the distribution of the variable of the beds available in the territory of the region has been completed, it can be concluded in the first place that there is a slight tendency towards the concentration of the values of the variable in the total space of the region. Secondly, the existence is confirmed of two groups of accommodation clusters offering a high number of beds in comparison with the average for the territory and which are located in the two main centres of population: Badajoz and Cáceres.
Subsequently, we proceed to repeat the analysis performed for the second variable which is the subject of this study, the occupation level, which will allow the identification of the level of adjustment existing between supply and demand for the region of Extremadura.
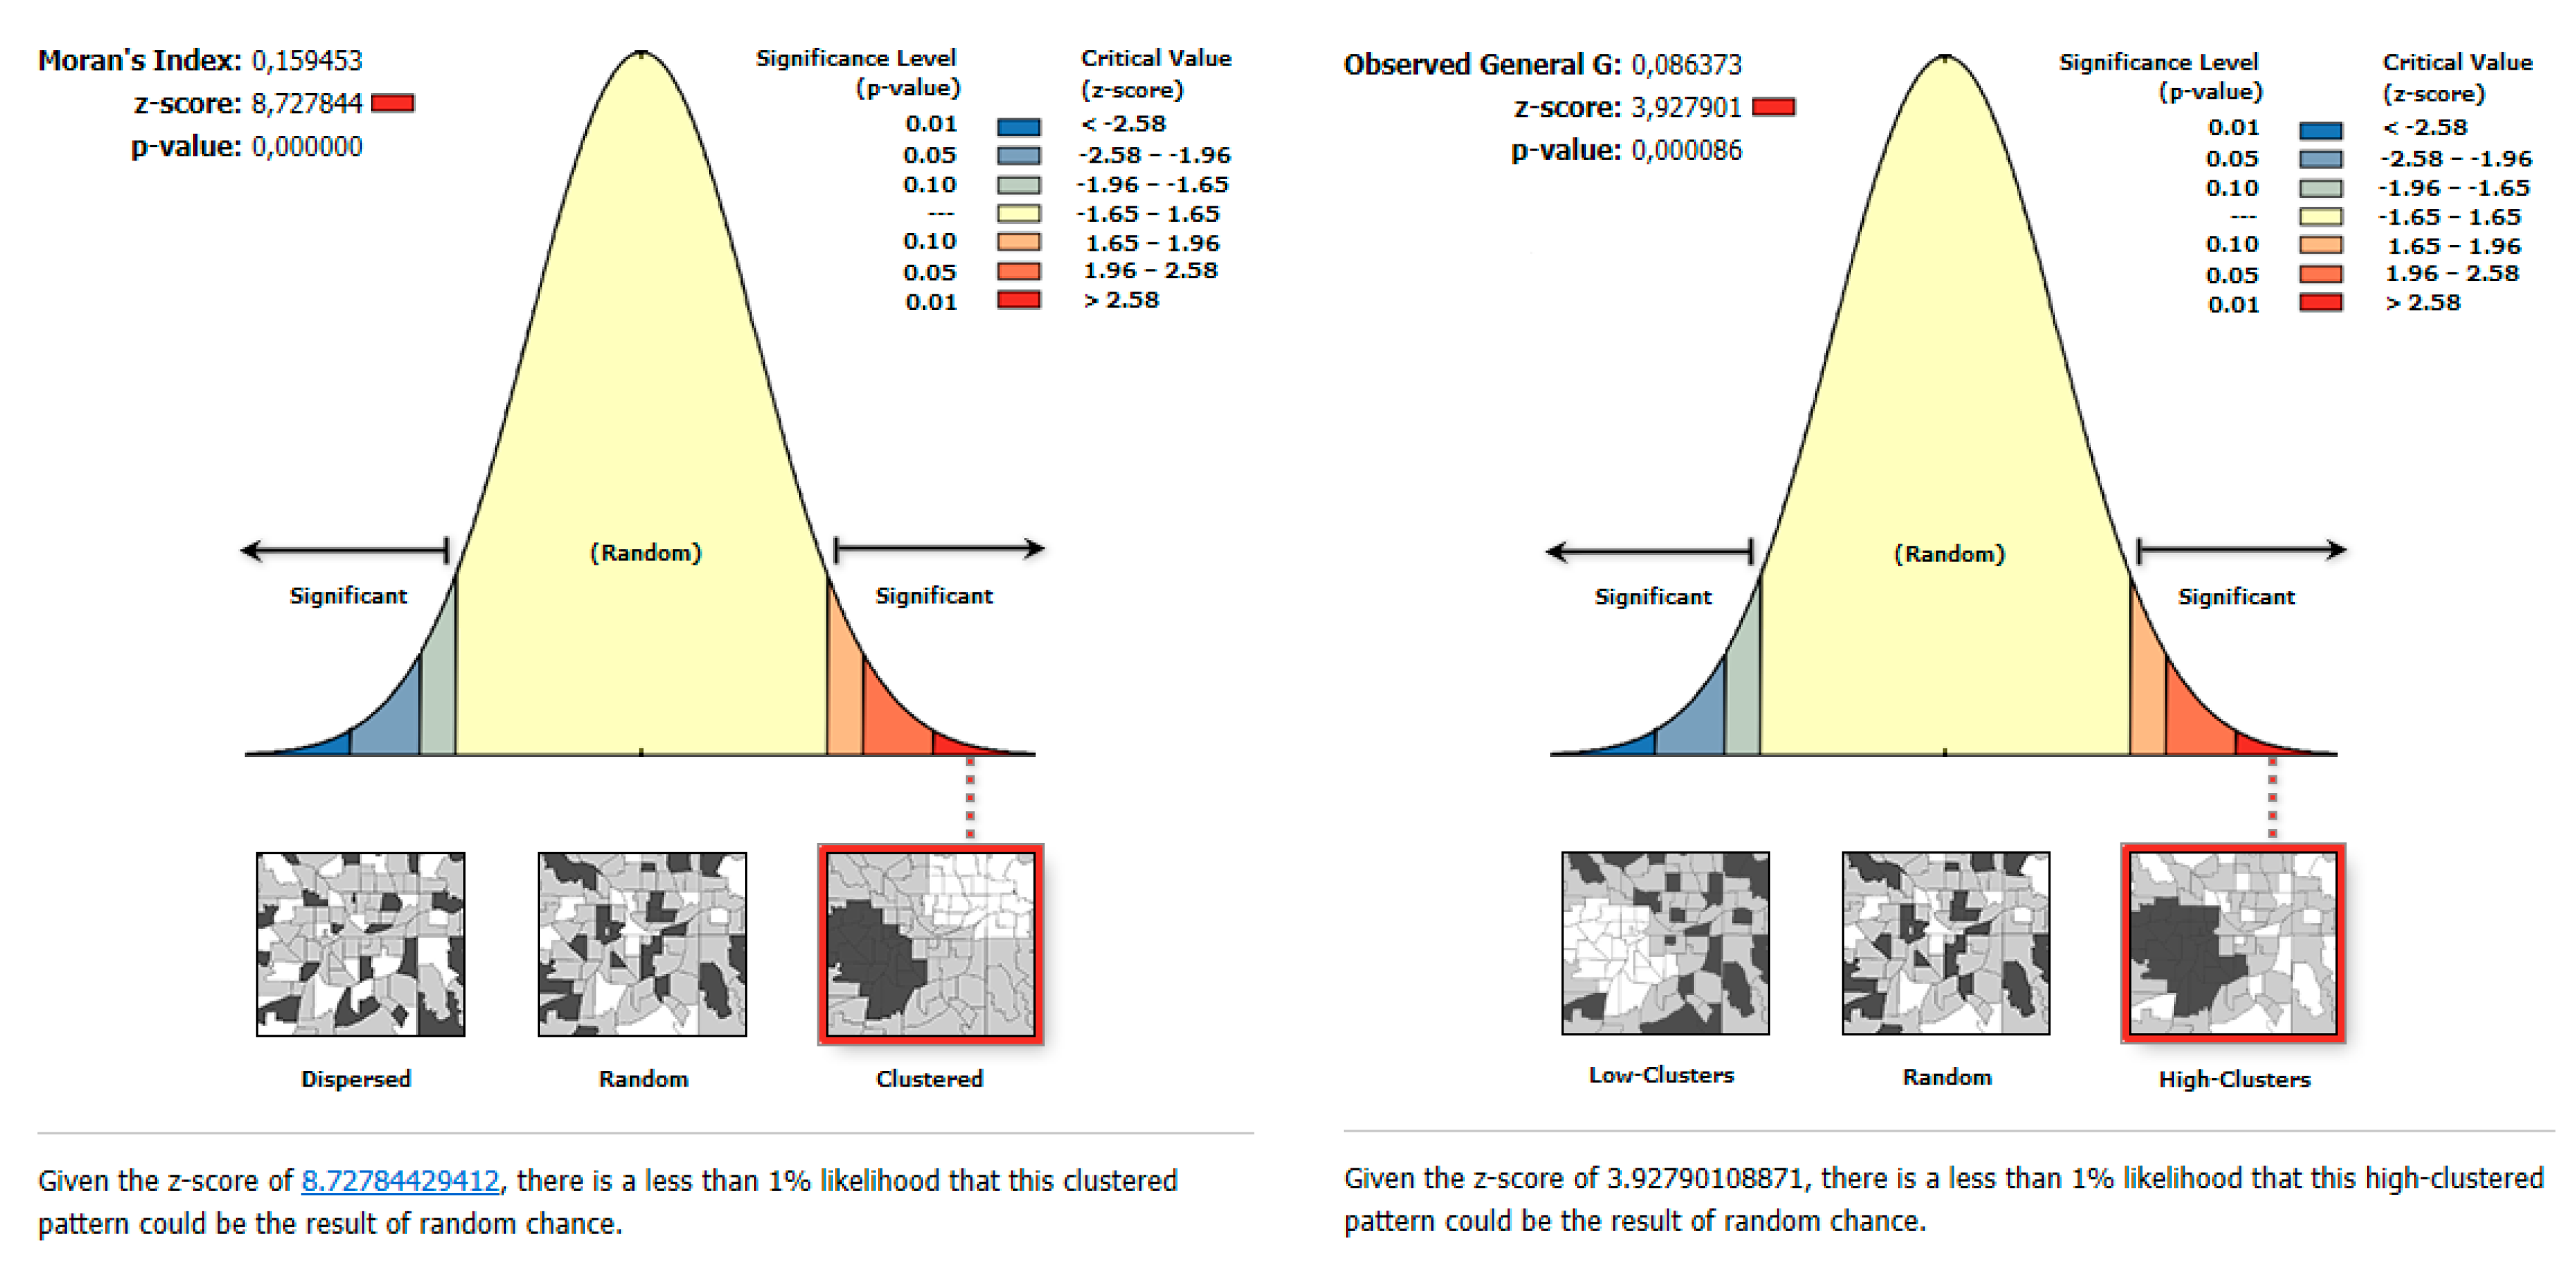
Figure 4 shows the results obtained for Moran’s global I test and the Getis–Ord general G (d) test.
As can be seen in
Figure 4, statistic I has a value of 0.1594, which means a score
z of 8.7278; it can therefore be confirmed that at a significance level of 1% there is a pattern of the concentration of the variable in the space. In other words, at a confidence level of 99% it is confirmed that the similar values of the variable have a tendency towards concentration in the space.
For its part, the Getis–Ord general G (d) test gives a statistic with a value of 0.0863, with the score z being 3.9279, and a p-value of practically zero. This implies that a significance level of 1% confirms that the variable tends to concentrate in the space and moreover is concentrated at high values.
As we can see, both results coincide and confirm the existence of a global pattern of the concentration of the occupation level variable in high values of the same. However, the contrast of the two results obtained with respect to the global distribution of the variables allows us to confirm the initial suspicions regarding the results of the expansionary growth policies used as development strategies in the region. These have allowed the tourist places in the region to have a practically homogeneous distribution pattern, thus only obtaining confirmation of a weak tendency to concentrate in the high value space that is not confirmed in the totality of the tests performed. On the other hand, the results obtained for the occupation level do confirm the existence of a strong tendency to group high values in the region, which suggests the existence of a serious imbalance in terms of the efficiency of these places that should be studied in an exhaustive way with the objective of being able to create strategic lines that fit the reality of each of the territories in which the region is divided, with the ultimate goal of achieving sustainable tourism development throughout the territory.
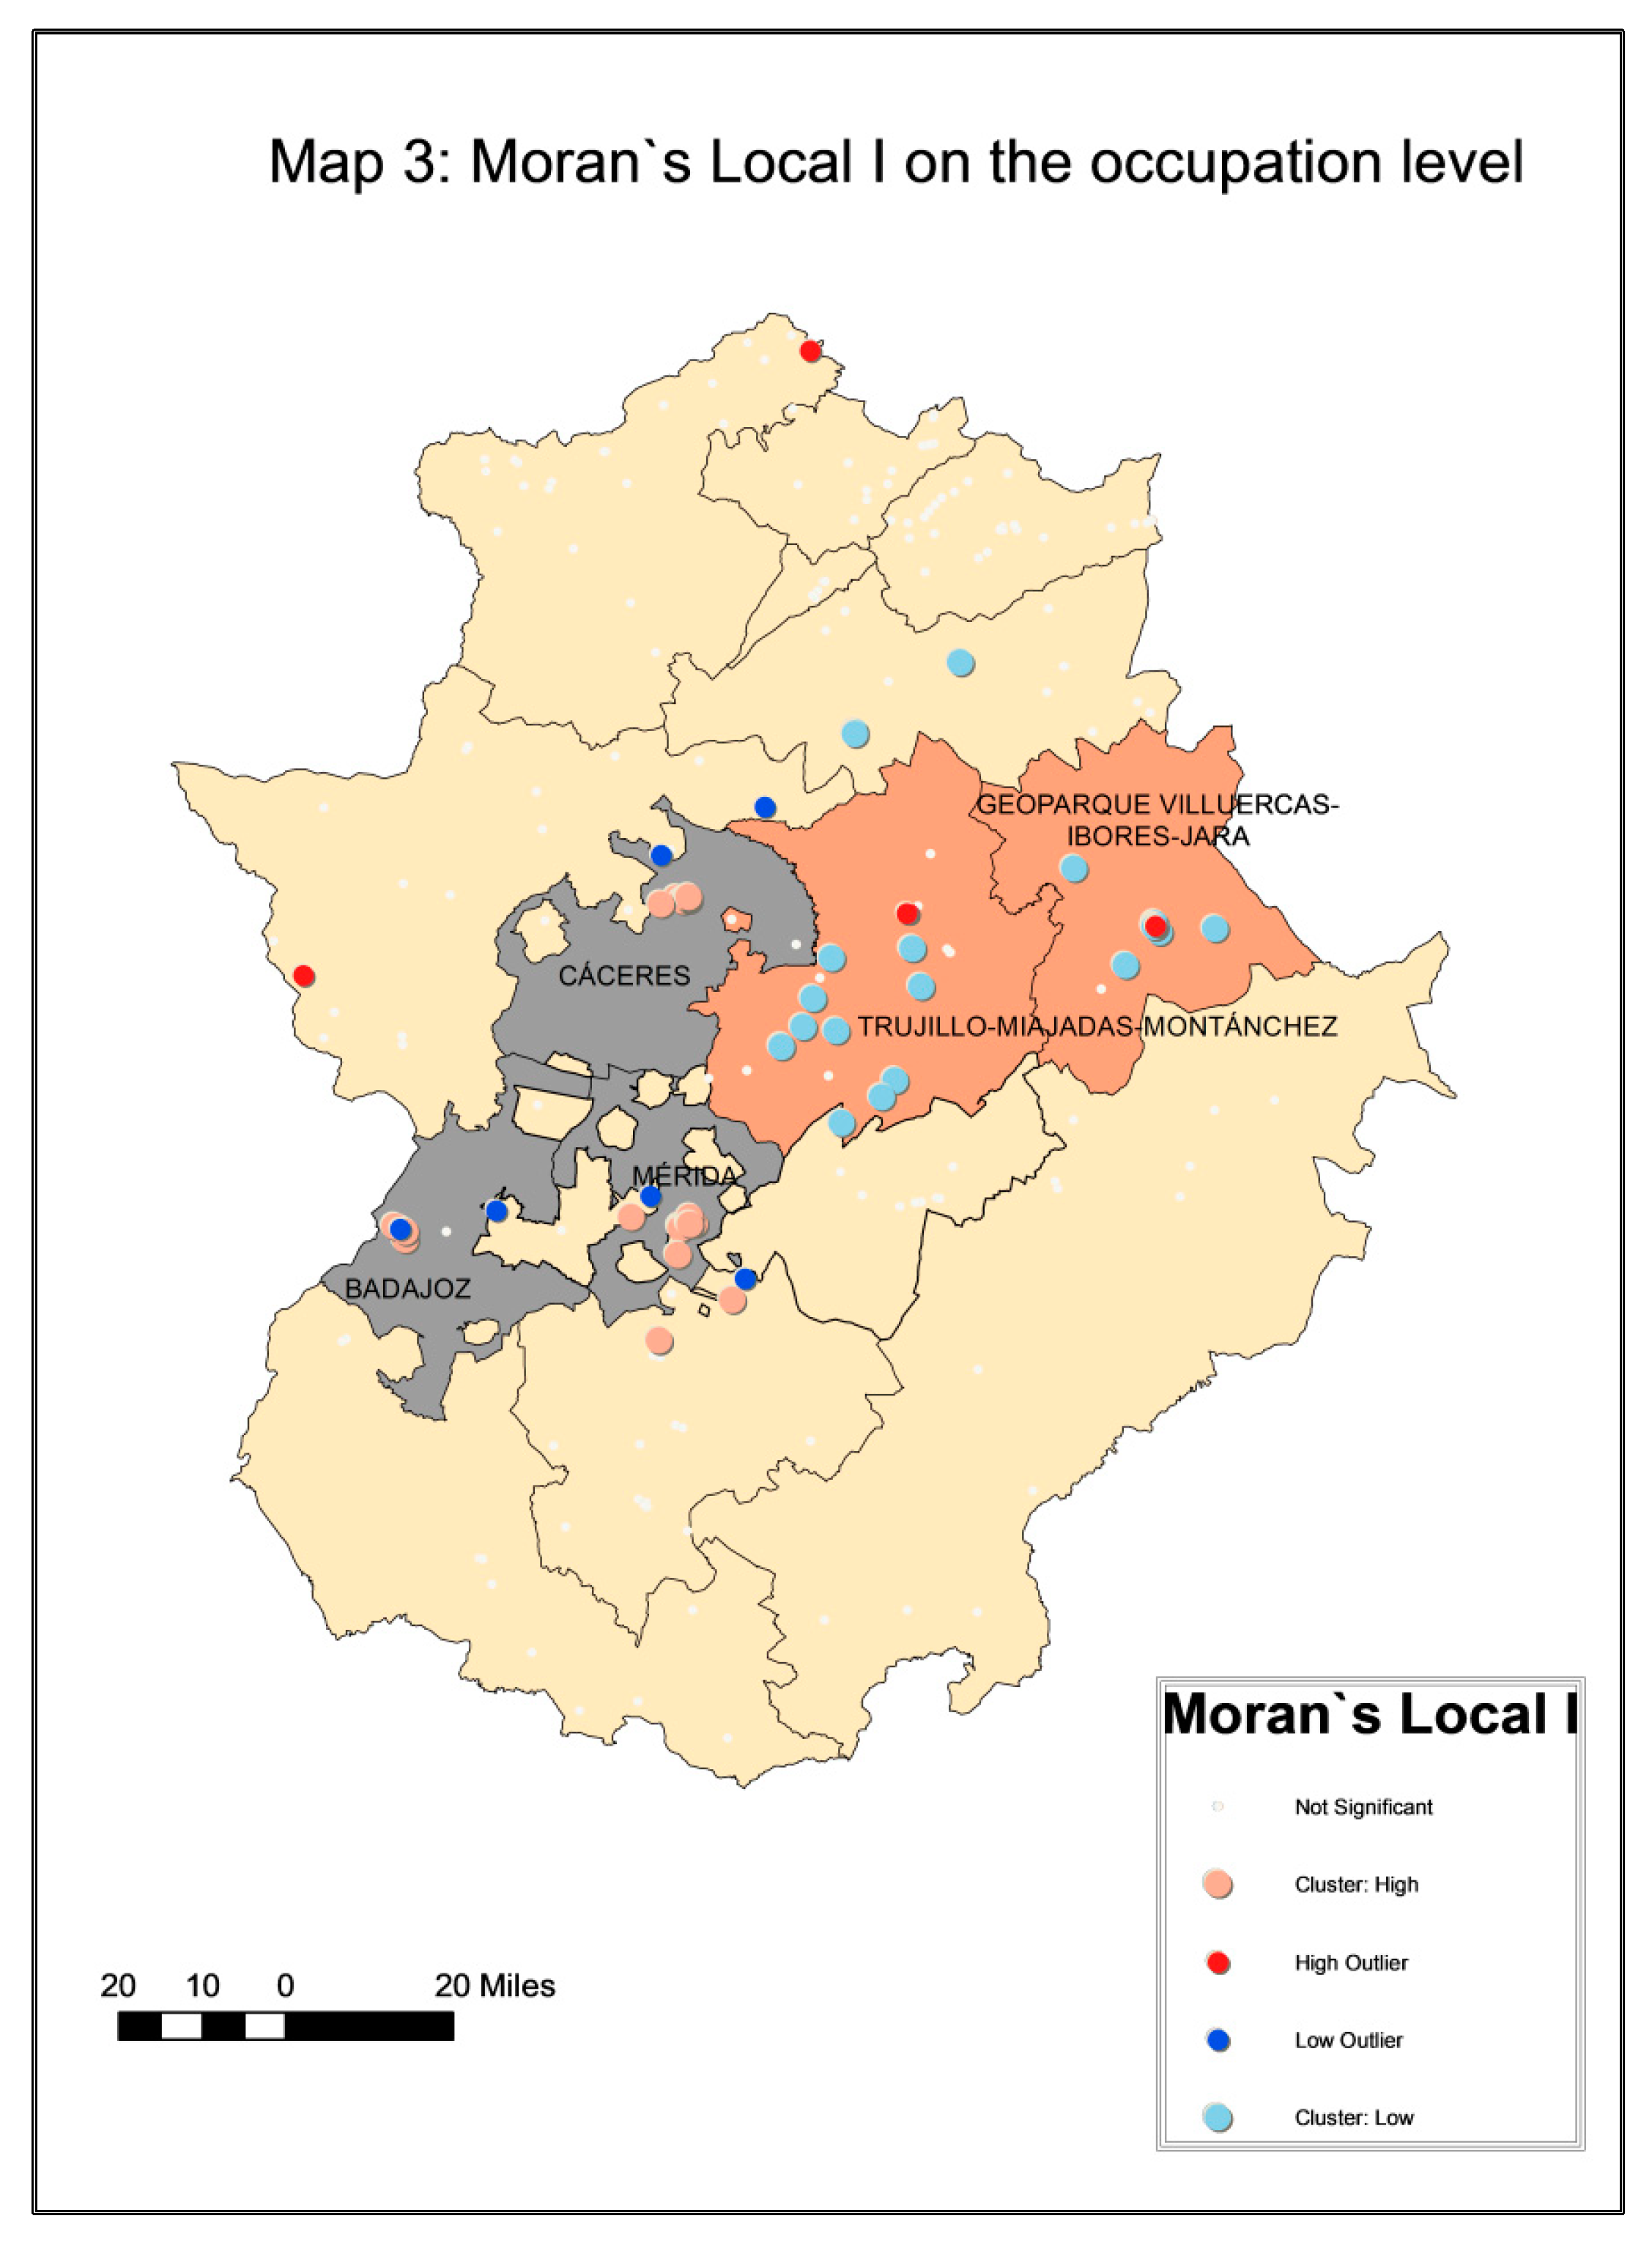
The local analysis of the variable by means of Moran’s local
I test allows determining whether groups with similar behaviour are created and their locations. The results of this analysis can be seen in detail in
Figure 5.
In view of the results obtained, the presence of different groupings of spatial clusters with similar values as to the occupation level is confirmed, i.e., they show a high or low level of adjustment between supply and demand in comparison with the average value to be expected in the space analysed.
Firstly, we can observe the presence of three clusters of high values of the occupation level variable located in the towns of Badajoz, Mérida, and Cáceres. These three territories are therefore characterised by the presence of a high number of lodgings with higher occupation levels than would be expected from the average value of their neighbouring territories. If we take the occupation level as a proxy indicator, we find that these are the three territories in the region with the best adjustment between supply and demand.
For their part, the presence of two clusters of low values is observed in the territories of Trujillo-Miajadas-Montánchez and the Villuercas-Ibores-Jara Geopark. In these territories, therefore, we find a set of accommodation establishments with the common characteristic of a low occupation level with regard to the average value to be expected in the month and territory analysed. In accordance with the above reasoning, these two territories are those with the worst adjustment between supply and demand, owing to which they must concentrate on developing strategies allowing the increasing of said occupation level so that the creation of the existing beds for tourists fulfils the mission of creating wealth and employment in the territories analysed.
Finally, the presence of different spatial outliers and outlier types is observed, such as high outliers and low outliers. As can be seen, these are not grouped together in any of the territories in question but are rather isolated cases of accommodation establishments with a casuistry causing this situation owing to specific management, or to obtaining better or worst results than those to be expected in the territory in which they are to be found. Although these results could represent a valuable output for each specific accommodation establishment, they go beyond the scope of the global objective of this research, which consists of the location of groupings, which as their situation is similar, can help the administration to characterise them, and as from this starting point to create common lines of strategy which allow the optimum tourist development of each territory analysed.
As a general conclusion of the distribution pattern of the occupation level variable, it should be stressed that in contrast to what occurred with the beds available, on this occasion a strong tendency to the concentration of high values in the space can be observed. This conclusion is confirmed with the existence of various clusters of high and low values, which requires an analysis of the same before carrying out any task of tourist planning in the interests of achieving more efficient management.
6. Discussion and Conclusions
The analytical possibilities of the inclusion of GIS for the application of the techniques of spatial statistics have opened up many options for achieving highly exhaustive analyses in the territories and their spatial dimension. By means of the application of said techniques it is possible to identify spatial distribution patterns of the variables under study in a given territory and also to identify groupings of entities with a similar or different behaviour to that which could be expected in a homogeneous distribution of the variable. The main advantages deriving from the identification of these clusters is that they will allow the joint planning of more extensive territories, in which owing to their characteristics it is possible to analyse the initial situation and at the same time the existing needs to establish a common goal, making use of the advantages of this joint planning regarding management.
It is for this reason that more and more studies are concentrating on analysing the distribution patterns of the variables related to tourism in the space, with the aim of improving the planning and management of the territory. These studies are characterised by being essentially focussed on demand, concentrating their efforts on studying the distribution in the space of the accommodation capacity of the territory.
This study expands this perspective, completing the analysis of the supply with a detailed analysis of the distribution of the occupation level, taking this last variable as a proxy indicator of the satisfactory level of adjustment between supply and demand in the territory. By means of this analysis therefore, the objective of getting to know the efficiency of each territory with regard to the hotel beds offered is achieved, identifying accommodation groupings with similar characteristics in the territory and which therefore can be examined for correct planning and management in a joint manner.
Moreover, this analysis also presents the novelty, regardingthose tudied on the region previously, of using a geostatistical approach which allows the using as an analytical unit the maximum level of territorial disaggregation possible, the location of the establishment itself. As a result, the contributions of this research allow on the one hand exhaustive knowledge of the distribution pattern of the two variables which are the subject of study in the month of reference used, and on the other hand the laying down of the methodological foundations allowing their repetition at different moments in time, allowing in this way the considerable enriching of the results obtained. In this sense, and after performing various tests in accordance with the characteristics of the sample used, the decision was taken to consider as the most suitable neighbourhood criterion a fixed band distance of 15.79 miles.
With regard to the main results obtained from this study, it should be emphasised that the beds available in the total territory analysed have a weak tendency towards the concentration of values in the space. However, given that this relationship is not significant in the Getis–Ord general G (d) test, it cannot be confirmed whether this tendency is the result of the concentration of high or low values of the variable.
From a local perspective, the presence has been detected of two clusters of high values in the main population centres of the region, i.e., in the towns of Cáceres and Badajoz.
The analysis of the global distribution of the occupation level variable identifies a strong tendency towards concentration in the space, and moreover this spatial concentration occurs with high values. It is therefore a variable with the characteristic of a contagion effect which allows the increase of a variable in a given space, favouring also the value taken in its proximal locations, which is a clear indication that joint management has the possibility of benefitting a wider extension than that of the territory itself.
In relation to the study of the distribution of the occupation level at a local scale, the presence is identified of three spatial clusters of high values located in Badajoz, Cáceres, and Mérida. These territories are therefore characterised by concentrating a high number of accommodation establishments with high occupation levels in comparison with what would be expected in a homogeneous distribution of the variable in the territory.
With regard to the administration of this result, it must be taken into account that although these three territories stand out as being the most efficient in relation to the beds they provide, the result only implies that they have a good initial situation as the average occupation level of each of these territories in the month analysed varies from 38.2% in Badajoz, 40.2% in Cáceres, and 60.7% in Mérida as has been calculated from the data available from the Extremadura Tourism Observatory. In all cases it can be observed that there is clearly room for improvement, and that there is no evidence to assume that the same are exceeding the maximum load capacity to ensure sustainable management, owing to which said territories should in the first place find out whether this situation remains constant over time. Secondly, the regional administration should analyse the characteristics of the offer of tourist products, which at the moment places them in this position, and finally analyse the possibilities of the territory in accordance with their allocation of resources so as to improve the initial situation.
On the other hand, the analysis has also allowed the identification of two accommodation clusters with low occupation values in relation to the figures for accommodation in their neighbouring locations; these are the territories of Trujillo-Miajadas-Montánchez and the Villuercas-Ibores-Jara Geopark. The average occupation levels of these territories are 20.7% and 16.7%, respectively. These figures are below the regional average, which is 25.8% of the beds available for the month being studied.
We are therefore concerned with two territories with a demand deficit which they must resolve if the beds they offer are to contribute to the creation of wealth and employment. It would be recommendable to perform an exhaustive analysis on the supply of the type of tourist product these territories currently offer with the aim of determining whether there is a strong dependence on any specific tourist type with a marked seasonality which is causing this situation. If necessary, the existing offer should be diversified with the aim of palliating this deficit and improving the results. In short, once the similarity of the initial situation has been detected, the analysis of the reasons will give rise to a series of common needs which will be those allowing the articulation of the lines of action to bring about the more efficient management of their resources.
To conclude this analysis of the results, it should be pointed out that both in the local analysis of the distribution of the beds available and in the respective occupation level a series of accommodation establishments appear which represent both clusters of similar values (HH or LL) and an outlier of HL and LH values. These results have not been detailed among the main conclusions of this study, as all of them are found in the space in isolation, owing to which said findings, although they may constitute a valuable output for the managers of these establishments, are beyond the scope of this study, the purpose of which is the comprehensive (or global) management of the territory.
One of the main limitations of this research is that the results obtained are restricted to the timeframe used, July 2015. In order to resolve this shortcoming, we propose as a future line of research the extending, by means of the repetition of the methodology proposed, of the results to a wider timeframe, preferably annual to limit the possible effects of seasonality in each of the territories, so as to find out whether the clusters identified are maintained throughout the whole of the tourist season, and also the possibility that new associations may appear so as to expand the knowledge on the region of Extremadura. Likewise, it would be enriching to complete the analysis of the tourist reality of the region and be able to design properly adapted development strategies, disaggregate the results obtained according to the type of accommodation, taken into account variables such size, quality, the profile or ownership, among others, to eliminate the possible effects that the peculiar characteristics of the results might be introducing into each one of them.


