Disproportionate Water Quality Impacts from the Century-Old Nautanen Copper Mines, Northern Sweden


Abstract
1. Introduction
2. Materials and Methods
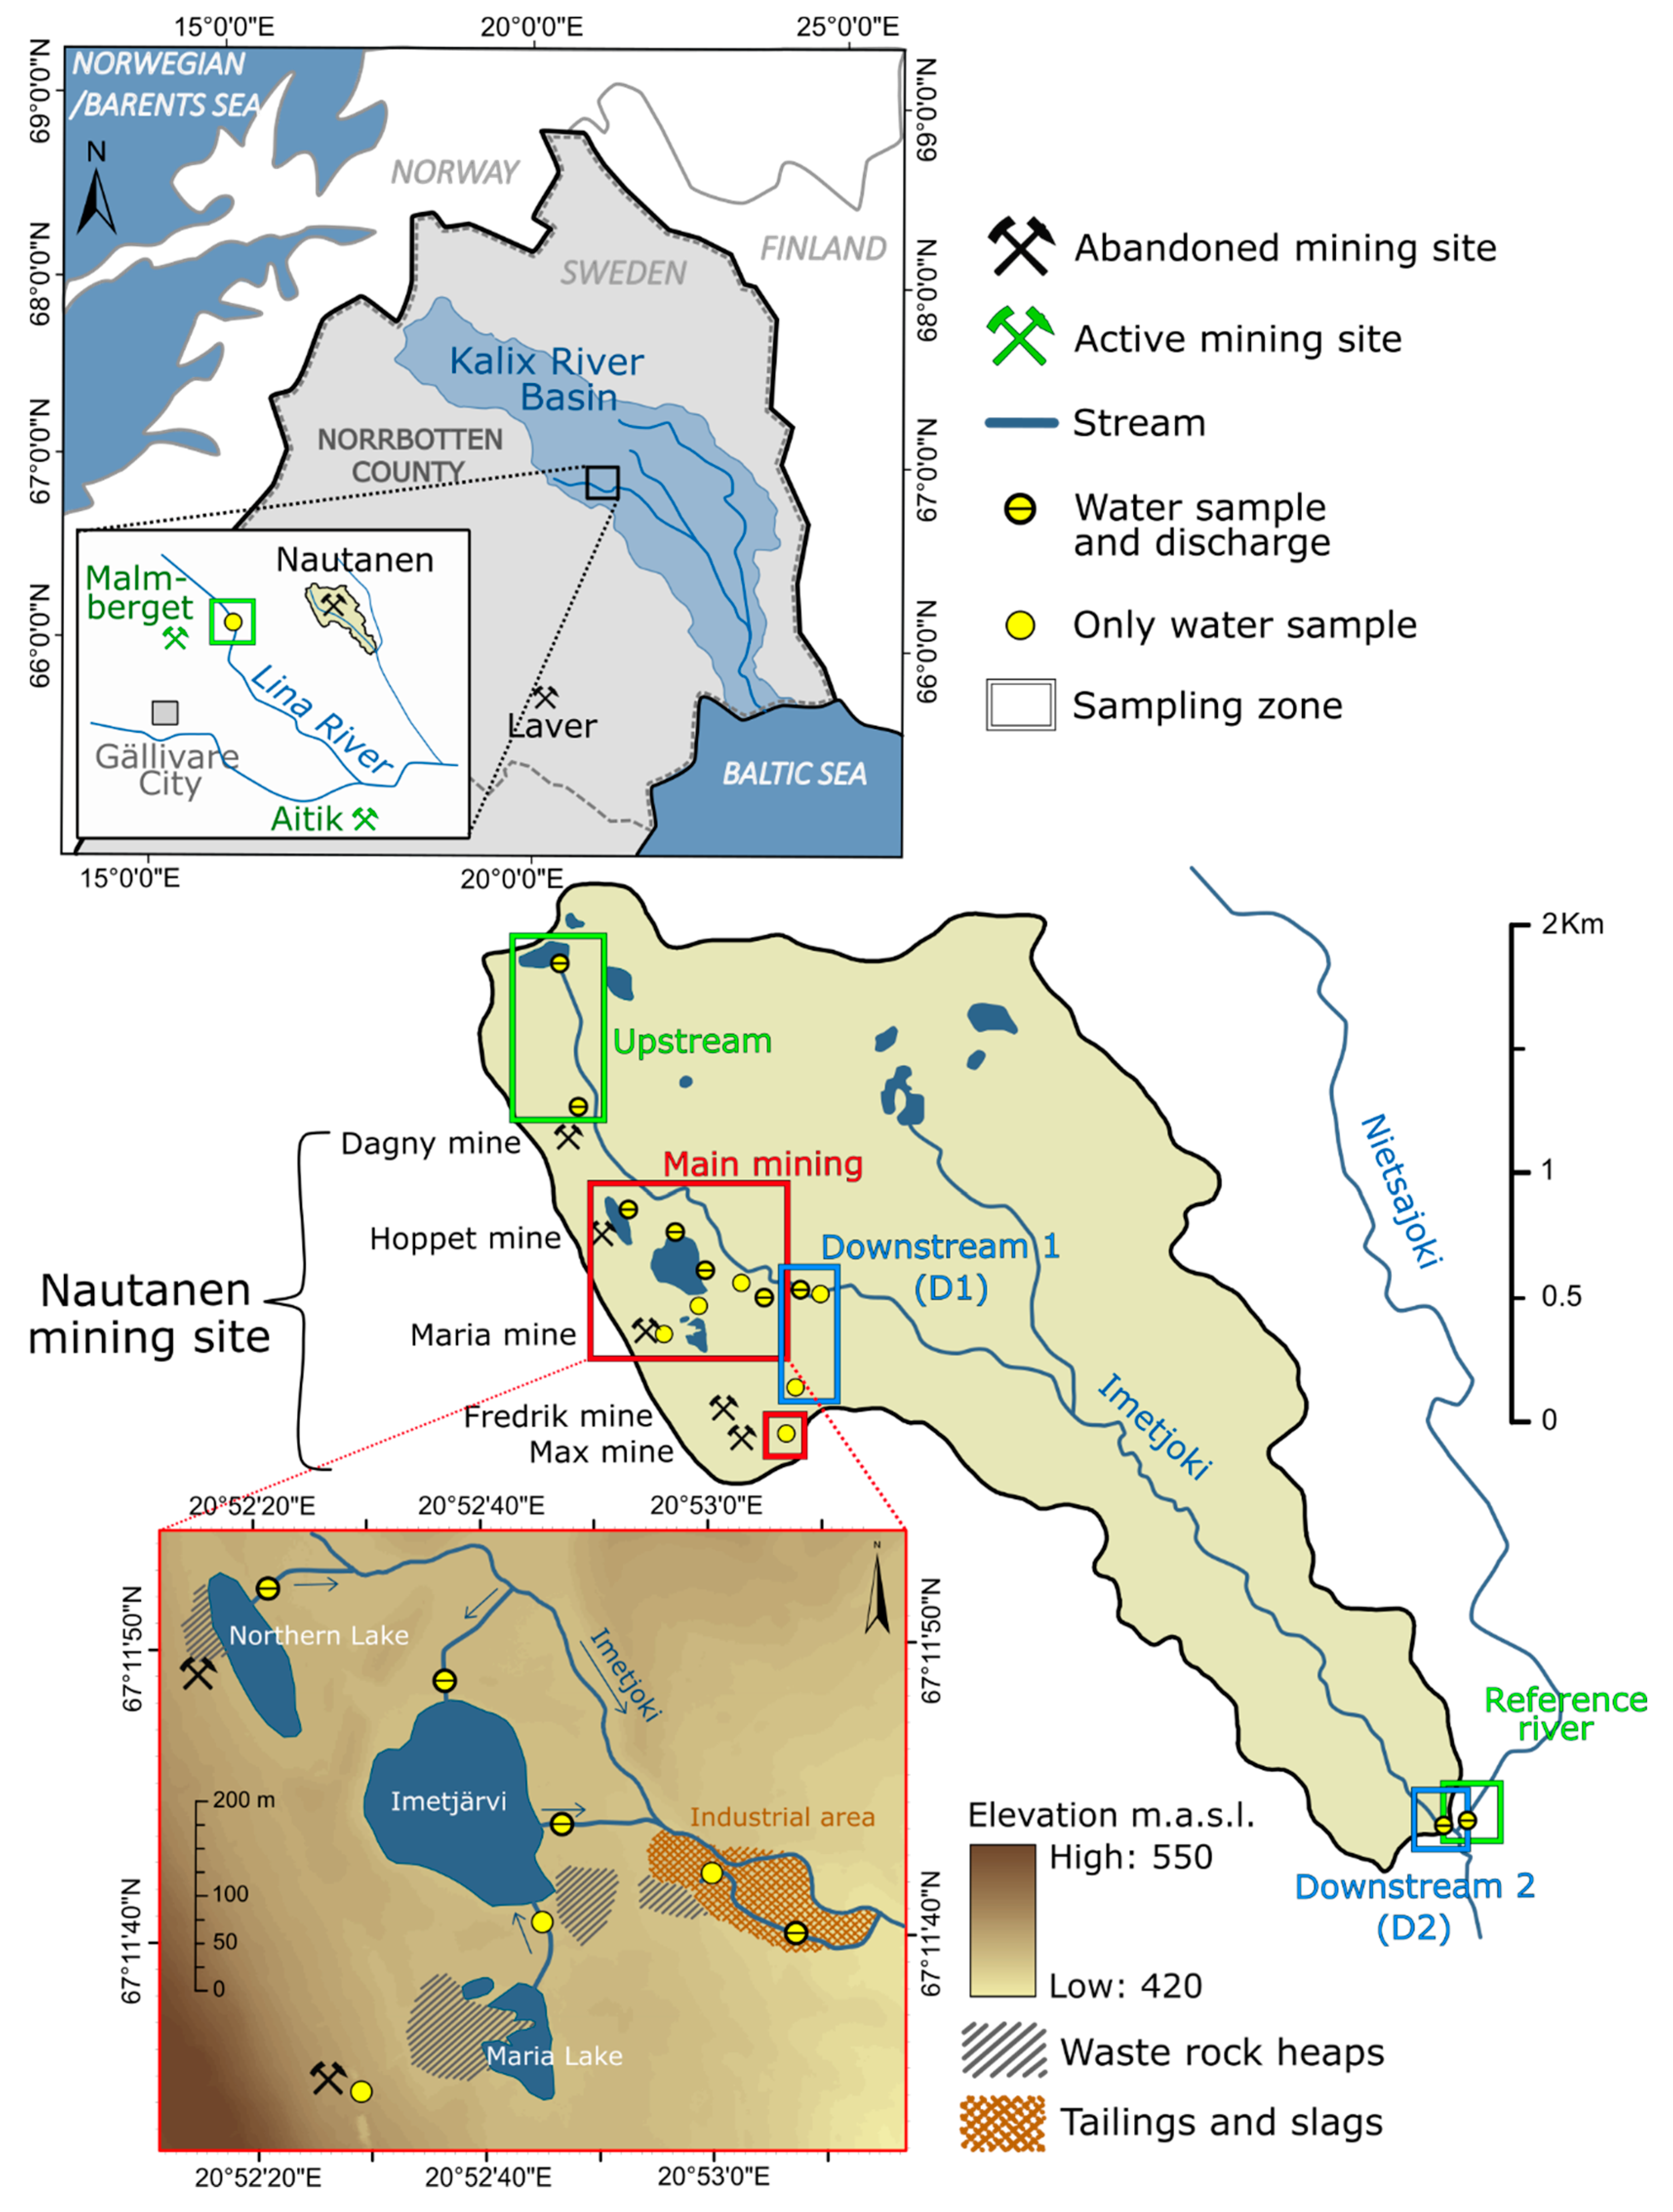
2.1. Site Description
2.1.1. Historical Background
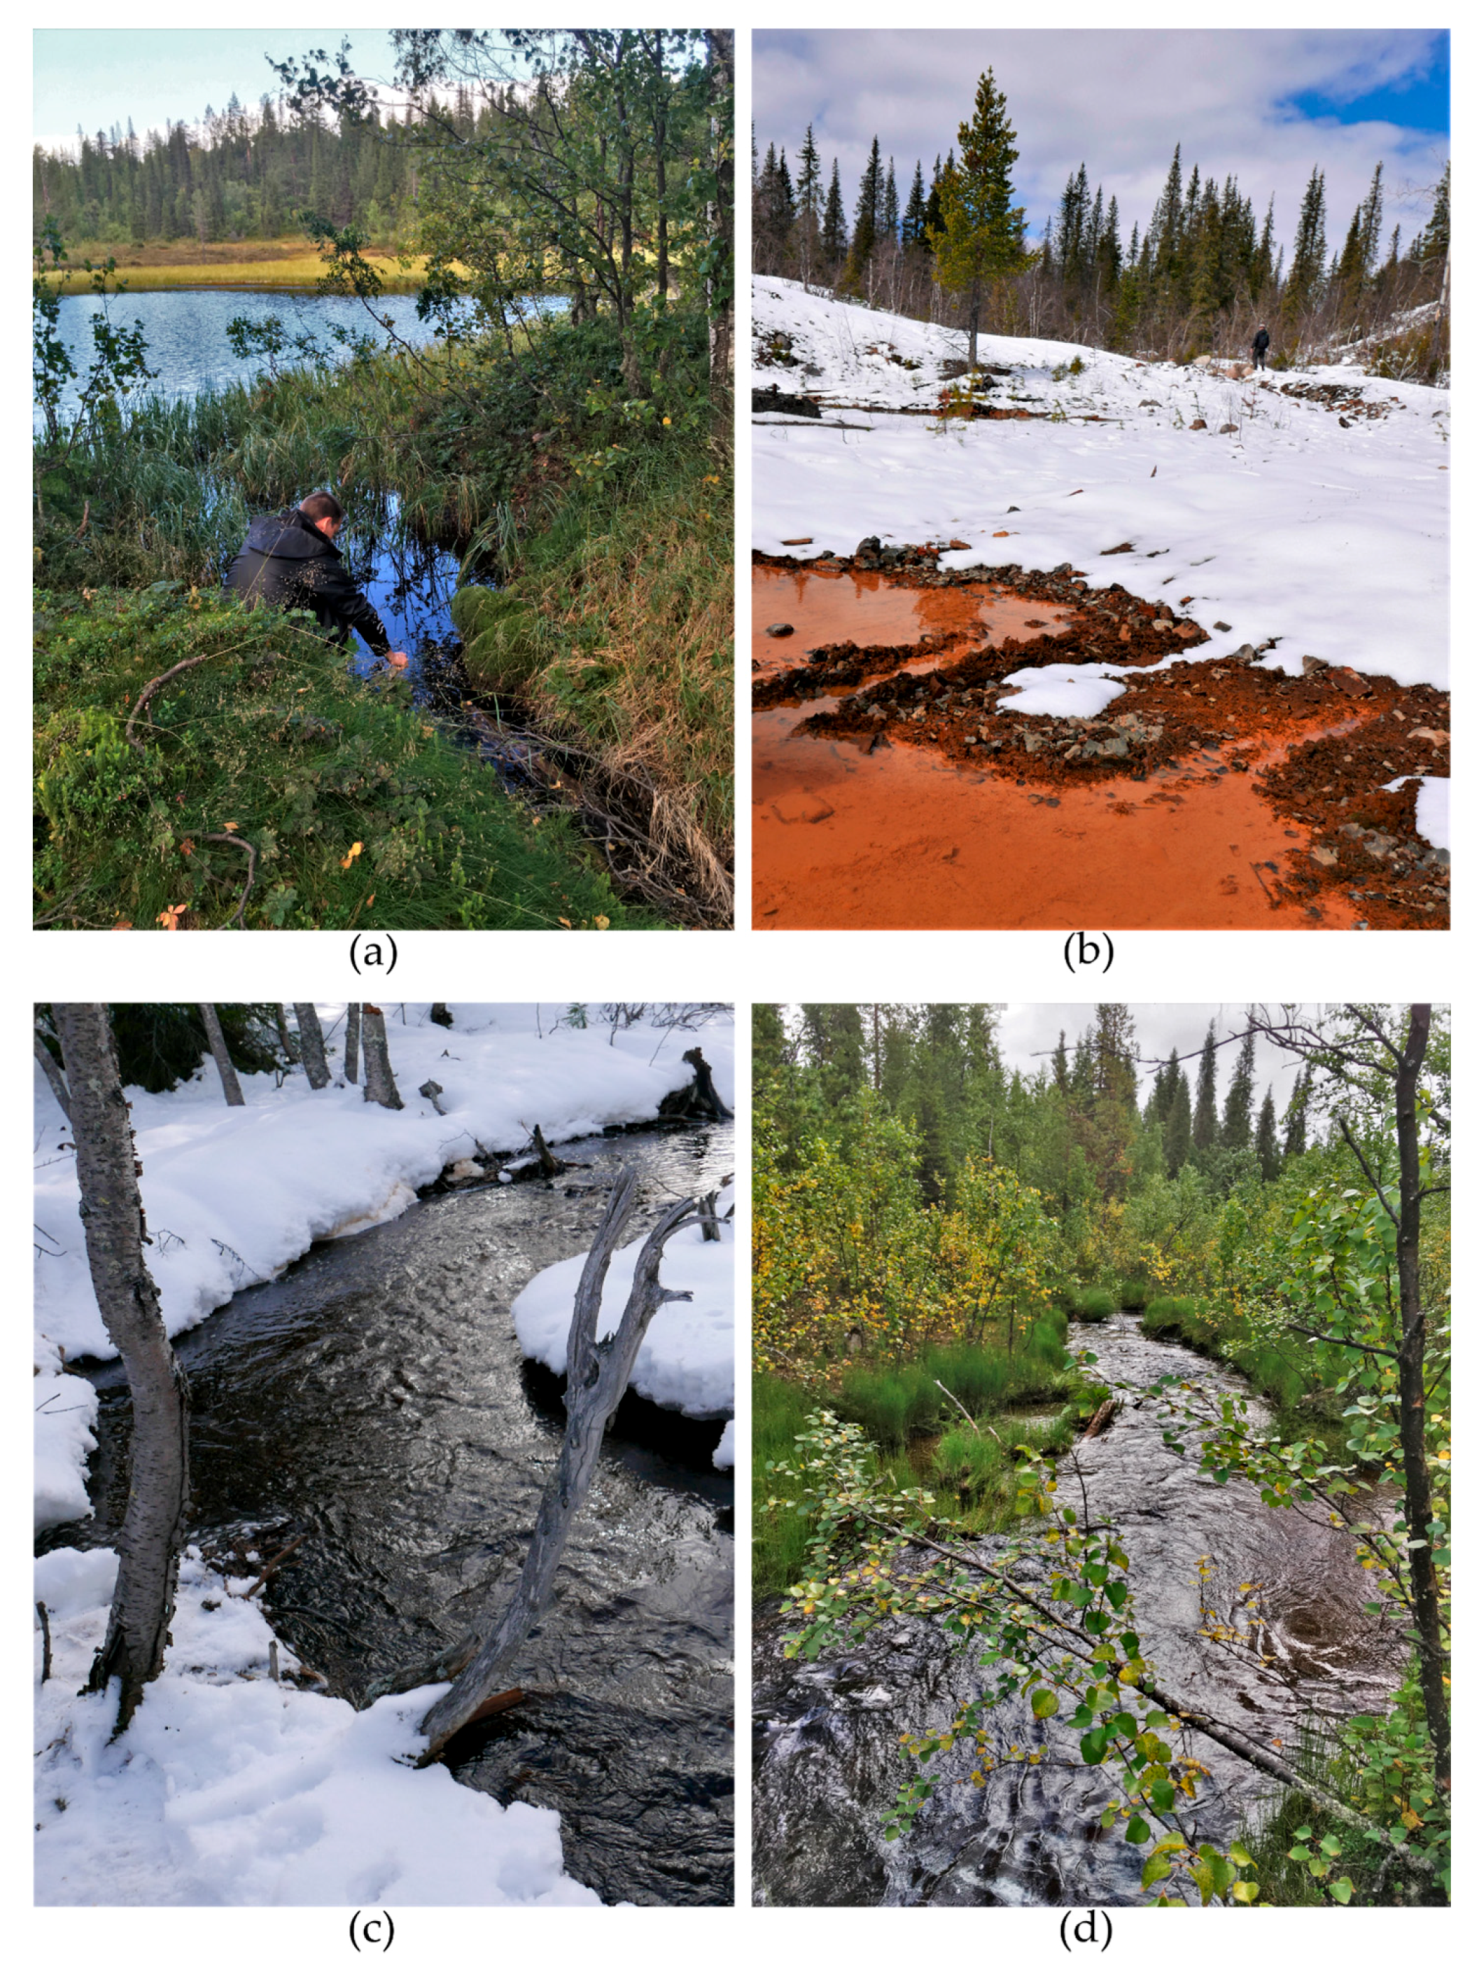
2.1.2. Climate and Environmental Setting
2.2. Methods
2.2.1. Field Measurements and Data Synthesis
2.2.2. Mass Flow Analysis
3. Results
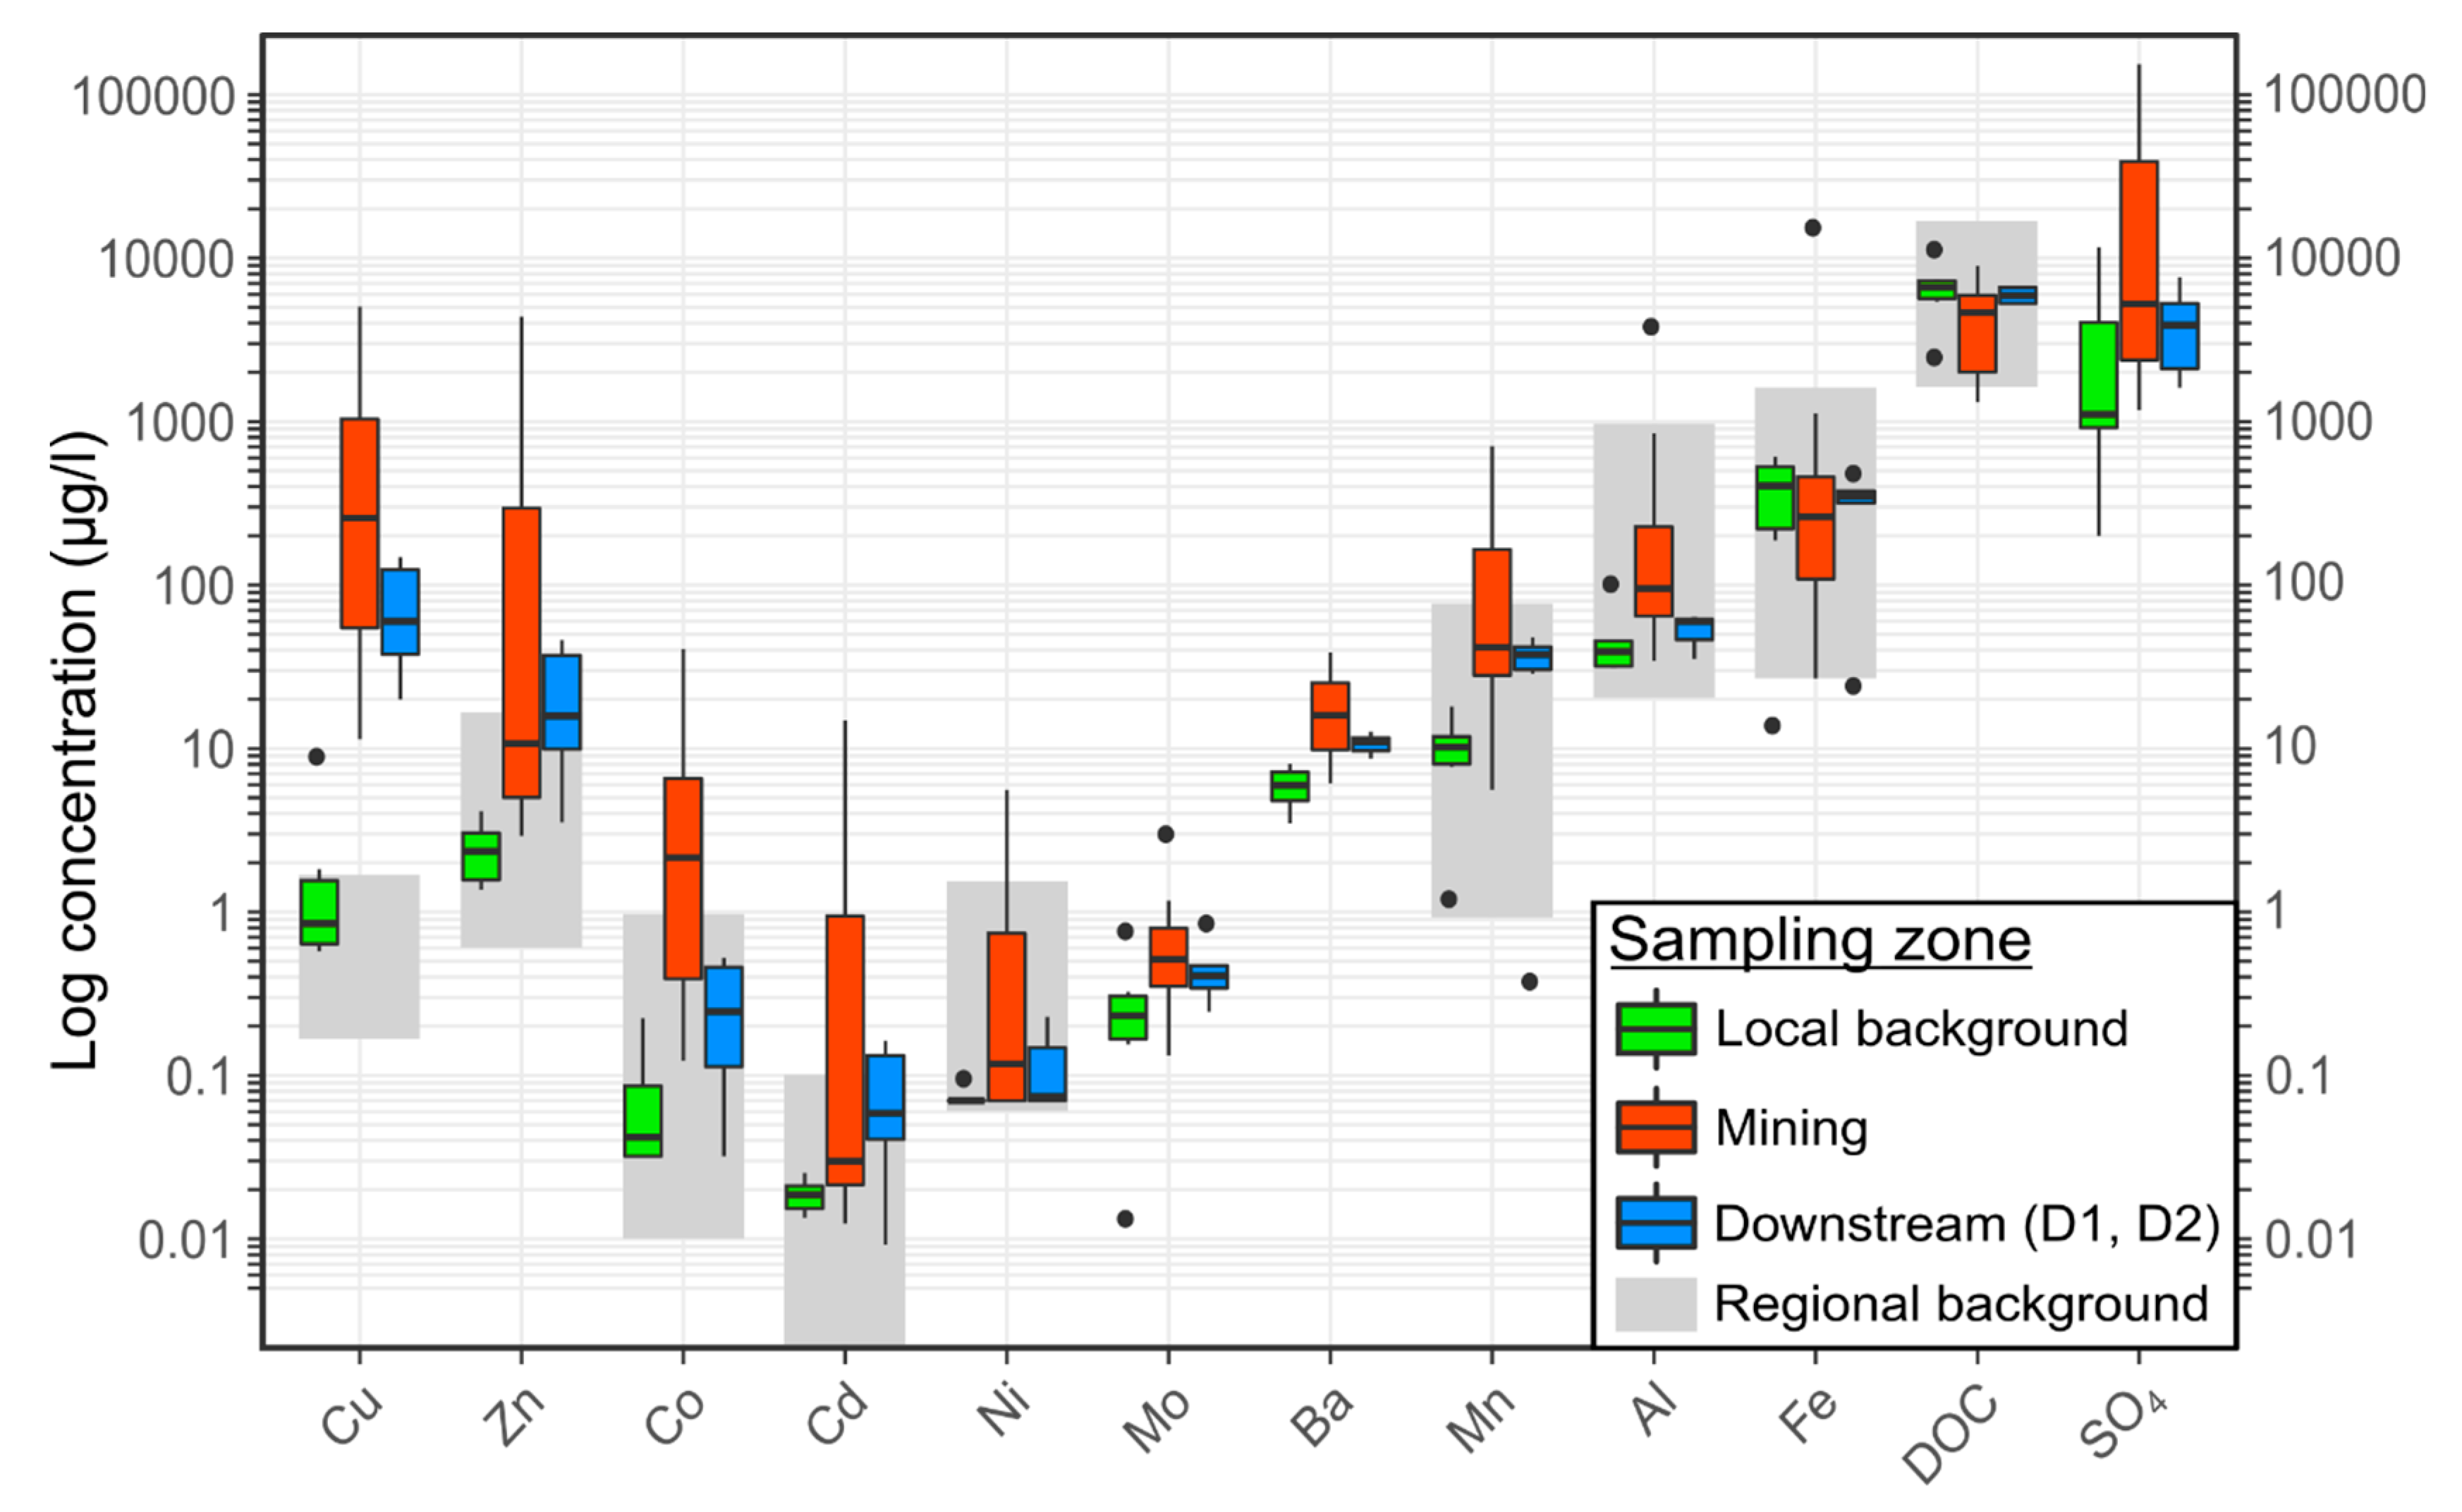
3.1. Water Quality
3.2. Concentration Enrichment and Element Mass Flow Increases
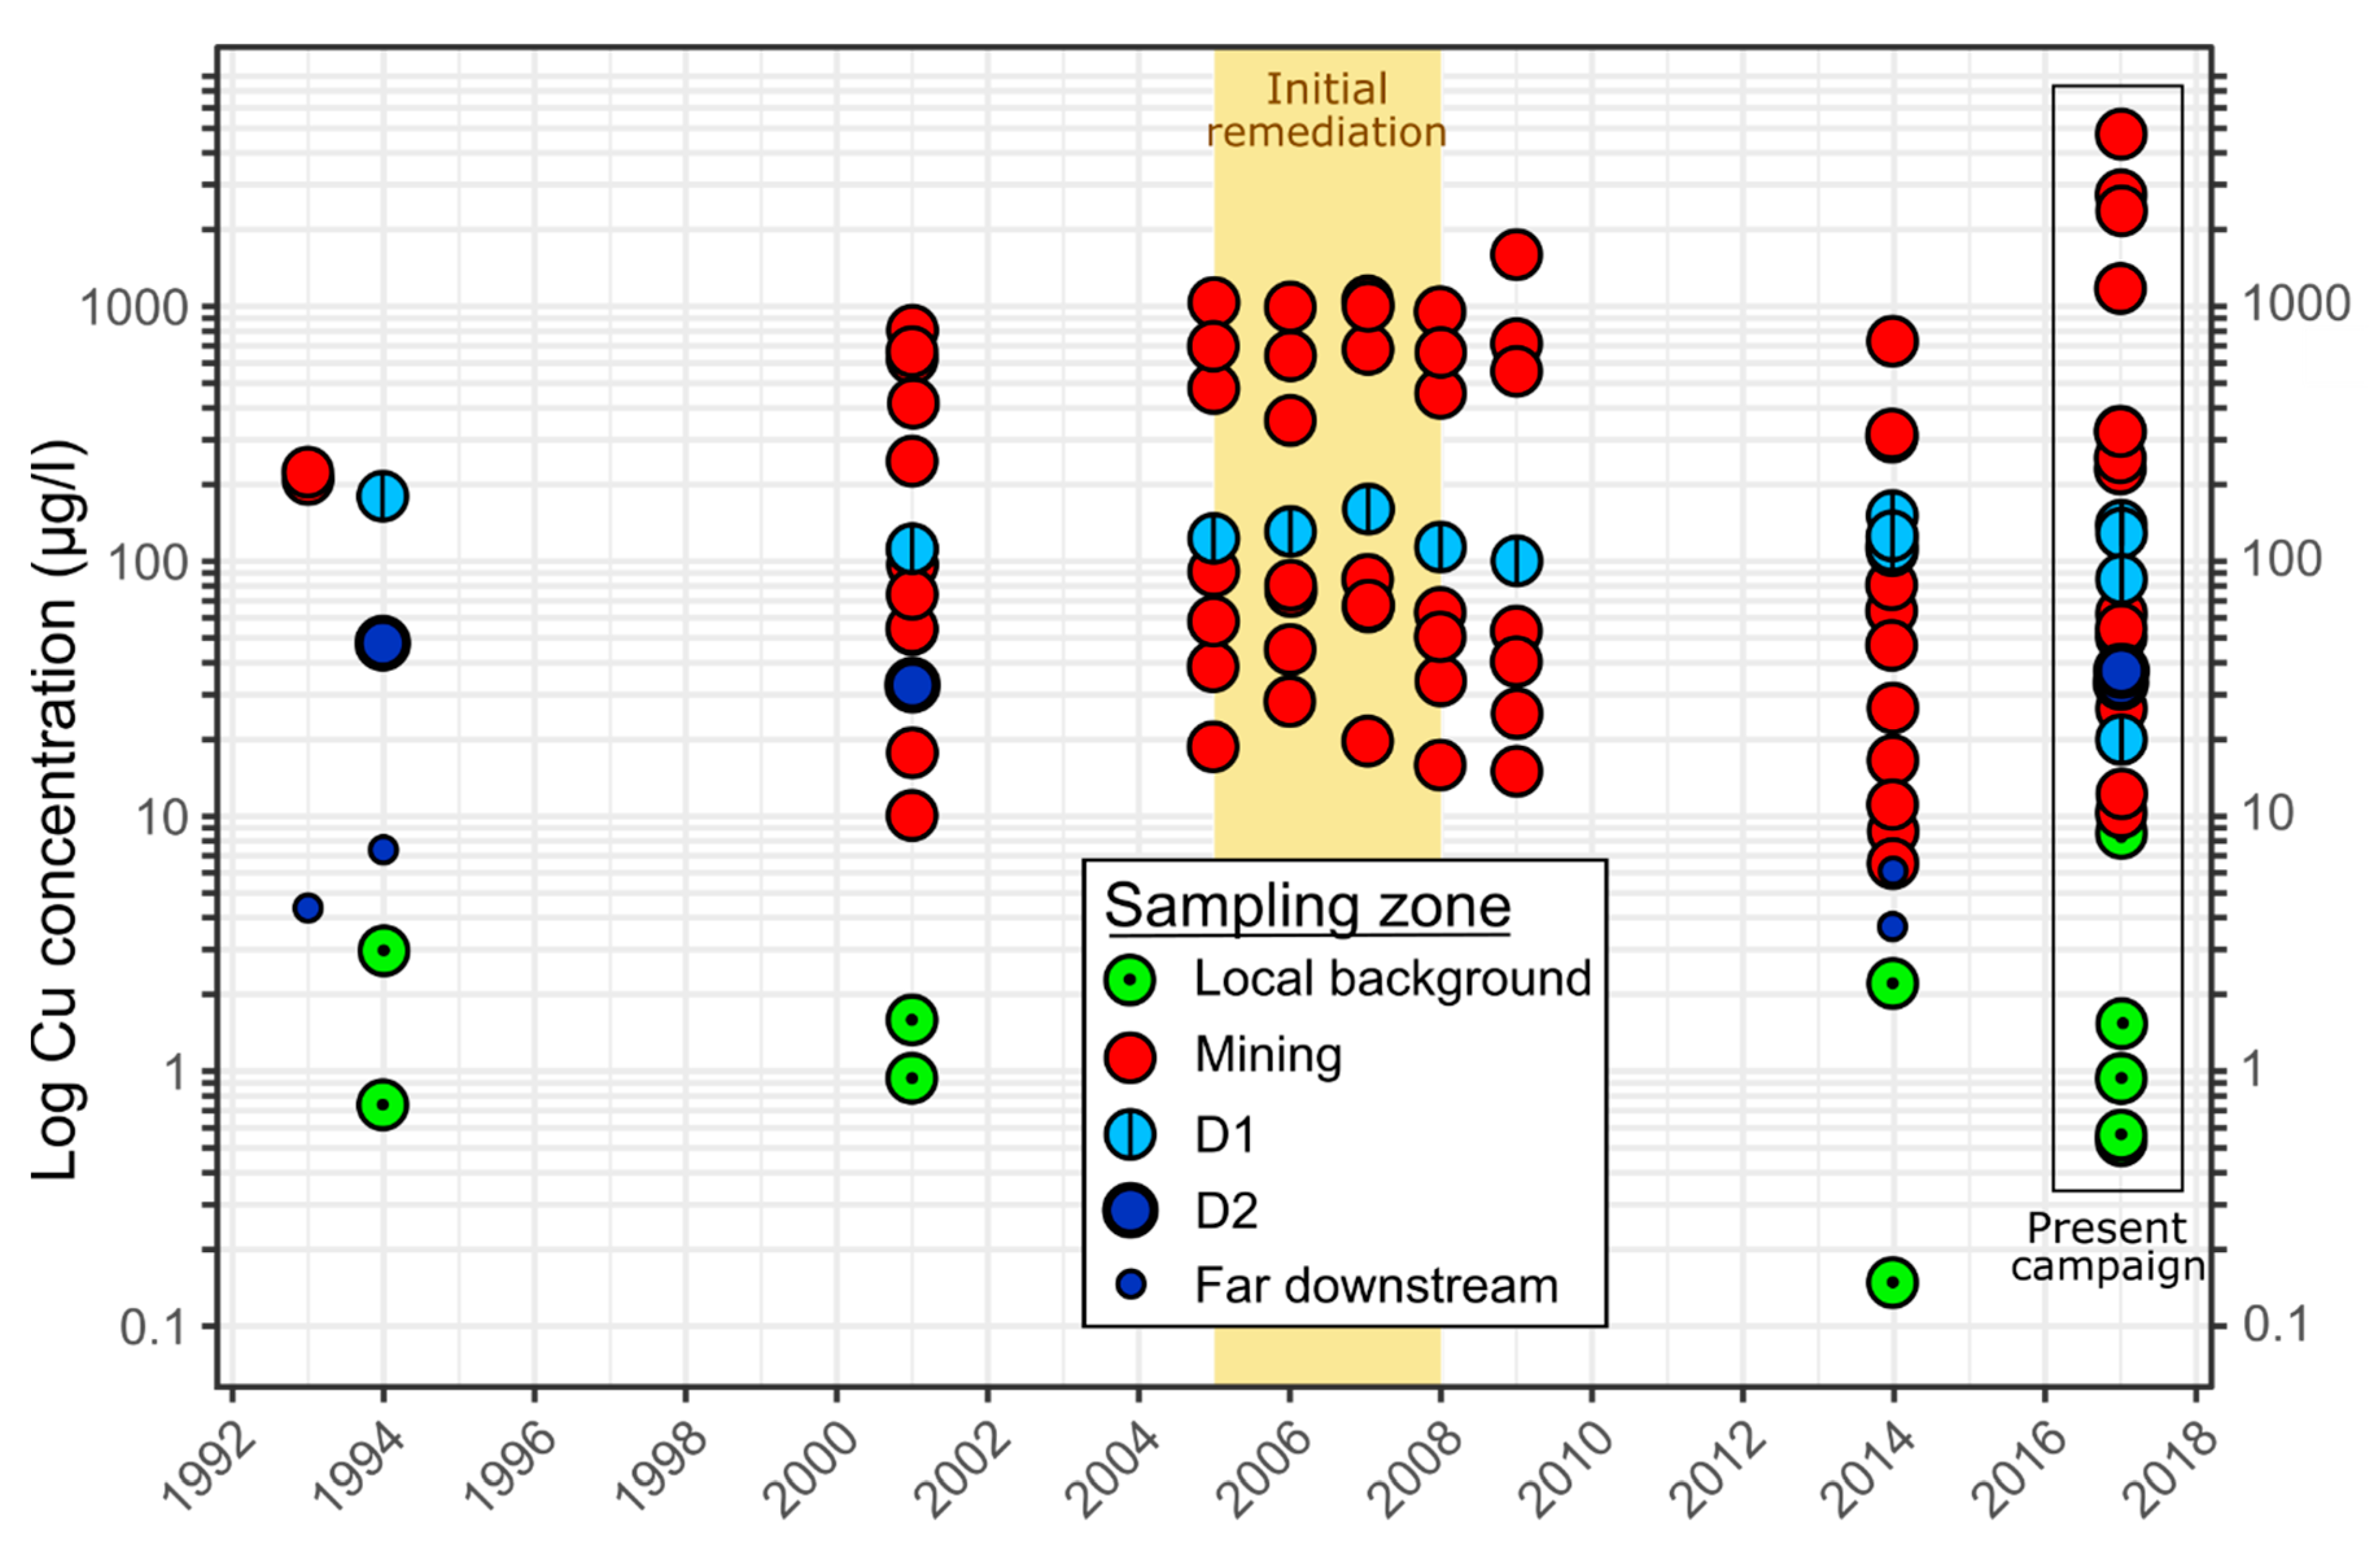
3.3. Historical Cu Measurements
4. Discussion
5. Conclusions
- Despite the small spatial scale of the Nautanen mining site, the short duration of operation, and the long time (approximately 110 years) since closure, the average concentrations of Cu, Zn, and Cd on-site (990, 280, and 1.0 µg/L, respectively) and downstream of the mining site (150, 50, and 0.2 µg/L, respectively) were generally considerably above local (7.2, 3.0, and 0.010 µg/L, respectively) and regional (1.6, 11, and 0.10 µg/L, respectively) background values. In particular, downstream Cu concentrations were consistently high throughout the surveyed 25-year period (1993–2017).
- The on-site mass flows of Cu, Zn, Co, and Cd were estimated to be between 100 and 300 times higher than upstream of the mining site. For Cu, the average mass flows were 1.2 kg/yr upstream of the main mining zone, 450 kg/yr on the main mining zone, and about 70 kg/yr 100 m to 4 km downstream of the site. Many metals exhibited a similar spatial pattern, indicating an on-going considerable retention of metals at or near the main mining zone, corresponding to 380 kg/yr for Cu.
- Compared to other major abandoned mines in the Arctic, the metal loads from the Nautanen mining site were found to be unexpectedly high relative to the (small) amount of tailings and slag products produced. More generally, our approach based on stream load-to-tailing ratios show that small abandoned mining sites, which are numerous, could add disproportionately large amounts of metals to the surface water systems. Such effects need to be accounted for in assessments of total pollutant pressures in the relatively sensitive Arctic environment.
Supplementary Materials
Author Contributions
Funding
Acknowledgments
Conflicts of Interest
References
- Lottermoser, B. Mine Wastes: Characterization, Treatment and Environmental Impacts, 3rd ed.; Springer: Berlin/Heidelberg, Germany, 2010; ISBN 978-3-642-12418-1. [Google Scholar]
- Mayes, W.M.; Potter, H.A.B.; Jarvis, A.P. Inventory of aquatic contaminant flux arising from historical metal mining in England and Wales. Sci. Total Environ. 2010, 408, 3576–3583. [Google Scholar] [CrossRef] [PubMed]
- Pavlowsky, R.T.; Lecce, S.A.; Owen, M.R.; Martin, D.J. Legacy sediment, lead, and zinc storage in channel and floodplain deposits of the Big River, Old Lead Belt Mining District, Missouri, USA. Geomorphology 2017, 299, 54–75. [Google Scholar] [CrossRef]
- Olías, M.; Cánovas, C.R.; Nieto, J.M.; Sarmiento, A.M. Evaluation of the dissolved contaminant load transported by the Tinto and Odiel rivers (South West Spain). Appl. Geochem. 2006, 21, 1733–1749. [Google Scholar] [CrossRef]
- Olías, M.; Nieto, J.M.; Sarmiento, A.M.; Cerón, J.C.; Cánovas, C.R. Seasonal water quality variations in a river affected by acid mine drainage: The Odiel River (South West Spain). Sci. Total Environ. 2004, 333, 267–281. [Google Scholar] [CrossRef] [PubMed]
- Barry, K.L.; Grout, J.A.; Levings, C.D.; Nidle, B.H.; Piercey, G.E. Impacts of acid mine drainage on juvenile salmonids in an estuary near Britannia Beach in Howe Sound, British Columbia. Can. J. Fish. Aquat. Sci. 2000, 57, 2032–2043. [Google Scholar] [CrossRef]
- Lindeström, L.; Tröjbom, M. Konsekvenser för Faluån, Runn och Dalälven av Åtgärder på Gruvavfall i Falun [English: Consequences for the Faluån River, Runn and Dalälven River from Remediation of Mine Waste in Falun]; Faluprojektet: Report 6403; Swedish Environmental Protection Agency: Stockholm, Sweden, 2010; ISBN 978-91-620-6403-7. [Google Scholar]
- Widerlund, A.; Öhlander, B.; Ecke, F. Mining and Sustainable Development: Environmental Aspects of Mining; Luleå University of Technology: Luleå, Sweden, 2014. [Google Scholar]
- Government Offices of Sweden. Sweden’s Mineral Strategy: For Sustainable Use of Sweden’s Mineral Resources that Creates Growth throughout the Country. Available online: https://www.government.se/49b757/contentassets/78bb6c6324bf43158d7c153ebf2a4611/swedens-minerals-strategy.-for-sustainable-use-of-swedens-mineral-resources-that-creates-growth-throughout-the-country-complete-version (accessed on 20 January 2020).
- Callaghan, T.V.; Johansson, M.; Brown, R.D.; Groisman, P.Y.; Labba, N.; Radionov, V.; Bradley, R.S.; Blangy, S.; Bulygina, O.N.; Christensen, T.R.; et al. Multiple Effects of Changes in Arctic Snow Cover. AMBIO 2011, 40, 32–45. [Google Scholar] [CrossRef]
- Søndergaard, J.; Halden, N.; Bach, L.; Gustavson, K.; Sonne, C.; Mosbech, A. Otolith Chemistry of Common Sculpins (Myoxocephalus scorpius) in a Mining Polluted Greenlandic Fiord (Black Angel Lead-Zinc Mine, West Greenland). Water. Air. Soil Pollut. 2015, 226, 336. [Google Scholar] [CrossRef]
- Alakangas, L.; Öhlander, B.; Lundberg, A. Estimation of temporal changes in oxidation rates of sulphides in copper mine tailings at Laver, Northern Sweden. Sci. Total Environ. 2010, 408, 1386–1392. [Google Scholar] [CrossRef] [PubMed]
- Moncur, M.C.; Ptacek, C.J.; Lindsay, M.B.J.; Blowes, D.W.; Jambor, J.L. Long-term mineralogical and geochemical evolution of sulfide mine tailings under a shallow water cover. Appl. Geochem. 2015, 57, 178–193. [Google Scholar] [CrossRef]
- Malinovsky, D.; Rodushkin, I.; Moiseenko, T.; Öhlander, B. Aqueous transport and fate of pollutants in mining area: A case study of Khibiny apatite–nepheline mines, the Kola Peninsula, Russia. Environ. Geol. 2002, 43, 172–187. [Google Scholar]
- Efimov, V.A.; Chalov, S.R.; Efimova, L.E.; Ivanov, V.A.; Jarsjö, J.; Fischer, S. Impact of mining activities on the surface water quality (case study of Khibiny mountains, Russia). IOP Conf. Ser. Earth Environ. Sci. 2019, 263, 012008. [Google Scholar] [CrossRef]
- Leppänen, J.J.; Luoto, T.P.; Weckström, J. Spatio-temporal impact of salinated mine water on Lake Jormasjärvi, Finland. Environ. Pollut. 2019, 247, 1078–1088. [Google Scholar] [CrossRef] [PubMed]
- Boas, S.W.; Slotsbo, S.; Patricio Silva, A.L.; Larsen, M.M.; Damgaard, C.; Holmstrup, M. Increased frequency of freeze-thaw events in a future climate can significantly increase negative effects of copper on enchytraeids. Appl. Soil Ecol. 2016, 107, 272–278. [Google Scholar] [CrossRef]
- Bergman, H. Gällivare Kommun: Huvudstudierapport Nautanen 2002 [English: Gällivare Municipality: Main Study Report Nautanen 2002]; Technical Report. No. 0223; Gällivare Municipality: Gällivare, Sweden, 2002. (In Swedish) [Google Scholar]
- Larborn, L. Inventering av Äldre Gruvavfall i Norrbotten [English: Inventory of Older Mine Waste in Norrbotten]; Report 4; County Administrative Board Norrbotten: Luleå, Sweden, 1993. (In Swedish) [Google Scholar]
- Geological Survey of Sweden (SGU) Map Viewer, Ore and Minerals. Available online: https://www.sgu.se/produkter/kartor/kartvisaren/bergkartvisare/malm-och-mineral/ (accessed on 4 February 2019).
- Johansson, M. Arkeologisk Dokumentation av Gruvområdet RAÄ 748, Nautanens Kopparfält, Fornvårdsobjekt nr 81 [English: Archeological Documentation of the Mining Area RAÄ 748, Nautanen Copper ore Field, Object nr 81]; Norrbottens Museum: Luleå, Sweden, 2004; Dnr. 429-2004; p. 45. (In Swedish) [Google Scholar]
- Hifab, (Envipro). Teknisk Beskrivning Nautanen [English: Technical Description Nautanen]; Technical Report. No. 313 064; Gällivare Municipality: Gällivare, Sweden, 2009. (In Swedish) [Google Scholar]
- Jonasson, C.; Grahn, S. Uppföljande Miljökontroll Efterbehandling av Nautanens Gruvområde [English: Follow-Up Monitoring Remediation of Nautanen Mining Area]; Technical Report; Gällivare Municipality: Gällivare, Sweden, 2015. (In Swedish) [Google Scholar]
- Sami Parliament. Baste. Available online: https://www.sametinget.se/baste (accessed on 28 January 2019).
- Årebäck, H.; Lindblom, M. Samrådsunderlag Angående Ansökan om Bearbetningskoncession Nautanen K nr: 1: Inför Samrådsmöten den 20 Februari 2018 [English: Consultation Material Concerning Application for Exploitation Concession Nautanen K nr: 1: For Consultation February 20th 2018]; Boliden Mineral AB: Stockholm, Sweden, 2018. (In Swedish) [Google Scholar]
- Årebäck, H.; Dean, B. Boliden Summary Report: Resources and Reserves 2018: Nautanen; Technical Report; Boliden AB: Stockholm, Sweden, 2018. [Google Scholar]
- Harris, I.; Jones, P.D.; Osborn, T.J.; Lister, D.H. Updated high-resolution grids of monthly climatic observations – the CRU TS3.10 Dataset. Int. J. Climatol. 2014, 34, 623–642. [Google Scholar] [CrossRef]
- Lynch, E.P.; Jönberger, J.; Bauer, T.E.; Sarlus, Z.; Martinsson, O. Barents Project 2014: Meta-Volcanosedimentary Rocks in the Nautanen Area, Norrbotten: Preliminary Lithological and Deformation Characteristics; Geological Survey of Sweden: Uppsala, Sweden, 2015. (In Swedish) [Google Scholar]
- Geological Survey of Sweden (SGU) Map Viewer, Soil Type 1:25000–1:100000. Available online: https://www.sgu.se/produkter/kartor/kartvisaren/jordkartvisare/ (accessed on 4 February 2019).
- Herbert, R.; Björkvald, L.; Wällstedt, T.; Johansson, K. Bakgrundshalter av Metaller i Svenska Inlands- och Kustvatten [English: Background Concentrations of Metals in Swedish Inland and Coastal Water]; Report 12; Swedish University of Agricultural Sciences: Uppsala, Sweden, 2009. (In Swedish) [Google Scholar]
- Eriksson, L.G. Utläckage av Lakvatten från Gruvområdet - Nautanen [English: Effluents from the Mining Area - Nautanen]; Technical Report. MRAP 94061; County Administrative Board Norrbotten: Luleå, Sweden, 1994. (In Swedish) [Google Scholar]
- Nordstrom, D.K. Hydrogeochemical processes governing the origin, transport and fate of major and trace elements from mine wastes and mineralized rock to surface waters. Appl. Geochem. 2011, 26, 1777–1791. [Google Scholar] [CrossRef]
- Van der Perk, M. Part II: Sources, role, and behaviour of substances in soil and water. In Soil and Water Contamination: From Molecular to Catchment Scale; Taylor & Francis: Leiden, The Netherlands, 2006; ISBN 0-415-40943-8. [Google Scholar]
- Levitan, D.M.; Schreiber, M.E.; Seal, R.R.; Bodnar, R.J.; Aylor, J.G. Developing protocols for geochemical baseline studies: An example from the Coles Hill uranium deposit, Virginia, USA. Appl. Geochem. 2014, 43, 88–100. [Google Scholar] [CrossRef]
- Basu, N.B.; Destouni, G.; Jawitz, J.W.; Thompson, S.E.; Loukinova, N.V.; Darracq, A.; Zanardo, S.; Yaeger, M.; Sivapalan, M.; Rinaldo, A.; et al. Nutrient loads exported from managed catchments reveal emergent biogeochemical stationarity. Geophys. Res. Lett. 2010, 37, L23404. [Google Scholar] [CrossRef]
- Turc, L. The Water Balance of Soils - Relation between Precipitation, Evaporation and Flow; Annales Agronoiques; Institut National de la Recherche Agronomique: Paris, France, 1954. (In French) [Google Scholar]
- Langbein, W.B. Annual Runoff in the United States; US Geol. Surv: Washington, DC, USA, 1949. [Google Scholar]
- Walling, D.E.; Fang, D. Recent trends in the suspended sediment loads of the world’s rivers. Glob. Planet. Chang. 2003, 39, 111–126. [Google Scholar] [CrossRef]
- Swedish Meteorological and Hydrological Institute (SMHI) Evapotranspiration. Available online: https://www.smhi.se/kunskapsbanken/hydrologi/avdunstning-1.30720 (accessed on 10 July 2019).
- Ejhed, H.; Liljeberg, M.; Olshammar, M.; Wallin, M.; Rönnback, P.; Stenström, A. Bruttobelastning på Vatten av Metaller från Punktkällor och Diffusa Källor - Slutrapport [English: Gross Load of Metals in Water from Diffuse and Point Sources]; Report 41; Svenska MiljöEmissionsData: Norrköping, Sweden, 2010; (In Swedish, English Summary). [Google Scholar]
- Swedish Environmental Protection Agency. Uppföljning av Efterbehandlingsprojekt Inom Gruvsektorn: Åtgärder, Kostnader och Resultat [English: Survey of Remediation Projects in the Mining Sector: Measures, Costs and results]; Report 5190; Swedish EPA: Stockholm, Sweden, 2002; ISBN 91-620-5190-3. (In Swedish, English Summary). [Google Scholar]
- Kimball, B.A.; Runkel, R.L.; Walton-Day, K.; Bencala, K.E. Assessment of metal loads in watersheds affected by acid mine drainage by using tracer injection and synoptic sampling: Cement Creek, Colorado, USA. Appl. Geochem. 2002, 17, 1183–1207. [Google Scholar] [CrossRef]
- Palumbo-Roe, B.; Dearden, R. The hyporheic zone composition of a mining-impacted stream: Evidence by multilevel sampling and DGT measurements. Appl. Geochem. 2013, 33, 330–345. [Google Scholar] [CrossRef]
- Berglöv, G.; Asp, M.; Berggreen-Clausen, S.; Björck, E.; Axén Mårtensson, J.; Nylén, L.; Ohlsson, A.; Persson, H.; Sjökvist, E. Framtidsklimat i Norrbottens Län - Enligt RCP-Scenarier [English: Future climate in Norrbotten County - Based on RCP Scenarios]; Swedish Meteorological and Hydrological Institute: Norrköping, Sweden, 2015; Klimatologi Nr 32; p. 91. ISBN 1654-2258. (In Swedish) [Google Scholar]


© 2020 by the authors. Licensee MDPI, Basel, Switzerland. This article is an open access article distributed under the terms and conditions of the Creative Commons Attribution (CC BY) license (http://creativecommons.org/licenses/by/4.0/).
Share and Cite
Fischer, S.; Rosqvist, G.; Chalov, S.R.; Jarsjö, J. Disproportionate Water Quality Impacts from the Century-Old Nautanen Copper Mines, Northern Sweden. Sustainability 2020, 12, 1394. https://doi.org/10.3390/su12041394
Fischer S, Rosqvist G, Chalov SR, Jarsjö J. Disproportionate Water Quality Impacts from the Century-Old Nautanen Copper Mines, Northern Sweden. Sustainability. 2020; 12(4):1394. https://doi.org/10.3390/su12041394
Chicago/Turabian StyleFischer, Sandra, Gunhild Rosqvist, Sergey R. Chalov, and Jerker Jarsjö. 2020. "Disproportionate Water Quality Impacts from the Century-Old Nautanen Copper Mines, Northern Sweden" Sustainability 12, no. 4: 1394. https://doi.org/10.3390/su12041394
APA StyleFischer, S., Rosqvist, G., Chalov, S. R., & Jarsjö, J. (2020). Disproportionate Water Quality Impacts from the Century-Old Nautanen Copper Mines, Northern Sweden. Sustainability, 12(4), 1394. https://doi.org/10.3390/su12041394