Article

Energy Savings on an Industrial Building in Different Climate Zones: Envelope Analysis and PV System Implementation

by
Carlos A. Espino-Reyes
1,
Naghelli Ortega-Avila
2 and
Norma A. Rodriguez-Muñoz
2,*
1
Departamento de Ingenieria Sustentable, Centro de Investigacion en Materiales Avanzados, S.C., Durango 34147, Mexico
2
Catedras CONACYT, Centro de Investigacion en Materiales Avanzados, S.C., Durango 34147, Mexico
*
Author to whom correspondence should be addressed.
Sustainability 2020, 12(4), 1391; https://doi.org/10.3390/su12041391
Submission received: 20 December 2019 / Revised: 11 February 2020 / Accepted: 11 February 2020 / Published: 13 February 2020

Abstract

:
The energy market in Mexico is facing changes due to the incorporation of clean energy certificates (CEL) on the Electric Industry Law (LIE, Ley de la Industria Electrica). One of the aims is to increase the percentage of clean energy use in the national energy matrix. Consequently, the integration of energy efficiency strategies prior to the incorporation of renewables has become essential at different levels. Industrial buildings have significant heat gains and losses through the envelope, mainly due to their vast surface and simple construction systems. This work analyses the typical envelopes of industrial buildings in Mexico and the effect of industrial rooftop photovoltaic (PV) systems over the annual energy consumption. It was found that for temperate climates, the best option would be to insulate the roof. For cities with warm climates, the best approach is to implement a cool roof on a non-insulated layer or to simply insulate the roof. Additionally, the industrial buildings with metallic roofs situated in warmer climates would benefit the most from the implementation of rooftop PV systems. After all, the results point out that the decrease in the required CELs would not influence the savings.

1. Introduction

Practically all of the activities required for the development of society requires the use of energy. The industrial sector has been identified as a segment that requires energy intensively, yet it has also been pointed out to be a sector with great potential for energy savings. Worldwide, it is estimated that the industrial sector has a consumption representing 28.8% of the global energy consumption; in Mexico, the figures are similar (30.7%) [1]. In 2013, the Mexican energy market introduced new guidelines as a result of the promulgation of Mexican energy reform. This reform brought the aperture of the energy market, and a new model for the purchase and sale of electricity brought more responsibilities for high consumption users. The main goal of energy reform is to increase the participation of clean energies in the energy matrix. The stated goals of clean energy share were of 25% (2018), 35% (2024), 40% (2035), and 50% (2050) [2].
The Electric Industry Law (LIE, Ley de la Industria Electrica), published in 2014, states on Article 123 that the energy suppliers and the qualified users are required to acquire or generate clean energy certificates (CEL, Certificados de Energias Limpias) to cover a percentage of their electric annual energy consumption [3]. The enounced actions will allow the accelerated expansion of clean energy projects [4], contributing to the reduction of greenhouse gas emissions (GHG), thus helping mitigate the effects of climate change [5]. The CELs are given by the Regulatory Energy Commission (CRE, Comision Reguladora de Energia) and are equivalent to 1 MWh generated by clean energy sources like solar, wind, and efficient co-generation, among others. According to the LIE, qualified users have to purchase or generate CELs enough to cover for the annual established percentage. For example, during 2018, an equivalent of 5% of CELs was established; meaning that a qualified user with a 100,000 MWh consumption must obtain 5000 CELs [6]. For the subsequent years, a CEL quota was established as follows, 5.8% (2019) [7], 7.4% (2020), 10.9% (2021), and 13.9% (2022) [8].
One of the proposed solutions to achieve the goals of sustainable development [3], is to improve the quality of life taking care of the environmental, economic, and social implications. Maintaining low energy requirements to reduce operating costs of the industrial sector has always been a concern; nevertheless, with the clean energy regulations, this aspect has attained more relevance than ever. As the annual energy requirements are reduced, the number of CELs required will also be less, which would also reduce the costs and pressure to achieve the LIE requirements.
Industrial buildings designate from 50% to 67% of its electricity consumption for air conditioning (heating and cooling) purposes [9,10]. Industrial buildings have big extensions, large exposed surfaces, and are traditionally built with simple constructive systems, making them prone to great heat gains and losses [11]. In spite of the importance of these type of buildings, currently, there are no Mexican regulations that observe the energy consumption of industrial buildings. The existing regulations (NOM-020-ENER-2011 [12] and NOM-008-ENER-2001 [13]) refer to residential and commercial buildings and explicitly exclude industrial buildings.
In the literature, numerous analyses and projects have been mainly carried out for residential, educational, and office buildings. In the consulted literature, it was found that many envelope studies are related directly to energy savings in tertiary and residential buildings [14]; therefore, profound analysis for industrial buildings is still needed. A large number of studies are carried out for hot and warm climates [15]. Valuable studies like the case studies in Austria for refurbishment [16], in Slovakia for a quantification of the energy demand [17], and a nearly zero-energy buildings study for the steel sector in Germany [18]; point out the following: most of the reviewed literature consists on case studies and generalizations are still required [14], and that for cold climates, an increase of insulation thickness is not cost-effective [18]. In regards to the incorporation of the photovoltaic (PV) systems, Kapsalis and Karamanis [19] state that a detailed heat transfer is required for seasonal studies. Therefore, in this study, a methodology where both the annual thermal performance of the building’s envelope and PV system is applied. As a consequence, an analysis of the detailed heat transfer between the building roof and the PV systems, its impact on the energy costs, and the return of the investment period was carried out. At first, an analysis of the profitability of the CELs, when applied to qualified users from industrial buildings in different climatic zones, was also performed. Finally, generalized findings for warm climates and temperate climates were enunciated to facilitate the decision-making process.

1.1. General Measures for Limiting Heat Gains and Losses on Buildings

Abuseif and Gou [15], performed a review discussing diverse matters around energy-saving methods of ten roofing systems. The studied roofs comprise from traditional systems like concrete and insulated roofs, to novel systems like roof garden, double-skin roofs, and roofs with PV panels. The authors found that the most common system is insulation, mainly due to that insulation is mandatory in many countries. Additionally, the effects of the application of reflective coatings (cool roof) were summarized. For the cool roof, it was found that it can reduce the heat gains by 33%; nevertheless, this causes the heat gain blockage needed for the winter months, and this method only helps to reduce the heat losses when the cool roof is implemented together with insulation. From the economic point of view, it was also found that on average for all analyzed climates, the cool roof has a shorter payback period (two months), followed from the insulated roof (three years) and the PV (four years). In the review, it is noted that most of the studies were performed for hot and warm climates and that the few studies made on the Mediterranean and temperate climates focus on the warmest days. Another comprehensive study is the one carried out in France by Labat and Attonaty [14], they found that the energy requirements from heating, ventilation, and air conditioning (HVAC), and lighting systems are of a similar order of magnitude. The analysis was made for six buildings of different uses: warehouses (2), two manufacture buildings (2), food industry (1), and a cattle facility (1). The utilized methodology was found to be generally adequate to be applied to the studied industrial building stock, which comprises non-residential buildings from Germany, Hungary, Poland, Spain, and Sweden. Also, the building’s heat loads were completely related to the involved industrial process; whereas the lighting energy requirements were independent of the building use.
One of the studies found for temperate climates (Cfb, Oceanic), was the one carried out by Gourlis and Kovacic [16]. The authors studied the feasibility of the implementation of passive measures on an industrial building in Austria. The focus of this study was to propose passive measures to prevent summer overheating and to reduce the heating requirements, and to prevent the potential installation of cooling systems. For the study, measurements of the current indoor conditions were carried out; then, dynamic simulations were executed for the current and theoretical future scenarios. The most cost-effective measure to prevent the overheating on this climate, was the application of a cool roof coating and to implement automated exterior shading devices. Nevertheless, for colder climates, the cool roof coating should be prudently analyzed, because it can limit the required winter heat gains.
Chowdhury et al. [20], monitored the conditions of a garment production building in Dhaka. The buildings were constructed with local bricks, which were classified as 1st, 2nd, 3rd class, and machine made; also, the building had no shading devices on the windows. The results pointed out that the factories built with 3rd class bricks performed more competently, mainly due to the thermal properties of the material. Katunsky et al. [17], analyzed through the ESP-r and BuilOpt-VIE software the measurements of the energy demand (heating) of industrial buildings in Slovakia where a humid continental type of climate prevails (Dfb). The authors encountered a vast diversity of types of industrial buildings, making difficult the characterization of a standard building. However, one of the key findings of the study was the development of a methodology that assists in the calculation of the energy requirements and savings in buildings.
Mengjie et al. [21] carried out 50 years’ revision about building energy-saving measures; two main research trends were found: (1) insulation and phase change materials and (2) services equipment. The second includes heating, ventilation, air conditioning systems, indoor air parameter control and controlling, and automation systems. These have become very important since building automation systems allow the detection, prediction, and improvement of the building’s operation patterns in static, temporal, or anomalous operation and also to find occupant behavior tendencies [22]. Silvestre-Blanes and Pérez-Lloréns [23] analyzed the occupancy pattern in industrial buildings and proposed some energy saving strategies.
Additionally, some works have focused on the development of new coatings to minimize infrared heat gain, such as Becherini et al. [24]. They had developed two new infrared reflective coatings that do not alter the durability of historic buildings. Their work showed its applicability to reduce the cooling demand in warm climates, and to reduce energy gains during summer in hot climates; although in this case, it could represent a negative effect in winter due to the thermal losses involved. Another issue that had been explored is the impact of natural ventilation as an energy-saving strategy. Roberti et al. [25] developed a multi-objective optimization in order to offer to combine passive strategies to improve energy savings, comfort, and conservation of historic buildings. Their main strategies were: exterior walls or roof insulation, window or pane substitution, airtightness improvements, and natural ventilation. The last one was the only passive measure capable of reducing the internal loads during summer.

1.2. Effect of PV Systems on the Building Performance

Due to industrial buildings generally consisting of large construction and envelope areas built with simple wall and roofing systems, they demand high amounts of energy. Photovoltaic systems on industrial buildings are a common scene in industrial parks in several regions worldwide.
Wang et al. [26], made a comparison of three PV roof arrangements against a conventional roof in China. The authors describe the impacts on the heating and cooling loads; nevertheless, they conclude that there are many factors to consider, such as the local climate, optical properties of the roof, initial roof insulation, among others. Dominguez et al. [11] analyzed numerically and experimentally the indirect insulation effects of a PV roof in San Diego, California. The authors compared the results of flush and tilted PV arrays against an unoccupied commercial building. Through the result comparison, other key effects that make the correct assessment of the simulation and measured data difficult were identified. The mentioned factors were, for example, the possible occupant behavior, the impact of the adjacent urban environment, and the micrometeorological conditions.
Parida and Chatterjee [27] presented a case study concentrating on the cost-effectiveness of a hybrid PV arrangement on an institutional building. They identified a scheme where the cost of energy from the PV system is roughly the same as the cost of energy of the utility supply, emphasizing the environmental benefits from the proposed PV arrangement. In the review by Abuseif and Gou [15], they summarized the effects of the positive effects of the rooftop PV panels, where two key aspects were mentioned. One was the reduction of the cooling loads with a reduction of 60% on the heat flux for uninsulated buildings; whereas another important effect was a 7% reduction on the energy consumption for tropical climates. Kapsalis and Karamanis [19], examined a PV array on an educational building in Greece. The study incorporated the effects of the external microclimate, generation of electricity, and the building canopy on the analysis of a conventional roof and a 9.6 kW polycrystalline PV system on the building’s roof. The results pointed out that time-dependent and complex conditions occur between the air and the surfaces, and that the PV affects the thermal capacity of the building. The conclusions demonstrated that a detailed heat transfer should be taken into account on seasonal studies, especially when the aim is to design a building with a net-zero energy requirement.
Wang et al. [28] studied the energy-saving impacts of the implementation of PV systems on a building in China. In the study, it was found that the building’s overall energy consumption was impacted; mainly due to the shading effect provided by the PV systems. Besides the shading benefits, another benefit of the implementation of PV systems on building roofs is electricity generation. The heat gains were attenuated, reducing the cooling loads. Meanwhile, the heating loads slightly increased, another identified alteration is that the thermal capacity of the roof changes. Peng and Yang [29], examined through EnergyPlus simulations, the effects of PV panels on the roof temperature of a house in different cities in China. The study was carried out in Nanjin, Harbin, and Haikou, which have a humid subtropical climate (Cfa), humid continental (Dwa), and mild temperate (Cwa), respectively. Several roofing systems were examined with and without PV systems. The results showed that the heat transfer through conduction, convection, and radiation could only be adequately simulated in the chosen software when the air gaps between the PV panels and the roof are set as an air-conditioned zone. Without underestimating the software’s capacity on the estimation of all of the terms involved at the overall heat balance model, the effect of the PVs on the roof temperature cannot be properly calculated.
In this study, different envelope configurations and their impact on the annual energy consumption of an industrial building in six cities in Mexico are analyzed. Three façades and five different insulation proposals are examined for representative Mexican climates. The studied climates range from semi-arid climates (BSh & BSk), desert (BWh & BWk), and temperate (Cwa & Cwb), according to the Köppen–Geiger classification. The results were obtained through dynamic simulations for a typical meteorological year for each of the climates of interest. The results were obtained hourly for a year to analyze the effects on the industrial building envelope. The first objective of this work was to find the best combination of envelope materials to reduce the operative energy requirements related to the use of air conditioning systems (heating and cooling). Secondly, the aim was to study the heat transfer impact and energy output of the implementation of a PV system on the roof of the building. Finally, different scenarios were evaluated, so if the company is ranked as a qualified user and needs clean energy certificates, the decrease in the energy consumption due to the implementation of different strategies is such that a lower amount of CELs would be required.

2. Methods

The simulation model of the industrial building was made considering different constructive systems and different thermal insulation proposals and comparing the performance of the metallic roof against the implementation of a reflective waterproofing coat on the roof (cool roof). TRNSYS 17 (Thermal Energy System Specialists, Madison, WI, USA) was used to evaluate the thermal behavior of the building over a year on an hourly basis. A 10,000 m2 typical industrial building was designed according to information collected by a real-estate agency [30,31,32,33,34,35]. The building’s geometry can be observed in Figure 1. The building’s height is 11.25 m, has dimensions of 60 × 167 m with a flat roof. The building was modeled in SketchUp 8 (Trimble Inc., Sunnyvale, CA, USA), through the TRNSYS 17 plug-in. The building has 600 m2 of acrylic skylights on the roof and 826 m2 of glazing on the walls to comply with the lighting requirements for work facilities established by the NOM-025-STPS-2008 Mexican regulation [36].

2.1. Climate

The weather information from the cities of interest (wind speed, mean temperature, humidity, and solar radiation) was requested from the Mexican National Meteorological Service (SMN). The weather generator from TRNSYS was utilized (Type 54), where the averaged weather information from the SMN was processed so the information could be transferred to an adequate format. The studied cities were Monterrey (MTY), Tijuana (TIJ), Torreon (TOR), Ciudad Juarez (CDJ), Guadalajara (GDL), and Guanajuato (GTO); which were chosen due to their industrial development, economic relevance, and climate representability. Within these cities, six climatic zones are represented: hot semi-arid (BSh), cold semi-arid (BSk), hot desert (BWh), cold desert (BWk), mild temperate (Cwa), and oceanic (Cwb), respectively, according to the Köppen–Geiger classification.

2.2. Façade Systems

In this study, three façades were analyzed: tilt-up (prefabricated concrete façade), concrete block, and a steel façade. For all of the modeled buildings, a metallic roof of a 0.75 mm thickness was considered. In TRNSYS, the façade systems are modeled as several layers of materials, so the thermal properties of each material are required. Details of the implemented façades are listed in Table 1.

2.3. Insulation and Cool Roof

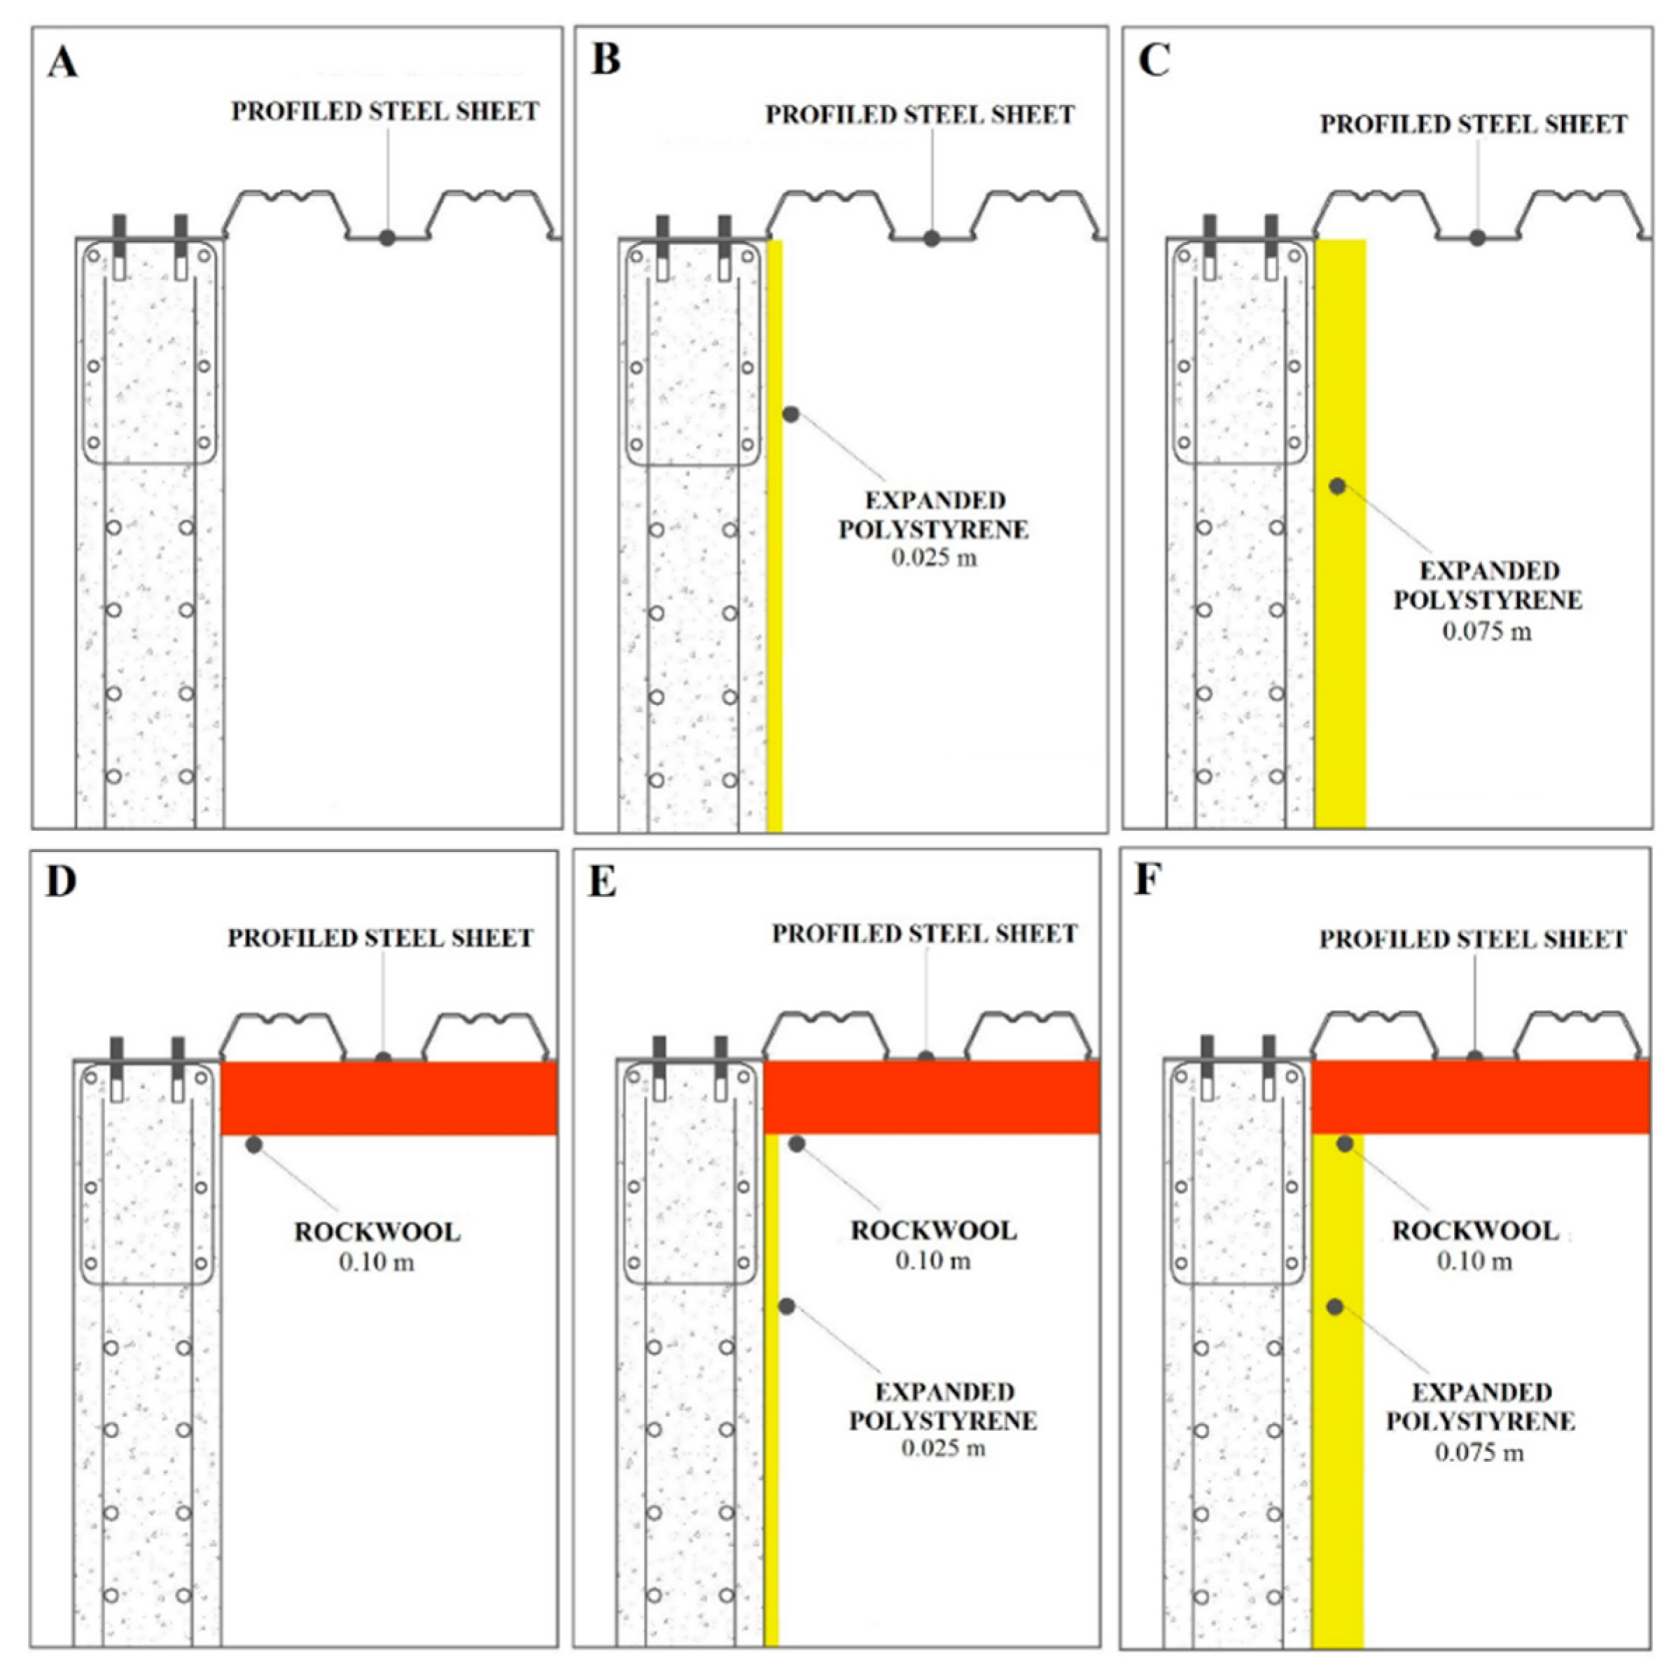
In this study, an industrial building with a flat metallic roof was considered as the base scenario. The building was analyzed considering a bare metallic roof, and with the implementation of a coat of a white reflective waterproofing; representing the “cool roof” scenario. To the base building (scenario A), five insulation combinations were implemented. The configuration of the insulation proposals can be observed in Figure 2, and the thermal properties of the utilized materials are in Table 2. The utilized insulation materials were expanded polystyrene and rock wool, which were applied on the walls and roof, respectively. The insulation thickness was selected according to the commercial availability of the materials; this was of 1.0 and 3.0 inches for the walls and 4.0 inches for the roof (2.5, 7.5, and 10 cm).
The proposals were simulated for each of the considered cities. The objective of this part of the study was to determine the energy requirements, so the building is maintained within a temperature range. In practice, the temperature range varies depending on the productive process carried out. In this study, the authors opted to analyze the energy usage of industrial buildings broadly; therefore, the thermal comfort range was implemented. American Society of Heating, Refrigerating and Air-Conditioning Engineers (ASHRAE’s) methodology [42] was used to calculate the temperature range. The method takes into account the operative temperature and humidity, considering an airspeed of less than or equal to 0.2 m/s. The calculated temperature ranges were utilized to set the temperatures at the thermostat of the heating and cooling systems, and are presented in Table 3.

2.4. PV System Modeling

To implement the PV panels into the building simulation, a regionally available panel was selected. In Table 4, the characteristics of the PV panel are presented. The PV array consists of the PV panels placed over the roof separated by 0.2 m from the building. A horizontal separation, so the panels would not overshadow each other in all of the studied cities, was also calculated. As a consequence, the separation between panels is 1.98 m, while the separation between the panels next to the skylights is 5.48 m. In total, each building had 35 PV panels consisting of 58 modules each. The array covers 30.85% of the roof of the building, which helps to comply with the required natural lighting regulations and provides enough space for other required rooftop installations. The total installed power on each building was of 507.5 kW.
The PV panel was implemented into the TRNSYS simulation with the Type 562. At this type, the PV panel represents a simple glazed PV panel where its performance is based on a constant global array efficiency. The efficiency is a function of the cell temperature and the incident radiation, which is provided by an external file. The energy output is calculated, taking into account the module temperature coefficients and the module’s efficiency.

2.5. Heat Transfer

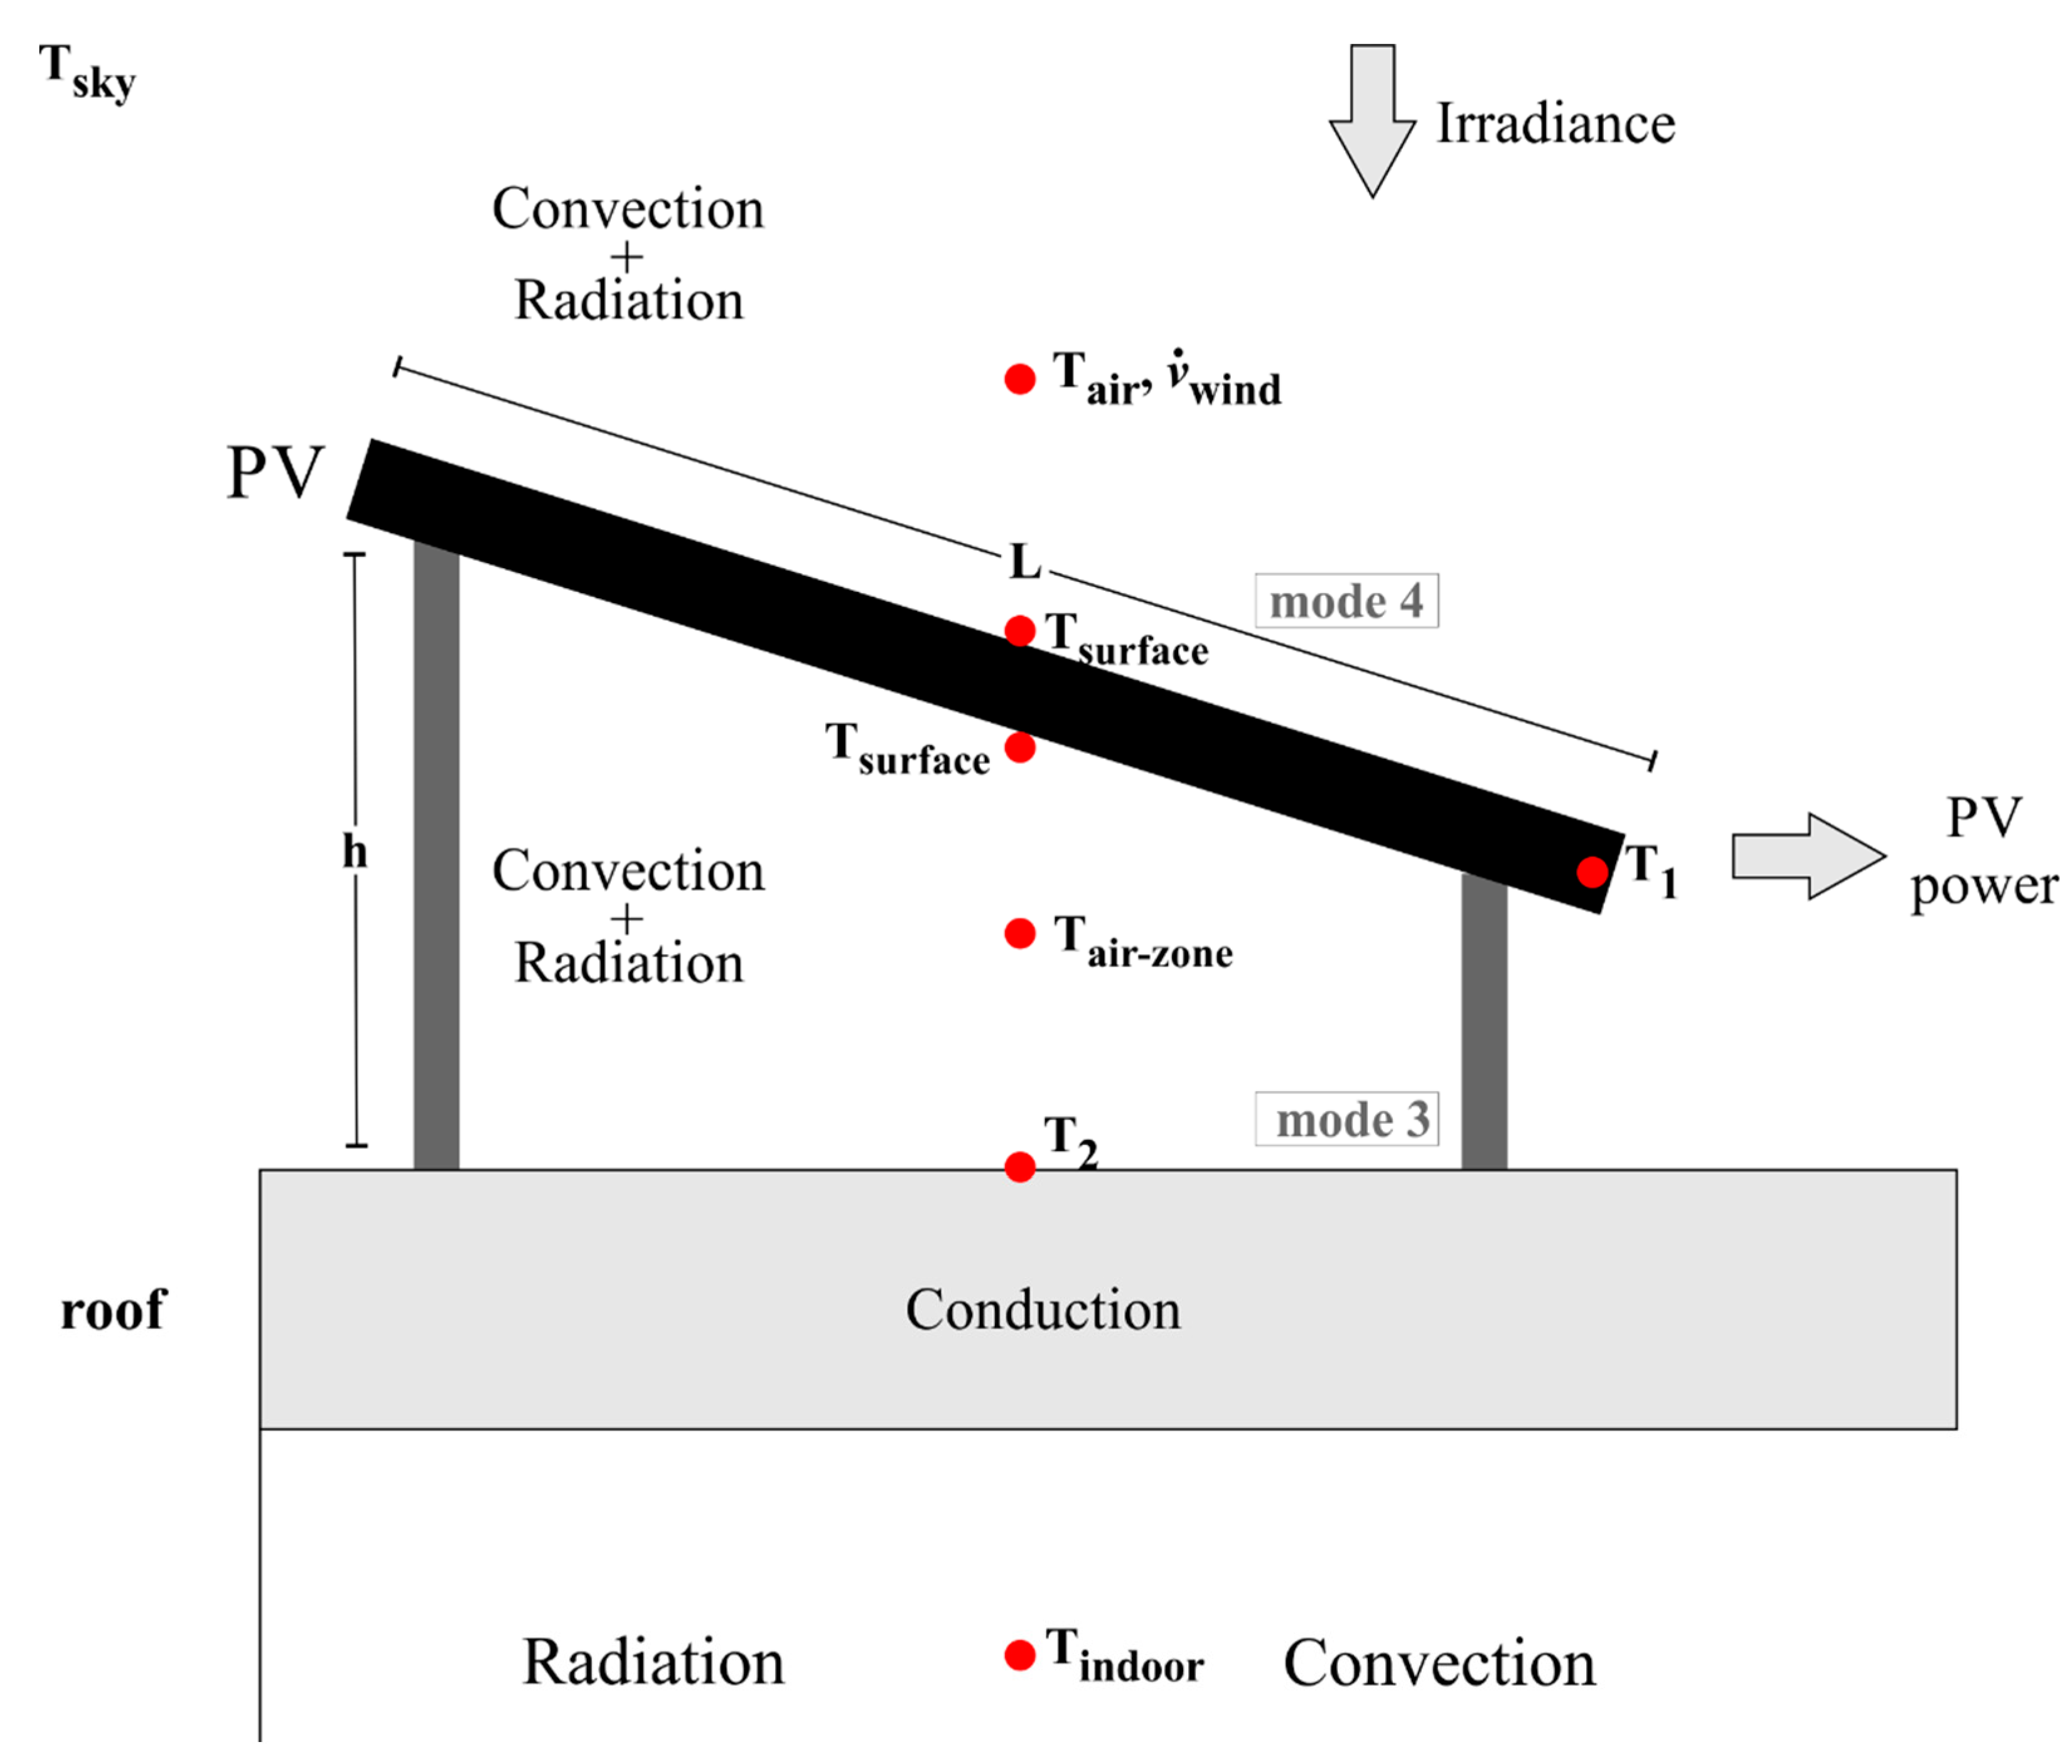
Heat balances were performed for the industrial building prior to the heat transfer calculation between the building and the photovoltaic panel. In Figure 3, the PV heat transfer between the buildings is presented. Type 562 resolves the PV energy balance. It has a solar energy input and a PV power output, where convective and radiative energy losses from its top and bottom are considered. The convective losses depend on the top ambient temperature (Tair), and the air temperature under the module (Tair-zone), while the radiative losses depend on the sky temperature (Tsky), and the air temperature under the module (Tair-zone) [48]. All energy losses, convective and radiative, as well as the overall PV efficiency, depend on the surface temperature of the PV module (Tsurface). This is the only variable unknown and is calculated with an iterative process. Within the type, the module’s efficiency from Table 4 (at reference conditions: 1000 W/m2, 25 °C) is corrected to the proper operating conditions.
It should be noted that Type 562 allows performing a simplified heat transfer analysis, by establishing the convective heat transfer coefficients as constant mean values, evaluated at constant surface temperature. In order to strengthen the study, a detailed heat transfer analysis was considered, where both the upper and bottom of the module’s convective coefficients were calculated using the Type 1232, which calculates the convective coefficients for flat plate surfaces. For the calculation, the ambient temperature (Tair) and the wind speed ( ν ˙ w i n d ) are taken from the meteorological weather data. For this work, modes 3 and 4 were selected in the Type 1232, further details are commented in the following lines.
A laminar-turbulent flow was assumed at the bottom of the module (mode 3). Meanwhile, for the module’s upper side, a fully turbulent flow was assumed (mode 4). For both modes, the convection coefficient (hconv) is calculated as a combination of natural and forced convection with Equation (1) as follows:
h c o n v = h n a t u r a l 3 + h f o r c e d 3 3
The natural and forced convective coefficient equations from Incropera and Dewitt [44] are used at Type 1232, where the Nusselt number is calculated with correlations for pure natural and forced convection, respectively.
First, natural convection analysis is presented, since the model is the same for both operation modes. Natural convection coefficient is calculated with
h n a t u r a l = N u · k a i r L
The Rayleigh number (Ra) needs to be estimated to decide which equation for the Nusselt number is appropriate. The Rayleigh number is preliminary estimated with the following equation
Ra = g β a i r ( T a i r T s u r f a c e ) α a i r μ a i r ρ a i r L 3
where βair is the inverse of the average air temperature. If Ra > 1 × 10⁹, the Nusselt number is calculated with the following equation
N u = [ 0.825 + 0.387 R a 1 / 6 ( 1 + ( 0.492 P r ) 9 / 16 ) 8 / 27 ] 2
But when Ra < 1 × 10⁹, the Rayleigh number is recalculated, adjusting the gravitational constant (g) for the slope of the surface with Equation (5), and the Nusselt number is calculated with Equation (6).
R a = g cos ( 90 s l o p e ) β a i r ( T a i r T s u r f ) α a i r μ a i r ρ a i r L 3
N u = 0.825 + 0.387 R a 1 / 4 ( 1 + ( 0.492 P r ) 9 / 16 ) 4 / 9
In the case of the forced convection analysis, forced convection coefficient is calculated with
h f o r c e d = N u · k a i r L c h a r
where the characteristic length (Lchar) and the Reynolds number (Re) are calculated by
L c h a r = ( 4 L · W ) / 2 ( L + W )
R e = ( 3600 L c h a r ν ˙ w i n d ρ a i r ) / μ a i r
In the equation, the air density is ρair and the air viscosity is μair. The Nusselt number is calculated with different correlations for each side of the PV panel. For the bottom side (mode 3), the Nusselt number is calculated with the following equations
R e < 5.0 × 10 4 N u = 0.664 R e 1 / 2 P r 1 / 3
R e > 5.0 × 10 4 N u = ( 0.37 R e 0.8 871 ) P r 1 / 3
On the other hand, for the upper side (mode 4), the Nusselt number is given by
N u = 0.37 R e 0.8 P r 1 / 3
Once the PV energy balance is solved, the radiative heat transfer between the roof of the building and the PV system is estimated. For this calculation, the PV array was considered as a simplified single PV module, keeping the initial and final height of the PV panels. With this simplification, it was estimated that the resultant surface had a 0.57°. Therefore, the heat transfer was simplified as radiative heat exchange between two parallel plates. The radiative heat transfer between the PV and the building was defined with Equation (13).
Q ˙ 12 = A s [ σ ( T 1 4 T 2 4 ) 1 ε 1 + 1 ε 2 1 ]
where A s is the PV area, σ is the Stefan–Boltzmann constant, T1 and T2 are the PV and roof temperatures; and ε 1 , ε 2 , are the PV and roof’s emissivity, respectively.

2.6. Economic Parameters

When the annual energy requirement of the industrial building is calculated, this information is utilized as a start point for the economic analysis. The annual thermal loads can be converted to the required fuels (natural gas and electricity), employing the efficiency of the systems. For this study, the efficiency of 0.92 [50], and coefficient of performance (COP) of 2.1 [51], are used for the selected heating (gas) and cooling systems (electricity), respectively. The natural gas prices were taken from the reference prices published by the Mexican Energy Regulatory Commission (CRE). In Table 5, the mean prices for 2018 can be observed for each city [52]. Information published by the Mexican Petroleum Company (PEMEX) was utilized to find the annual increase in natural gas prices. The natural gas annual price increase from 2015 to 2019, was calculated to be 11.47% [53,54]. The electricity prices were obtained from the Mexican Electricity Commission (CFE), for a period of 2015 to 2019. The electricity tariffs regularly used on industrial buildings correspond to the Hourly Medium Tension High Demand, (GDMTH, Gran Demanda en Media Tension Horaria) tariff [55], the values are shown in Table 5. An inflation of 4.126% was also considered [56].
After the annual cost from the consumption of both fuels in the buildings is calculated, the annual increment of the prices is also added. The present worth (PW) is estimated with Equation (14) to determine the total cost of the air conditioning systems operation and evaluate its financial feasibility [56].
P W = P C [ ( 1 + i ) n 1 i ( 1 + i ) n ] + { G 1 i [ ( 1 + i ) n 1 i ( 1 + i ) n n ( 1 + i ) n ] }
where P C , is the annual cost of energy at the end of the first year of operation, n is the number of considered years, i corresponds to the inflation value, and G is the gradient, which is obtained by multiplying the annual energy cost increase by the energy cost (PC). The PW is calculated for the base scenario and each of the envelope proposals for a defined period (1 year). Also, the cost of operating the heating and cooling systems is obtained by calculating and adding the present worth of the cost of the required heating and cooling fuels. Next, the economic savings of each of the proposals are evaluated by subtracting the proposal’s present worth from the base scenario. This value indicates the difference between the cost of the base scenario and the cost of applying the proposed envelope during the same period. The return of investment will be the time when the savings are equivalent to the investment cost of each scenario. When this period is met, the savings will become a profit for the building owner.
The net present value (NPV) is calculated by adding the correspondent envelope investment and the operative cost of each proposal, which is presented in Equation (15). For the cases where the photovoltaics are incorporated into the building, the investment cost includes the PV system expenditure. Additionally, the electricity selling price was assumed as the price of the bought electricity. In accordance with the electricity price of the GDMTH tariff for each city. In Table 6, a summary of the utilized economic parameters is presented.
N P V = P W + i n v e s t m e n t

2.7. Proposal Costs

The cost of applying each of the proposed scenarios is presented in Table 8; these costs are presented by the unit area and the total per building. They take into account the material price and installation costs. The proposals were named with letters A to F (detailed scheme in Figure 2), and with numbers 1 and 2, metallic roof and a cool roof (metal roof with reflective waterproofing), respectively. The cost of each of the proposals is shown in Table 8. Proposal A with metallic roof represents the base scenario; hence no added costs are considered for this case.

3. Results

The results obtained from this study are separated into energy and economical. The energy results include information about the heating and cooling annual thermal loads required to maintain the temperature setpoints for each city. These results are the input for the economic calculations, where the aimed result is to determine the return of investment for each of the proposed scenarios. The second section contemplates the incorporation of the PV systems into the industrial building and the calculation of the return of investment and the potential CELs savings. Also, it is important to point out the limitations of this study which are as follows:
  • The internal heat loads were not considered as the present study was performed as a general analysis to estimate the energy requirements of a typical industrial building in various climates independently from the potential heat gains, which are highly dependent on the process carried out at the industrial building.
  • The grid connection was not explored at this stage. The reason for this simplification was that each process or industry type has a particular demand profile. Also, the study was conceived, so the detailed consideration of the transmission, distribution, and electricity marginal prices for each city would not complicate the initial study on the envelope and effect of the PV system.
  • The choice of materials was limited to commonly used materials from the country/region.
  • The albedo effect was not considered.
  • Ventilation strategies were not considered.

3.1. Results without PV System

3.1.1. Energy Demand of Envelope Proposals

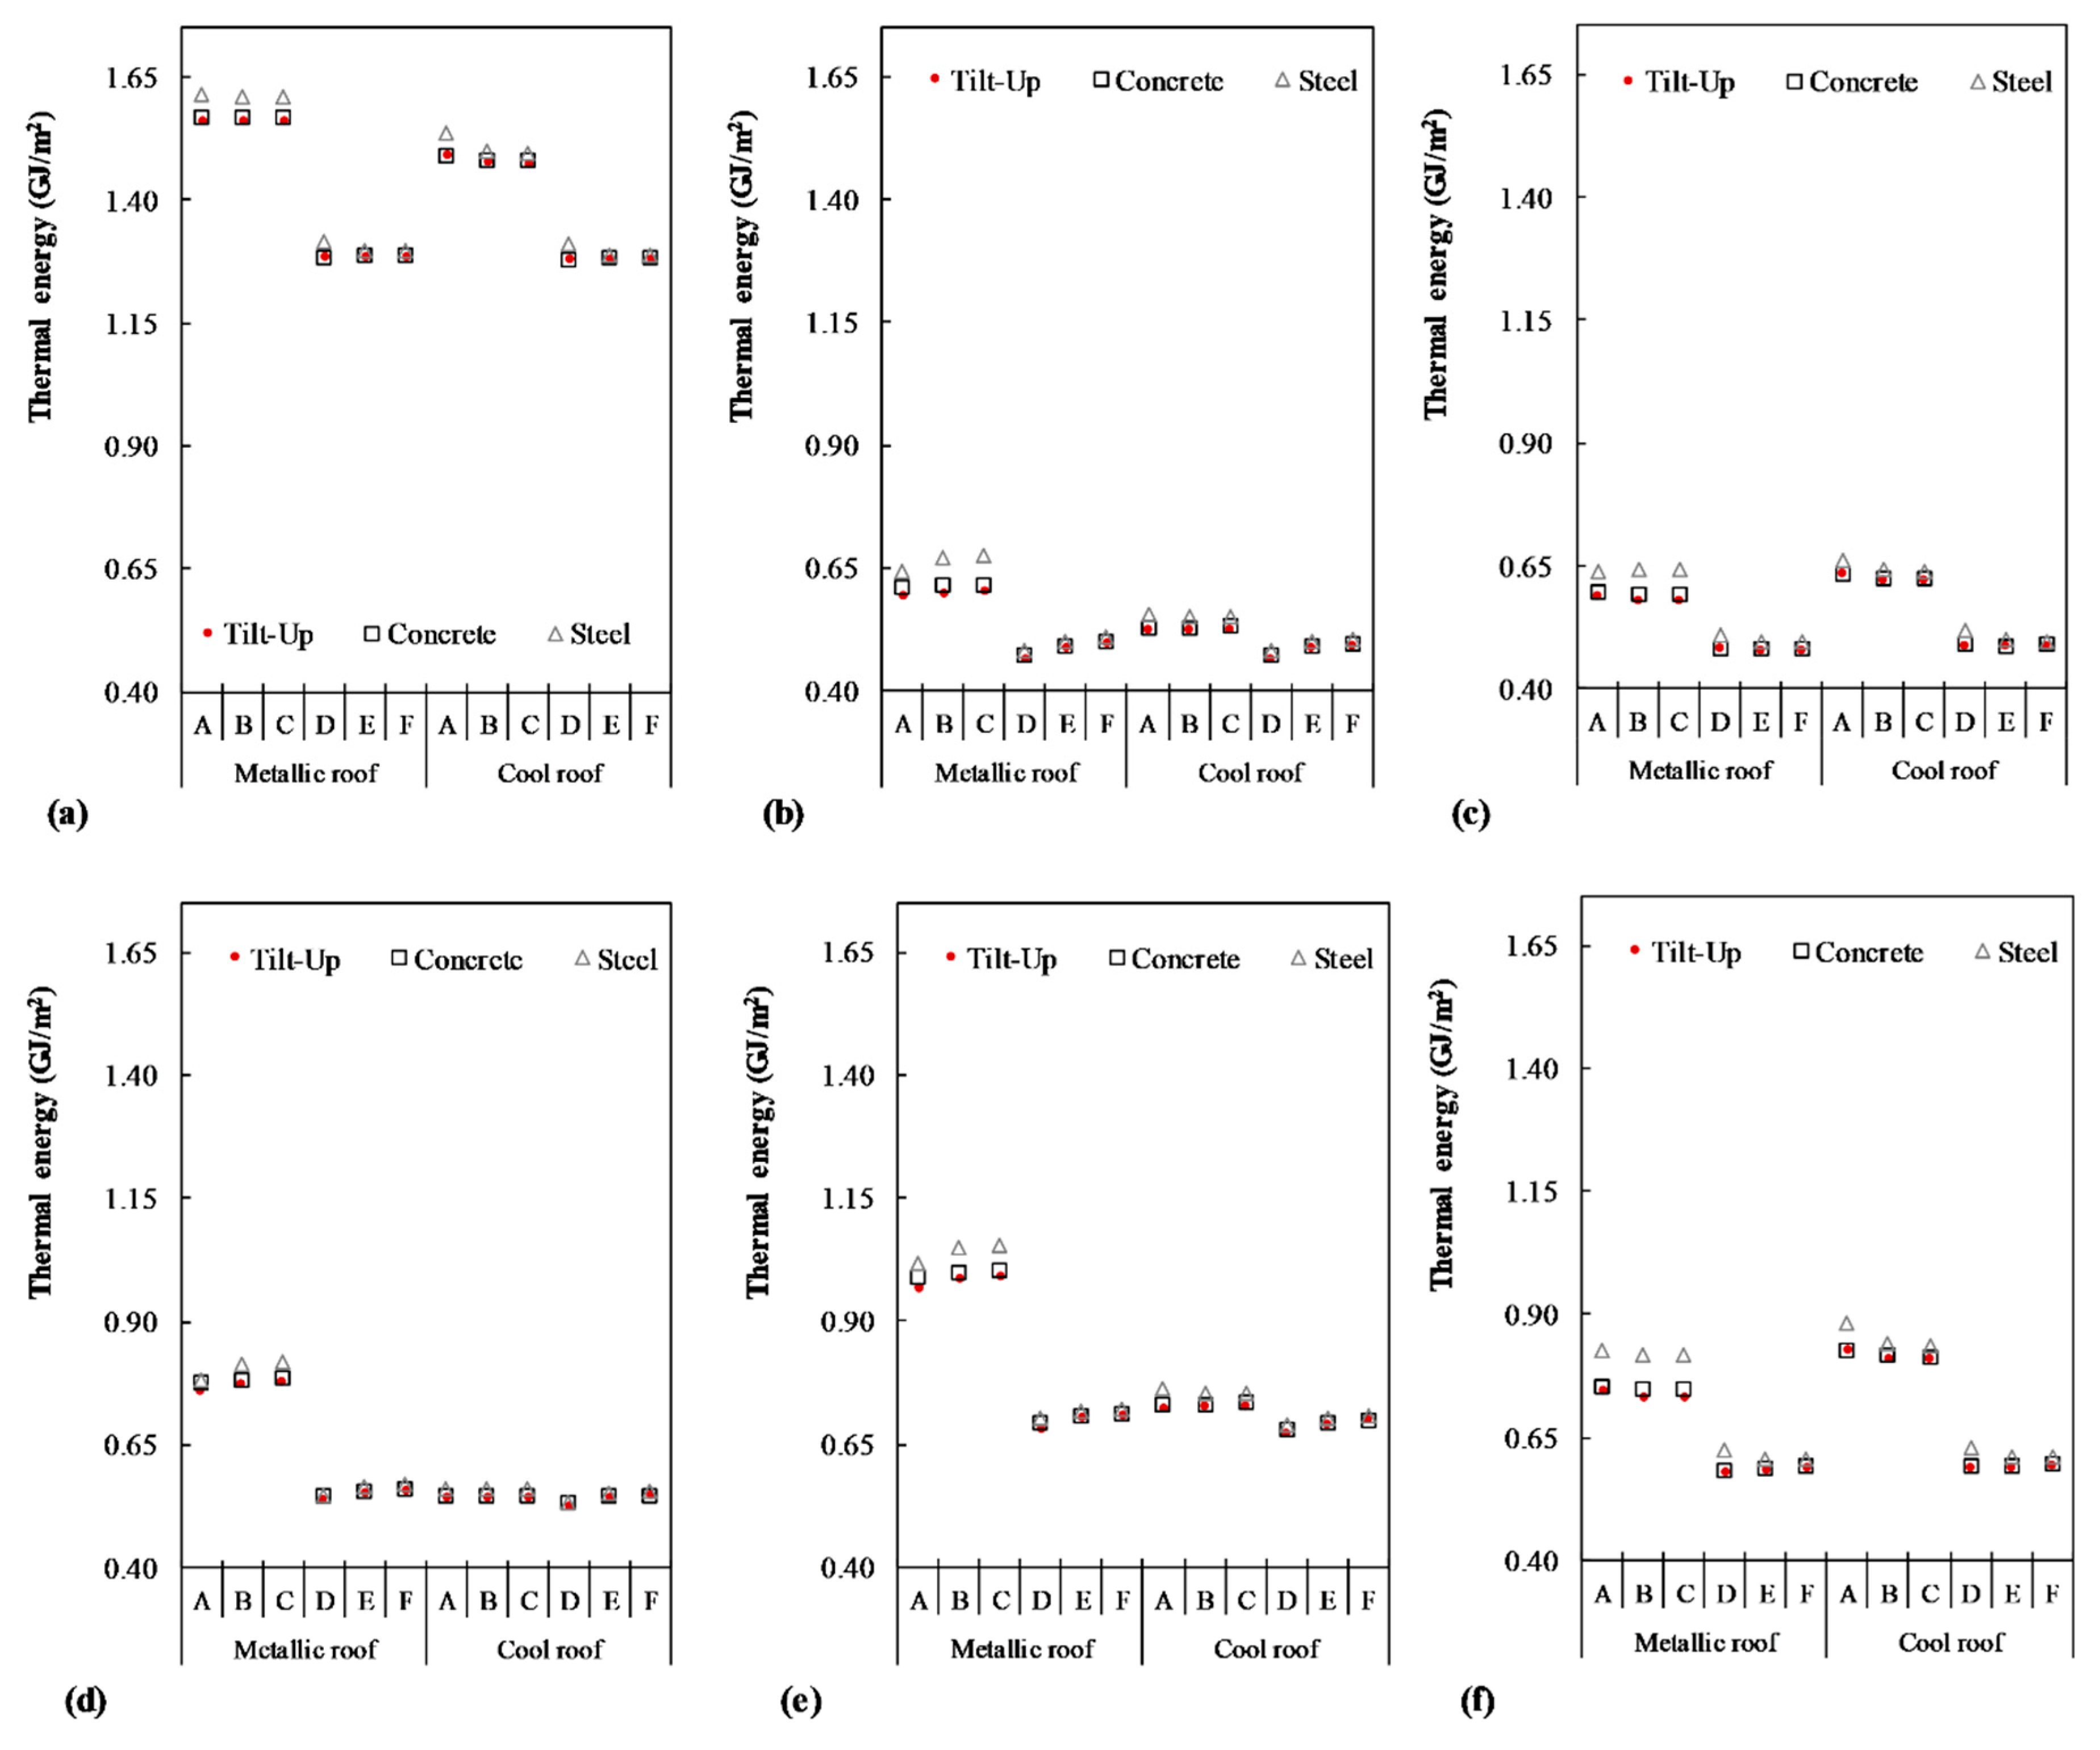
In Figure 4, the annual energy requirements from the heating and cooling systems per square meter are presented. In each figure, the results are divided into two sections: metallic roof (1) and cool roof (2). The previously described scenarios are named A to F; and, the studied cities are listed alphabetically.
In Ciudad Juarez (Figure 4a), when the annual thermal load from both heating and cooling systems is quantified, it can be observed that some scenarios that consider insulation would require less energy. The thermal load is reduced up to 18.5% with the application of mineral wool on the metallic roof (A vs. D), whereas the thermal load of scenarios A–C, decreases up to 15% when the cool roof is implemented. In Ciudad Juarez, the scenarios which would represent less energy consumption are D, E, and F. Within these scenarios (D–F), it can also be observed that there is no greater difference between the metallic roof and cool roof, where the calculated difference is less than 1%. In Guadalajara (Figure 4b), the less energy-intensive scenarios are D–1 and D–2, which represent the mineral wool roof. However, generally, the scenarios which have the cool roof present better results. In Guanajuato (Figure 4c), where a temperate climate exists, the heating loads are predominant. For this city, scenarios D to F, also represent the best alternative. The D–1, E–1, and F–1 have the lowest energy requirements; nevertheless, they are of only 1% less than the cool roof scenarios. Here the difference in performance, which would represent less energy consumption, is also the implementation of the mineral wool on the roof.
In Monterrey (Figure 4d), a predominance of cooling requirements is in place, representing from 48% to 75% of the annual energy needs. In order to reduce the annual energy requirements, the D scenarios are indicated as the best. In this city, scenarios B–1 and C–1 would require more energy than the base scenario due to an increase in the cooling requirements; the rest of the proposed scenarios will represent energy savings from 27% to 31%. Lastly, in Torreon (Figure 4e), scenarios D to F, with and without reflective waterproofing, would represent less energy requirements with respect to the base scenario; and scenarios B and C would require more energy to operate. The same situation occurs as in Monterrey, the heating requirements are slightly reduced, while the cooling needs increase. In Tijuana (Figure 4f), where also a temperate climate endures, the cool roof has a negative impact on the energy savings, as a result of the increase of the heating requirements. The increase in energy consumption when the metallic roof (1) and cool roof (2) results are compared ranges from 0.5 % up to 11.2%. In this city, the best scenarios are both D–F with a metallic roof, and D–F with cool roof, as they all have the same annual energy requirements.
Overall, the best approach for cities with warm climates is related to the implementation of either a cool roof on a non-insulated roof or apply insulation on the metallic roof. And, for the cities with temperate climates, the best option would be to insulate the roof.

3.1.2. Economic Viability of the Envelope Proposals

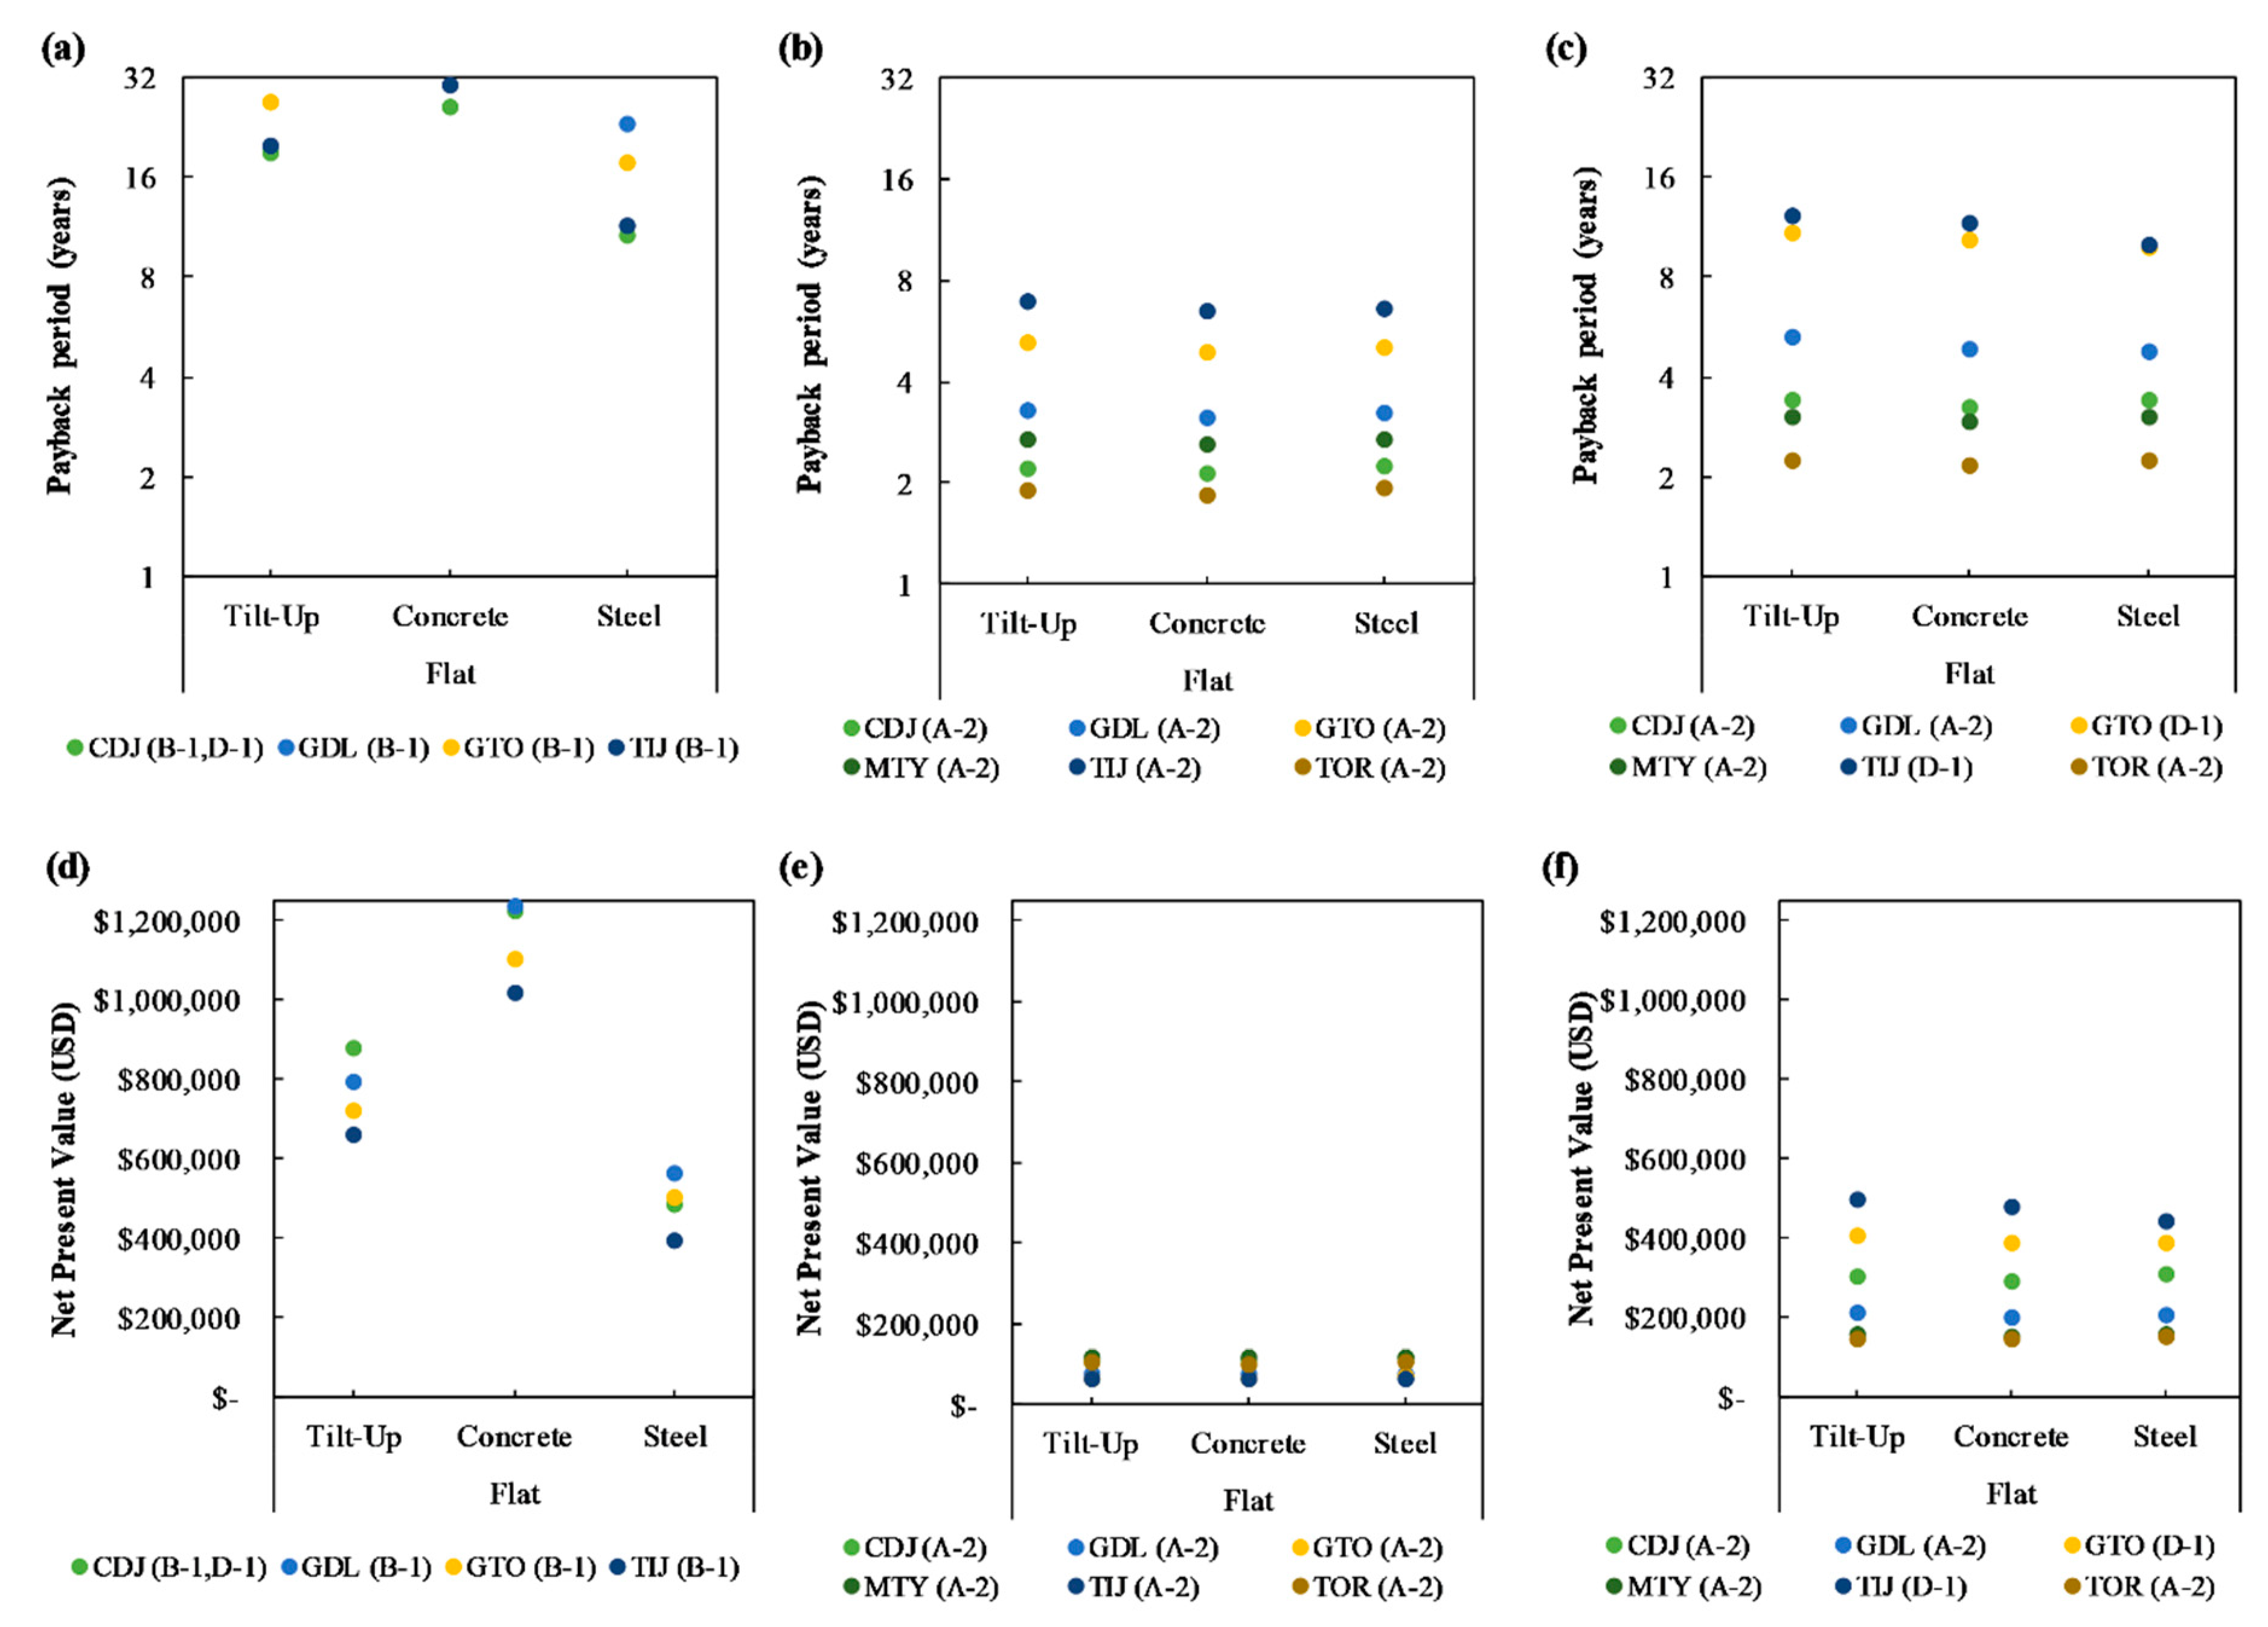
In Figure 5, the economic viabilities of the proposed scenarios are presented. The figure aims to help the decision-making process by pointing out only the best scenarios, nevertheless, other economically viable scenarios exist. Figure 5 shows both the results for the payback period, and the net present value (NPV). Letters (a), (b), and (c) refer to the payback calculation for heating, cooling, and heating + cooling; whereas letters (d), (e), and (f) correspond to the NPV of the heating, cooling, and heating + cooling, respectively.
In Figure 5a, the calculation of the return of investment estimated rates is close to 70 years; for this reason, the results of returns of up to 32 years are shown. When only heating systems are necessary (Figure 5a), the proposals that reduce the payback period are the ones that contain thin insulation on the walls (B–1). It is also observed that the reduction percentage of the application of the different proposals reflect a minor payback period decrease, being significantly higher than the potential energy savings from cooling. For all the cities, except for Ciudad Juarez, the best proposal for all three façades (tilt-up, concrete, steel) is B–1. On the other hand, for Ciudad Juarez, the best scenarios are B–1 for the tilt-up and steel façade, and D–1, for the concrete façade.
It can be observed that the cooling demand rule the return of investment of the industrial buildings. In Figure 5b, it is observed that for all cases, the most viable proposal is A–2, where the returns of investment occur from the second to the fourth year, and for the cities with temperate climates up to the eighth year. When the building requires the use of heating and cooling systems (Figure 5c), in four of the six studied cities, the proposal that presented a shorter return of investment times is A–2 (Torreon: 2.18 years). For the cities of Guanajuato and Tijuana, cities with a temperate climate, the best proposal is D–1, where the shorter return of investment was for Guanajuato (9.81 years).
In order to give an integral view, in Figure 5 d–f the NPV is presented for the scenarios that had the lowest payback period. Globally, it can be observed that the cost is higher for the use of heating systems, while the expenditure of using cooling systems would be significantly low. This is directly linked with the correspondent payback periods of the heating and cooling. In Figure 5d, it can be observed that the steel façade has a lower cost when compared with the tilt-up and concrete façades. If the use of heating systems is a must, they should be installed at a steel industrial building with a cool roof. On the other hand, the implementation of any façade type results in a profitable investment when cooling systems are required. From Figure 5e,f, it can also be inferred that if both heating and cooling systems need to be used, the cities where it would be more lucrative to install an industry, from an air conditioning (heating and cooling) point of view, are Torreon, Monterrey, Ciudad Juarez, Guadalajara, Guanajuato, and lastly Tijuana.

3.2. Results with PV System

3.2.1. Energy Demand for Building with PV System

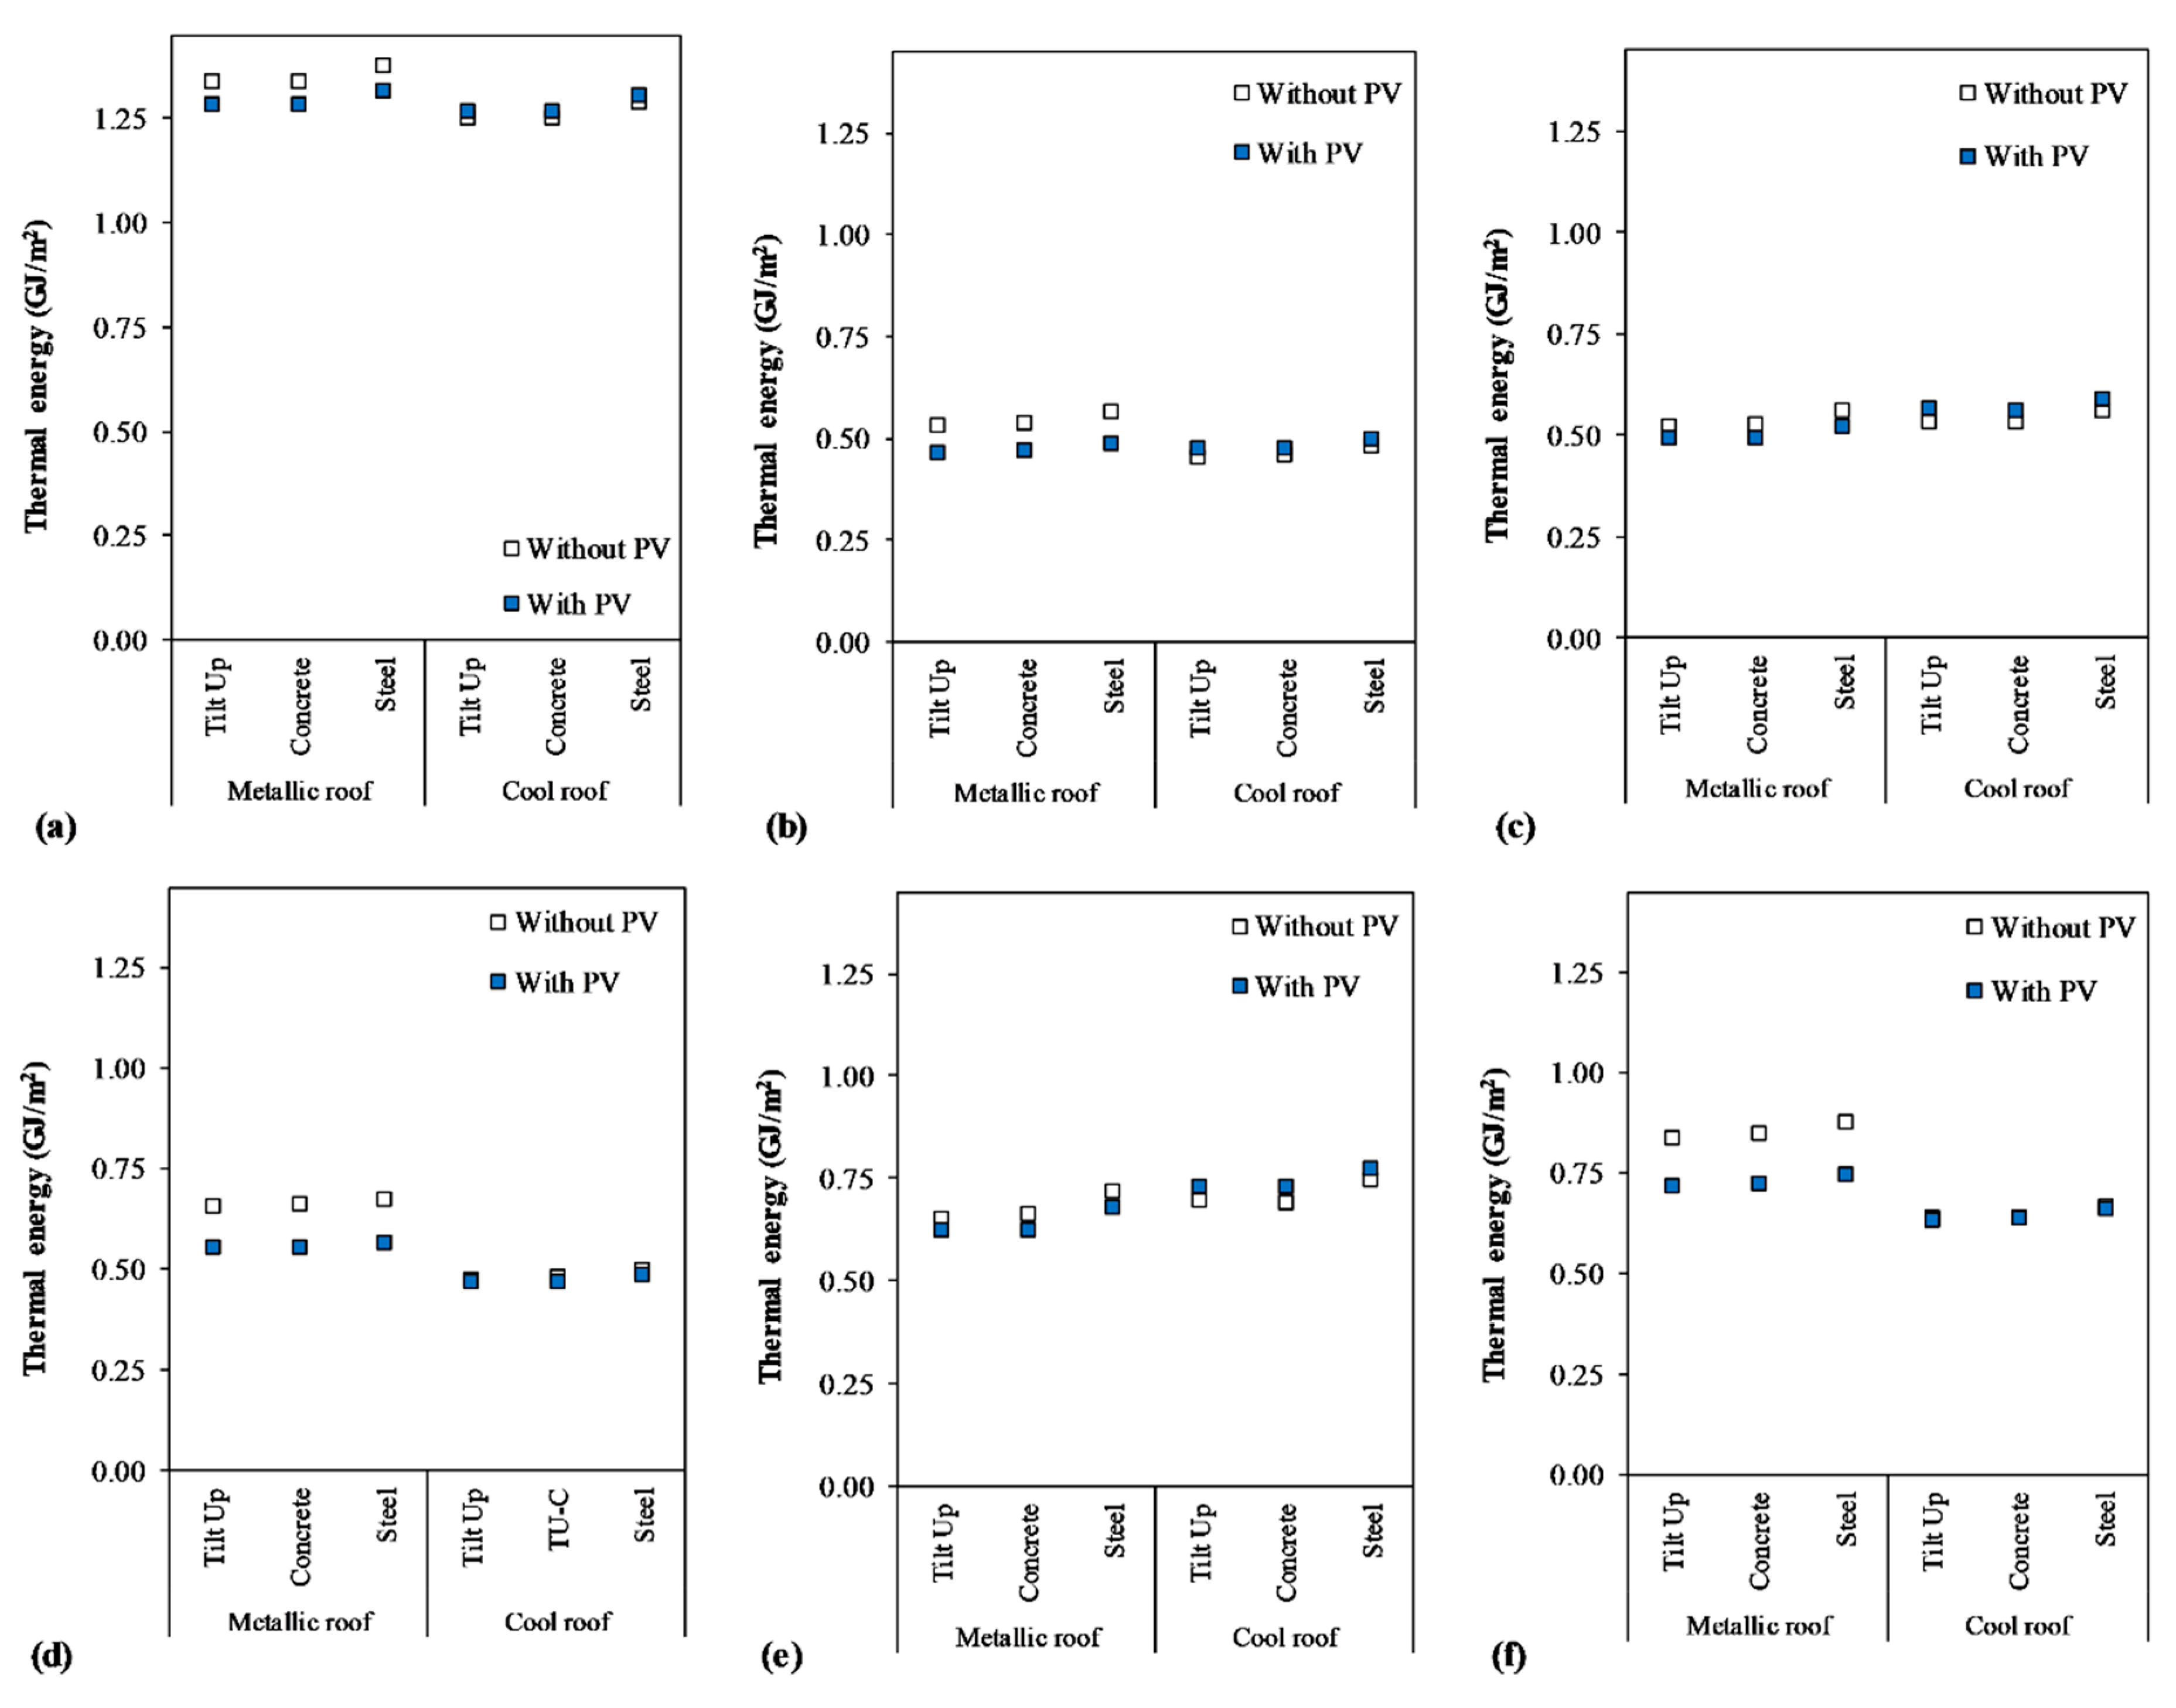
In Figure 6, the energy requirements per square meter from the industrial buildings with and without the implementation of the PV systems are presented. Here the annual thermal effect over the building’s envelope can be seen.
For Ciudad Juarez (Figure 6a), where the highest energy requirements would be needed, it can be observed that the behavior between the three façades is consistent. Higher energy consumption for the buildings with the metallic roof, and lower consumption with the cool roof. When the building has a metallic roof, the implementation of the PV lowers the annual energy requirements (−4.2%), but when the building has a cool roof, the energy requirements slightly increase (+1.3%). In Guadalajara (Figure 6b), a similar performance is observed, but with lower energy requirements. The differences between the building with and without PV systems are a reduction of 13.0% (metallic roof), and an increase of 3.7% (cool roof). In Guanajuato (Figure 6c), as in the previous two cases, the inclusion of the PV system on the metallic roof would result in lower energy requirements, whereas on the cool roof, the energy requirements for the building with PV panels would be higher. In Monterrey (Figure 6d), larger differences in the thermal behavior between the building with metallic roof vs. cool roof are observed. Thus they represent reductions of up to 15.6% for the metallic roof and 2.2% on the cool roof. In Tijuana (Figure 6e), only minor differences due to the implementation of the PV occur. And finally, in Torreon (Figure 6f), for the building with cool roof negligible reductions would arise (0.6%), whereas, for the metallic roof, a reduction of 14.7% would take place.
The climates that would benefit the most from the implementation of PV systems on buildings with metallic roofs would be the warmer climates, which correspond to Ciudad Juarez, Guadalajara, Monterrey, and Torreon. On the buildings which already have an envelope improvement with the cool roof incorporation, the benefits are attenuated or negligible.
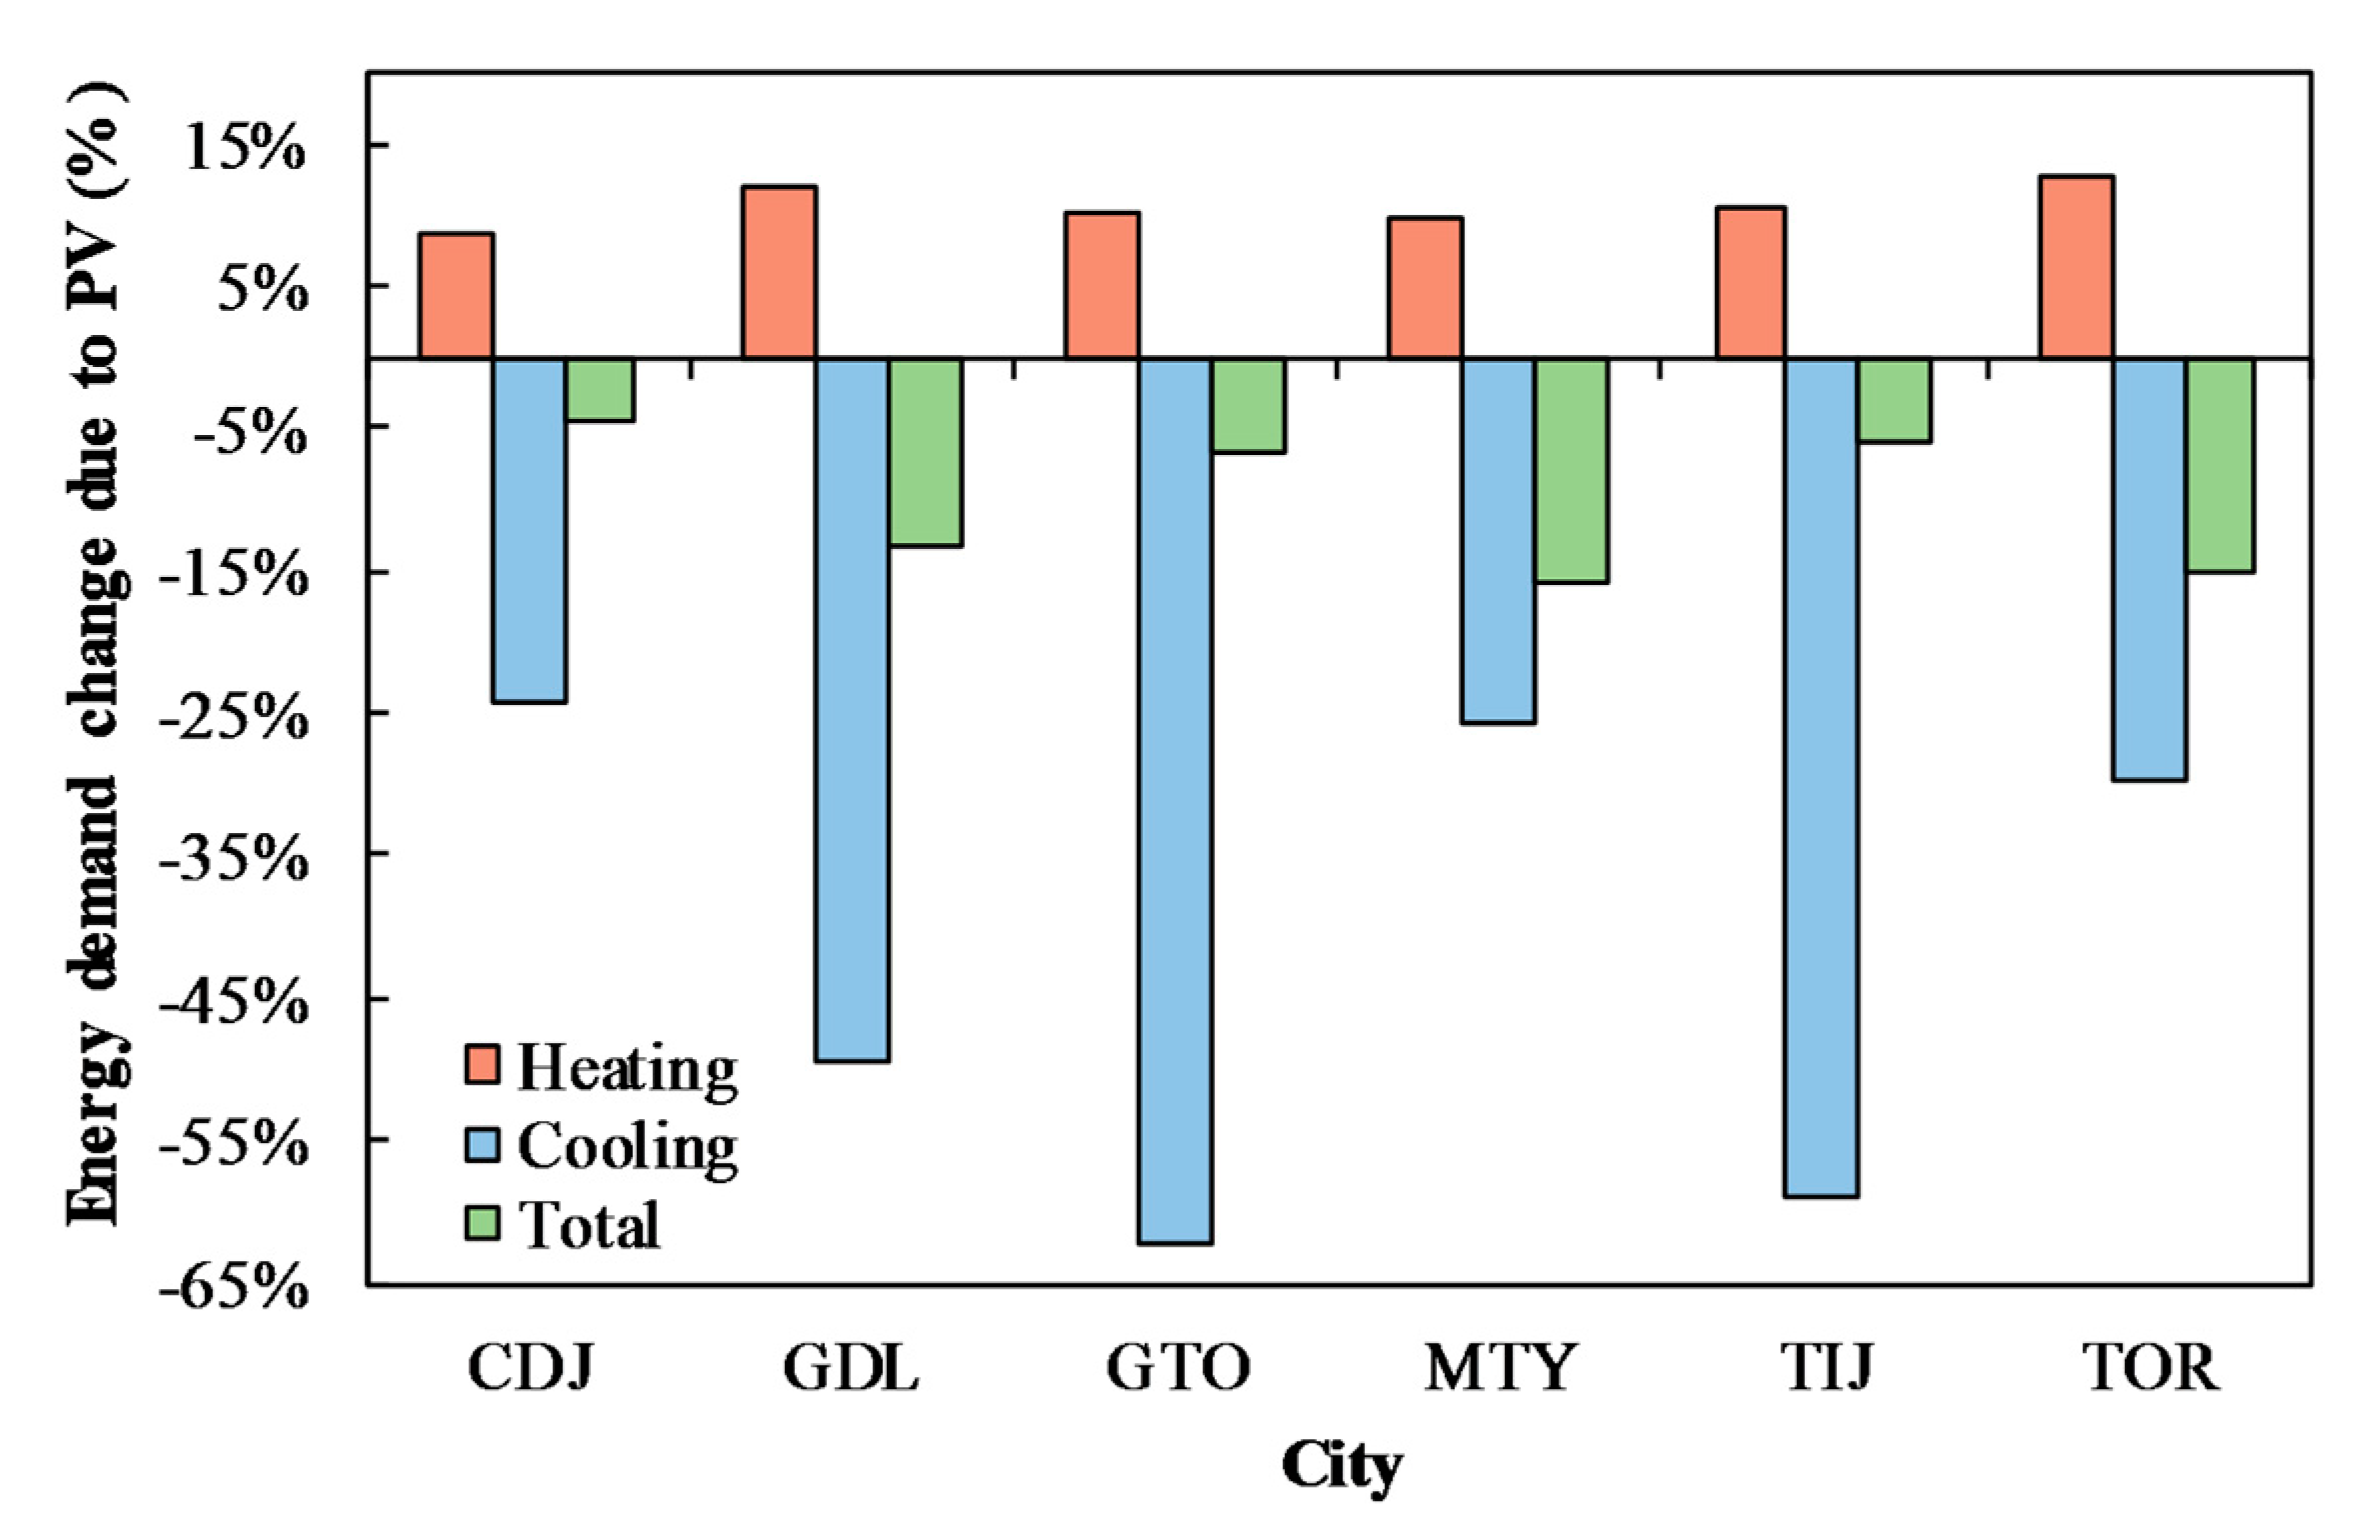
In Figure 7, the impacts due to the implementation of the PV system broken down on the heating, cooling, and total calculated energy requirements are presented. The presented percentages represent the mean from the metallic roof scenarios. In general, what can be noticed is that, on average, the total annual energy requirements will be reduced. As expected, the cooling requirements will dramatically be reduced even in the cities where the cooling is not the main concern. Likewise, when the heating requirements were consistently augmented, the increases round from 8.8% to 12.8%.
In Table 9, the percentages of the heating and cooling demand costs that could be supplied by the PV system on the roof of the building are presented. The presented scenarios correspond to the base building (scenario A), which is the building with a metallic roof. Also, the difference between the calculation considering a simplified and detailed heat transfer (HT) is presented as a way to show the risk of under or overestimation of the heating and cooling energy costs of a building if the appropriate heat transfer is not calculated. From the results, it can be observed that the heating and cooling costs for the industrial building can be successfully supplied by the installation of PV systems on 30.85% of the roof surface. The cities with minor percentages of energy supplied by the PV systems are Ciudad Juarez (90%) and Guanajuato (91%), while the rest of the cities would even have an energy surplus. On the other hand, when the simplified heat transfer model is implemented, the energy costs of the industrial building are overestimated by up to 23.9%.

3.2.2. Economic Viability of Building with PV System

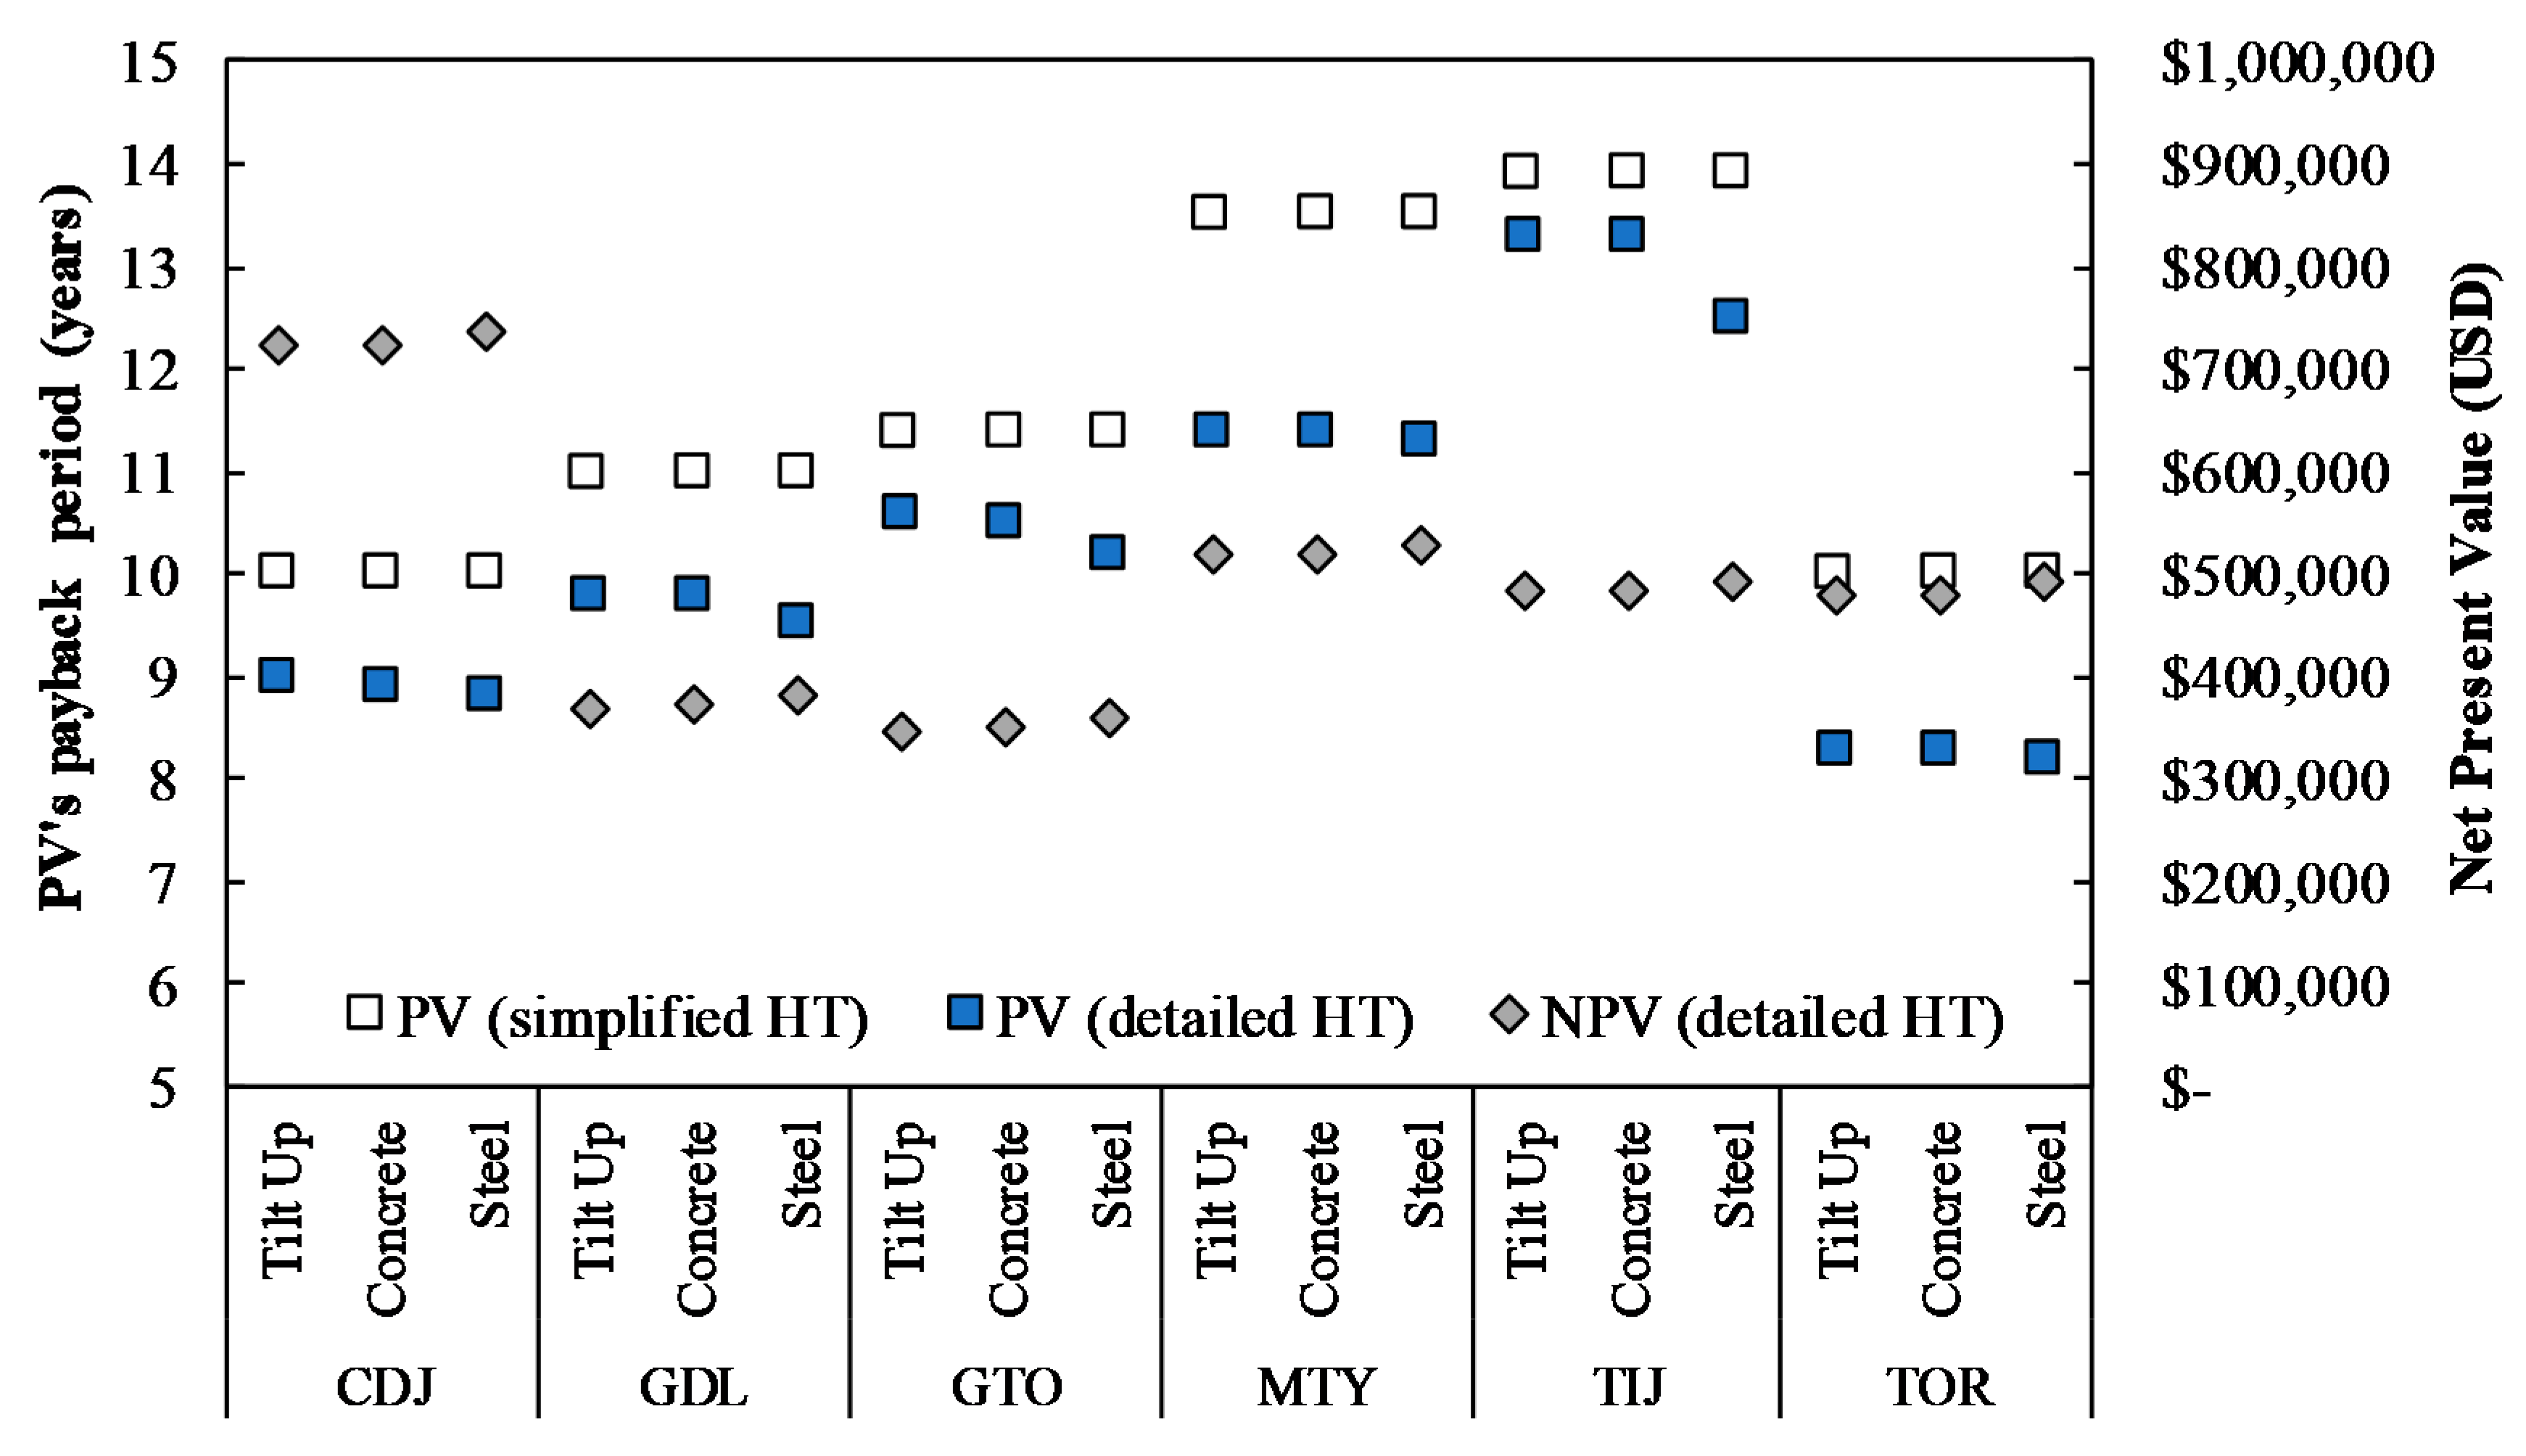
In Figure 8, the payback period and the correspondent NPV of the industrial building, considering the simplified HT and detailed HT for each of the studied cities, is presented. For all cases, the simplification of the heat transfer between the building and the PV system results in an overestimation of the payback period. The average reduction in the return of investment period is around 0.9 years and 1.0 years for Guanajuato and Tijuana, respectively, which represent cities in temperate climates. And a decrease from 1.1 years for Ciudad Juarez up to 2.2 years for Monterrey.
There is a risk related to the overestimation on the payback period, because the payback time is less attractive; thus, it can affect the planning of renewable investments. Consequently, it is encouraged that the heat transfer is calculated as detailed as possible with the available tools and simulation programs. According to the analysis, it can also be observed that when the simplified HT calculation mode is implemented, the differences in the payback period among the different façades are minimal. While, when the detailed HT is calculated, the payback periods from each of the façades can be differentiated.

3.3. Clean Energy Certificates (CEL)

According to the newly set requirements of the Electric Industry Law (LIE), qualified users are required to acquire CELs to comply with a pre-established percentage of the annual energy consumption. This strategy is completely in line with the compromises made at the Paris Agreement in 2015, where the Mexican government declared that the country would lower GHG by 22% [2]. Also, that by 2021, Mexico would produce 30% of its energy from clean sources (35% by 2024); the scenario was considered feasible due to the projected new renewable projects [2]. The newly implemented energy auctions aim to promote the construction of clean and renewable energy power plants, while the legal framework to reduce the GHG emissions is set.
In this work, two scenarios were projected; they were the fulfillment of the 2018 and 2022 CELs’ requirements. These scenarios represent 5.0% and 13.9% of CELs, which are related to the total annual energy utilization. In Figure 9, the savings related to the CELs’ requirements for each of the envelope proposals are presented. In Figure 9a, the projected savings calculated with the 2016 CEL mean price (17.4 $/CEL) [57], whereas, in Figure 9b, the savings are calculated, taking into account the mean CEL price from 2017 (8.6 $/CEL) [57]. The cities where it is more profitable to incorporate the CELs by the qualified consumer are Torreon, Ciudad Juarez, and Monterrey. When the savings are calculated with the 2017 mean price, the savings become less attractive to the user. From the estimations, it can be observed that the CELs savings would decrease as the price continuously lowers due to the ongoing energy auctions.
It is important to remark that the CELs monetary savings were calculated using the envelope proposals, which would require less energy to operate; thus, the savings become a complementary bonus to the user. Nevertheless, in this pricing scenario, greater savings result from a correct implementation of the façade and roofing systems.

4. Conclusions

In this study, the objective was to reduce the annual energy requirements of a 10,000 m2 industrial building and to calculate the return of investment period for the proposed scenarios. The analysis was carried out for six different Mexican cities, considered as representative of the main industrial cities of the country. Even though it is recommended that the thermal behavior of the buildings is analyzed for each city and climate, it was possible to generate several general observations.
It was found that insulating the walls had a small effect on the annual total energy requirements when compared to the implementation of insulation on the roof. The preferred approach for warm cities is related to the implementation of a cool roof on a non-insulated roof or insulate of the metallic roof, while for temperate cities, the best option is roof insulation.
When the building only contemplates the installation of heating systems, the best choice to reduce the payback period is the application of one inch of insulation on the walls. It was also observed that the cooling demand determines the return of investment of any measure applied to the studied industrial buildings. If the building only intends to use cooling systems, the return of investment ranges from 1.8 to 6.8 years, and it occurs when the building is uninsulated and with a cool roof for all cases. When the building considers the use of both heating and cooling systems, the most effective strategy is also the implementation of the cool roof on an uninsulated building (A-2), for warm climates; but for temperate climates, the best is the use of the rockwool on the roof (D-1).
The warmer climates benefit the most from the implementation of PV systems, which have a metallic roof (Ciudad Juarez, Guadalajara, Monterrey, and Torreon), whereas buildings that already have a cool roof, the benefits are almost negligible. In general, the total annual energy requirements are reduced. The cooling requirements will dramatically be reduced even in the cities where the cooling is not the main concern. Though the heating requirements increase (8.8% to 12.8%), total annual energy savings occur. When the simplified heat transfer is used for the calculations between the building roof and the PV system, the energy costs of the industrial building are overestimated by up to 23.9%, while the payback period is overestimated for all the studied cases. There is an inherent risk related to the overestimation on the payback period, making the project less attractive, affecting the planning of renewable investments. Consequently, it is highly encouraged that the heat transfer is calculated as detailed as possible using the available tools and simulation programs. This information can be relevant within the construction decision-making process.
The cities where it is more profitable to incorporate the CELs by the qualified consumer are Torreon, Ciudad Juarez, and Monterrey. It can also be concluded that the CEL savings become a complemental bonus to the user; they do not dictate the decisions involved in the energy savings. Still, within this pricing scenario, greater savings and consequently environmental benefits result from a correct implementation of the façade and roofing systems.
The methodology implemented at this project can be translated into other applications, for example, educational, public, office buildings, and vertical or even at detached housing. On this occasion, the analysis at an industrial building is presented because of the foreseen benefits and possibilities due to the electricity costs of the industrial tariff. Also, nowadays, there is great potential at public and administrative buildings since, in Mexico several years ago, federal and local governments have launched aggressive campaigns encouraging the decrease of energy use and implementation of renewables on such constructions [58,59]. On the other hand, the improvement of the envelope of residential buildings has been intensely studied, and attractive energy savings can be reached. Nevertheless, in Mexico, for example, the use of PV systems in dwellings has economic feasibility only at one of the seven residential electricity tariffs; thus, making the analysis unattractive. Also, the industrial building envelope has an inherent vulnerability due to the use of simple materials and plausible large heat gains and losses associated with the envelope’s exposed area.
Within the future foreseen work, it is envisioned that the incorporation of internal heat gains, of several industrial processes, is required as this would give new perspectives on the heating and cooling energy use. Another issue that needs to be explored is the grid connection. Various scenarios of connection have to be analyzed, together with the possible use of batteries for peak shaving.

Author Contributions

Data curation, C.A.E.-R.; formal analysis, N.A.R.-M. and N.O.-A.; investigation, C.A.E.-R.; methodology, C.A.E.-R. and N.A.R.-M., and N.O.-A.; writing–original draft, C.A.E.-R. and N.A.R.-M.; Writing–review & editing, N.O.-A. and N.A.R.-M. All authors have read and agreed to the published version of the manuscript.

Funding

We acknowledge the Mexican Science Council (CONACYT) for the scholarship of Carlos A. Espino-Reyes (463379).

Acknowledgments

The authors want to thank Mario Najera-Trejo and Eduardo Venegas-Reyes for the technical support provided during the project.

Conflicts of Interest

The authors declare no conflicts of interest.

Nomenclature

AsArea of the PV panel, m2
gGravitational constant, m/s2
hconvConvection coefficient, W/m2·K
hforcedForced convection coefficient, W/m2·K
hnaturalNatural convection coefficient, W/m2·K
LLength, m
LcharCharacteristic length, m
kairThermal conductivity of air, W/m·K
NuNusselt number, -
PrPrandtl number, -
Q12Radiative heat transfer between PV and building, -
ReReynolds number, -
RaRayleigh number, -
slopeSurface’s slope, deg
TairAmbient air temperature, K
TsurfaceSurface temperature of the PV panel, K
TskySky temperature, K
Tair-zoneTemperature of the air zone between the PV panel and building, K
T1PV temperature, K
T2Building roof temperature, K
v ˙ windWind speed, m/s
WWidth, m/s

Greek Symbols

αairAir thermal diffusivity, m2/s
βairInverse of the average air temperature, 1/K
ε1PV’s emissivity, -
ε2Building roof’s emissivity, -
μairAir dynamic viscosity, kg/m·s
ρairAir density, kg/m3
σStefan-Boltzmann constant, W/m2·K4

Abbreviations

ASHRAEAmerican Society of Heating, Refrigerating and Air-Conditioning Engineers
CELClean Energy Certificates, Certificados de Energia Limpia
CRERegulatory Energy Comission, Comision Reguladora de Energia
HVACHeating, ventilation, and air conditioning
LIEElectric Industry Law, Ley de la Industria Electrica
PVPhotovoltaic panel
SMNMexican National Meteorological Service, Servicio Meteorologico Nacional

References

  1. SENER. Balance Nacional de Energía 2017; Secretaria de Energía: Mexico City, Mexico, 2018.
  2. Climate Action Tracker Climate Action Tracker: Mexico. Available online: https://climateactiontracker.org/countries/mexico/ (accessed on 27 November 2019).
  3. CRE. Preguntas Frecuentes Sobre Los Certificados de Energías Limpias; Comision Reguladora de Energia: Mexico City, Mexico, 2017.
  4. Reforma Energetica—Resumen Ejecutivo 23; Gobierno de la Republica: Mexico City, Mexico, 2013.
  5. Diario Oficial de la Federacion. Ley General de Cambio Climatico; Camara de Diputados: Mexico City, Mexico, 2012; p. 58.
  6. Diario Oficial de la Federacion. AVISO Por el que se da a Conocer el Requisito Para la Adquisicion de Certificados de Energias Limpias en 2018; Secretaria de Energia: Mexico City, Mexico, 2015.
  7. Diario Oficial de la Federacion. AVISO por el que se da a Conocer el Requisito Para la Adquisición de Certificados de Energías Limpias en 2019, Establecido por la Secretaría de Energía; Secretaria de Energia: Mexico City, Mexico, 2016.
  8. Diario Oficial de la Federacion. AVISO por el que se da a Conocer los Requisitos Para la Adquisición de Certificados de Energías Limpias en 2020, 2021 y 2022 Establecidos por la Secretaría de Energía; Secreataria de Energia: Mexico City, Mexico, 2017.
  9. Pérez-Lombard, L.; Ortiz, J.; Pout, C. A review on buildings energy consumption information. Energy Build. 2008, 40, 394–398. [Google Scholar] [CrossRef]
  10. US Energy Information Administration. Assumptions to the Annual Energy Outlook 2017; US Energy Information Administration: Washington, DC, USA, 2017.
  11. Dominguez, A.; Kleissl, J.; Luvall, J.C. Effects of solar photovoltaic panels on roof heat transfer. Sol. Energy 2011, 85, 2244–2255. [Google Scholar] [CrossRef] [Green Version]
  12. Diario Oficial de la Federacion. NOM-020-ENER-2011. Envolvente de Edificios Para uso Habitacional; Comite Consultivo Nacional de Normalizacion para la Preservacion y Uso Racional de los Recursos Energeticos (CCNNPURRE): Mexico City, Mexico, 2011.
  13. Diario Oficial de la Federacion. NOM-008-ENER-2001. Eficiencia Energetica en Edificaciones, Envolvente de Edificios no Residenciales; Comite Consultivo Nacional de Normalizacion para la Preservacion y Uso Racional de los Recursos Energeticos (CCNNPURRE): Mexico City, Mexico, 2001.
  14. Labat, M.; Attonaty, K. Numerical estimation and sensitivity analysis of the energy demand for six industrial buildings in France. J. Build. Perform. Simul. 2018, 11, 223–240. [Google Scholar] [CrossRef]
  15. Abuseif, M.; Gou, Z. A review of roofing methods: Construction features, heat reduction, payback period and climatic responsiveness. Energies 2018, 11, 3196. [Google Scholar] [CrossRef] [Green Version]
  16. Gourlis, G.; Kovacic, I. Passive measures for preventing summer overheating in industrial buildings under consideration of varying manufacturing process loads. Energy 2017, 137, 1175–1185. [Google Scholar] [CrossRef]
  17. Katunsky, D.; Korjenic, A.; Katunska, J.; Lopusniak, M.; Korjenic, S.; Doroudiani, S. Analysis of thermal energy demand and saving in industrial buildings: A case study in Slovakia. Build. Environ. 2013, 67, 138–146. [Google Scholar] [CrossRef]
  18. Brinks, P.; Kornadt, O.; Oly, R. Development of concepts for cost-optimal nearly zero-energy buildings for the industrial steel building sector. Appl. Energy 2016, 173, 343–354. [Google Scholar] [CrossRef]
  19. Kapsalis, V.; Karamanis, D. On the effect of roof added photovoltaics on building’s energy demand. Energy Build. 2015, 108, 195–204. [Google Scholar] [CrossRef]
  20. Chowdhury, S.; Ahmed, K.S.; Hamada, Y. Thermal performance of building envelope of ready-made garments (RMG) factories in Dhaka, Bangladesh. Energy Build. 2015, 107, 144–154. [Google Scholar] [CrossRef]
  21. Song, M.; Mao, N.; Xu, Y.; Deng, S. Challenges in, and the development of, building energy saving techniques, illustrated with the example of an air source heat pump. Therm. Sci. Eng. Prog. 2019, 10, 337–356. [Google Scholar] [CrossRef]
  22. Fan, C.; Xiao, F.; Li, Z.; Wang, J. Unsupervised data analytics in mining big building operational data for energy efficiency enhancement: A review. Energy Build. 2018, 159, 296–308. [Google Scholar] [CrossRef]
  23. Silvestre-Blanes, J.; Pérez-Lloréns, R. Energy efficiency improvements through surveillance applications in industrial buildings. Energy Build. 2011, 43, 1334–1340. [Google Scholar] [CrossRef] [Green Version]
  24. Becherini, F.; Lucchi, E.; Gandini, A.; Barrasa, M.C.; Troi, A.; Roberti, F.; Sachini, M.; Di Tuccio, M.C.; Arrieta, L.G.; Pockelé, L.; et al. Characterization and thermal performance evaluation of infrared reflective coatings compatible with historic buildings. Build. Environ. 2018, 134, 35–46. [Google Scholar] [CrossRef]
  25. Roberti, F.; Oberegger, U.F.; Lucchi, E.; Gasparella, A. Energy retrofit and conservation of built heritage using multi-objective optimization: Demonstration on a medieval building. Build. Simul. Appl. 2015, 2015, 189–197. [Google Scholar]
  26. Wang, Y.; Tian, W.; Ren, J.; Zhu, L.; Wang, Q. Influence of a building’s integrated-photovoltaics on heating and cooling loads. Appl. Energy 2006, 83, 989–1003. [Google Scholar] [CrossRef]
  27. Parida, A.; Chatterjee, D. Cost effective utility-solar photovoltaic based hybrid scheme for institutional buildings: A case study. IET Gener. Transm. Distrib. 2017, 11, 1102–1110. [Google Scholar] [CrossRef]
  28. Wang, Y.; Wang, D.; Liu, Y. Study on Comprehensive Energy-saving of Shading and Photovoltaics of Roof Added PV Module. Energy Procedia 2017, 132, 598–603. [Google Scholar] [CrossRef]
  29. Peng, C.; Yang, J. The Effect of Photovoltaic Panels on the Rooftop Temperature in the EnergyPlus Simulation Environment. Int. J. Photoenergy 2016, 2016, 1–12. [Google Scholar] [CrossRef] [Green Version]
  30. Colliers International. Mercado Industrial: Guanajuato; Colliers International: Guanajuato, Mexico, 2015. [Google Scholar]
  31. Colliers International. Mercado Industrial: Juarez; Colliers International: Ciudad Juarez, Mexico, 2016. [Google Scholar]
  32. Colliers International. Mercado Industrial: Monterrey; Colliers International: Monterrey, Mexico, 2016. [Google Scholar]
  33. Colliers International. Mercado Industrial: Tijuana; Colliers International: Tijuana, Mexico, 2016. [Google Scholar]
  34. Colliers International. Mercado Industrial: Torreon; Colliers International: Torreon, Mexico, 2016. [Google Scholar]
  35. Colliers International. Mercado Industrial: Guadalajara; Colliers International: Guadalajara, Mexico, 2016. [Google Scholar]
  36. Diario Oficial de la Federacion. NOM-025-STPS-2008, Condiciones de Iluminación en los Centros de Trabajo; Secretaria del Trabajo y Prevision Social: Mexico City, Mexico, 2008.
  37. Cengel, Y. Ghajar Afshin Heat and Mass Transfer: Fundamentals and Applications 5th Edition. Mech. Eng. Handb. Energy Power Third Ed. 2015, 4, 371–420. [Google Scholar]
  38. Pérez, J.B.; Cabanillas, R.E.; Hinojosa, J.F.; Borbón, A.C. Estudio Numérico de la Resistencia Térmica en Muros de Bloques de Concreto Hueco con Aislamiento Térmico. Inf. Tecnol. 2011, 22, 27–38. [Google Scholar] [CrossRef]
  39. Integrated Environmental Solutions Limited Apache-Tables; Integrated Environmental Solutions Ltd.: Glasgow, UK, 2014; Volume 5, p. 36.
  40. ISO 10456:2007 Building Materials and Products—Hygrothermal Properties—Tabulated Design Values and Procedures for Determining Declared and Design Thermal Values; International Organization for Standarization: Geneva, Switzerland, 2007; p. 25.
  41. Baldwin, A.J.; Lovell-Smith, J.E.R. The emissivity of stainless steel in dairy plant thermal design. J. Food Eng. 1992, 17, 281–289. [Google Scholar] [CrossRef]
  42. ASHRAE Standard 55-2010, Thermal Environmental Conditions for Human Occupancy; ASHRAE: Atlanta, GA, USA, 2010; p. 42.
  43. FANOSA Soluciones que Cumplen con la NOM-020-ENER-2011. Available online: https://www.gob.mx/cms/uploads/attachment/file/84531/2_FANOSA.pdf (accessed on 4 March 2019).
  44. Frank, I.; DeWitt, D.P.; Bergman, T.L.; Lavine, A.S. Fundamentals of Heat and Mass Transfer; John Wiley & Sons Ltd.: Hoboken, NJ, USA, 2007; Volume 7, ISBN 9780470055540. [Google Scholar]
  45. Roxul Inc. ROXUL PLUS MB Product Description & Application Metal Building Batt Insulation; Roxul Inc.: Hedehusene, Denmark, 2004; p. 8024. [Google Scholar]
  46. Gonzalez, M.; Rodriguez-Muñoz Norma, A.; Romero-Perez Claudia, K.; Escobedo-Bretado Jorge, A.; Martin-Dominguez Ignacio, R.; Najera-Trejo, M. Comparacion de datos climaticos utilizados en simulaciones dinámicas de sistemas termicos en cuatro ciudades de Durango, Mexico. In Proceedings of the Semana Nacional de Energia Solar 2017, Asociacion Nacional de Energia Solar, Álvaro Obregón, Mexico, 18 April 2017; p. 7. [Google Scholar]
  47. Selena Cool-R Highly Reflective Waterproofing Coating Datasheet. Available online: https://cool-r.eu/wp-content/uploads/2016/06/COOL-R-TDS-1-2017-EN.pdf (accessed on 27 November 2019).
  48. Moran, M.J.; Shapiro, H.N. Fundamentals of Engineering Thermodynamics, 5th ed.; John Wiley & Sons Ltd.: Chicheste, UK, 2006; pp. 206–271. [Google Scholar]
  49. Solartec 240–260 W Solar Panel—Policristalline. Available online: https://abtec.com.mx/wp-content/uploads/2018/02/ficha-tecnica-panel-solartec-250-270w.pdf (accessed on 25 January 2020).
  50. Winterwarm Heating Solutions Winterwarm TR—Rooftop Series. Available online: https://www.winterwarm.com/industrial/winterwarm_tr_rooftop_/technical_table_tr_rooftop.aspx?mode=tabel (accessed on 27 November 2019).
  51. European Union Law. COMMISSION DIRECTIVE 2002/31/EC of 22 March 2002 Implementing Council Directive 92/75/EEC with Regard to Energy Labelling of Household Air-Conditioners; Comission of the European Communities: Brussels, Belgium, 2002; p. 21. Available online: https://eur-lex.europa.eu/legal-content/EN/TXT/PDF/?uri=CELEX:02002L0031-20020423&from=ES (accessed on 12 February 2020).
  52. CRE Índices de Referencia de Precios de Gas Natural. Available online: http://www.cre.gob.mx/IPGN/index.html (accessed on 1 April 2019).
  53. PEMEX Gas Natural. Available online: https://es.inflation.eu/tasas-de-inflacion/mexico/inflacion-historica/ipc-inflacion-mexico-2019.aspx (accessed on 1 April 2019).
  54. PEMEX Gas Natural Precios Máximos VPM Mensuales. Available online: http://www.pemex.com/comercializacion/productos/Precios/Paginas/GN-VPM-mensuales.aspx#InplviewHashe2d7ef7b-2778-4153-89e8-4d699dfc91a8= (accessed on 1 April 2019).
  55. CFE Tarifa GDMTH: Gran Demanda en Media Tensión Horaria. Available online: https://app.cfe.mx/Aplicaciones/CCFE/Tarifas/TarifasCRENegocio/Tarifas/GranDemandaMTH.aspx (accessed on 1 April 2019).
  56. Stoecker, W.F. Design of Thermal Systems, 3rd ed.; McGraw-Hill: New York, NY, USA, 1989; ISBN 978-0070616202. [Google Scholar]
  57. Long Term Energy Sector Auctions—Third Acution Results and Summary on the Previous Two. Available online: https://home.kpmg/mx/es/home/tendencias/2018/02/long-term-energy-sector-auctions.html (accessed on 12 February 2020).
  58. CONUEE. Programa de Eficiencia Energética en la Administración Pública Federal (APF) 2020 (Energy Efficiency Program in the Mexican Federal Public Administration 2020). Available online: https://www.gob.mx/conuee/acciones-y-programas/programa-de-eficiencia-energetica-en-la-administracion-publica-federal-apf-2019 (accessed on 23 January 2020).
  59. CONUEE. Lineamientos de Eficiencia Energética para la Administración Pública Federal (Energy efficiency Guidelines for the Mexican Federal Public Administration). Available online: https://www.gob.mx/conuee/articulos/disposiciones-y-lineamientos-de-eficiencia-energetica-para-las-dependencias-y-entidades-de-la-administracion-publica-federal (accessed on 23 January 2020).
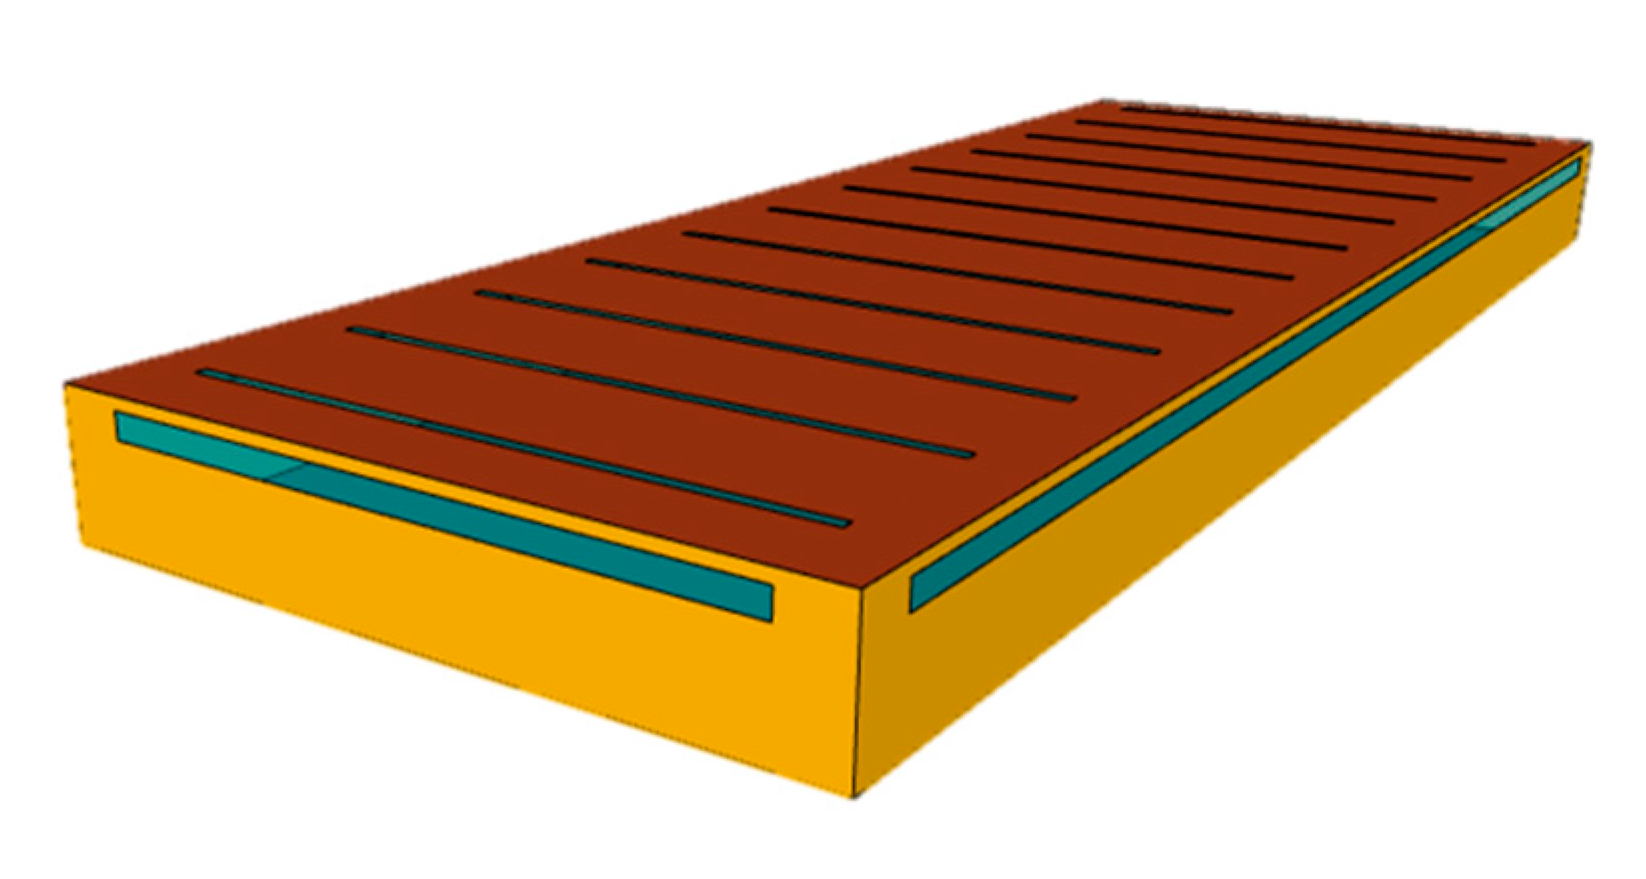
Figure 1. Studied industrial building model with a flat roof.
Sustainability 12 01391 g001
Figure 2. Insulation scenarios (proposals AF).
Sustainability 12 01391 g002
Figure 3. Energy balance between the PV system and the industrial building.
Sustainability 12 01391 g003
Figure 4. Annual energy requirements per square meter (heating and cooling) of the industrial buildings. (a) Ciudad Juarez, (b) Guadalajara, (c) Guanajuato, (d) Monterrey, (e) Torreon, and (f) Tijuana.
Sustainability 12 01391 g004
Figure 5. Economic viability. Payback period: (a) Heating (b) Cooling (c) Heating + Cooling, and Net Present Value: (d) Heating (e) Cooling (f) Heating + Cooling.
Sustainability 12 01391 g005
Figure 6. PV’s impact on the building’s energy demand. (a) Ciudad Juarez, (b) Guadalajara, (c) Guanajuato, (d) Monterrey, (e) Tijuana and (f) Torreon.
Sustainability 12 01391 g006
Figure 7. PV system effect on the energy demand of the industrial building (metallic roof).
Sustainability 12 01391 g007
Figure 8. PV’s payback period for each scenario.
Sustainability 12 01391 g008
Figure 9. Savings due to the reduction in the CELs requirements – Envelope proposals. (a) 2016 mean CELs price (b) 2017 mean CELs price.
Sustainability 12 01391 g009
Table 1. Thermal properties of the façade.
FaçadeMaterialThickness
(m)
Thermal Conductivity
k (W/m K)
Density
ρ (kg/m3)
Specific Heat
Cp (J/kg K)
Tilt-up [12,37]Reinforced concrete0.20001.7402300840
Concrete [38,39]Concrete block0.20000.87714001000
Steel [40,41]Steel sheet0.007552.307800450
Table 2. Thermal and optical properties of the considered materials.
MaterialThermal Conductivity
k (W/m K)
Density
ρ (kg/m3)
Specific Heat
Cp (J/kg K)
α 1ε 2Source
Expanded polystyrene0.036015.961210--[43,44]
Mineral wool0.035732.00835--[37,45]
White paint---0.300.93[37,46]
Metal roof52.3078004500.300.60[39,40]
White waterproofing---0.140.85[47]
Soil0.5220501840--[48]
1α: absorptivity, 2ε: emissivity.
Table 3. Temperature ranges implemented for heating and cooling.
City (Climate)Heating Setpoint
(°C)
Cooling Setpoint
(°C)
Ciudad Juarez (BWk)2128
Guadalajara (Cwa)2027
Guanajuato (Cwb)2027
Monterrey (BSh)2027
Torreon (BWh)2128
Tijuana (BSk)2027
Table 4. Characteristics of the photovoltaic (PV) panel [49].
ParameterValue
Dimensions (m)1.64 × 0.99 × 0.04
TechnologyPolycrystalline silicon
Open circuit voltage (V)36.30
Optimum operating voltage (V)30.60
Short circuit current (A)8.71
Maximum operating current (A)8.17
Maximum power (W)250
Module’s efficiency (%)15.39
Temperature coefficient (1/°C)−0.005
Table 5. Electricity and natural gas mean prices.
City (ID)Natural Gas (USD/kWh)Electricity (USD/kWh)
201820152016201720182019
Ciudad Juarez (CDJ)0.0120.0550.0550.0720.0650.068
Guadalajara (GDL)0.0160.0600.0600.0770.0680.072
Guanajuato (GTO)0.0150.0600.0600.0770.0700.075
Monterrey (MTY)0.0130.0550.0550.0710.0600.065
Tijuana (TIJ)0.0140.0570.0580.0750.041-
Torreon (TOR)0.0120.0550.0550.0720.0650.068
Table 6. Economic parameters summary.
ParameterValue
Interest rate or inflation (%)4.126
Energy price escalation of electricity (%)7.09
Energy price escalation of natural gas (%)11.47
Envelope investment costSee Table 7
Investment cost of PV system (USD)636,298
Table 7. Implementation cost of each proposal.
Proposals(1) Metallic Roof(2) Cool Roof
Total Cost (USD)
A-$61,116
B$31,032$92,148
C$43,076$104,192
D$113,791$174,907
E$144,823$205,939
F$156,867$217,983
Table 8. Cost per square meter of material and building total.
MaterialTotal Cost
(USD/m2)
Total Cost per Building
(USD)
Expanded polystyrene (1″)$7.31$31,032
Expanded polystyrene (3″)$10.08$43,076
Mineral wool (4″)$12.10$113,791
Table 9. Percentage of heating and cooling costs supplied by the PV.
City (ID)Percentage of Energy Costs Supplied by PV
(%)
Difference
(%)
Simplified HTDetailed HT
Ciudad Juarez (CDJ)809012.5
Guadalajara (GDL)8710318.4
Guanajuato (GTO)779118.2
Monterrey (MTY)9211423.9
Tijuana (TIJ)961059.4
Torreon (TOR)11113319.8