Article

Paradigm Shift in Business Education: A Competence-Based Approach

by
Constantin Bratianu
1,2,
Shahrazad Hadad
1,2,* and
Ruxandra Bejinaru
2,3
1
UNESCO Department of Business Administration, Faculty of Business Administration, Bucharest University of Economic Studies, Piata Romana 6, 010731 Bucharest, Romania
2
Academy of Romanian Scientists, Splaiul Independentei 5, 05009 Bucharest, Romania
3
Department of Management, Business Administration and Tourism, Faculty of Economics and Public Administration, “Stefan cel Mare” University of Suceava, 720229 Suceava, Romania
*
Author to whom correspondence should be addressed.
Sustainability 2020, 12(4), 1348; https://doi.org/10.3390/su12041348
Submission received: 13 January 2020 / Revised: 29 January 2020 / Accepted: 10 February 2020 / Published: 12 February 2020

Abstract

:
The fast and unpredictable changes in the business environment lead to significant changes in the future job market. For current business students, the future will offer many new opportunities for their employment but, at the same time, it will also create many threats disguised in the disappearing jobs. Business education centered mainly on knowledge transmission is challenged to switch towards a competence-based approach which includes knowledge, skills, and attitudes. The present research focuses on the need to change the paradigm of business education by creating a new learning environment centered on business competencies, and on a new knowledge ecosystem dynamics. The approach uses both qualitative and quantitative methods. In the first phase the research is focused on a critical literature review, and extraction of ideas for the next phase based on quantitative methods. In order to evaluate the students’ perception on the need of competence-based business education, a questionnaire has been designed and applied to undergraduate and graduate students enrolled in business and management programs. Data is processed by using SPSS and deriving six logistic regressions based on the conceptual model designed similar to a hierarchy Findings coming from students show a significant awareness for the need of paradigm shift in business education, from knowledge transfer to business competence development.

1. Introduction

The volatile, uncertain, complex, and ambiguous (VUCA) business environment decreases our capacity for future anticipation. The future cannot be predicted anymore by extrapolating the present situation based on deterministic thinking models. Strategic planning [1] has been replaced by new complex strategy designs which integrate deliberate and emergent strategies based on probabilistic thinking models and complexity theories [2,3,4]. The new rule of the game is strategizing, which is defined by Spender as “the judgment or imaginative response to what is NOT known, to the surprising, unexpected, incomplete, or illogical nature of what arises through our practice” [5] (p. 21). That rule applies both to business processes and to business education. Our present students will face within the next 10–20 years many changes in the job markets. Some well-known jobs today will disappear and new jobs will enter the business activity. Against that pitfall, universities’ leaders should be strategizing on the need of changing the business education paradigm, which is based on knowledge transfer, cases study, and a linear curriculum for known jobs and known situations into one which is based on business competencies development, and a nonlinear curriculum [6,7,8]. Linear curriculum is based on linear thinking [9] and implies a series of disciplines representing knowledge domains which are more or less correlated. Learning is based on the container metaphor, which means that knowledge represents a summation of all individual disciplines’ contributions seen as mental objects. “According to an older view, learning consists of taking in from outside. According to the more fashionable constructivist view, the mind constructs the objects it contains. The container metaphor remains, however, and that is where the trouble starts” [10] (p. 20). The business culture reflecting the division of labor used in industrial management, which was promoted by Adam Smith and then applied successfully by Henry Ford in designing the assembly line, supported the container or silo teaching and learning [11]. Moreover, designing knowledge packages for well-defined jobs existing today but not in the future, professors increase the efforts of students for finding new possible jobs and understanding their requirements through intentional unlearning processes [12].
Analyzing business and management graduate education performed within the Master of Business Administration (MBA) programs delivered by American and Canadian universities, Mintzberg considers that “conventional MBA programs train the wrong people in the wrong ways and with the wrong consequences” [13] (p. 6). Business and organizations are complex social systems with complex structures and processes which cannot be reduced to some linear combinations of university disciplines and classroom simulations in discussing cases study. In addition, some of the deterministic thinking models used in business education should be changed with the probabilistic ones to incorporate uncertainty of the future [14,15]. Martin [16] (p. 62) suggests to incorporate into the business school’s curricula design-thinking and abductive reasoning models. Tsang and Tsui [17] introduce the concept of Personal Learning and Network Environment (PLE&N) to create a knowledge ecosystem, by using the advantages of information technology. The new learning environment is designed to satisfy the learner’s needs and the requirements of the changing business landscape. Tsui and Dragicevic [18] demonstrate that curriculum can be improved by co-creation inviting students, graduates, managers, and employers to work together with professors academic leaders. They developed new approaches for curriculum design by co-creation with the support of scenario development techniques facilitated in the personal learning and network environment.
The vision of the leading business schools is to design their curricula such that they would prepare business leaders who can change the world. That means to create a new mindset with a greater emphasis on innovation, ethics, and corporate governance [19,20,21]. In addition, business education needs experiential learning [22], integration of emotional knowledge [23,24] and the dynamics between cognition and emotion, as shown by neurosciences [25,26]. All of these above arguments lead to the need of changing the business education paradigm by introducing the competence-based learning [7,8,27]. The new paradigm is centered on students and on their personal learning environments. Transforming students in active knowledge seekers and experiential learners driven by motivation and values requires from them a high level of engagement and a lot more effort. The question is if they are aware of what means a competence-based education, and if they are ready for the paradigm shift. The aim of this paper is to search for business students’ understanding of what competence-based learning means and of their readiness to engage in the new education paradigm. A complementary aim is to search for business professionals’ view concerning the need of changing the way business education is designed and delivered at undergraduate and graduate levels. In line with these above ideas, we formulate the following research question:
RQ: Are students enrolled in Business Administration programs aware of the need of changing the teaching-learning paradigm from knowledge transfer to competence development?
Since business education models have got a certain degree of standardization as a result of accreditation agencies, the present research focused on business students from two important universities in Romania. Findings show that students are not fully aware of the need of the paradigm shift and of their increased effort and engagement as active learners. The contribution of this paper comes from its focus on competence-based learning and the search of students’ awareness of the need of changing the teaching and learning paradigm from knowledge transfer to competence development. That means to incorporate in our university programs new ways of developing some basic skills for students and stimulating their motivation for a greater effort in doing that. In the classical approach of knowledge transfer, students have almost a passive role of receiving that knowledge and incorporating it in the known one. In the new paradigm of personal learning environment, students become active players in acquiring and processing information and knowledge [8,10,11].
The structure of the paper is as follows. After this brief introduction, in Section 2 we present a critical review of the main concepts related to competence-based business education, and we try to formulate a working definition for competence. In Section 3, we present the methods used for the present research, from designing the questionnaires and data validation to data processing. In Section 4, we discuss the findings of our research and interpret them with respect to the business environment specific to an emergent economy. Section 5 presents the main conclusions and Section 6 presents implications, limitations, and future directions of research.

2. Literature Review

2.1. Business Education at Cross-Roads

The business education model designed for a steady-state business environment faces real difficulties today in preparing students for their future jobs [6,7,8,11,13]. To change that model, we have to understand the meaning and purpose of business. “To know what a business is we have to start with its purpose. Its purpose must lie outside of the business itself. In fact, it must lie in society since business enterprise is an organ of society. There is only one valid definition of business purpose: to create a customer” [28] (p. 61). Globalization and disruptive innovations contributed significantly to a dramatic change in the needs of customers and thus in the way business can satisfy those needs [29,30,31,32,33]. In the same time, the job market for business and management graduating students suffers a continuous dynamic. Universities should prepare them for “jobs that have not yet been created, for technologies that have not yet invented, to solve problems that have not yet been anticipated. It will be a shared responsibility to seize opportunities and find solutions” [6] (p. 2).
Changes from the external business environment induced changes into the internal environment of organizations, and in its management. The new types of business activities and processes supported by complex information technology platforms and artificial intelligence applications [34,35,36] generated new forms and structures for organizations, with new managerial models and philosophies. Change is not anymore an episodic event for an organization but a continuous process with different intensities. Business education should be able to incorporate all of these ideas into its philosophy and overcome the inertial forces of stakeholders, organizational culture and legislation. Tsang and Tsui [17] propose the model of PLE&N to explore a learner-centric alternative of business education. “PLE&N is a peer-based learner-centric platform which aims to foster self-regulated, network-based, and lifelong learning” [18] (p. 852). Tsui and Dragicevic develop further that model by incorporating a scenario building process, done by co-creation of professors and students together. Scenario building is not a prediction of the future but a process of exploration of different possible futures based on some trends in macroeconomics and rational hypotheses. Students who participate in building these scenarios learn from doing them and contribute to the improvement of business curriculum.
The mission of some top business schools of creating leaders able to change the world implies a new business mindset structured around a new set of ethical values which depart from the profit maximization principle without any consideration for the social and natural environment [21,37,38]. “The solution lies in the principle of shared values, which involves creating economic value in a way that also creates value for society by addressing its needs and challenges. Business must reconnect company success with social progress” [39] (p. 64). Among these shared values should be Corporate Social Responsibility (CSR), which has both cultural and legislative dimensions [40]. The unfortunate cases of corporate social irresponsibility, like that of Enron, demonstrate the vulnerability of firm whose market value largely rests on intangibles [41,42].
Universities should open their learning environment towards the business landscape for experiential learning through internship and part-time jobs for students, and should create a digital universe of knowledge to stimulate students for individual study. Professors and classroom lectures lost their dominance in the students’ way of learning, and the solution is to design knowledge ecosystems for business education with multiple information sources and learning alternatives [43,44,45]. Students should be encouraged to develop skills for knowledge searching and learning to learn. Developing generic skills become more important than knowledge transfer [46,47].

2.2. Searching for a Working Definition of Competence

The concept of competence is a fuzzy semantic construct, with many definitions and interpretations [6,27,48,49]. The explanation comes from the fact that researchers coming from different activity domains, from psychology to management, attributed different meanings to the same concept. In addition, it is a semantic construct with several components, each of them being a fuzzy semantic entity. Our purpose is not to search for the commonly accepted definition because it will be an endless debate on that, but to find a good enough definition to work with it in practice.
According to the Oxford Learner’s Dictionary, competence (less frequently competency) denotes “the ability to do something well”, and “a skill that you need in a particular job or for a particular task”. The Merriam-Webster Dictionary defines competence as “the quality or state of having sufficient knowledge, judgment, skill, or strength”. The concept has the following synonyms: competency, ability, capability, and capacity. From these definitions we learn that competence represents the ability or capacity of doing something at a certain level of acceptance, based on knowledge, judgment and skill. The first observation is that the concept contains several components: knowledge, judgment, and skill. The second observation is that the concept is defined with respect to a certain task. That means that competence reflects a relationship between the subject and her or his task, which is performed within a certain context. The third observation is that there is a certain level of quality expected in performing that task. The logical consequence of these arguments is that attributes integrated in the construct of competence are not enough for its definition. There is also a certain degree of expectation in performing a giving task, which may depend on the particular context of performing that task.
In a holistic approach Hager and Gonczi consider that “competence is conceptualized in terms of knowledge, abilities, skills and attitudes displayed in the context of a carefully chosen set of realistic professional tasks which are of an appropriate level of generality” [48] (p. 15). The definition includes “attitudes” as an attribute like knowledge and skills. In addition, it relates the capabilities of people and the completion of a given task at a certain level of expectations. However, because among the attributes is listed “ability”, which is synonym with “competence”, the definition becomes ambiguous. An interesting observation made by the authors is that “While performance of tasks is directly observable, abilities or capabilities that underlie the performance are necessarily inferred” [48] (p. 16).
Sandberg using a constructivist and interpretative approach, views competence as a function of the context where “worker and work form one entity through lived experience of work” [50] (p. 50). Thus, competence is context-dependent and it can be defined only with the specific organizational context in which it is applied. That is a strong limitation for a competence definition, but it has the advantage of acknowledging the importance of tacit knowledge [51,52] which is created as a result of doing a certain task.
Le Deist and Winterton consider that in the USA there is a tradition of approaching the concept of competence from a behavioral perspective since it captures “skills and dispositions beyond cognitive ability such as self-awareness, self-regulation and social skills; while some of these may also be found in personality taxonomies, competencies are fundamentally behavioral and, unlike personality and intelligence, may be learned through training and development” [49] (p. 31). However, more recent studies, especially those related to leadership, focus on job-related competencies which means a switch toward a functional perspective. That functional approach can be found in the UK, where governments performed a series of studies to develop a unified system of work-based qualifications for VET. After many debates, the following definition for competence has been adopted: “The ability to apply knowledge, understanding and skills in performing to the standards required in employment. This includes solving problems and meeting changing demand” [49] (p. 35). This definition refers only to the application of knowledge, therefore it results that it is focused only on tacit knowledge, while the explicit knowledge is put apart. Some more recent definitions for competence include explicit knowledge and its understanding.
Le Deist and Winterton [49] develop a typology of competence within a framework defined by a matrix with the following dimensions: occupational-personal and conceptual-operational. The matrix contains four types of competencies:
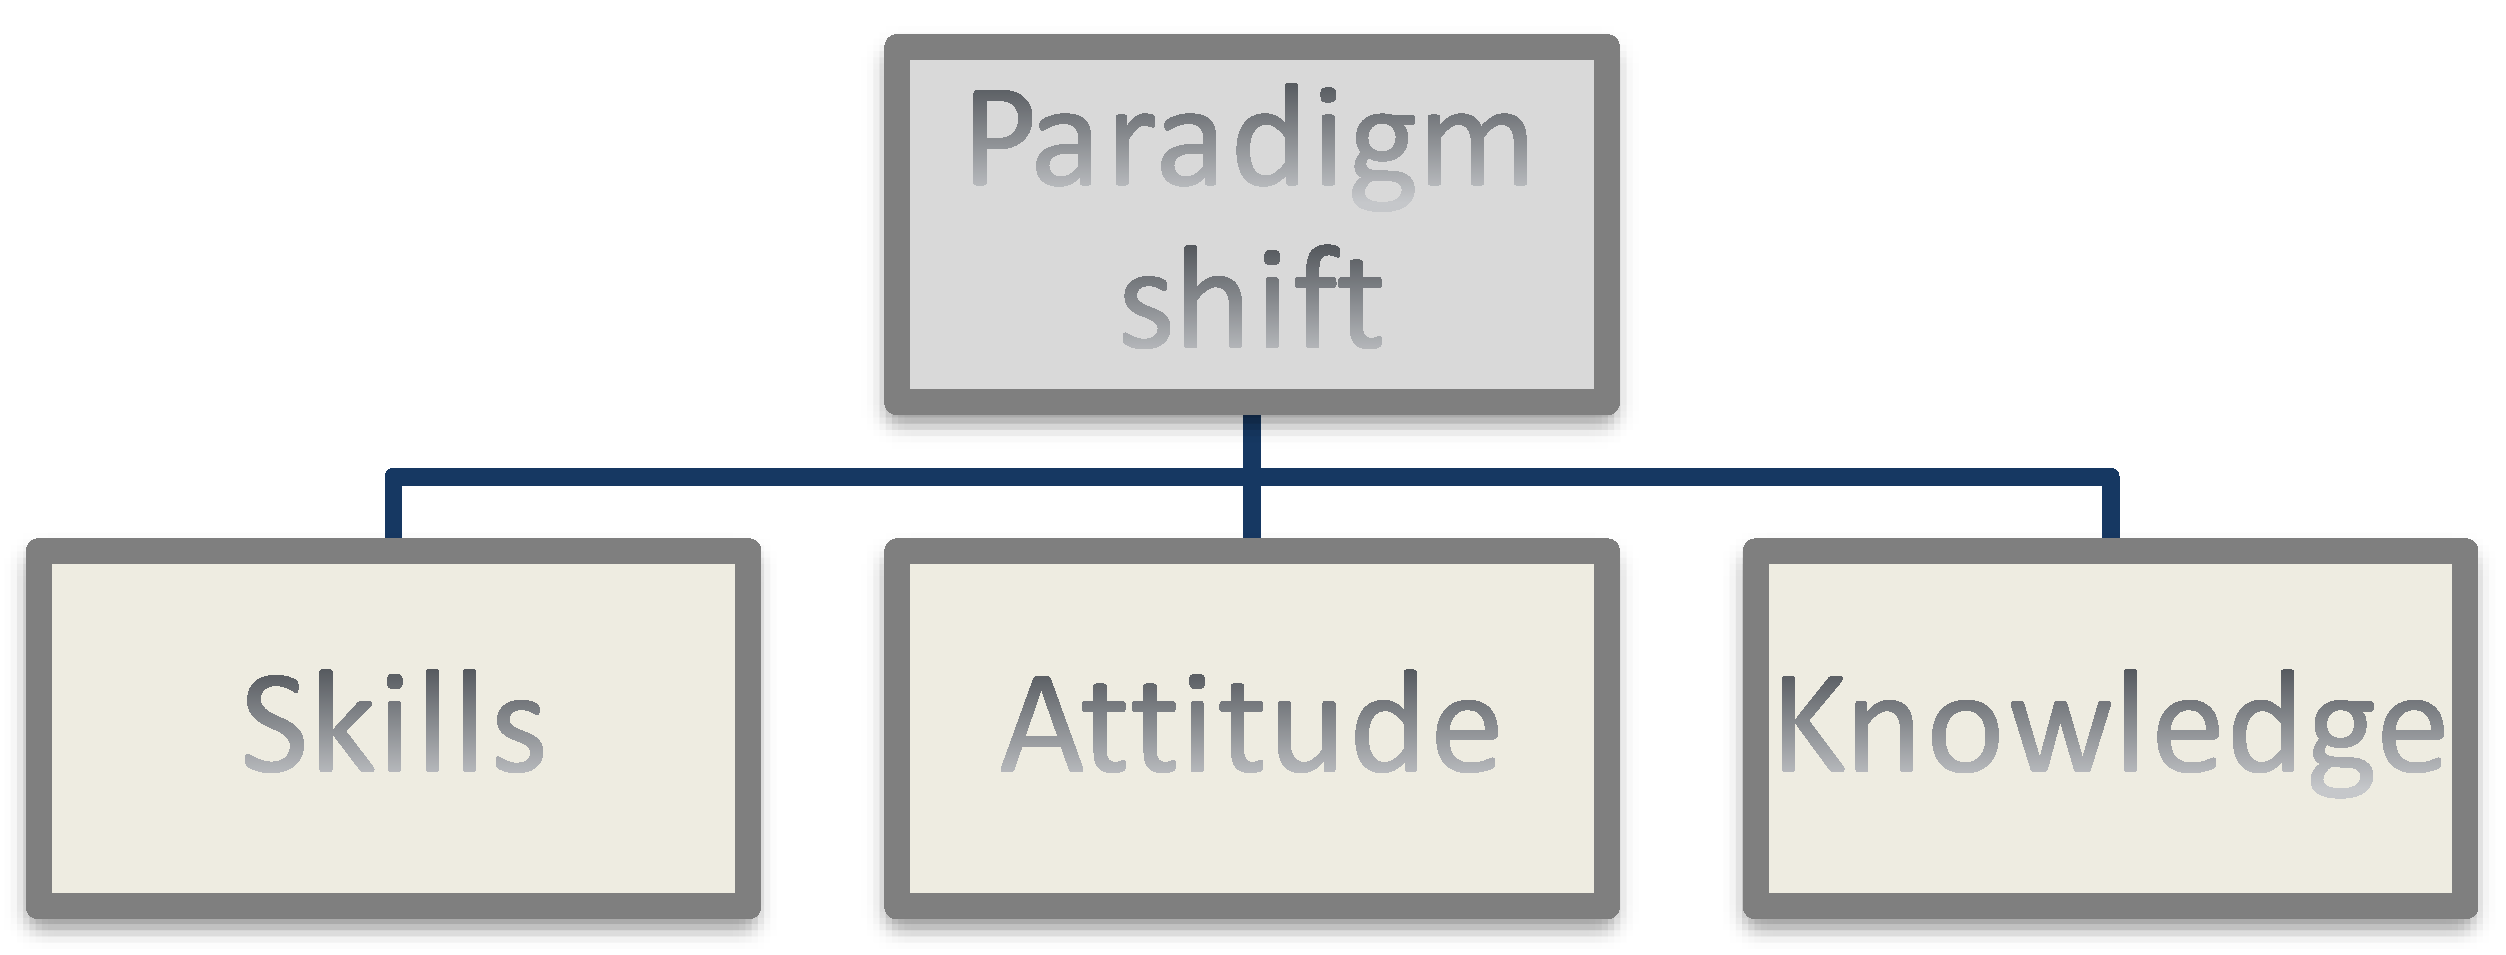
  • cognitive competence (conceptual-occupational)—including knowledge and understanding;
  • functional competence (operational-occupational)—including skills;
  • social competence (operational-personal)—including attitude and behavior;
  • meta-competence (conceptual-personal)—it is concerned with the ability to cope with uncertainty, learning and reflection.
This framework represents a multi-dimensional holistic approach which contains the largest semantic domain for the competence concept. Eizaguirre, Garcia-Feijoo, and Laka emphasize the importance of assessing the competence power of performing a given task based on some criteria or standard procedures [27].
Based on this critical literature review, we would consider as a working definition for competence the following formulation: A competence is a dynamic integration of knowledge, skills, and attitude capable of performing a generic task, in a given context, at a certain quality level. A generic skill is representing that class of skills that are complex enough to generate a synergy between rational, emotional, and spiritual knowledge, leading to a superior performance. A competence assumes a certain level of quality in the final result, a level indicated by some defined indicators or just by some better outcomes in comparison with some other individuals performing same tasks [6,7]. The quality level is driven mostly by the spiritual knowledge and a set of cultural values.
Knowledge is considered in its full semantic spectrum composed of rational, emotional, and spiritual fields [53], as well as tacit and explicit knowledge [51,54,55]. In this perspective spiritual knowledge contains cultural values and organizational values, therefore they do not appear as a separate component of competence. They play a decisive role in decision-making [56] and creating a certain attitude. Skills refer to all categories, from cognitive to social and physical ones. Today, business education is focusing on developing generic skills, also known as core skills, key skills, essential skills, basic skills, or employability skills [57,58]. In business education, the most important conceptual generic skills are the following: searching for information and knowledge, problem solving, creative thinking, strategic thinking, and learning to learn [46,58,59]. Attitude contains psychological traits [60,61] and social intelligence [14,62,63] which determine the level of performing any professional tasks. Motivation stands out as a driving force for full commitment in developing professional competencies [64]. The increased complexity of the business environment and its fast dynamics request developing critical systems thinking [65,66].

3. Research Objectives and Methodology

The research question of the present paper is whether business education universities should change from a classical transfer approach to a competence-based practice, moreover to evaluate the perception of the students in the same regard. In order to find out the answer to this research question we built a questionnaire. However, for getting to this set of 27 questions, we have elaborated a draft questionnaire (36 questions) that was tested and retested both amongst students and business owners to check their perspectives and check for any redundancies, biases, misleading questions, or the framework effect.
Following, we established the final improved form of the questionnaire which consisted in 27 items, including the demographic variables. In the present article, we will only analyze the first 24 questions. Except for the demographic questions, 18 of them were closed questions to answers on 5-point Likert scale: 1 (strongly disagree), 2 (disagree), 3 (neither agree nor disagree), 4 (agree), and 5 (strongly agree), and 6 were binary questions which rendered yes or no answers. The questions were randomized as to avoid the framework or priming effect and they were distributed to a non-probabilistic sample. The population we targeted was made of students coming from the Faculty of Business Administration of the Bucharest University of Economic Studies and the Faculty of Economic Sciences and Public Administration, “Stefan cel Mare” University of Suceava. We physically distributed 436 questionnaires to students, after the distribution we managed to collect 368 valid questionnaires, obtaining a response rate of 84.44%.
The refined data was input for analysis by using the dedicated software SPSS 20. By means of Analytic Hierarchy Process [67,68] we managed to build the conceptual framework for developing the six logistic regression models [69,70], one for each educational construct identified. Additionally, the third-layer questions were grouped as indicators for the second-layer questions, namely the constructs. Each two constructs amounted (no quantitative liaison intended) to one of the three first layer components: knowledge, motivation, skills. Table 1 depicts the conceptual model previously described.
The use of the logistic regression is supported by the following two facts:
  • Each group was connected via semantic membership to one of the six layer-two components; quantitatively, the layer-three items from different groups are correlated (we have tested this), however this is not the research quest of the herby analysis.
  • Within each of the six groups we have gathered information with respect to both binary responses (one question) and five point Likert scale (1–5) which build up a natural setting for the logistic regression procedure with the binary item as the output/dependent variable and the other 3 items as input/independent variables.
The literature review was synthesized by means of Analytic Hierarchy Analysis (AHP), and it delivered the conceptual model. Within each second-layer component, the SPSS regression delivered the values of the coefficients corresponding to each third-level question, together with their statistical significance.
The hierarchy became complicated, therefore we asked the experts to reduced it and we used a very simple hierarchy to see which is the perception of the business environment and educational teachers on the perceptions of students’ attitudes and, as we will present in the last sub-chapter of Results and discussion in the section Validation of results, and we finally intend to measure the distance between the expected value of the students and the priority vectors given by the experts, so we decided for a simple hierarchy model (Figure 1).
The next step is to proceed to the pairwise comparison between the criteria with respect to the goal (or problem to be solved) and the alternatives with respect to each criterion, and in order to do so, the decision maker has to resort to a numerical scale. The numerical scale designed by Saaty [71] is presented in Table 2.
After the pairwise comparison of the alternatives (A1, A2, …, An) according to their importance (i1, i2, …, in) the following matrix is then obtained (Table 3).
Finally, the consistency index points out to the amount of consistency which was exhibited by the expert, the higher the consistency the better.

4. Discussion of Results

In order to determine the students’ perception on the needs of the competence-based business education we created the analytic hierarchic conceptual model (Table 1) and we ran six logistic regression procedures in SPSS, for each of the main (second-layer) educational components. In the following, we present the results for each applied regression model. As a general rule, the dependent variable is a binary one (corresponding to Q19-24, respectively (Table 1), while the independent variables are the corresponding third layer questions.
We begin our discussion by presenting some ideas obtained from the descriptive statistics of the statistical analysis with SPSS, and extracting their mean value to compare and reflect on them. In addition, we computed the mean values for the indicators and the main competence components (see Table 4). Analyzing the mean values of the items describing the role of explicit knowledge in learning, we get that most of the students prefer to study by using online information sources instead of attending lectures and listening to their professors. For tacit knowledge, students prefer to learn from their own entrepreneurial activities, a tendency that is in concordance with experiential learning principles [22]. The focus on the learning to learn indicators is on Q14, which indicates clearly the awareness of students for the need for longlife learning. For the problem solving construct, students recognize that business problems have always several solutions, which is different from school’s problems that have almost always one single solution. In addition, most of the problems involve nonlinear concepts like knowledge, intellectual capital, and organizational performance [72]. The answers to the motivation construct demonstrate that students understand very well the critical role of motivation in learning [60]. The analysis for the social intelligence construct reveals the students’ awareness for need of ethical values and principles in doing business [14,42,63,73,74]. Comparing the competence components mean values we see the importance attributed by students to attitude in business, and the equal importance for knowledge and skills. The descriptive statistics shows clearly that students are fully aware of the importance of developing business competences and that learning should switch its focus from knowledge transfer to developing necessary competences.

4.1. Logistic Regression for Explicit Knowledge

The first regression models Q24 as function of Q1, Q7, Q13. The Omnibus Chi-square test indicates a strong fit (Chi-square value 10.011), rejecting the null hypothesis (no effect of the independent variables), with significance p = 0.018. The Hosmer and Lemeshow Test (more important for the logistic regression type) is another measure of goodness of fit which should be interpreted conversely to the Omnibus Chi-square meaning it uses non-significance as a goodness of fit such that larger p values are preferred (p = 0.673 in our case). The accuracy of the classification of our model is given by the percentage of correctly classified items which is 81.8% in our case.
Table 5 depicts the individual predictors and their individual role within the classification accuracy obtained. The regression coefficients (column B) can be interpreted as change in log odds or logits. Yet not all items contribute significantly to the regression model, only Q1 and Q7 are statistically significant (according to column sig), while Q13 has a non-statistically significant contribution, which might indicate the new generation is very much keen on online resources.
Also, for this regression we depict in Table 6 the marginal impact on probabilities of an outcome of 1. The first line provides the SPSS descriptors of the logit regression model presented in Table 6. On the second row, the same descriptors are provided, but for the set of marginal probabilities obtained by setting Q1 constant, at its average value. The following two rows do the same when setting constant at their corresponding mean values Q7, respectively Q13.
The same analyses were performed for the logistic regressions Tacit Knowledge, Learning to Learn, Problem Solving, Motivation, and Social Intelligence.

4.2. Logistic Regression for Tacit Knowledge

The second regression models Q23 as function of Q4, Q10, and Q16. The Omnibus Chi-square test indicates a strong fit (Chi-square value 4.629), rejecting the null hypothesis (no effect of the independent variables), with significance p = 0.2. The Hosmer and Lemeshow Test provides a good value p = 0.589. The accuracy of the classification of our model is given by the percentage of correctly classified items which is 87.2%.
Table 7 depicts the predictors and their role within the classification accuracy obtained. The regression coefficients are depicted in column B, yet (according to column sig) not all of them contribute significantly to the regression model: only Q10 is statistically significant whereas Q4 and Q16 have no statistically significant contribution.
When a regression model is statistically significant overall, but some of the explanatory variables do not have statistically significance coefficients, then, multicolinearity might be the cause. Consequently, we have computed the bivariate-Pearson correlation coefficients between each pair in {Q4, Q10, Q16}, yet all results indicate low correlation (values close to 0: 0.13, 0.27. 0.235), hence we have reasons to exclude multicollinearity (Table 8).

4.3. Logistic regression for Learning to Learn (under Skill Component)

The third regression models Q22 as function of Q2, Q8, and Q14. The present regression is a paradox since the Omnibus Chi-square test indicates a good fit (Chi-square value 1.766), with significance p = 0.6. The Hosmer and Lemeshow indicates relative goodness of fit with p = 0.431. The accuracy of the classification of our model is given by the percentage of correctly classified items which is 87.29%.
Table 9 depicts the predictors and their role within the classification accuracy obtained. The regression coefficients are depicted in column B, yet (according to column sig) not all of them contribute significantly to the regression model: none of the questions are statistically significant. We can derive the conclusion that students understanding of learning to learn is distinct from the one envisioned by the authors of the questionnaire. Moreover, learning to learn under-ranks motivation when it comes to skills since learning will not occur unless motivation exists. This may relate to actually internalizing the acquired knowledge and being aware of it. In the last part of the present chapter, we will show that the continuous inlay of knowledge positively contributes to improved attitudes towards learning.

4.4. Logistic Regression for Motivation (under Attitude)

The fifth regression models Q20 (Motivation is my driving force for learning) as function of Q3, Q9, Q11. The Omnibus Chi-square test does not indicate a good fit (Chi-square value 0.172) the result being insignificant. Yet, the Hosmer and Lemeshow Test shows good fit with a p = 0.619. The accuracy of classification of the model is 91.0%.
Table 10 gives indications on the fact that efficient learning is based on good motivation (without actually specifying what kind of motivation the person needs, either inner or external). However, the following questions bring to light that the inner motivation contributes to the students’ positive perception on learning. In econometric terms, Table 10 is representing the regression coefficients which are depicted in column B, yet (according to column sig) not all of them contribute significantly to the regression model: only Q3 and Q9 are statistically significant, whereas Q15 has no statistically significant contribution at all.

4.5. Logistic Regression for Social Intelligence (under Attitude)

The sixth regression models Q19 (Q 19 I like interacting with people and talking to them.) as function of Q6, Q12, Q18. The Omnibus Chi-square test indicates a good fit (Chi-square value 10.730), rejecting the null hypothesis (no effect of the independent variables), with significance p = 0.064. The Hosmer and Lemeshow Test does not show a good fit of the model, p = 0.017. Within this analysis the accuracy of the classification is 94.6%.
Table 11 gives indications on the fact that students’ perception is that social intelligence does not go well with business, team spirit should not necessarily be present when it comes to attitudes, effective management, and knowledge sharing, nor is doing business based on ethical values and principals.

4.6. Validation of Results

Pursuing to study the relationship between the three main second-layer components, we constructed four (binary) random variables corresponding to Attitude (denoted A): unconditioned, and respectively conditioned by events {Skills=1} denoted as {S=1}, {Knowledge=1}, denoted as {K=1} and {S=1, K=1}. The expected values are depicted in Table 12. By S=1 we gathered respondents who answered yes to both binary questions regarding skills, the same applies for the event K=1.
The interpretation of the results is encouraging: as the students progressively embed the perception over skills and/or knowledge, their perception towards attitude with regards to learning increases as well. In order to test the statistically significance of the results in Table 12, we have used hypothesis testing with H0:µ = 0.8634, HA: µ> 0.8634, where the reference is the expected value of the unconditioned variable A. Firstly, we conditioned by {S=1} and computed the test statistic value zobs = 6.08 which gives a probability of 5.9E-10 which is very low as compared to a significance level of 0.01. Secondly, by conditioning by {K=1} we got zobs = 6.01 and a probability 9.2E-10. Finally, the combined conditioning {S=1, K=1} rendered zobs = 10.88 with practically zero probability. Summing up, all the results in Table 10 are proven to be statistically significant.
The final conclusion is that in terms of comparing the E(A|S=1, K=1) 0.9177 with the PVA 0.9 we can see that the perceptions of the students exceed the ones of the student when them add every brick of learning into their learning pattern which is a quite significant result. The consistency index being so small, validates the result of the expected value analysis demonstrating consistent patterns in the mind of the business experts.

5. Conclusions

The turbulence of the business environment generates many changes in the jobs spectrum, a phenomenon that creates many questions for both academics and students concerning the curriculum content for business administration university programs. The aim of the whole business education is to prepare the actual students for the future jobs and professional achievements. When the dynamics of the business environment leads to the disappearance of many of today’s jobs and to the creation many new ones, it is the time to question the business education paradigm and to search for a new one capable to offer an answer to this complex situation.
The present study starts from the idea that competences integrate knowledge, skills, and attitudes, which contribute to a better and sustainable business education than the classical learning environment based on knowledge transfer from professors to students. In this new context, students become more active and develop some generic skills that increase their employability opportunities.
Moreover, dealing with Millennials and Generation Z students, we should be aware of their different way of thinking as a result of digitalization and a different kind of motivation, and to re-design their curriculum in a new vision. In the same time, we should know the level of their awareness about the need of changing the business education paradigm change and their willingness to put more effort in their education. In line with these considerations we designed a questionnaire to evaluate the students’ awareness of the need of changing the teaching-learning paradigm and analyzed statistically their answers by using SPSS options. From the descriptive statistics we may conclude that students understand the need for developing some fundamental skills like learning to learn and problem solving, and that of developing a strong motivation for learning and work based on a solid value system.
The findings of the six logistic regressions can be summarized as follows: each of the three competence/components (knowledge, skills, and attitude) proved to be quantitatively described by statistical models, yet in different degrees. Knowledge can be seen as equally constructed by both sub-categories explicit (with educational means professors and books/journals) and tacit (with the mean vector part-time jobs) knowledge. Skills are defined mainly by problem-solving with main vectors being professors and creativity (in business problems have always several solutions). For Attitude, the main component is motivation.
In order to study the relationship between the three main second-layer components, we constructed four (binary) random variables corresponding to Attitude (denoted A): unconditioned, and respectively conditioned by events {Skills=1} denoted as {S=1}, {Knowledge=1}, denoted as {K=1} and {S=1, K=1}. By S=1 we gathered respondents who answered yes to both binary questions regarding skills, the same applies for the event K=1. The interpretation of the results is encouraging: as the students progressively embed the perception over skills and/or knowledge, their perception towards attitude with regards to learning increases as well.

6. Implications, Limitations, and Future Directions of Research

The main implications this paper invites is that the teaching-learning system should be reshaped as to adapt to both the needs coming from the labor market as well as to be tailored to the needs of the students. This calls for a change in the curriculum as well as a change in the teaching and learning methods. Since business education models display a certain degree of standardization as a result of accreditation agencies, the present research focused on business students from two important universities in Romania. We did not engage in the present research managers from different companies to know their vision concerning the paradigm change in designing the new learning environments. Although the present research focused on the students’ awareness of the need of change our learning process, the experience of managers can be an important contribution in the overall philosophy of the competence-based learning environment. We considered only a tangential approach to the AHP model, but it can be used in a complex analysis of the students and managers awareness of the most efficient design of the learning environment. As future lines of research, we invite colleagues to try and measure attitudes of the students based on a longitudinal study the shift from one type of learning to another by means of Markov Chains, on a longer period of time.

Author Contributions

Conceptualization, C.B.; literature review, C.B. and R.B.; questionnaires design, C.B. and S.H.; data collection and validation, all authors; methodology and data processing, S.H.; interpretation and discussions, C.B. and S.H.; writing the paper, C.B. and S.H. All authors have read and agreed to the published version of the manuscript.

Funding

This research received no external funding.

Acknowledgments

S.H. acknowledges the support provided by The Bucharest University of Economic Studies (ASE) Dezvoltarea abilitaţilor antreprenoriale pentru doctoranzi si postdoctoranzi în domeniul stiinţelor economice” POCU/380/6/13/125015. Moreover, all the authors would like to acknowledge the contributions of the four reviewers who actually helped improve our paper in general, and more significantly in matters of the quantitative part.

Conflicts of Interest

The authors declare no conflict of interest.

References

  1. Mintzberg, H. The Rise and Fall of Strategic Planning; Pearson Education Limited: London, UK, 2000. [Google Scholar]
  2. Mintzberg, H.; Ahlstrand, B.; Lampel, J. Strategy Safari: The Complete Guide through the Wilds of Strategic Management; Pearson Education Limited: London, UK, 1998. [Google Scholar]
  3. Stacey, R.D.; Griffin, D.; Shaw, P. Complexity and Management: Fad or Radical Challenge to Systems Thinking? Routledge: London, UK, 2000. [Google Scholar]
  4. Bolisani, E.; Bratianu, C. Emergent Knowledge Strategies: Strategic Thinking in Knowledge Management; Springer International Publishing: Cham, Switzerland, 2018. [Google Scholar]
  5. Spender, J.-C. Business Strategy: Managing Uncertainty, Opportunity, & Enterprise; Oxford University Press: Oxford, UK, 2014. [Google Scholar]
  6. OECD. The Definition and Selection of Key Competences: Executive Summary; Directorate for Education and Skills: Paris, France, 2005. [Google Scholar]
  7. OECD. The Future of Education and Skills: Education 2030; Directorate for Education and Skills: Paris, France, 2018. [Google Scholar]
  8. Lozano, R.; Merrill, M.; Sammalisto, K.; Ceulemans, K.; Lozano, F.J. Connecting competences and pedagogical approaches for sustainable development in higher education: A literature review and framework proposal. Sustainability 2017, 9, 1889. [Google Scholar] [CrossRef] [Green Version]
  9. Bratianu, C.; Vasilache, S. A factorial analysis of the managerial linear thinking model. Int. J. Innov. Learn. 2010, 8, 393–407. [Google Scholar] [CrossRef]
  10. Bereiter, C. Education and Mind in the Knowledge Age; Routledge: New York, NY, USA, 2009. [Google Scholar]
  11. Berry, P. Redesign of the undergraduate business curriculum: The way forward, a paradigmatic shift. Am. J. Bus. Educ. 2009, 2, 55–63. [Google Scholar] [CrossRef]
  12. Cegarra-Navarro, J.G.; Wensley, A.; Garcia-Perez, A. Overcoming knowledge workers tunnel vision through intentional unlearning. In Proceedings of the 14th International Forum on Knowledge Asset Dynamics, Matera, Italy, 5–7 June 2019; Schiuma, G., Demartini, P., Yan, M.R., Eds.; Institute of Knowledge Asset Management: Matera, Italy, 2019; pp. 236–247. [Google Scholar]
  13. Mintzberg, H. Managers Not MBAs: A Hard Look at the Soft Practice of Managing and Management Development; Pearson Education: Harlow, UK, 2004. [Google Scholar]
  14. Kahneman, D. Thinking, Fast and Slow; Farrar, Straus and Giroux: New York, NY, USA, 2011. [Google Scholar]
  15. Taleb, N.N. Antifragile: How to Live in a World We Don’t Understand; Penguin Books: New York, NY, USA, 2012. [Google Scholar]
  16. Martin, R. The Design of Business: Why Design Thinking is the Next Competitive Advantage; Harvard Business Press: Boston, MA, USA, 2009. [Google Scholar]
  17. Tsang, H.W.C.; Tsui, E. Conceptual design and empirical study of a personal learning environment and network (PLE&N) to support peer-based social and lifelong learning. VINE J. Inf. Knowl. Manag. Syst. 2017, 47, 228–249. [Google Scholar] [CrossRef]
  18. Tsui, E.; Dragicevic, N. Using the scenario development and personal learning environment and network to support curriculum design. Manag. Mark. Chall. Knowl. Soc. 2018, 13, 848–858. [Google Scholar] [CrossRef] [Green Version]
  19. Bajada, C.; Trayler, R. Introduction to threshold concepts in business education. Educ. Train. 2016, 58, 458–462. [Google Scholar] [CrossRef]
  20. Bratianu, C.; Pinzaru, F. University governance as a strategic drivng force. In Proceedings of the 11th European Conference on Management, Leadership and Governance, Military Academy Lisbon, Lisbon, Portugal, 12–13 November 2015; Dias Ronco, J.C., Ed.; Academic Conferences and Publishing International: Reading, UK, 2015; pp. 28–35. [Google Scholar]
  21. Wallis, S.E.; Valentinov, V. The imperviance of conceptual systems: Cognitive and moral aspects. Kybernetes 2016, 45, 1437–1451. [Google Scholar] [CrossRef]
  22. Kolb, D.A. Experiential Learning: Experience as the Source of Learning and Development, 2nd ed.; Pearson Education: Upper Saddle River, NJ, USA, 2015. [Google Scholar]
  23. Damasio, A. Self Comes to Mind: Constructing the Conscious Brain; Vintage Books: New York, NY, USA, 2012. [Google Scholar]
  24. Bratianu, C.; Orzea, I. Emotional knowledge: The hidden part of the knowledge iceberg. In Proceedings of the 14th European Conference on Knowledge Management, Kaunas University of Technology, Kaunas, Lithuania, 5–6 September 2013; Janiunaite, B., Pundziene, A., Petraite, M., Eds.; Academic Conferences and Publishing International: Reading, UK, 2013; pp. 82–90. [Google Scholar]
  25. Winkielman, P.; Kavanagh, L.C. The Embodied Perspective on Cognition-Emotion Interactions. In Handbook of Cognition and Emotion; Robinson, M.D., Watkins, E.R., Harmon-Jones, E., Eds.; The Guilford Press: New York, NY, USA, 2013; pp. 213–230. [Google Scholar]
  26. Fauconnier, G.; Turner, M. The Way We Think: Conceptual Blending and the Mind’s Hidden Complexities; Basic Books: New York, NY, USA, 2003. [Google Scholar]
  27. Eizaguirre, A.; Garcia-Feijoo, M.; Laka, J.P. Defining sustainability core competences in business and management studies based on multinational stakeholders’ perceptions. Sustainability 2019, 11, 2303. [Google Scholar] [CrossRef] [Green Version]
  28. Drucker, P.F. Management: Tasks, Responsibilities, Practices; Harper Business: New York, NY, USA, 1993. [Google Scholar]
  29. Branson, R. Screw Business as Usual; Virgin Books: London, UK, 2011. [Google Scholar]
  30. Laamanen, T.; Lamberg, J.A.; Vaara, E. Explanations of success and failure in management learning: What can we learn from Nokia’s rise and fall? Acad. Manag. Learn. Educ. 2016, 15, 2–25. [Google Scholar] [CrossRef]
  31. Almquist, E.; Senior, J.; Bloch, N. The elements of value: Measuring—And delivering—What consumers really want. Harv. Bus. Rev. 2016, 2016, 46–53. [Google Scholar]
  32. Christensen, C.; Raynor, M.; McDonald, R. What is disruptive innovation? Harv. Bus. Rev. 2015, 2015, 45–53. [Google Scholar]
  33. Yip, G.S.; Hult, T.M. Total Global Strategy, 3rd ed.; Pearson Education: Upper Saddle River, NJ, USA, 2012. [Google Scholar]
  34. Bratianu, C. The crazy new world of the sharing economy. In Knowledge Management in the Sharing Economy: A Cross-Sectoral Insight into the Future of Competitive Advantage; Vătămănescu, E.M., Pînzaru, F.M., Eds.; Springer International Publishing: Cham, Switzerland, 2018; pp. 3–19. [Google Scholar] [CrossRef]
  35. Kaufmann, E.; Peral, J.; Gil, D.; Fernandez, A.; Sellers, R.; Mora, H. Managing marketing decision-making with sentiment analysis: An evaluation of the main product features using text data mining. Sustainability 2019, 11, 4235. [Google Scholar] [CrossRef] [Green Version]
  36. Mrowczynska, M.; Sztubecka, M.; Skiba, M.; Bazan-Krzywoszanska, A.; Bejga, P. The use of artificial intelligence as a tool supporting sustainable development local policy. Sustainability 2019, 11, 4199. [Google Scholar] [CrossRef] [Green Version]
  37. Austin, J.E.; Seitanidi, M.M. Collaborative value creation: A review of partnering between nonprofits and businesses. Part 2: Partnership processes and outcomes. Nonprofit Volunt. Sect. Q. 2012, 41, 929–968. [Google Scholar] [CrossRef]
  38. Mitroff, I.; Denton, E.A. A study of spirituality in the workplace. Sloan Manag. Rev. 1999, 40, 83–92. [Google Scholar]
  39. Porter, M.E.; Kramer, M.R. Creating Shared Values: How to Reinvent Capitalism—And Unleash Wave of Innovation and Growth. Harv. Bus. Rev. 2011, 89, 63–77. [Google Scholar]
  40. Basu, K.; Palazzo, G. Corporate social responsibility: A process model of sensemaking. Acad. Manag. Rev. 2008, 33, 122–136. [Google Scholar] [CrossRef] [Green Version]
  41. Lev, B. Where have all of Enron’s intangibles gone? J. Account. Public Policy 2002, 21, 131–135. [Google Scholar] [CrossRef]
  42. Lange, D.; Washburn, N.T. Understanding attributions of corporate social irresponsibility. Acad. Manag. Rev. 2012, 37, 300–326. [Google Scholar] [CrossRef]
  43. Brewer, P.D.; Brewer, K.L. Knowledge management, human resources management, and higher education: A theoretical model. J. Educ. Bus. 2010, 85, 330–335. [Google Scholar] [CrossRef]
  44. Hergert, M. Student perceptions of the value of internship in business education. Am. J. Bus. Educ. 2009, 2, 9–13. [Google Scholar] [CrossRef]
  45. Darling-Hammond, L.; Flook, L.; Cook-Harvey, C.; Barron, B.; Osher, D. Implications for educational practice of the science of learning and development. Appl. Dev. Sci. 2019, 1, 1–44. [Google Scholar]
  46. Bratianu, C.; Vătămănescu, E.M. Students’ perception on developing conceptual generic skills for business. VINE J. Inf. Knowl. Manag. Syst. 2017, 47, 490–505. [Google Scholar] [CrossRef]
  47. Singh, H.; Gera, M. Generic skills for sustainable development. Indian J. Res. 2015, 4, 290–291. [Google Scholar] [CrossRef]
  48. Hager, P.; Gonczi, A. What is competence? Med Teach. Int. J. Educ. Health Sci. 1996, 18, 15–18. [Google Scholar] [CrossRef]
  49. Le Deist, F.D.; Winterton, J. What is Competence? Hum. Resour. Dev. Int. 2005, 8, 27–46. [Google Scholar] [CrossRef]
  50. Sandberg, J. Competence—The basis for a smart workforce. In Training for a Smart Workforce; Gerber, R., Lankshear, C., Eds.; Routledge: London, UK, 2000; pp. 47–72. [Google Scholar]
  51. Nonaka, I.; Takeuchi, H. The Knowledge-Creating Company: How Japanese Companies Create the Dynamics of Innovation; Oxford University Press: Oxford, UK, 1995. [Google Scholar]
  52. Davenport, T.H.; Prusak, L. Working Knowledge: How Organizations Manage What They Know; Harvard Business School Press: Brighton, MA, USA, 2000. [Google Scholar]
  53. Bratianu, C.; Bejinaru, R. The theory of knowledge fields: A thermodynamic approach. Systems 2019, 7, 20. [Google Scholar] [CrossRef] [Green Version]
  54. Polanyi, M. The Tacit Dimension; Peter Smith: Gloucester, MA, USA, 1983. [Google Scholar]
  55. North, K.; Gueldenberg, S.E. Effective Knowledge Work: Answers to the Management Challenges of the 21st Century; Emerald Group Publishing Limited: Bingley, UK, 2011. [Google Scholar]
  56. Baron, J. Thinking and Deciding, 3rd ed.; Cambridge University Press: Cambridge, UK, 2000. [Google Scholar]
  57. Curtin, P. Employability skills for the future. In Generic Skills in Vocational Education and Training: Research Readings; Gibb, J., Ed.; National Center for Vocational Education Research: Adelaide, Australia, 2004; pp. 38–68. [Google Scholar]
  58. Dawe, S. Focusing on Generic Skills in Training Packages; National Center for Vocational Education Research: Leabrook, Australia, 2002. [Google Scholar]
  59. Landry, S.H.; Smith, K.E.; Swank, P.R. Responsive parenting: Establishing early foundations for social, communication, and independent problem-solving. Dev. Psychol. 2006, 42, 627–642. [Google Scholar] [CrossRef] [Green Version]
  60. Duckworth, A. GRIT: Why Passion and Resilience Are the Secrets to Success; Vermilion: London, UK, 2017. [Google Scholar]
  61. Grove, A.S. Only the Paranoid Survive: How to Exploit the Crisis Points that Challenge Every Company; Crown Business: New York, NY, USA, 1999. [Google Scholar]
  62. Schein, E. Organizational Culture and Leadership, 3rd ed.; Jossey-Bass: San Francisco, CA, USA, 2004. [Google Scholar]
  63. Goleman, D. Working with Emotional Intelligence; Bloomsbury: London, UK, 1998. [Google Scholar]
  64. McGuire, S.Y.; McGuire, S. Teach Students How to Learn: Strategies You Can Incorporate into Any Course to Improve Student Metacognition, Study Skills, and Motivation; Stylus: Sterling, VA, USA, 2015. [Google Scholar]
  65. Senge, P. The Fifth Discipline: The Art & Practice of the Learning Organization; Random House: London, UK, 1999. [Google Scholar]
  66. Jackson, M.C. Critical Systems Thinking and the Management of Complexity; John Wiley & Sons: Hoboken, NJ, USA, 2019. [Google Scholar]
  67. Hadad, S. Analyzing Corporate Social Entrepreneurship Specific to Knowledge Economy with a Focus on the Romanian Economic Context. Manag. Dyn. Knowl. Econ. 2018, 6, 247–264. [Google Scholar] [CrossRef]
  68. Popa, A.; Hadad, S.; Paiusan, R.; Nastase, M. A new method for agricultural market share assessment. Sustainability 2019, 11, 88. [Google Scholar] [CrossRef] [Green Version]
  69. Tabachnick, B.G.; Fidell, L.S.; Ullman, J.B. Using Multivariate Statistics; Pearson: Boston, MA, USA, 2007. [Google Scholar]
  70. Vizitiu, C.; Agapie, A.; Paiusan, R.; Hadad, S.; Nastase, M. Adapting a corporate entrepreneurship assessment instrument for Romania. S. Afr. J. Bus. Manag. 2018, 49, 1–7. [Google Scholar] [CrossRef] [Green Version]
  71. Saaty, T.L. Decision making with the analytic hierarchy process. Int. J. Serv. Sci. 2008, 1, 83–98. [Google Scholar] [CrossRef] [Green Version]
  72. Bratianu, C. Intellectual capital research and practice: 7 myths and one golden rule. Manag. Mark. Chall. Knowl. Soc. 2018, 13, 859–879. [Google Scholar] [CrossRef]
  73. Maxwell, N. From Knowledge to Wisdom: A Revolution for Science and the Humanities; Pentire Press: London, UK, 2007. [Google Scholar]
  74. Zohar, D.; Marshall, I. Spiritual Capital, Wealth We Can Live by; Berrett-Koehler Publishers, Inc.: San Francisco, CA, USA, 2004. [Google Scholar]
Figure 1. Simple hierarchy model.
Sustainability 12 01348 g001
Table 1. Analytic hierarchy process—Conceptual model.
Competence/ComponentsConstructsIndicatorsReferences
KnowledgeExplicit knowledge (formative construct)
Q24. I accumulate knowledge best when things are explained to me
Q1. I learn mostly from my professorsNonaka and Takeuchi 1995 [51];
Davenport and Prusak, 2000 [52]; North and Gueldenberg, 2011 [55]
Q7. I learn mostly from books and published papers in journals
Q13. I learn mostly from online sources
Tacit Knowledge (formative construct)
Q23. I accumulate knowledge best when I do things myself
Q4. I learn mostly from working on projectsNonaka and Takeuchi 1995 [51];
Polanyi, 1966 [54];
Kolb, 2015 [22]
Q10. I learn mostly from part-time and summer jobs
Q16. I learn mostly from entrepreneurial activities
SkillsLearning to learn
(formative construct)
Q22. Learning is a skill we can develop
Q2. Learning to learn is more important than accumulating informationSenge, 1999 [65];
McGuire and McGuire, 2015 [64];
OECD, 2005 [6];
OECD, 2018 [7].
Q8. Learning to learn means to develop our way of thinking
Q14. In business, we need to learn the whole life
Problem solving
(formative construct)
Q21. Whenever I see a problem, I try solving it instead of avoiding it
Q5. Professors teach us how to solve problems in businessOECD, 2005 [6];
OECD, 2018 [7];
Baron, 2000 [56].
Landry, Smith, and Swank, 2006 [59].
Q11. Professors teach us how to formulate correctly business problems
Q17. In business, problems have always several solutions
AttitudeMotivation
(formative construct)
Q20. Motivation is my driving force for learning
Q3. Efficient learning is based on a good motivationDuckworth, 2017 [60];
Grove, 1999 [61];
Schein, 2004 [62].
Q9. Motivation is a powerful inner force in business
Q15. Motivation helps us in dealing with difficult situations
Social intelligence
(formative construct)
Q 19 I like interacting with people and talking to them.
Q6. Emotional intelligence is essential in doing businessKahneman, 2011 [14];
Goleman, 1998 [63];
Schein, 2004 [62].
Q12. Effective management is based on team spirit and knowledge sharing
Q18. Doing business should be based on ethical values and principles
Table 2. The fundamental scale of absolute numbers.
Intensity of ImportanceDefinition Explanation
1Equal importanceTwo activities contribute equally to the objective
2Weak or Slight Experience and judgement slightly favor one activity over another
3Moderate importance
4Moderate plusExperience and judgement strongly favor one activity over another
5Strong importance
6Strong plusAn activity is favored very strongly over another; its dominance demonstrated in practice
7Very strong or demonstrated importance
8Very, very strongThe evidence favoring one activity over another is of the highest possible order of affirmation
9Extreme importance
Reciprocals of aboveIf activity I has one of the above non-zero numbers assigned to it when compared with activity j, then j has the reciprocal value when compared with iA reasonable assumption
Source: [71] (p. 86).
Table 3. The AHP matrix.
A1A2A3An
A11i1/i2i1/i3i1/in
A2i2/i11i2/i3i2/in
A3i3/i1i3/i21i3/in
.....
.....
.....
Anin/i1in/i2in/i31
Table 4. Mean values for the competence components, constructs, and indicators.
Competence ComponentsMeanConstructsMean
(Control Variables)
IndicatorsMean
Knowledge3.385Explicit Knowledge3.38 (0.82)Q013.32
Q073.03
Q133.80
Tacit Knowledge3.39 (0.87)Q043.35
Q103.21
Q163.61
Skills3.895Learning to Learn4.26 (0.96)Q023.84
Q084.36
Q144.58
Problem Solving3.53 (0.89)Q053.09
Q113.31
Q174.20
Attitude4.135Motivation4.42 (0.91)Q034.36
Q094.56
Q154.34
Social Intelligence3.85 (0.95)Q064.06
Q123.31
Q184.19
Table 5. Variables in the Equation Q24.
BS.E.WalddfSig.Exp(B)
Q1.0.2410.1432.83510.0921.272
Q7.0.2820.1235.28610.0211.326
Q13.−0.1110.1370.65610.4180.895
Constant0.3300.7640.18710.6651.391
Table 6. Marginal impact on probabilities.
NMinimumMaximumMeanStd. Deviation
Predicted probabilities3680.573800.938420.81793480.06451149
Predicted probabilities with constant Q13680.679850.926210.81793480.05461217
Predicted probabilities with constant Q73680.608310.906050.81793480.05386919
Predicted probabilities with constant Q133680.604900.925230.81793480.06211410
Table 7. Variables in the Equation Q23.
BS.E.WalddfSig.Exp(B)
Q4.−0.0690.1550.19810.6560.933
Q10.0.2740.1294.49110.0341.315
Q16.−0.0300.1600.03510.8510.970
Constant1.4260.7313.80610.0514.163
Table 8. Colinearity test between explanatory variables.
Q4. I Learn Mostly from Working on ProjectsQ10. I Learn Mostly from Part-Time and Summer JobsQ16. I Learn Mostly from Entrepreneurial Activities
Q4. I learn mostly from working on projectsPearson Correlation10.130 *0.176 **
Sig. (2-tailed) 0.0130.001
N368368368
Q10. I learn mostly from part-time and summer jobsPearson Correlation0.130 *10.235 **
Sig. (2-tailed)0.013 0.000
N368368368
Q16. I learn mostly from entrepreneurial activitiesPearson Correlation0.176 **0.235 **1
Sig. (2-tailed)0.0010.000
N368368368
*. Correlation is significant at the 0.05 level (2-tailed). **. Correlation is significant at the 0.01 level (2-tailed).
Table 9. Variables in the Equation for Q22.
BS.E.WalddfSig.Exp(B)
Q2.0.1400.2280.37910.5381.151
Q8.−0.1860.3710.25210.6160.830
Q14.0.3170.2621.46210.2271.372
Constant2.0291.8271.23410.2677.609
Table 10. Variables in the Equation—Motivation.
BS.E.WalddfSig.Exp(B)
Q3.0.4000.2053.79610.0511.492
Q9.0.4270.2283.49610.0621.532
Q15.−0.1110.2380.21910.6400.895
Constant−0.7351.1230.42810.5130.480
Table 11. Variables in the Equation—Social Intelligence.
BS.E.WalddfSig.Exp(B)
Q6.−0.0670.2420.07610.7830.936
Q12.0.0850.2900.08610.7701.089
Q18.0.0460.2620.03110.8591.047
Constant2.5841.5062.94510.08613.256
Table 12. Expected values in terms of students’ attitudes.
Expectation–Label Value
E(A)0.8634
E(A|S=1)0.8955
E(A|K=1)0.8980
E(A|S=1, K=1)0.9177

