Abstract
Complex pedestrian or passenger crowd movements, such as intersecting movements, can create a bottleneck resulting in delays during emergency escape from public infrastructure such as major public transport hubs. Limited studies have examined the effect of different intersecting angles and walking speeds on pedestrian outflow. This study aims to systematically investigate the effect of different intersecting angles (30°, 90°, and 150°) and walking speeds (normal walking, faster walking) on pedestrian outflow at an intersecting path or junction through controlled laboratory experiments. Further, we consider both blocked vision and un-blocked vision in our experiments. The results from our experiments show that the acute angle of 30° has a higher flow rate and less evacuation time as compared to the other angles. The obtuse intersecting angle of 150° was the most undesirable intersecting angle in terms of outflow, evacuation time, and delays at the junction. Faster walking generally led to reduced evacuation time as compared to normal walking. It is also interesting to note that the results from both blocked vision and un-blocked vision were not statistically significant, suggesting that line of sight was not an important factor in regulating the flow at the junction. The results from our findings are a valuable resource to verify the mathematical model intended to simulate pedestrian or passenger crowd movements and behavior within major public infrastructure under both normal and evacuation conditions.
1. Introduction
Pedestrian or passenger crowd behavior and safety have been an important research topic over the years [1,2,3,4]. The increase in population and mobility have led to increased public activities at public places such as transport terminals and public buildings. Hence, the efficiency and safety of pedestrian crowd movements in public places are of utmost concern. Additionally, satisfying the mobility needs of pedestrians can have outcomes beneficial to the environment and reduce the demand for motorized transportation. As a result, it can contribute to sustainable transportation and improving the quality of life in the long run [5,6]. A quick scan of documented crowd disasters in both developed and developing countries shows that over 3500 people have been killed and more than 4000 people have been injured in crowd related disasters over the last decade [7]. Most of the incidents stem from the inherent complexity in the movement of pedestrians, e.g., merging, turning, and crossing movements [1,8,9,10,11].
As of now, most of the existing simulation models for crowd dynamics have been developed under specific hypotheses, and therefore these models require real-world validations [12,13]. To this end, many researchers from multiple fields have carried out experiments and collected empirical data on pedestrian behavior. Such experiments have the advantage of flexibility in controlling the influencing variables and, therefore, researchers have been able to set up appropriate experiments and collect specific data [8,9,10,11,14,15,16].
Complex pedestrian crowd movement is usually categorized into three groups; uni-directional flows, multi-directional flows (e.g., merging, crossing), and bottlenecks [1]. Such flows have been studied from two viewpoints, namely empirical studies and modelling using mathematical simulation [1,17].
In the cognitive and neuroscience domain, the adaptation of the human body in different geometry has received considerable interests. Particularly, the transition of human movement from a straight path to another angled path is of special interest as it involves cognitive-to-motor transformations [18]. During abrupt changes from a straight trajectory to another angled trajectory, a pedestrian’s central nervous system (CNS) needs to change the symmetry of his or her locomotor system as it is adapted to straight-ahead walking. Therefore, it leads to a trade-off between ‘automatic’ forward progression and voluntary rotation of the body [18]. That trade-off process may result in a decrease in the speed of the individual, thereby creating additional delays, which could be critical during the evacuation process. Hence, it is important to understand the impact of different angled walking paths to pedestrian flow under congested and evacuation conditions.
A thorough understanding of human movements in complex architectural layouts is critical to enhance the efficiency of the evacuation process [19]. Therefore, complex multi-directional crowd movements, such as merging and crossing, have received considerable attention in the recent past. Particularly, a wide range of theoretical and experimental studies on merging behavior at T-sections can be found in the literature [8,20,21,22,23,24,25,26,27]. However, crossing movements have limited empirical data, especially on the effect of intersecting angle and walking speed on pedestrian outflow. Intersecting movements have created bottlenecks and substantial delays during the evacuation process, as observed in the past documented crowd disasters [15]. Therefore, this study aims to examine the impact of intersecting angle on pedestrian crowd flow via controlled laboratory experiments.
The paper is structured as follows. The next section discusses the relevant literature on complex crowd behavior that includes merging and intersecting pedestrian crowd flow. It is then followed by a description of controlled laboratory experimental setups to study the effect of intersecting angle on pedestrian outflow. Analysis of detailed results from the experiments is presented next. The final section presents the conclusions.
2. Literature Review
Complex pedestrian crowd behavior, such as merging, turning, and intersecting, have been a topic of considerable interests among researchers in the past. Tajima and Nagatani [20] simulated the merging of pedestrians in a T-shaped channel using a lattice-gas model of random biased walkers. They concluded that upon increasing the flow in the main branch, clogging transitions happen at either main flow or branch flow or both, while the branch flow remains constant. This simulation study, however, only examined 90° merging angle and was not calibrated and validated with empirical data.
Later, in a study by Helbing et al. [15], experiments at corridors, bottleneck areas, and intersections were carried out to test simulation models of pedestrian flows. The empirical results concluded that the geometric boundary conditions not only had an effect on the capacity of the elements of facilities, but also influenced the time gap distribution of pedestrians. The study also found the existence of self-organization phenomena, which could facilitate the movements of pedestrians in the pedestrian facilities.
Research by Shimizu et al. [27] analyzed the direction of confluence in pedestrian flows. This study focused on two directions for crowd convergence in T-shaped junctions, namely same and opposite directions. To examine these scenarios, pedestrian crowd behavior was modelled using a hybrid system approach. However, the model’s prediction was not tested with empirical data. Furthermore, the merging angle was limited to only 90°. This scenario did not fully capture the pedestrian outflow at other angled pedestrian merging facilities as observed in major public infrastructure and transport hubs. A series of controlled experiments at a T-junction with 350 German students were carried out by Zhang et al. [22] to investigate the transitions in pedestrian fundamental diagrams. The results indicated that, among different pedestrian walking facilities, fundamental diagrams showed discrepancies and therefore could not be compared. For similar facilities with varying widths, however, the fundamental diagrams were found to agree well and were thus unifiable. The results of another study on unidirectional pedestrian flow at a corner also indicated that the fundamental diagram of turning flows at a corner and merging flows at a T-junction were not comparable to each other [28].
In another study by Zhang et al. [23], the spatial distribution of specific flow, velocity, and density in a T-shaped junction was investigated, and the fundamental diagrams of flow in both branches and the main stream were compared. However, the main shortcoming of the aforementioned study along with another study by Boltes et al. [29] was that they were limited only to perpendicular merging and did not consider the other merging angles. With regards to this knowledge gap, an experiment by Aghabayk et al. [25] studied the impact of walking speed and merging angles on pedestrian merging behavior. In this study, three merging angles of 60°, 90°, and 120°, and normal walking and light jogging speed were considered for experiments. Results indicated that, considering the flow rate and regardless of movement speed, perpendicular merging had the least flow rate compared to angular merging, and 60° and 120° performed very similarly at jogging speed. The results also revealed that turning and merging are two separate behaviors, and the findings concerning one cannot be attributed to the other.
In another study by Shiwakoti et al. [8], a series of experiments were conducted with different merging angles (60°, 90°, and 180°) and with different desired speeds (normal and slow running). The results from the experiments showed that pedestrians tended to reduce speeds within merging areas. Further, it was observed that, with a higher merging angle, there was greater reduction in speed in the merging area. The speed reduction had an effect on the pedestrian flow rate with a reduced pedestrian flow rate observed for higher merging angles.
A similar study by Shi et al. [26] conducted experiments to examine pedestrian merging behavior under different merging angles of 60°, 90°, and 180° under the conditions of slow running and blocked vision. It was observed that, depending on the merging angle, pedestrian flows fluctuate significantly. With the increase in merging angle, mean density at the merging section increased, while mean flow and mean velocity decreased. The study also recommended investigating the effect of blocked vision (presence of walls) conditions by comparing the experimental results without blocked vision conditions. In another study, it was observed that there were clear dependencies between the discharge rate and the physical layout of the merging, with certain designs clearly outperforming others [30].
Turning movements, as a form of unidirectional complex pedestrian movement, have been studied by Yanagisawa et al. [31]. This study included experiments on turning movement and human egress. It was found that, during turning by pedestrians, the speed and flow both decreased. Shiwakoti et al. [32] used empirical data from real-life video footage of a crowd stampede and from ants’ mass evacuation, along with a simulation model, to demonstrate the potential problems and consequences of turning movements. The simulation results showed that 90° angled corridors were inefficient in terms of outflow as compared to 45° and 60° angled corridors. Following this, Dias et al. [33] conducted controlled experiments with human subjects to obtain microscopic characteristics of walking pedestrians in angled corridors. The results showed that, upon increasing the turning angle, the speed reduction also increased. The turning movement, however, happened in three dimensions, which was not captured in previous studies. Considering this, Burghardt et al. [34] conducted experiments on turning stairways to obtain fundamental diagrams and compared their findings with a field study performed at the same staircase.
To examine the evacuation scenarios for turning and merging sections under emergency situations, experiments with ants have been conducted by researchers in the past [35,36]. These experiments examined the effect of different turning angles on exit corridors and discovered that such configurations affect the flow of non-human organisms in a negative way. The problem with such non-human organism based approaches is the transferability of mathematical predictions when scaled up to real situations concerning human crowds.
Studies on intersecting pedestrian flows have not been as extensive as bidirectional flows, especially with controlled laboratory experiments. Early studies focused on 90° intersections, which may not capture the effect of other intersecting angle on pedestrian outflow in pedestrian junctions. Experiments regarding 90° intersections have been carried out by several researchers [9,11,14,15,37,38,39]. In particular, studies by Versluis [39] and Wong et al. [11] empirically studied the impact of intersecting angles. Wong et al. [11] also introduced different flow ratios and developed a bidirectional pedestrian streams model and validated the model with empirical data. Their model was then later further improved by Xie et al. [40]. In their study, the Bayesian inference method was used to calibrate the model proposed by Wong et al. [11] using their experiment data along with data collected from a busy crosswalk. This study concluded that the speed of a stream not only decreases with an increase in density, but also decreases when the ratio of the flow in the channel relative to the total flow decreases. The least desirable and most disruptive intersecting angle was found to be approximately 135°. However, the study only considered experiments with participants at a normal walking speed. One of the important issues, which was not discussed in these studies, is the movement speed. In emergencies, pedestrians are expected to move faster, and pedestrian crowd behavior may change due to this faster movement. Therefore, comparative analysis on normal walking speed and faster walking speed deserve special attention. In addition, the effect of experimental setup in terms of blocked vision and un-blocked vision due to walls have not been examined for intersecting flows, although it has been shown to be important for merging scenarios [8,26]. The most recent study on intersecting pedestrian flow was an experiment carried out by Sun et al. [41]. The aim of their experiment was to examine the characteristics of oblique pedestrian streams. They performed experiments with 50 participants, three volume levels, and five intersecting angles. It was observed that the mean and median speed and exit traffic efficiency decreased initially and increased afterwards with the increase of intersecting angles for lower traffic volume as compared to higher traffic volume. However, the participants were comprised mainly of people in the same age group, and the effect of movement speed and blocked vision were not taken into account.
In summary, although intersecting flows of pedestrians may have an implication on the efficiency and safety of pedestrian crowds during the evacuation process or crowd management, limited data exists on the influence of intersecting angle and walking speed on pedestrian outflow at an intersecting junction. Therefore, the aim of this study is to systematically investigate the effect of different intersecting angles and walking speeds on pedestrian outflow at an intersecting path or junction through controlled laboratory experiments. Further, we examine the effect of both blocked vision and un-blocked vision in our experiments.
3. Experiment Setup
This section is divided by subheadings. It aims to provide a concise and precise description of the experimental results, their interpretation, as well as the experimental conclusions that can be drawn.
3.1. Sample
A total of 89 people comprised of 62 males and 27 females were selected to participate in the experiment. The participants were between 13 and 84 years of age, as shown in the age distribution chart in Figure 1, with the majority of them being undergraduate and postgraduate students. The experiment took place in November, 2016 at the campus of the University of Tehran in Iran. All the safety precautions were taken into consideration, and the experiments were conducted in accordance with the University’s ethical norms.
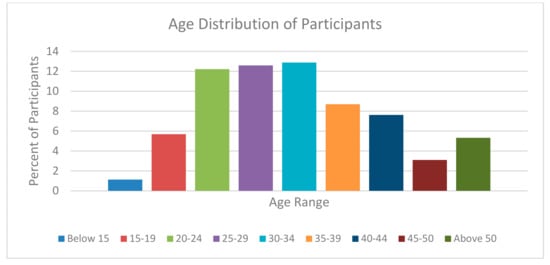
Figure 1.
Age distribution of participants.
3.2. Experimental Setup and Scenarios
The purpose of the experiment was to observe and determine the effect of different intersecting angles on pedestrian outflow in a pedestrian junction. In addition, we observed the effect of movement speed and blocked vision on the pedestrian outflow. Three different intersecting angles (α = 30°, 90°, and 150°) were considered for the experiments (Figure 2). Further, participants were first asked to walk with their normal walking speed for each intersecting angle setup. After that, participants were asked to walk faster (jogging or slow run) for each intersecting angle. It is to be noted that normal walking represents the scenario of a congested situation in day-to-day pedestrian activities or special events. Jogging (slow running) may be more representative when people are in a hurry (as observed in train stations) or in the evacuation process [8,42]. Due to ethical and safety reasons, experiments with running participants and pushing behavior (highly competitive behavior as observed in some crowd disasters) cannot be conducted in the controlled laboratory experiments.
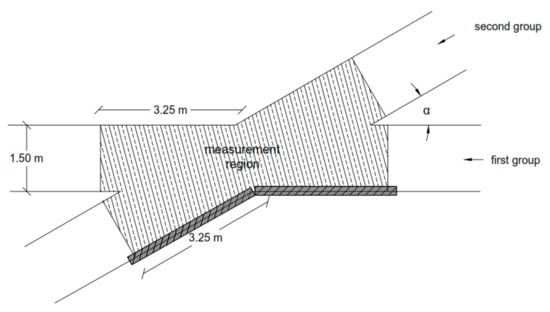
Figure 2.
Layout of the Junction.
Each set of experiment was repeated three times, making the number of our experiment runs and combinations a total of 36 (i.e., 3 for angle * 2 for movement speed * 2 for vision tests), although it is desirable to have a higher number of repetitions for statistical analysis; three to five repetitions have been suggested to be sufficient to conduct relevant analysis for laboratory walking experiments considering resource and cost constraints [8,9,37,43]. With the repetition of experiments, there is a chance that pedestrians may learn some strategies on how to quickly move at the intersection by learning from previous attempts. Therefore, the individuals in the two intersecting groups were randomly located for each trial to minimize the cumulative learning behavior of participants. Furthermore, we tested the effect of experimental layout in terms of blocked vision or un-blocked vision. In the case of un-blocked vision, the two intersecting streams of participants could see each other as they walked towards the junction point. In the case of blocked vision, corridors were created with wooden partition so that the two intersecting streams of participants could not see each other until they reached the junction point (Figure 2 and Figure 3). The un-blocked vision setup is relevant in case of open events where pedestrian crowds are controlled by temporary structures such as hand rails/barriers, and pedestrians are able to see each other. However, blocked vision created by fixed walls can be frequently observed at a pedestrian junction in buildings and train stations.
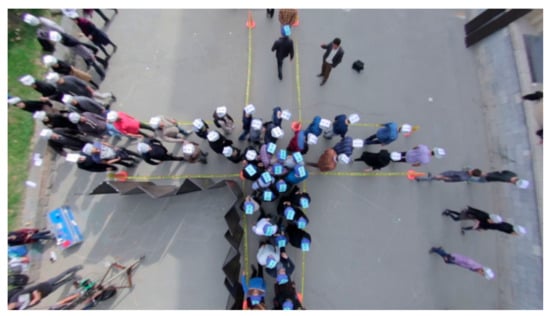
Figure 3.
Snapshot of 90° intersection with blocked vision.
A junction was created with traffic cones and tape. The corridor was created in a flexible way so that the junction angle could be changed at will. The width of each corridor was 1.5 m, which allowed 3 people at most to walk side-by-side. The length of both corridors was more than 4 m, thus allowing us to set our benchmark lines at the desired location in the corridors. A number of wooden partitions were used to block the line of sight between the two streams, as shown in Figure 3. The number of participants considered in this experimental setup was enough to create a congested situation with Level of Service E, i.e., >0.7–1.4 m2/pedestrian [44] in the merging corridor.
The participants were first divided into two groups, with 44 participants in one group and 45 in the other. The participants of Group 1 and Group 2 had white and blue hats, respectively, for better visibility during data extraction. The participants were instructed to start moving upon hearing the signal, and walk (or jog) straight to the end of their respective paths. The entire sequence was filmed using an unobstructed camera mounted on a crane, with a vertical elevation of 8 m directly above the center point of the junction. The recorded film was shot in Full HD quality with 25 frames per second. To track the pedestrians more easily in the trajectory extraction phase, the participant’s hats had three black markers.
The trajectories of the participant’s movements were extracted using video tracking software called Tracker® [45] and calibrated with actual dimensions measured before the experiment. This software has been widely used in video data processing and analysis research [26]. The trajectories were extracted through image processing. The extracted raw data were then imported to MATLAB, and further micro- and macroscopic calculations and analyses were done using this software. Figure 4 shows the sample of the trajectories of the pedestrians that were extracted for all three angles in the experiment with un-blocked vision. As seen in Figure 4, there is a substantial overlap of trajectories at the junction, suggesting the potential conflicts occurring at the junction that may create delays to the pedestrian flow.
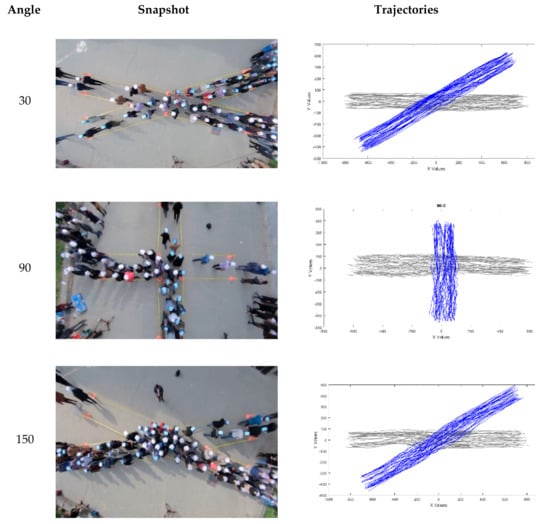
Figure 4.
Snapshots and trajectories for un-blocked vision experiments.
4. Data Analysis
4.1. Flow Rate Analysis.
The best criterion for efficiency and performance for pedestrian facilities is flow rate (pedestrians/second or ped/s) both in normal and emergency situations. The flow rate shows how many pedestrians have been able to evacuate the facility in a given time. To determine the flow rate for each angle, hypothetical lines before and after the center of the junction (entry and exit lines) at a distance of 3.25 m (2.5 m from the start of each corridor) was considered, making the effective length of the junction 6.5 m (2 × 3.25) (Figure 1). The flow rate was calculated by omitting the first and last 10 pedestrians, because they did not encounter any conflicts entering or exiting the junction, and basically moved at free flow speed. The flow was calculated by dividing the number of pedestrians by the difference between the exit time of the last and the first participant. The average flow for each angle was the mean of the flow rates based on the three repetitions of the experiment.
Table 1 and Figure 5 show the average flow rate for each angle under different conditions. Table 1 also shows the standard deviation of the flow. In the normal walking scenario, the highest flow rate was observed in the 30° junction, with an average flow of 5.74 pedestrians per second. Regarding the 90° and 150° angles, the difference in flow rate was negligible. The flow rate in the 30° intersection was observed to be more than 35% higher than in the 90° and 150° junctions. The standard deviation of flow rate is higher for jogging walking condition as compared to normal walking for the 30° and 90° intersections, while it is similar for the 150° intersection.

Table 1.
Mean and standard deviation for flow rates.
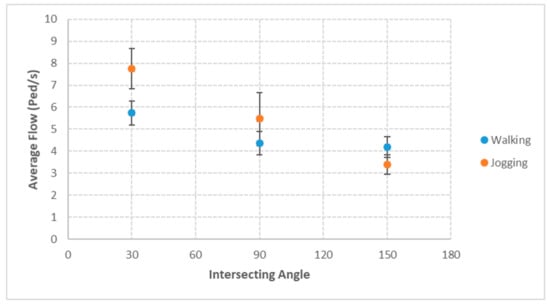
Figure 5.
Comparison of average flow with standard error bars for different intersecting angles for normal and jogging walking conditions.
In contrast, the flow trend was different for the jogging (slow running) condition. The average flow for 30° and 90° was higher when compared to normal walking, while it was lower for 150° when compared to normal walking. Further, the 30° intersection performed the best. As compared to the 90° layout, the 30° intersecting angle layout had an increase of 35% in flow rate, while it was more than double the flow rate observed for the 150° junction. The reason may be that, during jogging, each pedestrian had less decision time available to avoid conflicts compared to normal walking. This probably led to increased conflicts or collisions with pedestrians in the other stream, thereby resulting in a considerable decrease in flow rate. Therefore, the results suggest that, ideally, pedestrian junctions should have an intersecting angle less than 90° for efficient evacuation.
For both walking and slow running scenarios, the flow differences were examined using the t-test, and the results confirmed, with a 90% level of confidence, that the 30° junction had the best performance regarding flow rate.
4.2. Flow rate analysis with Blocked Vision
The results suggest that the difference in flow rates stemming from blocking the line of sight are not significant. To examine this, the t-test was conducted with the null hypothesis that the flow rate would be similar if the line of sight is blocked. The test was performed with a 95% level of confidence, and there was not enough evidence to reject the null hypothesis. This lack of significant difference between blocked and un-blocked vision could be mainly due to two reasons: (1) Perhaps pedestrians were aware of the junction, its placement, and the other stream. Therefore, rendering the vision blockage may have only little influence on their anticipation of another stream of pedestrians. This may be also common to daily life where regular commuters at train stations or within other infrastructure would have prior anticipation of another stream of people joining the junction. (2) The congestion occurred at the junction. As the corridor was not too long, the majority of the participants, except the first and last couple of people, could anticipate the flow and speed of the participants entering the junction. Therefore, the results from blocked vision are not discussed further. Furthermore, we have only discussed the average results of flow, speed, and evacuation time. For readers interested in the results of individual experiments, we have presented the results of flow, speed, and evacuation time from each individual experiment for un-blocked vision in Appendix A; Table A1 for the normal walking experiments and Table A2 for the jogging experiments.
4.3. Speed Analysis
The speed for each person was calculated by dividing the effective length of the corridor (here, 6.5 m) by the time it took to reach the exit line from the entry line. The results showed that, as the junction angle increased, the velocity decreased. As can be seen in Figure 6 and Table 2, the average velocity in the 30°and 90° intersections were, respectively, 19% and 12% higher than in the 150° intersecting angle. The reason for this better performance of the 30° intersection compared to the other two angles may be the minimal amount of collision compared to the other angle (observed visually), thus enabling the participants to continue walking at a higher desired speed. The standard deviation of speed is higher for jogging walking condition compared to normal walking for the 30° and 90° intersections, while it is lower for the 150° intersection.
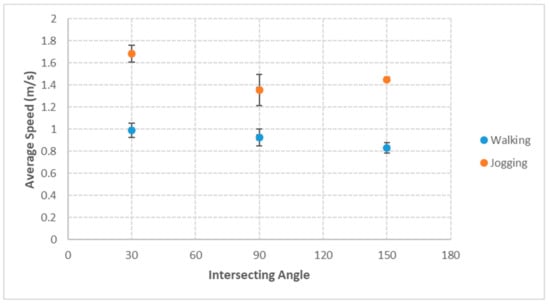
Figure 6.
Comparison of average speed with standard error bars for different intersecting angles for normal and jogging walking conditions.
Table 2.
Mean and standard deviation for speed.
In accordance with flow analysis in the jogging scenario, the best intersecting angle was 30°. However, contrary to previous observations, a slight increase of about 7% was observed when the intersecting angle was increased from 90° to 150°, which was examined with t-test, and the statistical significance was proven with a 90% level of confidence. One of the reasons for this slight increase in velocity could be due to the agitation caused by being stuck in the crowd jam at the junction, which led to higher running speeds as soon as the pedestrians found their way out of the intersecting zone, as observed in the video footages.
By comparing the velocities between the same angles in the walking and jogging scenarios, it was observed that the 30° intersection had a 70% increase in velocity, whereas the 90° angle had an increase of 46%. In the 150° intersection, the video footage showed a stop-and-go motion between the two streams, in which both streams took turns in traversing the junction, leading to a significant increase in speed.
4.4. Evacuation Time
This is a very important parameter regarding the performance of pedestrian facilities, as it correlates with the efficiency of the evacuation process. In emergency situations, survival or death could be a matter of a few seconds. A shorter evacuation time also contributes to less agitation among pedestrians, and subsequently aggressive behavior or competitive behavior from pedestrians can be reduced. This would then lead to a more constant and stable outflow.
After omitting the first and last 10 participants, we calculated the evacuation time as the difference between the time it took for the first person to cross the entry line and the last person to cross the exit line (regardless of the group).
The results show that the worst intersecting angle for evacuation time is 150°. However, the difference in evacuation time was very large in the jogging scenario, as shown in Table 3 and Figure 7. In the jogging video observations, we noticed that participants more frequently collided with each other in the 150° angle as compared to the other angles, which led to additional delays and affected the total evacuation time at the intersection. In general, the standard deviation of evacuation time is higher under normal walking conditions as compared to jogging conditions. To verify the statistical significance of the improvement in evacuation times, one-tail t-test was performed, and the trend was confirmed with a 95% level of confidence for both walking and jogging scenarios.
Table 3.
Mean and standard deviation for evacuation times.
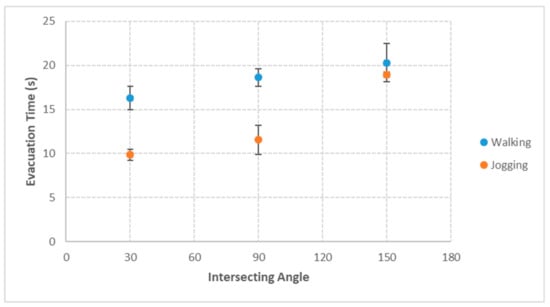
Figure 7.
Comparison of average evacuation time with standard error bars for different intersecting angles for normal and jogging walking conditions.
4.5. Average Travel Time
Average travel time is the mean of personal travel times. Personal travel time is the required time for each person to traverse the path, i.e., the difference between the time a person enters and exits the junction. Considering the data regarding the walking speed, normal distribution of the travel time was considered the best fit. The reason for this is that the first and last participants had, respectively, the lowest and highest travel times, as the junction was least crowded and most crowded at their time of entry. Most of the participants in the crowd, however, were jammed inside the junction, thus having travel times close to one another (Figure 8 and Figure 9). Table 4 shows the values of the average travel times for different scenarios alongside the standard deviation.
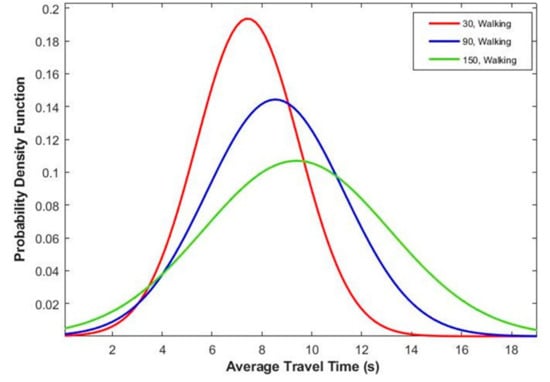
Figure 8.
Average travel time distribution for walking.
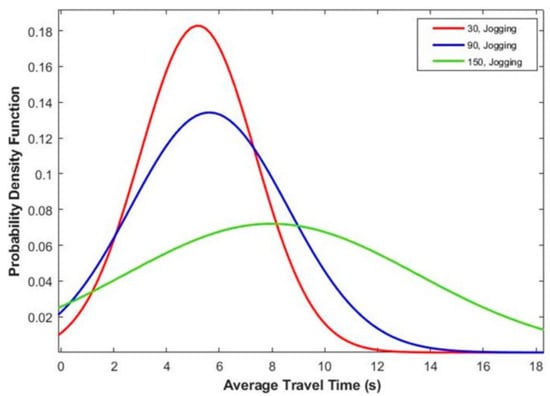
Figure 9.
Average travel time distribution for jogging.
Table 4.
Mean and standard deviation for average travel times.
Regarding the jogging speed, normal distribution was also the best fit. We can see, however, that the average travel time in the 30° and 90° intersections are closer, meaning that, in emergency situations, the two intersections are expected to perform similarly with regards to average travel time. However, the profile of the 30° and 90° intersections is different when compared to the 150° intersection, with the average travel time in the 150° intersection being substantially higher than those of the 30° and 90° intersections. It is also interesting to note that, when we take flow rate analysis into account, it is clear that the 30° junction has the better flow rate at jogging speed (41% higher than the 90° intersection), even though the average travel times are quite similar. Regarding the 150° intersection, we can clearly see that the intermittent flow has led to a very wide range of travel times. This may be due to the frequent number of collisions among pedestrians because of the smaller reaction time with higher movement speed (Figure 9 and Table 4).
5. Discussion and Conclusions
Intersections or junctions are amongst the most common facilities both in closed and open urban spaces. Previous studies have demonstrated that complex intersecting pedestrian crowd movements at junctions can create additional delays during congested and emergency situations. Therefore, in this study we examined the effect of different intersecting angles on pedestrian outflow at the junction via controlled laboratory experiments. It is to be noted that the strict crossing path experiments in our study represent one of the many possible walking scenarios under evacuation conditions. This type of walking scenario, although common in normal conditions, can also be expected in evacuation situations, especially during a pedestrian’s initial walking behavior upon hearing the fire or emergency alarm. It has been observed in previous studies that people displayed unwillingness to act upon the evacuation process despite the setting off of an emergency alarm as people tend to search for clues (interpretation stage) before they decide on actions [46]. Therefore, pedestrians may continue their normal crossing paths upon hearing the alarm. This interpretation stage has led to substantial delays in the evacuation process in the past [46]. The complexity of the movement characteristics at the intersecting junctions, as observed in our study, can further create additional delays during the interpretation stage. However, if the motive of the study is to examine the action stage of the evacuation process, we suggest to allow some individuals to make a choice to take another direction in the experiment setups in future studies rather than the fixed intersecting path, as conducted in this study.
Results indicated that the 30° junction performed the best as compared to the 90° and 150° intersecting angles. The 30° corridor had a better flow transition and minimum delays compared to the other angled junctions. These findings are consistent with previous studies on merging intersections, where a reduced pedestrian flow rate for higher merging angles was observed [8,26]. However, in a study with oblique pedestrian streams [41], it was observed that a lower intersecting angle does not necessarily have better flow transition compared to a higher intersecting angle and that it depends on the pedestrian volumes in the intersecting streams. However, the experiment was conducted only with normal walking speed. Comparison of normal and jogging walking conditions in our study revealed that, with the 150° junction, there was a remarkable decrease in flow rate in the jogging scenario compared to normal walking condition, implying that in such obtuse angles, people should be encouraged to slow down and walk calmly.
Further, the flow rate analysis with blocked and un-blocked vision showed that there was no significant difference in the flow rate due to the blocking of the line of sight. Velocity analysis of the 30° and 90° junctions conformed with flow analysis when comparing walking and jogging scenarios, but the 150° junction showed an unusual increase, suggesting that velocity analysis cannot be regarded as a stand-alone performance measure for the intersection. After flow and velocity analysis, evacuation times for all the scenarios were investigated. The results were consistent with flow analysis, and indicated that, in the 150° junction, some form of clogging occurs, which hinders faster evacuation at the junction, thus increasing the evacuation time substantially compared to the other two angles. Lastly, the results from the analysis of average travel time followed the same trend found earlier and confirmed that the higher the intersection angle, the higher the average travel time would be.
Consideration of blocked and un-blocked vision in the experiments is important as previous studies have shown that small architectural adjustments in an escape area can have large potential effects in terms of the outflow of individuals [15,17]. Past study has shown that blocked vision has an influence on the way the pedestrian crowd interacts and merges, which is important from a safety point of view [26]. However, the impact of vision barriers on flow could not be proved with our current experimental setup as no significant difference was observed when this parameter was introduced to the experiments. Despite this contradictory finding, it is to be noted that, in high density crowds and long intersecting blocked vision corridors, participants may not be able to anticipate the flow and speed at which the participants will enter the junction, which may influence the regulation of flow at the junction. Further, a study has shown differing performance of intersecting angles with different volumes of crossing pedestrians with un-blocked vision [41]. Therefore, in future, it is suggested to conduct additional experiments with different flow ratios (rather than two nearly equal flows), longer corridors, and different volumes of participants to further investigate the effect of blocked and un-blocked vision conditions.
In future studies, several improvements can be followed up. The present study only considered a limited range of intersection angle (30°, 90°, and 150°). In future, a wide range of intersecting angles would enable us to better quantify and confirm the decrease in flow rate with increased intersecting angle. In addition, the effect of different corridor width and length, as well as the effect of different flow ratios could be examined in future experiments. Also, quantification of increased conflicts or collisions due to higher angled intersecting streams may provide further insights on the substantial decrease in flow rate with an increase in intersecting angles, especially in jogging scenarios. Likewise, use of personal space may be affected by the cultural context of the participants. Therefore, it is suggested that similar experiments be conducted in other areas or regions to average any geographical bias. Walking behavior of pedestrian may be influenced by a pedestrian’s prior knowledge of the intersection. This needs careful examination in the future.
Nevertheless, the results from our study demonstrate that architects, designers, or emergency planners need to consider the appropriate selection of intersecting angles for the design of pedestrian junctions or intersections. Our results show that pedestrians compensate in their walking behavior by slowing down at higher intersection angle as compared to lower intersection angle, which can lead to additional delays. This cognitive-to-motor transformation displayed under different intersecting angles and different walking speeds could be critical, especially at a location where a large flow of pedestrians can be expected, such as in major public infrastructure or major transport hubs. Speed and flow reduction at the junction can reduce the overall efficiency of the evacuation process under emergency conditions. We recommend considering our findings when developing and testing pedestrian flow simulation models at major public infrastructure under congested or emergency conditions.
Author Contributions
Conceptualization, K.A. and K.R.; methodology, K.A. and K.R.; software, K.A. and K.R.; formal analysis, K.A., N.S., and K.R.; investigation, K.A., K.R., and N.S.; resources, K.A. and K.R.; writing—original draft preparation, K.A. and K.R.; writing—review and editing, N.S.; supervision, K.A. and N.S. All authors have read and agreed to the published version of the manuscript.
Funding
This research received no external funding.
Acknowledgments
We would like to thank two anonymous reviewers whose feedback have helped us to improve the paper.
Conflicts of Interest
The authors declare no conflict of interest.
Appendix A
Table A1.
Flow, speed, and evacuation time for normal walking experiments with un-blocked vision.
Table A1.
Flow, speed, and evacuation time for normal walking experiments with un-blocked vision.
| Intersecting Angle | Run | Flow (ped/s) | Mean (ped/s) | Speed (m/s) | Mean (m/s) | Evacuation Time (s) | Mean (s) |
|---|---|---|---|---|---|---|---|
| 30° | 1 | 6.09 | 5.74 | 1.06 | 0.99 | 15.08 | 16.27 |
| 2 | 6.01 | 0.97 | 16.04 | ||||
| 3 | 5.12 | 0.93 | 17.68 | ||||
| 90° | 1 | 4.23 | 4.36 | 0.84 | 0.93 | 18.56 | 18.63 |
| 2 | 3.90 | 0.96 | 19.64 | ||||
| 3 | 4.94 | 0.98 | 17.68 | ||||
| 150° | 1 | 4.59 | 4.19 | 0.88 | 0.83 | 18.12 | 20.28 |
| 2 | 4.30 | 0.83 | 20.24 | ||||
| 3 | 3.66 | 0.78 | 22.48 |
Table A2.
Flow, speed, and evacuation time for jogging experiments with un-blocked vision.
Table A2.
Flow, speed, and evacuation time for jogging experiments with un-blocked vision.
| Intersecting Angle | Run | Flow (ped/s) | Mean (ped/s) | Speed (m/s) | Mean (m/s) | Evacuation Time (s) | Mean (s) |
|---|---|---|---|---|---|---|---|
| 30° | 1 | 7.22 | 7.75 | 1.61 | 1.69 | 10.32 | 9.87 |
| 2 | 7.21 | 1.76 | 10.12 | ||||
| 3 | 8.81 | 1.69 | 9.16 | ||||
| 90° | 1 | 4.72 | 5.47 | 1.22 | 1.36 | 12 | 11.55 |
| 2 | 6.83 | 1.50 | 9.72 | ||||
| 3 | 4.87 | 1.34 | 12.92 | ||||
| 150° | 1 | 3.08 | 3.40 | 1.44 | 1.45 | 19.16 | 18.96 |
| 2 | 3.71 | 1.46 | 18.76 |
References
- Shi, X.; Ye, Z.; Shiwakoti, N.; Li, Z. A review of experimental studies on complex pedestrian movement behaviors. In Proceedings of the 15th COTA International Conference of Transportation, Beijing, China, 24–27 July 2015; pp. 1081–1096. [Google Scholar]
- Shiwakoti, N.; Tay, R.; Stasinopoulos, P.; Woolley, P. Passengers’ perceived ability to get out safely from an underground train station in an emergency situation. Cogn. Technol. Work 2018, 20, 367–375. [Google Scholar] [CrossRef]
- Shi, X.; Ye, Z.; Shiwakoti, N.; Li, H. Passengers’ Perceptions of Security Check in Metro Stations. Sustainability 2019, 11, 2930. [Google Scholar] [CrossRef]
- Dias, C.; Abdullah, M.; Sarvi, M.; Lovreglio, R.; Alhajyaseen, W. Modeling and Simulation of Pedestrian Movement Planning Around Corners. Sustainability 2019, 11, 5501. [Google Scholar] [CrossRef]
- Banister, D. Sustainable transport: Challenges and opportunities. Transportmetrica 2007, 3, 91–106. [Google Scholar] [CrossRef]
- Satoh, K.; Lan, L.W. Development and Deployment of Sustainable Transportation. Int. J. Sus. Transp. 2007, 1, 69–71. [Google Scholar] [CrossRef]
- Still, K.G. Crowd Safety and Risk Analysis. 2019. Available online: http://www.gkstill.com/ExpertWitness/CrowdDisasters.html (accessed on 15 July 2019).
- Shiwakoti, N.; Gong, Y.; Shi, X.; Ye, Z. Examining influence of merging architectural features on pedestrian crowd movement. Saf. Sci. 2015, 75, 15–22. [Google Scholar] [CrossRef]
- Asano, M.; Iryo, T.; Kuwahara, M. A pedestrian model considering anticipatory behaviour for capacity evaluation. In Transportation and Traffic Theory 2009: Golden jubilee; Springer: Boston, MA, USA, 2009; pp. 559–581. [Google Scholar]
- Dias, C.; Sarvi, M.; Shiwakoti, N.; Ejtemai, O.; Burd, M. Examining the impact of different turning angles on the collective egress of crowds. J. Transp. Saf. Secur. 2014, 6, 167–181. [Google Scholar] [CrossRef]
- Wong, S.C.; Leung, W.L.; Chan, S.H.; Lam, W.H.; Yung, N.H.; Liu, C.Y.; Zhang, P. Bidirectional pedestrian stream model with oblique intersecting angle. J. Transp. Eng. 2010, 136, 234–242. [Google Scholar] [CrossRef]
- Shiwakoti, N. Understanding differences in emergency escape and experimental pedestrian crowd egress through quantitative comparison. Int. J. Disaster Risk Reduct. 2016, 20, 129–137. [Google Scholar] [CrossRef]
- Gu, Z.; Liu, Z.; Shiwakoti, N.; Yang, M. Video-based analysis of school students’ emergency evacuation behavior in earthquakes. Int. J. Disaster Risk Reduct. 2016, 18, 1–11. [Google Scholar] [CrossRef]
- Daamen, W.; Hoogendoorn, S.P. Experimental research of pedestrian walking behavior. Transp. Res. Rec. 2003, 1828, 20–30. [Google Scholar] [CrossRef]
- Helbing, D.; Buzna, L.; Johansson, A.; Werner, T. Self-organized pedestrian crowd dynamics: Experiments, simulations, and design solutions. Transp. Sci. 2005, 39, 1–24. [Google Scholar] [CrossRef]
- Cao, J.; Pang, Y.; Li, X. Learning multilayer channel features for pedestrian detection. IEEE Trans. Image Process. 2017, 26, 3210–3220. [Google Scholar] [CrossRef] [PubMed]
- Shiwakoti, N.; Sarvi, M.; Rose, G.; Burd, M. Animal dynamics based approach for modeling pedestrian crowd egress under panic conditions. Transp. Res. Part B Methodol. 2011, 45, 1433–1449. [Google Scholar] [CrossRef]
- Courtine, G.; Schieppati, M. Human walking along a curved path. I. Body trajectory, segment orientation and the effect of vision. Eur. J. Neurosci. 2003, 18, 177–190. [Google Scholar] [CrossRef]
- Johnson, C.W. Lessons from the evacuation of the world trade centre, 9/11 2001 for the development of computer-based simulations. Cogn. Technol. 2005, 7, 214–240. [Google Scholar] [CrossRef]
- Tajima, Y.; Nagatani, T. Clogging transition of pedestrian flow in T-shaped channel. Phys. A Stat. Mech. Appl. 2002, 303, 239–250. [Google Scholar] [CrossRef]
- Galea, E.R.; Sharp, G.; Lawrence, P.J. Investigating the representation of merging behavior at the floor—stair interface in computer simulations of multi-floor building evacuations. J. Fire Prot. Eng. 2008, 18, 291–316. [Google Scholar] [CrossRef]
- Zhang, J.; Klingsch, W.; Schadschneider, A.; Seyfried, A. Transitions in pedestrian fundamental diagrams of straight corridors and T-junctions. J. Stat. Mech. Theory Exp. 2011, 6, P06004. [Google Scholar] [CrossRef]
- Zhang, J.; Klingsch, W.; Schadschneider, A.; Seyfried, A. Experimental Study of Pedestrian Flow through a T-Junction. In Traffic and Granular Flow’11; Springer: Berlin/Heidelberg, Germany, 2013; pp. 241–249. [Google Scholar]
- Craesmeyer, M.; Schadschneider, A. Simulation of merging pedestrian streams at T-junctions. Transp. Res. Procedia 2014, 2, 406–411. [Google Scholar] [CrossRef]
- Aghabayk, K.; Sarvi, M.; Ejtemai, O.; Sobhani, A. Impacts of different angles and speeds on behavior of pedestrian crowd merging. Transp. Res. Rec. 2015, 2490, 76–83. [Google Scholar] [CrossRef]
- Shi, X.; Ye, Z.; Shiwakoti, N.; Tang, D.; Wang, C.; Wang, W. Empirical investigation on safety constraints of merging pedestrian crowd through macroscopic and microscopic analysis. Accid. Anal. Prev. 2016, 95, 405–416. [Google Scholar] [CrossRef] [PubMed]
- Shimizu, T.; Igakura, T.; Ishibashi, R.; Kojima, A. A modeling of pedestrian behavior based on hybrid systems approach—An analysis on the direction of confluence. In Proceedings of the SICE Annual Conference 2011, Tokyo, Japan, 13–18 September 2011; pp. 1442–1446. [Google Scholar]
- Zhang, J.; Klingsch, W.; Schadschneider, A.; Seyfried, A. Ordering in bidirectional pedestrian flows and its influence on the fundamental diagram. J. Stat. Mech. Theory Exp. 2012, 2, P02002. [Google Scholar] [CrossRef]
- Boltes, M.; Zhang, J.; Seyfried, A.; Steffen, B. T-junction: Experiments, trajectory collection, and analysis. In Proceedings of the 2011 IEEE International Conference on Computer Vision Workshops (ICCV Workshops), Barcelona, Spain, 6–13 November 2011; pp. 158–165. [Google Scholar]
- Shahhoseini, Z.; Sarvi, M.; Saberi, M. Pedestrian crowd dynamics in merging sections: Revisiting the “faster-is-slower” phenomenon. Phys. A Stat. Mech. Appl. 2018, 491, 101–111. [Google Scholar] [CrossRef]
- Yanagisawa, D.; Kimura, A.; Tomoeda, A.; Nishi, R.; Suma, Y.; Ohtsuka, K.; Nishinari, K. Introduction of frictional and turning function for pedestrian outflow with an obstacle. Phys. Rev. E 2009, 80, 036110. [Google Scholar] [CrossRef]
- Shiwakoti, N.; Sarvi, M.; Rose, G.; Burd, M. Consequence of turning movements in pedestrian crowds during emergency egress. Transp. Res. Rec. 2011, 2234, 97–104. [Google Scholar] [CrossRef]
- Dias, C.; Ejtemai, O.; Sarvi, M.; Shiwakoti, N. Pedestrian walking characteristics through angled corridors: An experimental study. Transp. Res. Rec. 2014, 2421, 41–50. [Google Scholar] [CrossRef]
- Burghardt, S.; Seyfried, A.; Klingsch, W. Performance of stairs–fundamental diagram and topographical measurements. Transp. Res. Part C Emerg. Technol. 2013, 37, 268–278. [Google Scholar] [CrossRef]
- Dias, C.; Sarvi, M.; Shiwakoti, N.; Ejtemai, O.; Burd, M. Investigating collective escape behaviours in complex situations. Saf. Sci. 2013, 60, 87–94. [Google Scholar] [CrossRef]
- Shiwakoti, N.; Sarvi, M.; Dias, C.; Burd, M. Understanding crowd panic at turning and intersection through model organisms. In Pedestrian and Evacuation Dynamics 2012; Springer International Publishing Switzerland: Cham, Switzerland, 2014; pp. 1175–1183. [Google Scholar]
- Asano, M.; Kuwahara, M.; Tanaka, S. Multi-directional pedestrian flow model based on empirical data. In Proceedings of the 11th World Conference on Transport Research, World Conference on Transport Research Society, Lyon, France, 24–28 June 2007. [Google Scholar]
- Plaue, M.; Chen, M.; Bärwolff, G.; Schwandt, H. Trajectory extraction and density analysis of intersecting pedestrian flows from video recordings. In ISPRS Conference on Photogrammetric Image Analysis; Springer: Berlin/Heidelberg, Germany, 2011; pp. 285–296. [Google Scholar]
- Versluis, D. Microscopic Interaction Behavior between Individual Pedestrians. Master’s Thesis, Delft University of Technology, Delft, The Netherlands, 2010. [Google Scholar]
- Xie, S.; Wong, S.C.; Lam, W.H.; Chen, A. Development of a bidirectional pedestrian stream model with an oblique intersecting angle. J. Transp. Eng. 2013, 139, 678–685. [Google Scholar] [CrossRef]
- Sun, L.; Gong, Q.; Hao, S.; Wang, C.; Chen, Y. Experimental study of oblique pedestrian streams. Promet Traffic Transp. 2018, 30, 151–161. [Google Scholar] [CrossRef]
- Daamen, W. Modeling Passenger Flows in Public Transport Facilities; Delft University of Technology: Delft, The Netherlands, 2004. [Google Scholar]
- Kretz, T. Pedestrian Traffic: Simulation and Experiments. Ph.D. Thesis, University of Duisburg-Essen, Germany, 2007. [Google Scholar]
- Highway Capacity Manual (HCM). Transportation Research Board (TRB); National Research Council: Washington, DC, USA, 2000. [Google Scholar]
- Brown, D.; Cox, A.J. Innovative uses of video analysis. Phys. Teach. 2009, 47, 145–150. [Google Scholar] [CrossRef]
- Shiwakoti, N.; Wang, H.; Jiang, H.; Wang, L. A ‘role-rule’ model to examine passengers’ likely behaviour and their perceived ability to evacuate safely from airport in an emergency evacuation. Saf. Sci. 2020, 124, 104584. [Google Scholar] [CrossRef]
© 2020 by the authors. Licensee MDPI, Basel, Switzerland. This article is an open access article distributed under the terms and conditions of the Creative Commons Attribution (CC BY) license (http://creativecommons.org/licenses/by/4.0/).