Article

Crossing Borders and Expanding Modal Shift Measures: Effects on Mode Choice and Emissions from Freight Transport in the Nordics

by
Daniel Ruben Pinchasik
1,*,
Inger Beate Hovi
1,
Christian Svendsen Mjøsund
1,
Stein Erik Grønland
2,
Erik Fridell
3 and
Martin Jerksjö
3
1
Institute of Transport Economics, Department of Economics, N-0349 Oslo, Norway
2
Sitma AS, N-0213 Oslo, Norway
3
IVL Swedish Environmental Research Institute, Department of Transport and Department of Mobility, 41133 Gothenburg, Sweden
*
Author to whom correspondence should be addressed.
Sustainability 2020, 12(3), 894; https://doi.org/10.3390/su12030894
Submission received: 20 December 2019 / Revised: 21 January 2020 / Accepted: 22 January 2020 / Published: 24 January 2020

Abstract

:
Considering the underachievement on modal shift and environmental objectives for freight transport, scholars and policy makers recurrently ask how more road freight can be shifted to rail and waterborne transport. The current study simulates transport and modal distribution effects for several scenarios in which modal shift policy measures are strengthened, expanded, combined, and harmonized across borders in the Nordics. Found transport effects were then used in an environmental model to assess implications for energy use and emissions of CO2,eq, NOx, and particulate matter, gaining insights into which policy measures are more effective or complement each other, and whether international harmonization might increase effectiveness, and modal shift. From our simulations, a Norwegian ecobonus scheme for rail yields larger modal shift away from road than a similar ecobonus for sea transport. Facilitating longer freight trains yields more modal shift but has high policy costs. Effects of harmonizing policies across Nordic countries vary but can be strengthened by combining different measures. However, even for scenarios with strong policy measures, reductions in CO2,eq emissions do not exceed 3.6% in 2030 while sometimes increasing local air pollution. Modal shift policy should therefore not exclusively be regarded as environmental strategy, although it may contribute to other policy objectives.

1. Introduction

Inducing modal shift from road to rail and waterborne freight is a political objective in many countries [1], often motivated by ambitious emission reduction, sustainability, and traffic safety targets. In most European countries, modal shift ambitions are particularly driven by the European Commission’s Transport White Paper [2], while in Norway, modal shift has additionally been a transport-political objective in all National Transport Plans (NTPs) since 2002, state budgets since 2005, and several government agreements [3].
Despite this focus, modal shift objectives both in Norway and many European countries are far from being met in practice [4,5]. In fact, in most countries, road transport has been increasing (often strongly), while freight has been shifting away from rail to road. Since the 1970s, rail freight’s market share has for example steadily decreased throughout Europe [6,7,8], and particularly in Eastern Europe [5].
Important explanations behind these developments include several megatrends strengthening the position of transport by road/truck. A first example is a decades-long trend of sectors starting to organize themselves differently; less nationally and more internationally, country-overspanning, or Pan-European. This trend has caused an increase in international transport, often favoring road transport, as many production and consumption centers can only be reached by road [9,10,11].
Alongside, debates and developments have been ongoing towards increasing vehicle weight and length allowances in a number of European countries [12]. While making road transport more cost and environmentally efficient, this development also improves road transport’s competitiveness vis-à-vis other modes and makes shifts to other modes less attractive.
Thirdly, Eastern-European transport firms have taken over sizable shares of international road freight transport in Europe, being able to compete with driver wages below the minimum in many richer EU-countries [5]. Also this has strengthened road transports’ competitive position.
For the Nordic region (in this article, focusing on Norway, Sweden, and Denmark), similar developments have been visible—transport-generating enterprises such as distribution centers and logistics warehouses are increasingly established at a Nordic level and located in, e.g., the South of Sweden, the share of transport with drivers from low-wage countries has been strongly increasing at the expense of the driver share from the Nordic countries, and vehicle dimension allowances have increased in terms of length, weight, and the use of European Modular Systems [8,13,14].
In light of the above developments and far too little progress in reducing CO2 emissions from freight transport [8], a recurrent theme with both policy makers and scholars has been how more modal shift can be achieved than has so far been the case.
For Norway, a freight analysis prepared for the National Transport Plan 2018–2029 [15] highlighted that assessments of domestic modal shift might underestimate the full modal shift potential, arguing that if more of the imported freight enters Norway by rail or sea; this increases the likeliness of further domestic transports by these modes (rather than by road). As such, the question was posed whether measures implemented at the Nordic level can contribute to increasing the share of foreign freight to and from Norway by sea or rail.
The current study takes a comprehensive approach, assessing a number of scenarios where existing policy measures with modal shift relevance are strengthened or expanded. The policy scenarios studied cover both single, mode-specific policy instruments, as well as combinations of instruments, including cross-border harmonization in Norway, Sweden, and Denmark. As such, we gain important insights into which policy measures might be more effective than others, whether measures might complement each other, and whether international harmonization might increase effectiveness, and thereby modal shift. In addition to effects on transport and modal distribution, we calculate environmental effects through energy use, emissions of CO2 and NOx, and particulate matter. As environmental effects are mode-specific, the latter also has implications for policy making, depending on the trade-offs between for example local and global pollution.
Although this study looks at policy instrument usage in the Nordic region as a whole, it should be noted that analyses are primarily carried out from a Norwegian perspective. Quantitative estimates of changes in modal choices and freight flows are for example made using the National Freight Model for Norway (NFM) [16,17,18], and given its inputs, the analysis only covers effects for freight flows with origin and/or destination in Norway. In addition, future policy scenarios studied with the NFM were specified based on the mapping of policy measures in the Nordics, but also with focus on freight flow analyses with (particularly) Norwegian relevance.
However, introducing modal shift from road transport to sea or rail in Norway’s foreign trade will also lead to less road transport in other Nordic countries, being important transit countries for Norwegian import and export by road. Even though differences in geographical conditions and availability of transport modes will affect how comparable scenarios would turn out in other countries or regions than the Nordics, results and particularly insights from the current study will therefore be highly relevant for researchers, policy makers, and other stakeholders.

2. Literature Background

2.1. Political Objectives and Framework

As introduced above, an important driver of modal shift ambitions in Europe is the European Commission’s White Paper or transport policy roadmap [2]. This document sets targets of transferring 30% of road freight on distances over 300 km to other modes like rail and inland waterways by 2030, and more than 50% by 2050. Amongst others, this implies that cargo volumes handled by rail will have to three- to four-double [19]. In the Nordic countries, modal shift objectives are also to an important degree driven by this framework.
Generally, modal shift objectives tend to focus on freight transport over longer distances, as transport over short distances (particularly <100 km) is dominated by road [19]. This is because rail/water modes can rarely be used for first- and/or last-mile delivery, meaning that, in most cases, only parts of transport chains can be shifted away from road, and leaving a necessity for road transport at origin and/or destination [5]. In addition to adding detours to and from rail or sea terminals rather than driving an optimal route, reloading at terminals adds handling costs. Since such costs are independent of trip length, reloading adds relatively more time and costs for shorter trips and further adds a risk of damaging freight [5,19,20].

2.2. Desirability of Modal Shift

In light of the above discussion, modal shift is generally considered more feasible for longer-distance transport, and there are several reasons that modal shift can be considered desirable. Both rail and water modes are generally more energy-efficient than road transport, and usually yield lower negative external effects per tonne-km performed. Sea transport for example tends to give lower CO2 emissions and less externalities such as congestion, noise, and accidents, but typically has higher SOx, NOx-, and PM emissions [21]. Rail transport too, generally causes less environmental emissions and other negative externalities than road transport [7]. As such, a shift of freight from road to rail and/or water is seen as one means for reducing CO2 emissions and could be particularly relevant for the Nordics, where transport’s share in energy-related CO2 emissions is higher than in many other European countries [22].
At the same time, it should be emphasized that decarbonization cannot happen through modal shift alone [1,5,11,23]. Further, it should be noted that in addition to sustainability and transport and safety objectives, there might be other (political) reasons that modal shift is desired, e.g., to support transport modes, such as Norwegian rail freight, where operators are struggling and a growth in freight volumes might be crucial to prevent a decrease in rail freight services [14,24].

2.3. Modal Choices and Decision Factors

Important factors that decide how modal choices are made, are costs, access to modes, transit time, reliability, service frequency, and different shipment and commodity characteristics [5,25]. In this regard, different modes have different strengths and weaknesses. Compared to water and rail transport, road freight for example has low capital costs, is more flexible from a geographical and timing perspective, and is often faster. However, road transport often also yields a number of negative externalities such as congestion, infrastructure wear and tear, negatively affects traffic safety, and is less suitable for bulk transport [20]. Particularly on longer distances, an advantage of waterborne transport compared to road are economies of scale, while on shorter distances, transshipment costs and ship size are less favorable [21]. Rail transport is also considered to be potentially cost-effective due to economies of scale [7] but has a number of inherent weaknesses, such as road dependency at origin and/or destination and long lead times [6]. Compared to road freight and to be competitive, both waterborne and rail transport will further require sufficient freight flows, both in terms of volume and regularity.

2.4. Instruments and Measures for Inducing Modal Shift

For policy to incentivize modal shift, it must in some way change the balance of choice factors where these currently favor road transport. Policy measures for promoting modal shift can be categorized in different ways. For example, Kaack et al. [5] distinguish the following two approaches: targeting infrastructure and efficiency improvements of freight systems and using financial incentives. The combining of policy measures (particularly increasing road costs and reducing lead times for intermodal transport) has been suggested as valuable approach. At the same time, Kaack et al. [5] find that many countries lack such policies. Nocera et al. [26] use a different, but comparable taxonomy, dividing instruments that can (in)directly encourage modal shift into push measures (making road transport less attractive) and pull measures (making rail and waterborne transport more attractive). For freight transport, push measures may include taxation, charges and tolls, and regulatory measures (e.g., orders and bans), while pull measures may include positive financial incentives for sea and rail transport or measures that improve reliability or infrastructure or reduce shipping costs. Both McKinnon [27] and Meers and Macharis [28] find that, in many cases, modal shift policies include taxation, regulation, infrastructural measures, and financial incentives. However, they also point to the use of legislative powers regarding interoperability, e.g., through standardization and harmonization, and to approaches where policy makers attempt to convince shippers individually to consider intermodal transport.
On a European level, well-known examples of some of the measures described above include the EU’s Marco-Polo, Ten-T, and Motorways of the Sea initiatives, as well as key elements in the EU’s so-called railway packages [7,21]. Nevertheless, according to Paulsson et al. [29], modal shift targets require significant further infrastructural upgrades throughout Europe, amongst others due to the lack of dedicated rail freight infrastructure and existing infrastructure being based on long-outdated traffic demand, but such upgrades are both expensive and complicated.
Policy measures studied in the current paper (for which a scenario description follows in Section 3.3) cover several of the types discussed above, including combinations of measures and border-crossing implementation.

2.5. Methods for Studying Modal Shift

When it comes to assessments of modal shift potential and effects, different approaches can be taken, depending on objectives and information that may be available. Jonkeren et al. [30] divide existing studies into macro and micro studies, depending on the spatial level assessed. Based on a literature review, they further distinguish four main methods of analysis: choice models, life cycle analyses, decomposition analyses, and strategic transport network models.
Because CO2 emissions amongst others depend on origin, destination, and geographical proximity to intermodal terminals, estimation of environmental effects is not straightforward [5], and not all of the above methods are suitable to study environmental effects of modal shift.
Indeed, Jonkeren et al. [30] find that CO2 reduction effects from modal shift are most often studied using strategic transport network models, noting that these have the advantage of being highly adaptable when several inputs have first become available (e.g., origin-destination matrices, cost and choice information, etc.).
However, in many cases, sufficiently granular high-quality freight data is not available, as data collection is often limited or inconsistent or only available for country-specific freight activities [5]. This is also the reason that the current study is limited to (domestic and international) freight flows with origin and/or destination in Norway and which are covered in the NFM. This includes considerable transport activity in important transit countries such as particularly Sweden and Denmark. Although the exact effect of similar policy measures in other countries/regions will depend on local characteristics (e.g., geographical situation and available transport modes), insights and reasoning in the current study will also be useful in other countries, particularly where foreign trade and transit are significant.

3. Methodology

The analyses in this study are divided into two stages. First, we use a National Freight Model for Norway to simulate a set of policy measure scenarios outlined in Section 3.3 and their influence on modal choice. Second, these estimates on changes in modal choice are used to compute environmental effects, using data on the fleet for trucks, ships and trains, together with emission factors from updated sources.

3.1. The National Freight Model for Norway

The National Freight Model or NFM for Norway can be classified as strategic transport network model [30], consisting of the following elements:
  • Transport demand, represented by commodity flow matrices between Norwegian municipalities, and between Norwegian municipalities and geographical zones abroad, distributed over 39 commodity groups representing different requirements regarding transport quality and time. The commodity flow matrices represent the annual sum of commodity flows between suppliers (producers, importers, and wholesalers) and end-use sectors (exporters, wholesalers, retailers, and service industry) [18].
  • A network model, representing each mode’s physical infrastructure (road, sea, rail, and air) by distance and transport time, including locations of terminals for consolidation and reloading between modes [16]. There is also one node file for each commodity group, describing the properties for each node and terminal in the model.
  • Cost functions representing time- and distance-dependent costs for different transport modes, including loading/unloading/reloading, ordering, storing, commodity time values, etc. [17].
  • Optimization routines for choice of shipment size, frequency, and mode, based on a minimization of yearly logistics costs [31].
Combining these elements, the model determines optimal transshipment locations (from a list of available terminals) for each pair of origin and destination zones, and then calculates shipment size and transport chains (number of legs, selection of modes and vehicle types). Based on this, the model selects the transport chain with the lowest logistics costs. Model programming is done using an object Pascal Delphi compiler, and due to the involvement of common developers, the NFM features large similarities to the Swedish freight model used by Vierth et al. [32].
Policy scenarios assessed in this study are operationalized through changes in parameters in the NFM (e.g., cost parameters, changes in available terminals, costs related to train length restrictions in the network model, etc.). These changes affect which transport chains are calculated to yield the lowest logistics costs, and thus are selected in the model. As such, the NFM yields estimates on the distribution of mode of transport (compared to a reference scenario or “status quo”), impacts on transport costs, and overall logistics costs.
The scenarios are run for the future year 2030, based on projections made for the Norwegian Ministry of Transport and Communications towards the National Transport Plan 2018–2029 [33]. These projections were based on Statistics Norway’s population projections from 2016 and macroeconomic growth trajectories compiled by the Norwegian Ministry of Finance [34] with macroeconomic model DEMEC. Growth paths are regionalized using PINGO, a spatial computable general equilibrium model for Norway [35]. The changes made in the NFM to represent a given scenario compared with a reference situation, are implemented in either the cost functions and the input files generated from those, in the files representing the different nodes, or in the input files for the networks. Beyond the changes and assumptions mentioned in our descriptions, cost developments are assumed to remain the same between modes. Relative costs can change if e.g., the phase-in of new technologies follows a different path or policy changes in levies/duties (e.g., on fuel) are introduced. Such hypothetical situations were not assessed, in order to be able to distinguish the partial effects of modal shift measures.

3.2. Environmental Effects

NFM-output on transport performance (tonne-km) from domestic and foreign trade was combined with energy use and emission factors to estimate environmental effects in the different policy scenarios (changes in energy use, GHG- and NOx emissions, and exhaust particulate mass (PM)). Emissions and energy use factors (in g/tonne-km and MJ/tonne-km respectively) were derived from different sources, depending on transport mode.
For road transport, energy use and emissions were calculated using transport performance output, together with fuel consumption and emission factors from the HBEFA-model (v.3). Both the distribution of road transport over different-size trucks and maximum load capacity for transport of different commodity groups are output from the NFM. The NFM divides trucks into light lorries, heavy lorries, and large trucks, each with several sub-categories. These subcategories were matched with truck sizes in HBEFA. Based on a weighting of sub-categories (an output of the NFM), energy use for each main truck category was calculated. Average load factors were estimated using information from the NFM on load capacities for each commodity group, to take into account that different commodities have different volumes per tonne. When applying environmental emission factors, empty trips were assumed to constitute 30% of the total distance, derived as average for freight transport with trucks in statistics for 2016–2018 from Statistics Norway.
For emission assessments of Norwegian freight trains, we used the basic methodology from energy and emission calculation system EcoTransIT [36]. In EcoTransIT, calculations are based on train weight (gross and net), after which conversion factors are used to correct for the positioning of empty wagons and topography. This work describes rail transport with three main train types, respectively “wagonload,” “other rail,” “diesel trains,” and their sub-categories from the NFM. To calculate typical train weights within each sub-category, maximum capacities (from the NFM) were combined with tare weights for freight wagons from EcoTransIT. Average energy use for each main train type was calculated by weighting sub-categories (from the NFM), after which emission factors were derived based on the Norwegian electricity mix employed in EcoTransIT [36]. This mix was validated against the most recent statistics available.
For sea transport, the NFM uses a set of ship types. Characteristics of these were developed using data for existing ships of the same type and similar size from SeaWeb [37]. Fuel consumption for each ship type was obtained using specific fuel consumption data from IMO [38] together with average speeds from SeaWeb. Emission factors for calculating air pollutants emissions were based on Cooper and Gustafsson [39].
The share of renewable diesel blend in 2030 is assumed to be 20%, both for road transport and diesel trains. This is a continuation of the mandatory blend in 2020, as shares in later years have not been decided yet. Further, we assumed that all trucks used in 2030 comply with Euro-VI emission standards, while the share of fully electric trucks or electric hybrids is expected to be negligible [following 40]. For ships, fuel is assumed to remain of 100% fossil origin in 2030, and energy-efficiency and emission standards are held at current levels. Finally, all emissions are presented as tailpipe emissions and do not include upstream emissions from e.g., production and transportation of fuel, and elements of uncertainty discussed in the discussion section.

3.3. Scenarios

Based on a mapping of existing policy measures for modal shift in the Nordic countries (an update of Pinchasik et al. [8], analyses of volume flows and developments in foreign trade with trucks [14], and feedback on modal shift potential from a survey among firms with own sea terminal [40,41], we constructed a set of future policy scenarios. The first four scenarios consider single policy measures, while the latter five scenarios consider combinations of the single measures and/or border-crossing implementation in the Nordic countries. Together, the scenarios cover both infrastructure/efficiency improvements and financial incentives (in line with [5]) and can be characterized as both push and pull measures [26]. Vierth et al. [32] carried out a related analysis as in the current paper for the case of Sweden, using the Swedish national freight model to calculate modal shifts, environmental effects, and changes in logistics costs from several proposed policy measures. Policy measures were studied in isolation and combined to illustrate whether measures reinforce each other or require coordination.
Both the scenarios covering single policy measures and those covering combinations and border-crossing implementation are assessed against a reference scenario based on the latest NFM, with 2030 as year of comparison (i.e., with road network and program versions of March 2019 and PWC-matrices for 2030 freight flows). The reference scenario represents “business-as-usual” and does therefore not include eco-bonuses or changes to current road pricing regimes. For railway, it includes current length allowances of 480 m for combi-trains (containers) and wagon loads, except for some border-near rail stretches where length allowances vary around ca. 600 m.

3.4. Scenarios Covering Single Policy Measures

3.4.1. Scenario 1: Norwegian Ecobonus for Sea Transport

In 2017, Norway established a trial scheme for an “ecobonus” for sea transport. Subject to certain requirements, this scheme was designed to pay out support towards sea transport replacing road transport on Norwegian territory. In May 2019, Norwegian Government [24] proposed to replace the scheme by other measures, but later announced to make the scheme permanent with an annual budget of NOK 50 million [42].
Due to the frequent recent changes, the current policy scenario is assessed for an ecobonus scheme with hypothetical budget of NOK 150 million/year, equal to the rail ecobonus in Scenario 2.
To implement the sea ecobonus in the NFM, we assume that the entire annual budget is paid out to shippers. Based on experience from practice, we further set eligibility limitations, including all ships suitable for transport of general cargo, but excluding, e.g., bulk transport and comparable (which already goes by ship where possible).
Based on the 3.9 million tonnes of goods that, from the latest NFM version, are loaded/unloaded from container ships in Norway annually, and considering that freight is handled twice in terminals, the ecobonus was operationalized as reduction in terminal costs for loading/unloading in Norwegian ports. Because the NFM does not allow applying cost reductions exclusively to newly generated sea transport, and some modal shift could be expected from road to sea due to reduced terminal costs, exact terminal cost reductions were calculated in an iterative process. Cost reductions per tonne were set equal for eligible ship types. Further, if the calculated terminal cost reduction yielded total support payments above/below the program’s budget, parameters were adjusted, and the model reiterated. Assumptions for this scenario were implemented as direct changes in the port costs in the nodes files.

3.4.2. Scenario 2: Norwegian Ecobonus for Rail Transport

Until recently, when Norway’s revised State Budget for 2019 included a “rail ecobonus” proposal, Norway did not have an ecobonus program for rail transport, such as, e.g., Sweden, or previously Italy [43]. We therefore modeled a policy scenario with an annual “rail ecobonus” budget of NOK 150 million, i.e., equal to the sea ecobonus in Scenario 1. Again, support is assumed to be payable only for the parts of road transport on Norwegian territory that are shifted away. Support is further assumed to be limited to combi-transport (i.e., excluding bulk and timber transport).
The ecobonus for rail was implemented in the NFM in a similar way as for the sea scheme, here with a reduction in terminal costs of 15 NOK/tonne combi-freight handled in Norwegian rail terminals (at both ends of the transport chain). The assumptions for this scenario were implemented as changes in the terminal costs in the nodes files.

3.4.3. Scenario 3: Increases in Eurovignette Rates in Sweden and Denmark

With regard to costs for trucks driving in the Nordic countries, we started out using the costs of today’s Eurovignette, which is used in Sweden and Denmark (in addition to Luxemburg, the Netherlands, and until recently, Belgium), and applies to heavy trucks (gross weight ≥12 tonnes). For this policy scenario, we assumed a five-doubling of today’s (daily) Eurovignette price, i.e., 5 × 8 EUR. To reflect that the Eurovignette applies in Sweden and Denmark, but not Norway, this rate increase is operationalized through the modelling of a “toll charge” for driving into or out of Sweden or Denmark. In the model, the assumptions for toll charges were implemented in the network files.
Although the rate increase assessed here might seem large, Bouchery and Fransoo [23] find that while implementing taxes on road transport aligns costs and CO2 emissions, cost increases for the road mode have to be substantial, often beyond what is considered feasible in practice, to have significant effect. For example, for truck transport between Oslo-Bergen or Oslo-Trondheim in Norway, toll expenses (one way) average around 360 NOK/36 EUR (for Euro VI trucks, outside of peak hours).

3.4.4. Scenario 4: Longer Freight Trains

In order to lower operational costs and freight rates for rail, particularly important factors are the ability to operate heavier, longer and wider trains, with higher speeds and better capacity utilization [
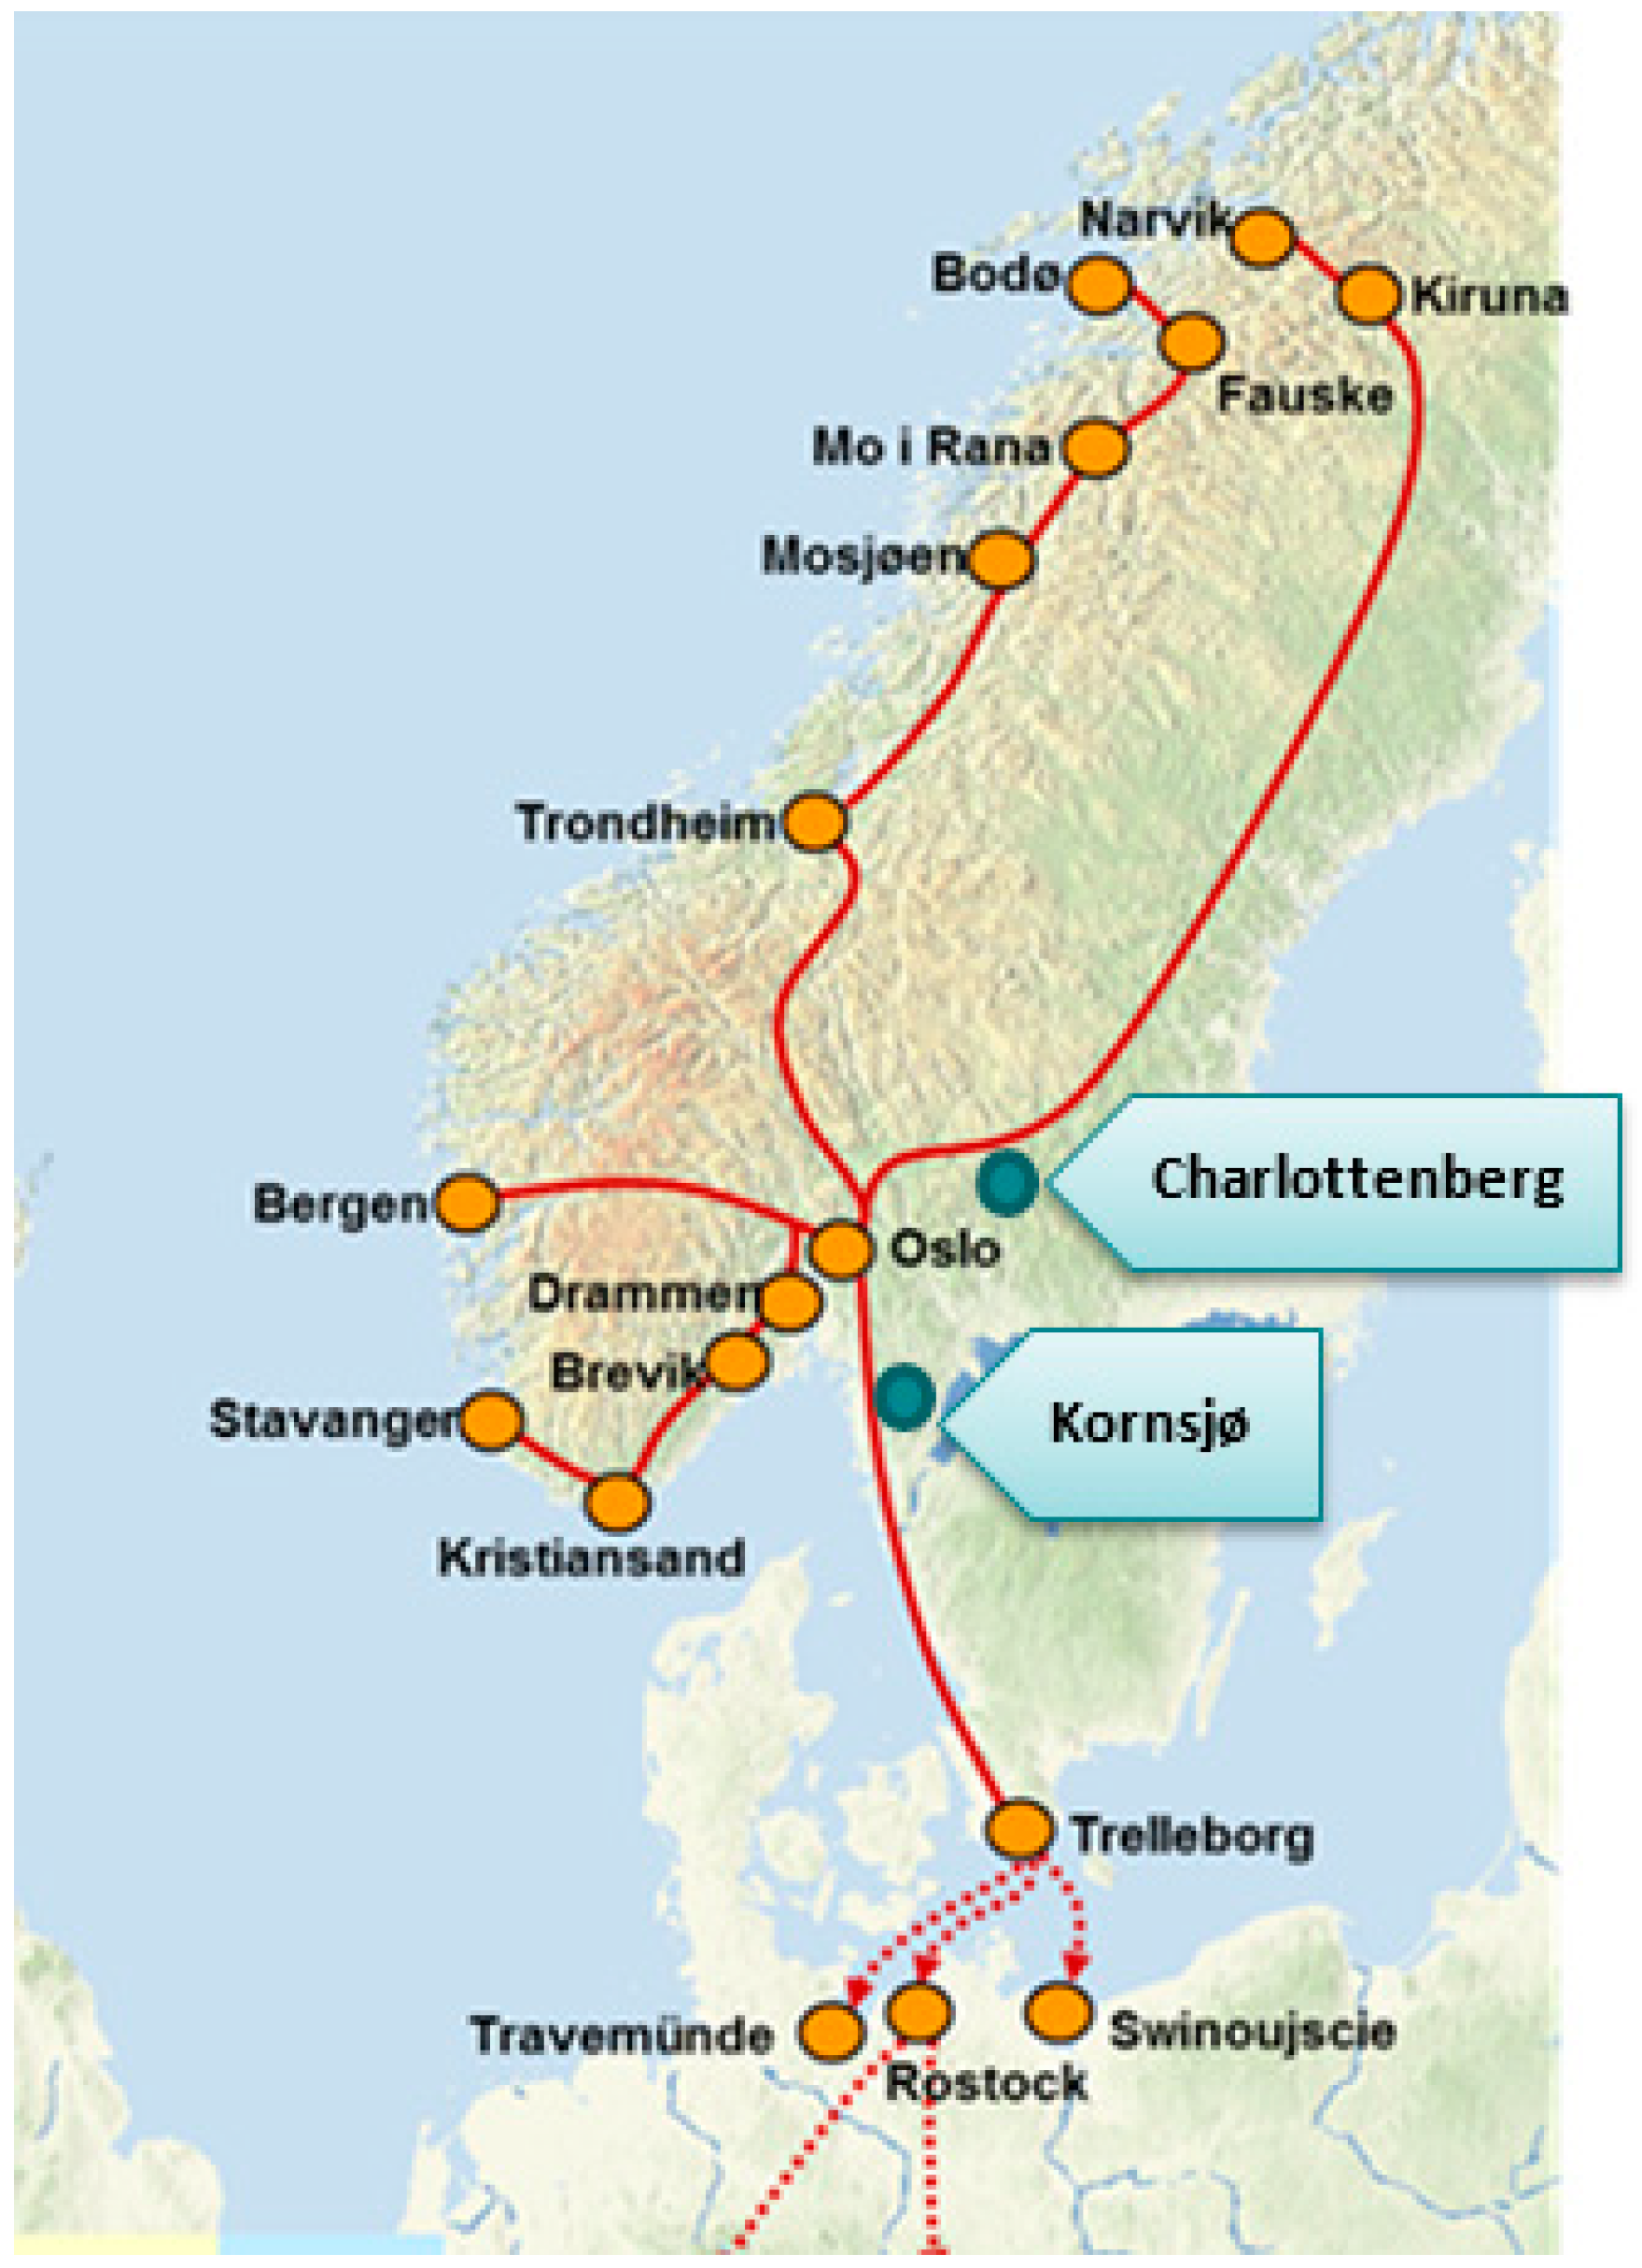
19]. Such factors can improve rail’s competitiveness versus road by reducing unit costs per tonne-km. However, the extent of cost reductions depends on whether longer trains require changes to locomotive set-ups, such as extra locomotives or by replacing four-axle locomotives (used by most operators on the Norwegian freight network) by more powerful six-axle versions.
For this scenario, we analyze effects of facilitating longer freight trains for transport to/from Norway at Kornsjø and Charlottenberg (see Figure 1). Train length allowances are set to 740 metres for combi-trains (the required allowed length on the Trans-European transport network, TEN-T, increasing from the current ca. 600 m). We further assume length allowances of 640 m on main freight relations in the Norwegian rail network, an increase from 480 m for combi-trains (containers) and wagon loads. Where most cost-effective, we assume operation of six-axled locomotives. Finally, we take into account that for longer trains to yield modal shift, freight flows in the market must be large enough to fill up the extra train capacity at the same level of service (frequency). All these changes were implemented as direct input into the NFM’s cost model and thereby the generated cost input files.

3.5. Combinations of Measures and Border-Crossing Implementation

For the following scenarios, we ran combinations of different policy measures in conjunction, and with implementations not just in Norway, Sweden, or Denmark, but in multiple countries at once. This is done to assess whether measures might complement each other and whether international harmonization might increase their effectiveness and resulting modal shifts.

3.5.1. Scenario 5: Combination of Longer Freight Trains and Norwegian Ecobonus for Rail

This fifth policy scenario combines increased freight train lengths (with operationalization as in scenario 4) with a rail ecobonus in Norwegian terminals only (as in Scenario 2).

3.5.2. Scenario 6: Idem Scenario 5, but with Rail Ecobonus also Applying in Swedish and Danish Rail Terminals

This scenario follows the fifth scenario above but assumes that the same rail terminal cost reductions as in Scenarios 2 and 5 also apply to Swedish and Danish rail terminals in the model’s network (implicitly assuming that these countries make available sufficient public funds to accommodate this). The reasoning behind this is that Norwegian and Swedish schemes respectively, provide ecobonus support based on parts of transport carried out on each country’s own territory. If transport firms or customers could receive support for the entire distance that goods are transported by rail instead of by road, this would cover a larger part of total shipping costs and (theoretically) increase the probability for modal shift.

3.5.3. Scenario 7: Combination of Road Measures, with Rail and Sea Measures in Norway

In this scenario, several policy measures are combined. We simultaneously consider the ecobonuses for sea and rail transport from Scenarios 1 and 2 (thus applying in Norway only), and the Eurovignette rate increases in Sweden and Denmark, from Scenario 3.

3.5.4. Scenario 7b: Expansion of Scenario 7 with Terminal Cost Reductions in Sweden and Denmark

To better understand effects on modal choice, we ran an additional simulation of Scenario 7, but expanding cost reductions for sea and rail as in Scenarios 1 and 2 from Norwegian, to also apply in Swedish and Danish ports and terminals. For this scenario, environmental effects were not calculated.

3.5.5. Scenario 8: Combination of Road, Rail, and Sea Measures, Coordinated for the Nordics as a Whole

In this final scenario, several policy measures are combined and coordinated for the Nordics as a whole. We consider ecobonus-induced cost reductions in both Norwegian, Swedish and Danish ports and terminals in the model’s network, together with cost increases for road freight. For the latter, we assume that increases in Eurovignette rates as in Scenario 3 (or similar cost increases) also apply within Norway. This is operationalized as increase in per-km costs for semitrailers and European Modular Systems (25.25 m vehicles) of 0.60 NOK/km in all three countries. Given an annual mileage of 100,000 km this is equal to a five-doubling of today’s Eurovignette costs. The increase is also equal to rates in a Swedish road pricing proposal as Eurovignette replacement [44], as was recently rejected by Swedish Parliament and has also been analyzed in Vierth et al. [32].

3.6. Scenario Overview

To summarize, Table 1 provides an overview of the different policy scenarios and their main assumptions.

4. Results

4.1. Introduction

This section presents effects on modal choices in the different policy measure scenarios, as well as environmental effects. Because modal shift effects of different policy measures are calculated compared to a reference scenario for 2030 (business as usual), and environmental effects in turn derived from changes in transport, we first present the distribution between transport modes in the reference scenario. For completeness, Table 2 shows this distribution both in weight (tonnes) and transport performance (tonne-km or tkm) in the reference scenario for Norwegian commodity flows, both on Norwegian and foreign territory. This is in contrast to Vierth et al. [32], who only investigated changes in the part of transport performance occurring on Swedish territory (for commodity flows with a Swedish perspective).
Changes in transport performance are often the best indicator for assessing modal shift but can in some cases also be affected by changes in transport routes yielding changes in transport distance. When looking at weight (tonnes), it is important to keep in mind that a tonne of freight that shifts from road to rail can result in a triple weight increase, since tonnes are counted for each mode of transport, resulting in an additional tonne on both rail and road, as distribution transports generally take place at both ends of the rail link using road transport. The same applies for shifts from road to sea, but since the model only counts tonnes on the Norwegian mainland, for import and export flows, tonnes might be counted double, rather than triple.
The table illustrates that for Norwegian commodity flows, transport performance in the reference scenario is dominated by sea transport. This is particularly due to large export flows of bulk goods within foreign trade (e.g., oil, gas, minerals and gravel) and, to a lesser degree, import flows. For domestic flows, transport performance for road and sea modes is calculated to be roughly equal in 2030. This is due to the smaller domestic transport volumes by sea compared to road, being transported over on average considerably larger distances. The table further illustrates that rail in general, but particularly domestically, plays a relatively small role. Large import volumes on rail are mainly related to Swedish transit flows of iron ore from Kiruna, to the Norwegian port of Narvik, which is ice-free year-round. The above implies that a relatively small modal shift for sea can, in absolute terms, be larger than a relatively large shift for e.g., rail.
Table 3, in turn, shows the distribution of energy use and emissions over transport modes in the reference scenario, for 2030.
It can be seen that energy use for freight transport is dominated by the sea mode. This is also reflected in CO2,eq emissions, where the relative contribution from rail transport is even lower because of its high share of electrification. For emissions of air pollutants, sea transport is even more dominating due to the less stringent emissions regulations here. At the same time, it should be noted that the sizable transport performance for ships means that the majority of emissions take place outside of Norway and therefore do not appear in Norway’s “climate accounts”. Further, although not shown here, sea transport generally also has particularly high SO2 emissions compared to road and rail [21], as the sulphur content in marine gasoil (ca. 1000 ppm) is much higher than in road diesel (around 6 ppm). For reasons of space, in the rest of this chapter, transport and environmental effects in the different policy scenarios are presented as percentage changes compared to the reference scenario.

4.2. Single-Measure Scenarios

Table 4 shows percentage changes in transport volume and transport performance for all transport modes, for the single-measure policy scenarios, compared to the reference for 2030. Table 5, in turn, shows resulting changes in energy use, CO2,eq emissions, NOx emissions, and particulate mass. Changes are presented and discussed for the entire transport chain of Norwegian commodity flows, i.e., it includes the parts of transport taking place both on Norwegian and on foreign territory.

4.2.1. Scenario 1: Norwegian Ecobonus for Sea Transport

From the tables, it is seen that a Norwegian ecobonus for sea transport with annual budget of NOK 150 million, yields small effects. In volume terms, sea transport increases by 0.1% (i.e., a shift of ca. 0.3 million tonnes), of which most was originally transported by road. At the same time, volumes on rail decrease slightly (about 0.04 million tonnes), while road volumes increase slightly (by ca. 0.2 million tonnes). The latter is caused by additional road transport at one or both ends of the sea link.
In terms of transport performance, sea transport also increases slightly (0.2% or ca. 1 414 million tonne-km). The observation that changes are larger in tonne-km than in tonnes indicates shifts of freight flows on distances above the average for sea. Alongside, we find small decreases in the transport performance for both road and rail transport (equivalent to 143 and 50 million tonne-km respectively), of which most are related to Norwegian territory. Transport performance for sea transport increases nearly three times more than the decrease for land-based transports. This illustrates that some of the freight transferred has origins or destinations in South-Eastern Europe, where distances to Norway by sea are much longer than for land-based transports.
Given the way that the ecobonus is modeled, the largest part of the program’s budget is found to benefit existing sea transport. If existing sea transport is held constant, and the ecobonus exclusively directed towards ‘new’ sea transport, which is the intention of the support scheme, the distribution effect would be larger.
When looking at environmental effects, we find that the sea ecobonus yields a small increase in energy use for sea transport and small decreases for road and rail, with similar percentage changes in emissions of CO2,eq, NOx, and PM. In total, CO2,eq emissions increase by 0.1% (7 ktonnes), which is a consequence of increased transport distances when shifting to seaborne transport in this scenario. Total NOx emissions and PM both increase by 0.3% (367 tonnes and six tonnes, respectively), particularly due to absolute increases for sea transport, given higher specific emissions for most ships relative to modern trucks.

4.2.2. Scenario 2: Norwegian Ecobonus for Rail Transport

For the Norwegian rail ecobonus with the same budget as the sea program above, we find considerably stronger percentage modal shifts. These shifts are largest from road to rail, but the model also predicts a decrease in sea transport in favor of rail. In volume terms, rail transport increases by almost 6% (2.4 million tonnes), while sea transport decreases by 0.1% (0.3 million tonnes). Road volumes increase slightly (0.3% or 1.3 million tonnes) due to increased distribution transport required to/from rail terminals at both ends of the transport chain.
Considering transport performance, modal shift away from road is about four times larger than in the scenario with sea ecobonus. Simultaneously, rail transport increases by 5.4% (686 million tonne-km), i.e., slightly less than the increase in tonnes. This illustrates that the ecobonus scheme affects rail transport on distances slightly below the average. For sea transport, transport performance decreases marginally (less than 0.1%, or just under 300 tonne-km).
Regarding environmental effects, modal shifts in this scenario imply that total energy use decreases by 0.4%, as increases for rail are more than offset by decreases for road and sea. Despite rail increases partially occurring on non-electrified (diesel) tracks, total CO2,eq emissions, NOx emissions, and PM show small decreases, in contrast to increases found in the sea ecobonus scenario.

4.2.3. Scenario 3: Increases in Eurovignette Rates in Sweden and Denmark

Given a five-doubling in Eurovignette rates applying in Sweden and Denmark, model simulations indicate that road transport decreases slightly (by 0.2% or 0.7 million tonnes in volume terms; by 1.9% or 813 million tonne-km in transport performance). Modal shift occurs both to sea and rail modes, with sea transport increasing by 0.1% both in volume and transport performance (i.e., 0.4 million tonnes; 806 million tonne-km). Rail transport sees a larger volume increase (3.2% or 1.3 million tonnes) and transport performance increase (2.9%), although in absolute terms, transport performance increases less than for sea, at 362 million tonne-km. This is due to the lower base in the reference scenario.
A breakdown of transport performance effects regionally (i.e., a subset of total effects presented here and for which more background documents and references are available in [46]) indicates that Eurovignette rate increases in Sweden and Denmark mainly reduce road transport related to Norwegian transit through Sweden, illustrating that route choices between southern and northern parts of Norway will be affected.
Further, we find that the changes in transport yield slight decreases in total energy use (0.6%) and CO2,eq emissions (0.7%), alongside a slight increase of NOx emissions and PM due to the increase of sea transport.

4.2.4. Scenario 4: Longer Freight Trains

In the scenario with longer freight trains, we find the largest shift to rail of the single-measure scenarios (8.2% volume increase, or 3.4 million tonnes; 38.2% transport performance increase, or 4823 million tonne-km). Larger percentage increases in tonne-km than in tonnes illustrate that particularly goods on longer distances are transferred to rail. Transports are shifted to rail both from road and from sea, with transport performance by road transport decreasing by 6.8% (2 864 million tonne-km) and for sea by 0.3% (1978 million tonne-km).
These modal shifts imply a decrease in total energy use of 2.6% relative to the reference scenario. Decreases are also found in terms of CO2,eq (293 ktonnes), NOx (967 tonnes) and PM (13 tonnes).

4.3. Impacts of Policy Packages and Border-Crossing Measures

Similar to the discussion above, Table 6 shows changes in transport compared to the 2030 reference, but now for the scenarios with policy packages/border-crossing measures, to assess whether this yields stronger effects. Table 7 shows resulting changes in energy use and environmental emissions.

4.3.1. Scenario 5: Combination of Longer Freight Trains and Norwegian Ecobonus for Rail

When combining longer freight trains with a rail ecobonus in Norwegian terminals, model simulations predict a large increase in rail transport (12.2% or 5.1 million tonnes in volume terms; over 47% or almost 6000 million tonne-km in transport performance). This increase is caused by shifts away from both road and sea transport. Road transport is calculated to decrease by 8.2% (3457 million tonne-km), while sea transport decreases by 0.4% (2429 million tonne-km). Compared to the partial effects of each of these policy measures in sum (i.e., the sum of Scenarios 2 and 4), combining them yields a larger modal shift in total: although modal shift away from road is nearly the same, combining the measures yields some additional modal shift from sea to rail.
Considering energy use, modal shift in this combination scenario results in about a 3.1% decrease, because a large increase in energy use for rail is more than offset by decreases, particularly for the less energy efficient road mode. Further, total CO2,eq emissions decrease by around 3.6% (353 ktonnes), and NOx emissions and PM by about 1% (1160 and 15 tonnes respectively).

4.3.2. Scenario 6: Idem Scenario 5, but the Norwegian Rail Ecobonus also Applying in Swedish and Danish Rail Terminals

When expanding the previous scenario with rail terminal cost reductions applied not only in Norwegian, but also in Swedish and Danish terminals, we find only a marginally larger reduction in road transport (of 8.3% or 3485 million tonne-km), while also transport volumes and performance for the rail and sea modes remain nearly the same. As a result, environmental effects in the fifth and sixth scenario are almost equal as well. It should be noted that in this scenario it is assumed that in addition to the Norwegian Government, also the Swedish and Danish Governments make public funds available to reduce terminal costs in their countries, but that the effect, at least through Norwegian commodity flows, seems marginal.

4.3.3. Scenario 7: Combination of Road Measures, with Rail and Sea Measures in Norway

When combining both sea and rail ecobonuses in Norwegian ports/terminals with Eurovignette rate increase in Sweden and Denmark (corresponding to Scenarios 1, 2, and 3 in total), we find small increases in road and sea volumes (both 0.2% or 0.7 and 0.5 million tonnes respectively), and an increase for rail (6.8%; 2.8 million tonnes). In transport performance terms, road transport decreases by 3.6% (1524 million tonne-km), while both sea (0.3%; 1975 million tonne-km) and rail transport (7.2%; 904 million tonne-km) increase. Because of changes in where transport takes place geographically, increases in transport performance for rail and sea in sum are larger than the reduction for road transport. Compared to the sum of partial effects of each measure, combining them yields a marginally smaller modal shift in total, with a slightly larger increase in transport performance by sea, and a slightly smaller increase for rail. This illustrates that the Norwegian ecobonuses for rail and sea, respectively, only to a minor degree attract some of the same freight flows. When both bonuses appear as possibility, the sea ecobonus seems to be marginally more attractive than the rail ecobonus. These results suggest an effective design of the three policy measures, as they each mostly affect different transport flows.
Environmentally, modal shifts in this scenario yield a reduction in total energy use of 0.8%, reducing CO2,eq emissions by 1.1% (111 ktonnes). NOx emissions and PM, however, both increase slightly, particularly driven by the increases in sea transport with higher specific emissions. In isolation (sum of scenario 1, 2 and 3), the policy measures yield a slightly larger decrease in energy use and CO2,eq emissions, and slightly smaller increases in NOx emissions and PM, than when the policy measures are combined.

4.3.4. Scenario 7b: Expansion of Scenario 7 with Terminal Cost Reductions in Sweden and Denmark

When expanding ecobonus-induced terminal cost reductions from a national level (scenario 7) to the Nordic level (this additional simulation), we find a slightly larger increase in road volumes (0.4% or 1.4 million tonnes) and rail volumes (7.6% or 3.2 million tonnes), while sea volumes decrease (0.4% or 0.9 million tonnes). In terms of transport performance, however, we find stronger decreases for road transport (5% or 2117 million tonne-km) and stronger increases for rail transport (12.5% or 1580 million tonne-km). We further find (not shown here) that the additional transport performance decrease for road, and increase for rail transport, almost exclusively take place outside of Norway. For sea transport, however, almost half of the decrease in transport performance takes place on Norwegian territory.
These results indicate that a harmonization of ecobonuses for rail and sea to the three Nordic countries yields additional modal shift away from road, particularly to rail. Simultaneously, increasing the ecobonus for both rail and sea transport seems to increase the competitiveness for rail compared to sea transport, resulting in transfers from sea to rail. This is in contrast to the result we found in Scenarios 5 and 6, where harmonization of the rail ecobonus yielded only marginal additional effects. Therefore, it seems that increasing train lengths will further increase the competitiveness of rail and make the impact of the ecobonus stronger. The cause for this is that increased train lengths result in decreased costs for rail, which means that the ecobonus now adds a more significant cost reduction in relative terms. This further illustrates that in order to achieve such a significant effect, alternatively to increase train lengths, ecobonus rates may be increased.

4.3.5. Scenario 8: Combination of Road, Rail and Sea Measures, Coordinated for the Nordics as a Whole

Finally, we look at the combination of rail terminal and port cost reductions applying in Norway, Sweden and Denmark, and road cost increases no longer applying only in Sweden and Denmark, but also in Norway. This policy scenario is found to yield a strong decrease in road transport (of 6.5% or 2712 million tonne-km) and further a decrease for sea transport (of 0.2%; 1311 million tonne-km), while the rail mode increases by 16.6% (2095 million tonne-km). As a result, total energy use is calculated to decrease by 2.1%, and CO2,eq emissions by 2.5% (252 ktonnes). Alongside, NOx emissions decrease slightly (by 0.3%, 327 tonnes), as does PM (by 0.2%, 3 tonnes).
Compared to scenarios 7 and 7b, policy measures in this scenario are considerably stronger. Not surprisingly, the road cost increases result in a considerably larger shift away from road. Further, the increase for rail more than doubles, while sea transport decreases further compared to scenario 7b. A factor contributing to the latter is that distribution transports using road at the start/end of transport chains become more expensive per km, and that distribution transports for a part of freight flows, particularly abroad in Continental Europe, have longer distances to/from ports than for rail terminals.
Regarding environmental effects, reductions in energy use and CO2,eq emissions are around 2.5 times larger than in Scenario 7, following shifts to overall more efficient modes. NOx emissions and PM also decrease. Reasons for this are particularly the decrease in transport performance for ships.

5. Discussions and Conclusions

5.1. Induced Modal Shift Through Combinations of Policy Measures

In light of underachievement on modal shift objectives and too little progress in reducing CO2 emissions from freight transport given climate commitments [8], a recurrent theme with both policy-makers and scholars has been how more modal shift can be achieved than has so far been the case. In this article, we analyzed the effects of strengthening existing policy instruments for transferring freight transport from road to sea and rail, and of harmonizing policy-instruments across borders between Norway, Sweden and Denmark, for potentially more effect.
From our simulation of policy scenarios, we find that a Norwegian ecobonus scheme for rail yields much larger modal shifts away from road transport than a similar ecobonus for sea transport. The rail ecobonus also yields positive environmental effects, with small reductions in emissions of CO2,eq, NOx and PM, rather than minor increases under the sea ecobonus scheme. This is due to the high degree of electrification of the rail mode, and because with the sea ecobonus, more transport performance is added on sea than reduced on road, due to longer distances stemming from the location of the transferred goods. Further, most ships have higher specific NOx and PM emissions relative to modern trucks.
Significant increases in Eurovignette rates in Sweden and Denmark also result in reduced road transport, mostly through shifts from road to rail and particularly by affecting road route choices between southern and northern Norway, shifting from transit through Sweden to transport within Norway. As a whole, however, modal choice and environmental effects are limited. Allowing longer freight trains, in turn, has a larger impact on modal choice than the ecobonus schemes and road cost increases, and also yields larger decreases of environmental emissions. However, the infrastructure investments required are expected to entail much higher policy costs for government [29].
Combining a Norwegian rail ecobonus with policy measures facilitating longer trains yields slightly stronger effects than the sum of effects when the measures are studied in isolation, by causing some additional shifts from sea to rail. However, further expansions, by applying ecobonus-induced cost reductions also in Swedish and Danish rail terminals, only result in a marginally larger reduction in road transport. This suggests that harmonizing the rail ecobonus across the Nordic countries yields little additional effects, despite requiring the use of more public funds. Most likely, this is due to distances between the Nordic countries being too short to exploit rail transport’s main benefits and to overcome inherent weaknesses, such as (expensive) road dependency at origin and/or destination and long lead times [6].
Combining both sea and rail ecobonuses in Norwegian ports and terminals with Eurovignette rate increases in Sweden and Denmark gives strong modal shifts from road to rail, and smaller shifts to sea transport. Because of different distances for different modes on different relations, tonne-km increases for rail and sea transport in sum are larger than the reduction in tonne-km by road, as a result of the relations with changes in mode choice. While the increased use of rail results in reduced CO2,eq emissions, emissions of air pollutants increase due to increased use of ships. In many cases, however, sea transport will have shorter distances than land-based transport between Norway and the European Continent, suggesting that effects of measures might be case-specific, and that emissions in many situations could decrease.
When additionally expanding sea and rail ecobonuses to apply also in Swedish and Danish terminals, results suggest that such harmonization yields additional modal shift away from road, particularly to rail. Simultaneously, such expansions of both rail and sea ecobonuses seem to increase rail’s competitiveness versus sea transport, resulting in transfers from sea to rail. This contrasts findings from Scenarios 5 and 6, where harmonization of the rail ecobonus yielded only marginal additional effects.
Finally, a harmonization of ecobonuses for both sea and rail, combined with a per km-charge for road transport in all three Nordic countries, results in minor additional modal shifts compared to the previous scenarios. This is followed by a decrease in CO2,eq emissions and somewhat larger decreases in emissions of air pollutants.
Our results suggest that in some, but not all cases, harmonization of policy measures such as ecobonuses may strengthen effects of modal shift policy, depending on transit traffic and border-crossing effects.

5.2. Environmental and Other Considerations

Altogether, most scenarios show reduced environmental emissions, particularly when policy measures are combined and/or include the facilitation of longer freight trains. However, even in scenarios with rather strong policy measures, reductions in CO2,eq emissions do not exceed 3.6% in 2030. This indicates that modal shift can only be a moderate contributor to the decarbonization of freight transport, and is in line with observations by e.g., Tao et al. [1], Kaack et al. [5], Pinchasik et al. [8], and McKinnon [11].
Moreover, in several scenarios, we find increased air pollution. This is due to increases in sea transport, which has higher specific emissions of NOx and PM. Policy makers aiming at modal shift should therefore also consider other environmental impacts than CO2. Further, in line with Bouchery and Fransoo [23], maximizing modal shift is not necessarily optimal for reducing CO2 emissions. As intermodal transport in some cases increases transport distances compared to direct truck transport, environmental effects of modal shift depend on a trade-off between efficiency gains and losses due to longer transport distances (as well as mode-specific changes).
However, it should be noted that even when modal shift measures do not yield large effects for society as a whole, governments may find them desirable for other reasons. An example from Norway includes a fear that without measures, even more rail freight routes might be cancelled. Moreover, modal shift may be considerable in specific transport corridors where rail or sea is desirable. Further, even when emissions and mode choice for the whole of transport chains do not change much, countries might have an interest in what happens on their own domestic territory.

5.3. Policy Design, Developments, Assumptions, and Uncertainty

Lessons learned from the analysis are that support schemes such as the ecobonuses for rail and sea must be designed such, that they are only paid out if the support results in a (new) modal shift away from road transport. Based on Norwegian freight flows, we find that harmonizing over the borders of the Nordic countries would do this in some, but not all cases, when it comes to Norwegian freight flows. However, what is not analyzed here is the impact of the assessed policy measures on Swedish and Danish freight flows, which can make it possible to establish new shipping or rail routes that can attract goods from the Nordics as a whole. In this regard, implemented policy measures should be evaluated and findings shared between the Nordic countries, as this may improve the design of new policies.
Given this study’s conclusions, it is appropriate to remember that model simulations do not capture all societal trends. There are at least three megatrends that strengthen the competitive position of road transport and trucks [14]: Establishment and use of Nordic distribution centers, increased use of transport firms from lower-wage countries for border-crossing transports, and increases in vehicle dimensions in terms of weight and length [8]. These developments have improved the competitive position of road transport and are particularly relevant because wage expenses constitute a larger share of total transport costs for trucks than for rail or sea transport. Policy makers should therefore take into account that, while measures such as larger allowances for vehicle dimensions might improve the efficiency of road transport, they also make road transport more competitive versus rail and sea.
As all projections about the future, developments in important drivers and assumptions are subject to uncertainty. In our analysis, important factors are particularly the employed emission factors, commodity flows and projections of these toward 2030, and an assumption of equal developments in future costs for the different transport modes.
With regard to emission factors, we for example assumed that electric trains use a Norwegian electricity mix, which, due to its renewables share, implies relatively large environmental benefits (both CO2 and air pollutants) when shifting from sea/road to rail transport. Different electricity mixes, e.g., based on electricity production using natural gas, would yield smaller, albeit still positive environmental benefits from modal shifts to rail. Similarly, we assumed that the share of electric trucks is still small by 2030 [40]. A large-scale introduction of electric or significantly more efficient vehicles (e.g., resulting from recently adopted emission standards for heavy-duty vehicles [47]), or a higher blend-in requirement of biofuels, would make the environmental benefits of modal shifts away from road, smaller.
Regarding cost development, deviations from our assumptions can affect the competitive position of different modes, and where this competitiveness change is large enough, result in a mode change. Examples could include cost increases (decreases) from a different technology uptake track, further increases in vehicle dimensions, regulation disproportionally affecting one mode (e.g., emission requirements), fuel requirements, levy increases on fossil fuels, etc.
Finally, commodity flows may develop differently than projected, both in volume terms as well as with regard to origins/destinations and relative changes between commodities. This may have implications for how much transport takes place, where, and by which mode. Depending on the deviation from projections, this may imply both increases and decreases in transport performance overall, and for different modes. The same applies to environmental effects. Altogether, uncertainty may therefore have an impact on results. For many factors, this impact will likely not be very large.

Author Contributions

Conceptualization, I.B.H.; Data curation, S.E.G., E.F. and M.J.; Formal analysis, D.R.P., I.B.H., C.S.M., S.E.G., E.F. and M.J.; Funding acquisition, I.B.H. and C.S.M.; Investigation, D.R.P., I.B.H., C.S.M., S.E.G., E.F. and M.J.; Project administration, D.R.P., I.B.H. and C.S.M.; Supervision, D.R.P., I.B.H. and C.S.M.; Validation, I.B.H.; Visualization, D.R.P. and C.S.M.; Writing—original draft, D.R.P. and I.B.H.; Writing—review and editing, D.R.P., I.B.H., C.S.M., S.E.G., E.F. and M.J. All authors have read and agreed to the published version of the manuscript.

Funding

This work was performed and funded within two projects: the first, a Nordic freight analysis, was funded by the Norwegian Public Road Administration, Norwegian Railway Administration, Norwegian Coastal Administration, Avinor and Nye Veier AS; the other, a Nordic Flagship Project SHIFT, was funded by Nordic Energy Research (grant number 77892). Article writing was further co-funded through a strategic institute program at the Institute of Transport Economics (Sustainable transport solutions of the industry) and PLATON (a platform for open and nationally accessible climate policy knowledge), funded by the Norwegian Research Council (grant number 295789).

Acknowledgments

The authors would like to thank Anne Madslien and Christian Steinsland (Institute of Transport Economics, Norway) for facilitation of and assistance with running NFM simulations and Sebastian Bäckström and Hulda Winnes (IVL Swedish Environmental Research Institute) for data curation contributions regarding the modelling of environmental effects through sea and rail transport.

Conflicts of Interest

The authors declare no conflict of interest.

References

  1. Tao, X.; Wu, Q.; Zu, L. Mitigation potential of CO2 emissions from modal shift induced by subsidy in hinterland container transport. Energ. Policy 2017, 101, 265–273. [Google Scholar] [CrossRef]
  2. European Commission. Roadmap to a Single European Transport Area—Towards a competitive and resource efficient transport system. Available online: https://eur-lex.europa.eu/legal-content/EN/TXT/PDF/?uri=CELEX:52011DC0144&from=EN (accessed on 15 November 2019).
  3. Norwegian Government. Jeløya-plattformen. Available online: https://www.regjeringen.no/no/dokumenter/politisk-plattform/id2585544/ (accessed on 15 November 2019).
  4. Auditor General of Norway. Riksrevisjonens undersøkelse av overføring av godstransport fra vei til sjø og bane. Available online: https://www.riksrevisjonen.no/globalassets/rapporter/no-2017-2018/godstransport.pdf (accessed on 15 November 2019).
  5. Kaack, L.H.; Vaishnav, P.; Granger Morgan, M.; Azevedo, I.L.; Rai, S. Decarbonizing intraregional freight systems with a focus on modal shift. Environ. Res. Lett. 2018, 13, 1–29. [Google Scholar] [CrossRef]
  6. Islam, D.M.Z.; Jackson, R.; Hagen Zunder, T.; Burgess, A. Assessing the impact of the 2011 EU Transport White Paper—A rail freight demand forecast up to 2050 for the EU27. Eur. Transp. Res. Rev. 2015, 7, 1–9. [Google Scholar] [CrossRef] [Green Version]
  7. Marzano, V.; Tocchi, D.; Papola, A.; Aponte, D.; Simonelli, F.; Cascetta, E. Incentives to freight railway undertakings compensating for infrastructural gaps: Methodology and practical application to Italy. Transp. Res. A Pol. 2018, 110, 177–188. [Google Scholar] [CrossRef]
  8. Pinchasik, D.R.; Hovi, I.B.; Vierth, I.; Mellin, A.; Liimatainen, H.; Kristensen, N.B. Measures for Reduced CO2-Emissions from Freight Transport in the Nordic Countries; Report for Nordic Council of Ministers; TemaNord: Copenhagen, Denmark, 2019. [Google Scholar]
  9. Sanches Rodrigues, V.; Piecyk, M.; Mason, R.; Boenders, T. The longer and heavier vehicle debate: A review of empirical evidence from Germany. Transp. Res. D TR E 2015, 40, 114–131. [Google Scholar] [CrossRef]
  10. Alises, A.; Vasallo, J.M. Comparison of road freight transport trends in Europe. Coupling and decoupling factors from an Input-Output structural decomposition analysis. Transp. Res. A Pol. 2015, 82, 141–157. [Google Scholar] [CrossRef]
  11. McKinnon, A. Freight transport in a low-carbon world: Assessing opportunities for cutting emissions. TR News 2016, 306, 5–15. [Google Scholar]
  12. Meers, D.; van Lier, T.; Macharis, C. Longer and heavier vehicles in Belgium: A threat for the intermodal sector? Transp. Res D TR E 2018, 61, 459–470. [Google Scholar] [CrossRef]
  13. Vierth, I.; Lindgren, S.H.; Lindgren, H. Vehicle Weight, Modal Split and Emissions—An Ex-Post Analysis for Sweden. Sustainability 2018, 10, 1731. [Google Scholar] [CrossRef] [Green Version]
  14. Mjøsund, C.S.; Pinchasik, D.R.; Grønland, S.E.; Hovi, I.B. Nordiske virkemidler for overføring av godstransport fra veg til sjø og bane. Available online: https://www.toi.no/getfile.php?mmfileid=50612 (accessed on 15 November 2019).
  15. National Transport Agencies. Available online: https://www.ntp.dep.no/Nasjonale+transportplaner/2018-2029/Godsprosjektet (accessed on 15 November 2019).
  16. Madslien, A.; Steinsland, C.; Grønland, S.E. Nasjonal godstransportmodell. En innføring i bruk av modellen. Available online: https://www.toi.no/getfile.php?mmfileid=43020 (accessed on 15 November 2019).
  17. Grønland, S.E. Kostnadsmodeller for transport og logistikk—Basisår 2016. Available online: https://www.toi.no/getfile.php/1348553/Publikasjoner/T%C3%98I%20rapporter/2018/1638-2018/1638-2018_sammendrag.pdf (accessed on 15 November 2019).
  18. Hovi, I.B. Varestrømmer i Norge—en komponent i Nasjonal godsmodell. Available online: https://www.vegvesen.no/_attachment/2662132/binary/1322345?fast_title=varestr%C3%B8mmer+i+Norge+%E2%80%93+en+komponent+i+Nasjonal+godsmodell.pdf (accessed on 15 November 2019).
  19. Islam, D.M.Z.; Ricci, S.; Nelldal, B.-L. How to make modal shift from road to rail possible in the European transport market, as aspired to in the EU Transport White Paper 2011. Eur. Transp. Res Rev. 2016, 8, 1–14. [Google Scholar] [CrossRef] [Green Version]
  20. Engström, R. The roads’ role in the freight transport system. Transp. Res. Proc. 2016, 14, 1443–1452. [Google Scholar] [CrossRef] [Green Version]
  21. Rogerson, S.; Santén, V.; Svanberg, M.; Williamson, J.; Woxenius, J. Modal shift to inland waterways: Dealing with barriers in two Swedish cases. Int. J. Logist. Res. App. 2019, 1–16. [Google Scholar] [CrossRef]
  22. Salvucci, R.; Gargiulo, M.; Karlsson, K. The role of modal shift in decarbonising the Scandinavian transport sector: Applying substitution elasticities in TIMES-Nordic. Appl. Energy 2019, 253, 113593. [Google Scholar] [CrossRef]
  23. Bouchery, A.; Fransoo, J. Cost, carbon emissions and modal shift in intermodal network design decisions. Int. J. Prod. Econ. 2015, 164, 388–399. [Google Scholar] [CrossRef]
  24. Norwegian Government. Revidert nasjonalbudsjett 2019: Foreslår midlertidig støtteordning for gods på jernbane. Available online: https://www.regjeringen.no/no/aktuelt/foreslar-midlertidig-stotteordning-for-gods-pajernbane/id2645287/ (accessed on 15 November 2019).
  25. Mutlu, A.; Kayikci, Y.; Çatay, B. Planning Multimodal Freight Transport Operations: a Literature Review. In Proceedings of the 22nd International Symposium on Logistics, Ljubljana, Slovenia, 9–12 July 2017; Pawar, K.S., Potter, A., Lisec, A., Eds.; pp. 535–542. [Google Scholar]
  26. Nocera, S.; Cavallaro, F.; Irranca Galati, O. Options for reducing external costs from freight transport along the Brenner corridor. Eur. Transp. Res. Rev. 2018, 10, 1–18. [Google Scholar] [CrossRef] [Green Version]
  27. McKinnon, A. The role of government in promoting green logistics. In Green Logistics: Improving the Environmental Sustainability of Logistics; McKinnon, A., Cullinane, S., Browne, M., Whiteing, A., Eds.; Kogan Page: London, UK, 2010; pp. 341–360. [Google Scholar]
  28. Meers, D.; Macharis, C. Prioritization in modal shift: determining a region’s most suitable freight flows. Eur. Transp. Res. Rev. 2015, 7, 1–12. [Google Scholar] [CrossRef] [Green Version]
  29. Paulsson, B.; Ekberg, A.; Elfgren, L. Upgrading of freight railways to meet operational and market demands. In Proceedings of the 7th Transport Research Arena TRA 2018, Vienna, Austria, 16–19 April 2018. [Google Scholar]
  30. Jonkeren, O.; Francke, J.; Visser, J. A shift-share based tool for assessing the contribution of a modal shift to the decarbonisation of inland freight transport. Eur. Transp. Res. Rev. 2019, 11, 1–15. [Google Scholar] [CrossRef]
  31. de Jong, G.; Ben-Akiva, M.; Jaap, B.; Grønland, S.E. Method Report—Logistics model in the Norwegian National Freight Model System (Version 3). Available online: https://www.vegvesen.no/_attachment/2662110/binary/1322329?fast_title=Method+Report+-+Logistics+Model+in+the+Norwegian+National+Freight+Model+System+%28Version+3%29.pdf (accessed on 15 November 2019).
  32. Vierth, I.; Karlsson, R.; Linde, T.; Cullinane, K. How to achieve less emissions from freight transport in Sweden. Marit Bus. Rev. 2019, 4, 4–15. [Google Scholar] [CrossRef]
  33. Hovi, I.B.; Hansen, W.; Jordbakke, G.N.; Madslien, A. Fremskrivninger for godstransport i Norge, 2016–2050. Available online: https://www.toi.no/getfile.php?mmfileid=44755 (accessed on 15 November 2019).
  34. Norwegian Ministry of Finance. Perspektivmeldingen. Proposition for Parliament, nr. 29 (2016–2017). Available online: https://www.regjeringen.no/no/dokumenter/meld.-st.-29-20162017/id2546674/ (accessed on 24 January 2020).
  35. Hansen, W. Transport and the Spatial Economy: Developing a Spatial Computable General Equilibrium model for analysis of Wider economic impacts. Ph.D. Thesis, Molde University College, Molde, Norway, March 2019. [Google Scholar]
  36. IFEU. Ecological Transport Information Tool for Worldwide Transports (EcoTransit), Methodology and Data. Update 2018. Available online: https://www.ecotransit.org/download/EcoTransIT_World_Methodology_ShortVersion_2018.pdf (accessed on 4 December 2019).
  37. IHS. SeaWeb. Available online: http://www.sea-web.com/authenticated/seaweb_subscriber_welcome.aspx (accessed on 16 December 2019).
  38. IMO. Third IMO GHG Study; International Maritime Organization (IMO). Available online: http://www.imo.org/en/OurWork/Environment/PollutionPrevention/AirPollution/Documents/Third%20Greenhouse%20Gas%20Study/GHG3%20Executive%20Summary%20and%20Report.pdf (accessed on 4 December 2019).
  39. Cooper, D.; Gustafsson, T. Methodology for Calculating Emissions from Ships: 2. Emission Factors for 2004 Reporting. Available online: https://www.diva-portal.org/smash/get/diva2:1117169/FULLTEXT01.pdf (accessed on 4 December 2019).
  40. Fridstrøm, L. Framskriving av kjøretøyparken i samsvar med nasjonalbudsjettet 2019. Available online: https://www.toi.no/getfile.php?mmfileid=50202 (accessed on 15 November 2019).
  41. Halse, A.H.; Mjøsund, C.S.; Killi, M.; Flügel, S.; Jordbakke, G.N.; Hovi, I.B.; Kouwenhoven, M.; de Jong, G. Bedrifters verdsetting av raskere og mer pålitelig transport. Available online: https://www.toi.no/getfile.php?mmfileid=50067 (accessed on 15 November 2019).
  42. Godsalliansen. 50 millioner til godsoverføring fra vei til sjø. Available online: https://godsalliansen.no/pm-millioner-til.php (accessed on 16 December 2019).
  43. Tsamboulas, D.; Chiapetta, A.; Moraiti, P.; Karousos, I. Could Subsidies for Maritime Freight Transportation Achieve Social and Environmental Benefits?: The Case of Ecobonus. Transp. Res. Rec. 2015, 2479, 78–85. [Google Scholar] [CrossRef]
  44. Swedish Government. Vägskatt: SOU 2017:11. Available online: https://www.regeringen.se/rattsliga-dokument/statens-offentliga-utredningar/2017/02/sou-201711/ (accessed on 15 November 2019).
  45. Australian Department of the Environment and Energy. One Petajoule (PJ) Explained. Available online: https://www.energy.gov.au/sites/default/files/2016-australian-energy-statistics-info3.pdf (accessed on 16 December 2019).
  46. Nordic Energy Research. Final Report: Shift Project Summary. Available online: https://www.nordicenergy.org/article/final-report-shift-project-summary/ (accessed on 13 January 2020).
  47. European Parliament. CO2 Emission Performance Standards for New Heavy Duty Vehicles: European Parliament Legislative Resolution of 18 April 2019. Available online: http://www.europarl.europa.eu/doceo/document/TA-8-2019-0426_EN.html (accessed on 15 November 2019).
Figure 1. Illustration of combi-terminals in the Norwegian freight railway network. Adapted from: https://www.cargonet.no/tjenester/kombinerte-transporter/.
Sustainability 12 00894 g001
Table 1. Main assumptions used for the different scenarios calculated using the National Freight Model, presented as change compared to the “business-as-usual” reference.
Scen.Short DescriptionModes InfluencedChange
1Norwegian ecobonus for seaSeaReduction in freight levy up to NOK 7/tonne for general cargo and container ships in Norwegian ports.
2Norwegian ecobonus for railRailReduction in terminal costs of NOK 15/tonne for combi-trains in Norwegian terminals.
3Eurovignette rate increases SE, DKRoadIncreased costs of NOK 360 per truck for driving into/out of Norway.
4Longer freight trainsRail740 m lengths for combi-trains into/out of Norway. 640 m on main relations in Norway. Opening of terminals in Sweden, Denmark and Western-Europe for rail transport to/from Norway.
5Combination of longer freight trains and Norwegian ecobonus for railRailIdem to scenario 4. In addition, reduction in terminal costs of NOK 15/tonne for combi-trains in Norwegian terminals as in scenario 2.
6Combination of longer freight trains and rail ecobonus also applying in SE, DKRailIdem to scenario 4. In addition, reduction in terminal costs of NOK 15/tonne for combi-trains in Norwegian, but now also in Swedish and Danish rail terminals.
7Combination of road measures, with rail/sea measures in NorwaySeaIdem to Scenario 1.
RailIdem to Scenario 2.
RoadIdem to Scenario 3.
7bExpansion of scenario 7 with terminal cost reductions in Sweden and DenmarkSeaIdem to scenario 1, but with equal reduction in freight levy also applying in Swedish and Danish ports.
RailIdem to Scenario 2, but with equal reduction in terminal costs also applying in Swedish and Danish terminals
RoadIdem to Scenario 3.
8Combination of road, rail and sea measures (coordinated for Nordics as a whole)SeaReduction in freight levy up to NOK 7/tonne for general cargo and container ships in Norwegian ports, but now also in Swedish and Danish ports.
RailReduction in terminal costs of NOK 15/tonne for combi-trains in Norwegian terminals, but now also in Swedish and Danish rail terminals.
RoadIncreased costs of NOK 0.60/km for semitrailers and European Modular Systems in all Nordic countries
Table 2. Norwegian commodity flows, domestically and through foreign trade. Transport volume (in million tonnes) and transport performance (in million tonne-km), reference scenario for 2030.
Transport Volume (Million Tonnes)Transport Performance (Million tonne km)
RoadSeaRailFerryTotalRoadSeaRailTotal
Domestic366.952.112.60.0431.627,72527,757472360,205
Export6.7160.92.80.5170.95185505,5361612512,333
Import11.332.726.21.571.79074134,8636291150,228
TOTAL384.9245.741.62.0674.241,984668,15612,626722,766
Table 3. Energy use, CO2,eq emissions, NOx emissions, and PM from road, sea, and rail transport in reference scenario, for 2030, domestic and foreign trade for Norwegian commodity flows in total.
RoadSeaRailTotal
Energy use (PJ) *691263198
CO2,eq emissions (ktonnes) **39695994349998
NOx emissions (t)5682104,693151110,526
PM (t)65180161872
* One PJ (petajoule) is 1015 joules or 278 gigawatthours [45]. ** kt (kilotonne) equals 1000 metric tonnes.
Table 4. Single-measure policy scenarios: modal shift in percent, for transport volume and transport performance respectively, compared to reference for 2030.
Change in Transport VolumeChange in Transport Performance
ScenShort DescriptionRoadSeaRailRoadSeaRail
1Norwegian ecobonus for sea0.05%0.1%−0.1%−0.3%0.2%−0.4%
2Norwegian ecobonus for rail0.3%−0.1%5.9%−1.4%0.0%5.4%
3Eurovignette rate increases SE, DK−0.2%0.1%3.2%−1.9%0.1%2.9%
4Longer freight trains0.1%−0.6%8.2%−6.8%-0.3%38.2%
Table 5. Single-measure policy scenarios: percentage changes in energy use, CO2,eq, NOx, and PM compared to reference for 2030.
Change in Energy UseChange in CO2,eq EmissionsChange in NOx EmissionsChange in PM
ScenShort DescriptionRoadSeaRailTotalRoadSeaRailTotalRoadSeaRailTotalRoadSeaRailTotal
1Norwegian ecobonus for sea−0.3%0.4%−0.4%0.1%−0.3%0.3%−0.4%0.1%−0.3%0.4%−0.3%0.3%−0.3%0.4%−0.4%0.3%
2Norwegian ecobonus for rail−1.4%−0.1%6.7%−0.4%−1.4%−0.1%14.5%−0.5%−1.3%-0.1%16.9%−0.1%−1.3%−0.1%8.0%−0.1%
3Eurovignette rate increases SE, DK−1.9%0.2%2.7%−0.6%−1.9%0.2%1.9%−0.7%−2.0%0.2%1.6%0.1%−2.1%0.2%2.5%0.1%
4Longer freight trains−6.7%−0.5%35.6%−2.6%−6.7%−0.5%12.6%−3.0%−7.1%-0.5%5.5%−0.9%−7.3%−0.5%31.8%−0.8%
Table 6. Combined-measure policy scenarios: modal shift in percent, for transport volume and transport performance respectively, compared to reference for 2030.
Scen.Short descriptionChange in Transport Volume (in Percent), Compared to ReferenceChange in Transport Performance (in Percent) in Total, Compared to Reference
RoadSeaRailRoadSeaRail
5Combination of longer freight trains and Norwegian ecobonus for rail0.4%−0.8%12.2%−8.2%−0.4%47.4%
6Combination of longer freight trains and rail ecobonus also applying in SE, DK0.4%−0.8%12.2%−8.3%−0.4%47.2%
7Combination of road measures, with rail/sea measures in Norway0.2%0.2%6.8%−3.6%0.3%7.2%
7bExpansion of Scenario 7 with terminal cost reductions in Sweden and Denmark0.4%−0.4%7.6%−5.0%−0.2%12.5%
8Combination of road, rail and sea measures (coordinated for Nordics as a whole)0.5%−0.3%9.1%−6.5%−0.2%16.6%
Table 7. Combined-measure policy scenarios: percentage changes in Energy use, CO2,eq, NOx, and PM, compared to reference for 2030.
Change in Energy UseChange in CO2,eq EmissionsChange in NOx EmissionsChange in PM
ScenShort DescriptionRoadSeaRailTotalRoadSeaRailTotalRoadSeaRailTotalRoadSeaRailTotal
5Combination of longer freight trains and Norwegian ecobonus for rail−8.1%−0.6%45.5%−3.1%−8.1%−0.6%21.8%−3.5%−8.4%−0.7%14.5%−1.1%−8.7%−0.7%41.6%−0.9%
6Combination of longer freight trains and rail ecobonus also applying in SE, DK−8.2%−0.6%45.3%−3.1%−8.2%−0.6%21.5%−3.6%−8.5%−0.7%14.2%−1.1%−8.7%−0.7%41.4%−0.9%
7Combination of road measures, with rail/sea measures in Norway−3.6%0.5%8.2%−0.8%−3.6%0.4%14.8%−1.1%−3.6%0.5%16.8%0.3%−3.7%0.5%9.3%0.4%
8Combination of road, rail and sea measures (coordinated for Nordics as a whole)−6.4%0.0%16.6%−2.1%−6.4%0.0%13.8%−2.5%−6.4%0.0%12.9%−0.3%−6.6%0.0%16.2%−0.2%

