Abstract
Building energy systems are designed to handle both permanent and temporary occupants. Permanent occupants are considered the base energy load while temporary occupants are considered a temporary or additional load. Temporary occupancy is potentially the most difficult to design as the number of temporary occupants varies more significantly than permanent occupants. This case study was designed to investigate the effect of occupancy on energy loads, i.e. the relationship between occupancy and building energy loads. This study estimated the building occupancy by using existing network infrastructure, such as Wi-Fi and wired Ethernet based on the assumption that the number of Wi-Fi connections and the wired Ethernet traffic were used as a proxy for total and stationary occupancy. The relationships were then examined using correlations and regression analyses. The results showed the following: 1. Stationary occupancy was successfully estimated using the network infrastructure; 2. There was a linear relationship between electricity use and total occupancy (and, thus, the use of network infrastructure); 3. Permanent occupants generated a higher impact on the electricity load than the temporary occupants; 4. There was a logarithmic relationship between electricity use and the Ethernet data traffic (a proxy of permanent occupants); and 5. The statistical and qualitative analyses indicated that there was no significant relationship between occupancy and thermal loads, such as cooling and heating loads.
1. Introduction
Energy consumption increases exponentially as the global population continues to grow. Fossil fuel is still the main source of raw material used by most countries to generate electricity, though the use of renewable energy has increased over the past decades. In the United States, approximately 80% of primary energy is provided by fossil fuel, but the portion of renewable energy is only 11% [1]. The use of fossil fuel increases the amount of greenhouse gases in the environment and is associated with global climate change [2]. The building sector accounts for approximately 20% of worldwide energy consumption, and estimates highlight that it will increase by an average of 1.5% annually from 2012 to 2040 [3]. In the United States, the building sector is responsible for 40% of energy use, 75% of electricity consumption, and 38% of related carbon dioxide emissions [4]. The building sector not only has great potential for energy saving but such a saving would also result in lowering the cost for companies and individuals [5,6]. The optimization and reduction of building energy consumption are also critical to the national economy as it cuts business operation cost and increases corporate profitability [2].
Prior energy efficiency research focused on the climate, building envelope, building energy and service systems, indoor design criteria, and building operation and maintenance. Many prior studies made remarkable progress in understanding the impact of energy consumption [6], and conventional building energy modeling methods tend to be aligned with these factors [7,8]. Building occupancy plays a critical role in building energy consumption [6,9,10]. Even though the relationship between the number of occupants in a building and the building’s energy load is well established, building occupancy is only used to design a building’s energy load and is rarely used to manage energy consumption during operation. Building energy systems are disconnected from human occupancy, and there is no robust energy model related to building occupancy [6,7,10,11,12,13]. Connecting building energy systems to building occupancy is a challenging task as it relates to reliability issues that involve occupancy tracking methods. As a result, the actual levels of energy used often deviate from the amount estimated by the occupancy during the operation phase [6].
Most building energy design has assumed that all rooms are occupied during operational hours to estimate maximum energy loads [14,15,16,17]. However, building occupancy rarely reaches the maximum load and always varies throughout the day in real life. Energy continues to be consumed in rooms (e.g., the conference rooms) even though some rooms remain empty throughout the day [14]. The goal of building energy modeling has been focused on maximum occupancy and often ignores occupancy variation throughout the day and season. It is extremely difficult to predict the level of permanent, temporary, and transient occupancy throughout the day and season, even though the level of occupancy influences the amount of energy consumed by a building. As prior research confirmed the importance of correlating weather, building types, and occupant behaviors with building energy load, the use of sensors and zoning are key strategies to integrate building occupancy into the operation and management of building energy consumption. Light sensors are used to turn off lighting in empty spaces, while zones are differentiated into frequently and infrequently occupied, use types, and total occupancy so that the energy load would be better managed and controlled.
Larger than expected occupancy, also known as excess load, is included in a design to avoid potential problems and the need to address the future load increase. Research has found that office buildings are overdesigned by over 60% at peak hours, as the buildings were occupied by a third of the estimated residency [18]. In another study, the actual building energy use was up to three times greater than the estimated use of energy [13]. The level of occupancy of a commercial building is influenced by multiple factors, such as work from home, travel and vacation schedule, and job nature. Society’s increasing demand for work–life balance has also changed how occupants behave and, thus, energy use patterns as increasing numbers of employees work from home and stagger their work hours. Building occupants’ increased demand for personal comfort, along with increasing use of computing technology, has also increased the use of energy (despite the continually improving energy efficiency of modern technology) [10]. Personal control of heating, ventilation, and air conditioning (HVAC) systems, lighting systems, blinds, windows, and individual appliances are now increasingly common in buildings. These new features have allowed occupants to better control their level of comfort, but the overall energy consumed by a building due to these features has not yet been fully understood [6,10].
2. Research Objectives
Accurate occupant information can be very useful and can save a large amount of building energy. [14] suggested that HVAC energy could be reduced by 14% by applying an optimal control strategy using occupancy. [19] showed that cooling loads can be reduced by 30% through occupancy control. [20] confirmed that a minimum of 10.4% and a maximum of 28.3% of the building energy load decrease was accomplished based on occupancy transitions. [21] proposed a predictive control algorithm based on occupancy information that saved about 40% of building energy use without compromising thermal comfort. Moreover, occupancy information can be utilized to manage building energy use as well as indoor environmental quality for the comfort and health of occupants [22].
Diverse and in-depth research has connected occupancy and building energy consumption, but there are limitations in applying such knowledge. Existing research has counted or estimated the total occupants at specific points in time, and most studies have been unable to differentiate between occupancy types [23]. Residential and office buildings have almost the same occupancy type; however, educational or commercial buildings have different types of occupants. There is a difference between total and variable occupancy: Total occupancy should be used to design the total energy consumption for a building, while variable occupancy should be used to manage energy consumption and, thus, control energy efficiency. Variation in building occupancy drives energy system operations and design.
While business hours vary from building to building, the number of occupants in the building changes and varies by the minute. Solutions to track the number of occupants range from using sensors to track occupants entering the buildings to estimating the occupancy using prior data. Sensors and trackers are also useful technologies that could be deployed to track occupancy; however, these technologies have their limitations, such as cost, reliability, and privacy issues. The period could also limit their deployment. For example, office workers tend to remain in the building during office hours while faculty and graduate students tend to work at more flexible hours. In addition, visitors to office buildings and educational buildings also behave differently. Thus, different types of occupants result in different energy consumption patterns. Transient occupants (students) in education tend to rely on plug loads to charge their smartphones or laptops, while transient occupants in government buildings tend to stay for a shorter period and thus do not consume any additional energy.
Permanent occupants consume the largest amount of energy with the computers, monitors, lighting, refrigerators, and other appliances and equipment they bring into a building. Some consume energy during office hours, while others operate continuously. Some appliances generate heat and increase the demand for cooling [6]. Since stationary and non-stationary occupants’ impact on the energy load is obviously different, they should be analyzed separately [8]. However, previous studies have not separated stationary and non-stationary occupants. Existing research has mainly studied residential and office buildings that have one type of building occupant [13], so separating the types of occupants would be unnecessary. However, in the case of educational and commercial buildings, which were relatively less studied [13], there are two types of occupants. [2] counted the two types of occupancy separately but did not verify occupancy impact on energy consumption. Therefore, the first research objective was to suggest how to estimate stationary occupancy using the existing infrastructure. This study proposed a new and simple approach to infer stationary occupancy. The second objective was to examine the relationships between occupancy and building energy loads, such as electricity, cooling, and heating in educational buildings. The relationships were verified using statistical methods. The last objective was to propose how to conserve building energy consumption, based on the results.
This research is not an attempt to study the other energy factors (such as building envelope, equipment efficiency, etc.) that are not mentioned in the objective. The focus is to study the correlations between occupancy and energy consumption pattern.
3. Research Methods
To examine the relationship between occupancy and energy load patterns, it is necessary to estimate building occupancy. There are various methods to estimate building occupancy [23], such as sensor networks [24], wireless camera sensor networks [14], radio-frequency identification (RFID) [2], passive infrared sensors [25], and 3D depth sensors [5]. Each method has merits and limitations; sensor fusion is being used to boost the accuracy of occupancy estimation and has shown better performance [23]. Nevertheless, these methods do not always accurately differentiate stationary and non-stationary occupants.
First of all, this study applied existing information technology. Most importantly, if a building has existing infrastructure, such as a Wi-Fi router, this method is immediately applicable to the building. Moreover, the existing technology does not require additional costs or labor-intensive sensor and hardware installation and maintenance, because it is not originally intended for occupancy sensing [26,27]. Some previous studies pointed out that the drawback of the existing infrastructure is inaccurate [22]. Certain applications require precision, but energy management applications do not; an approximate calculation of the number of occupants is enough to manage building energy loads [26]. In other words, the application just needs to know that there are roughly 10 occupants in the room, not 8, 9, 11, or 12. Erickson et al. (2009) verified that there was negligible impact (0.28%) on HVAC energy savings estimation of 14%, with a 20% occupancy estimation error [14].
Among the existing infrastructure in buildings, the Wi-Fi network is usefully applied as a proxy for human occupancy. Previous studies estimated occupancy using Wi-Fi networks [7,8,26,28,29,30], and these studies concluded that Wi-Fi connection frequency can estimate occupants’ residency without difficulty [8]. Balaji et al. (2013) determined the number of occupants successfully with 86% accuracy using Wi-Fi connections [31]. Chen and Ahn (2014) verified that there is a positive relationship between Wi-Fi connections and building energy use [8]. However, Wi-Fi networks have limitations, one of which is that the network cannot differentiate stationary and non-stationary occupants [8].
This case study proposes to infer the stationary occupancy in buildings using wired Ethernet connections. Estimating each stationary and non-stationary occupancy separately is necessary for developing energy consumption forecasting and for supporting building energy feedback systems [8]. One of the greatest differences between stationary and non-stationary occupants is whether they use wired Ethernet or not. In general, wired Ethernet is faster, more stable, and delivers more consistent speeds than wireless. However, non-stationary occupancy uses only wireless internet connections, because they do not have access to the wired Ethernet, and most of them do not carry an Ethernet patch cable for using wired Ethernet, though wireless is more inconvenient to use. However, stationary occupants have their own place to work, and, for them, wired Ethernet is ready and available. Most stationary occupants use wired Ethernet when they use their desktops or laptops. Thus, it can be assumed that there is a positive relationship between stationary occupants and wired Ethernet traffic. Therefore, in this research, wired Ethernet data traffic is used as a proxy for stationary occupancy.
3.1. Case Study Building and Data Collection
The object building of this case study is Interdisciplinary Science and Technology Building 4 (ISTB4) at Arizona State University (ASU), which has various types of space, such as laboratories, administrative and academic offices, and classrooms. This university building was selected because it contains both stationary and non-stationary occupants who use wired Ethernet and Wi-Fi frequently. Data were collected from 1–30 January in 2017, since both cooling and heating were required during this period. The outside temperature data were collected from the U.S. climate data website and ASU Metabolism system; electricity, cooling, and heating load data were collected from the ASU Metabolism system, which provides ASU buildings’ energy load data, and ISTB4’s Ethernet traffic and the number of Wi-Fi connection data were collected from the ASU University Technology Office. Because of data availability, the Ethernet traffic and Wi-Fi connection data were analyzed hourly and daily. This study performed Pearson correlation analysis and regression analysis to determine the relationships between the data, using a statistical software package (Statistical Package for Social Science; SPSS version 17.0). Pearson correlation and linear regression can determine if two numeric variables are significantly linearly related. Correlation analysis provides information on the strength and direction of the linear relationship between two variables, while simple linear regression analysis estimates parameters in a linear equation that can be used to predict the values of one variable based on the other.
3.2. Types of Internet Data Available and Used
Internet speed is not a factor in this research. Internet speed does not directly affect the energy consumption of a building, though it might affect the energy consumption of the hardware that generates the Wi-Fi signal (which is not the research objective). A meaningful relationship would be extremely unlikely due to the following:
- Derivation of internet speed:Internet speed is influenced by many factors such as signal generation equipment efficiency (router, modem), distance from the equipment (2.5ghz for longer distance transmission while sacrificing speed, 5.0ghz for faster internet while unable to transmit at longer distance), interruption (cellphone or other wave signals) and the efficiency of the users’ internet receiving equipment (e.g., two laptops with different Wi-Fi adaptors and network connectors would affect the internet speed of individual laptops). For example, if a network generates 1 gigabyte per second of speed but a laptop would only operate on 9 megabytes per second of speed if it only has a low-end Wi-Fi network connector, located further away from the Wi-Fi signal, and many users are using the internet at the same time.
- Internet speed requirement for different applications and different types of occupants:The demand for internet speed differs on different applications. Gaming and graphic designs demand the fastest speed while basic computer applications like emails and Twitter do not require speed beyond 5 Mbps. Occupants that demand the fastest internet speed would not use Wi-Fi as they would need computers that are connected to the Ethernet or their computers close to a router that is connected to the high-speed internet. Temporary occupants rarely demand the fastest internet speed from the Wi-Fi as they would normally focus on emails, social media, and homework (like Microsoft Office).
- Relationship between permanent and temporary occupants, and internet use:The internet use data could roughly be divided into permanent and temporary occupants as the permanent occupants use the Ethernet while the temporary occupants use the Wi-Fi internet provided for logged in users.
- Types of internet at Arizona State University:The Arizona State University provides three types of internet services, the first (label Type 1) is the Ethernet where students, staff, and faculty would connect their computers directly to the Ethernet or they would connect routers to the Ethernet to generate Wi-Fi signals for their other computing needs. These Wi-Fi signals would be registered as internet use from the Ethernet. Such internet is only available on permanent workstations. The second type of internet service (Type 2) is available to ASU account holders (students, staff, faculty, and alumni) where they could access the internet anywhere on campus. Type 2 internet is normally used for less complex applications and when students, staff, and faculty are in transition or during classes. Type 3 internet is available to the general public and registration is more complex as the public needs to register with a valid email and then validate it, where the entire process could take between four and fifteen minutes.
- Internet and energy load:Speed of internet, as previously discussed, is influenced by too many factors and thus the relationship between internet speed and the energy load is not easily modeled. This is the key reason why internet speed is not included in the analysis. In addition, the various internet speeds available to the country, state, city, and organization do not influence energy load, and the average internet speed is simply what the population and organization in the USA subscribed to and paid for. Internet speed ranging from as fast as 3 Gbps and as slow as 1 Mbps are offered in the United States, and the average speed depicts the different subscriptions the residents paid for. Due to the complexity, the research only focuses on the internet available in the building and Arizona State University uses up to 3 Gbps of internet speed for its Ethernet and over 250 Mbps for its Wi-Fi network on campus. Speed for its campus-wide Wi-Fi network is lower in speed due to the limitation of the 2.5ghz requirement to run long-distance Wi-Fi network on campus.
3.3. The Design of the Building Selected for the Study
The research is an analysis of a seven-story building that houses laboratories, classrooms, lecture theatres, an exhibition area, open spaces, and offices. HVAC is provided centrally where eight buildings share one main heating and cooling central unit, and then air is re-cooled or reheated to match the temperature requirement of the building (cooled air is reheated while heated air is re-cooled before distribution). The energy consumption change from HVAC is due to this reheating and re-cooling processes.
4. Results
Figure 1 shows the Ethernet data traffic pattern for the day. The data traffic begins to increase at 7 am and continues to increase until 2 pm, which is the peak time. The traffic then decreases until 6 pm and remains constant throughout the night. If there is a huge traffic gap from 9 am to 4 pm, then the gap is because of weekends and holidays, when there is low stationary occupancy. This trend is reasonable and understandable, because during working hours, stationary occupants use the Ethernet, which causes the data traffic to increase. In addition, during the night time, weekends, and holidays, the data traffic consistently remains low, since there is almost no one using the Ethernet. Thus, it can be surmised that there is a significant positive relationship between permanent occupants and wired Ethernet traffic.
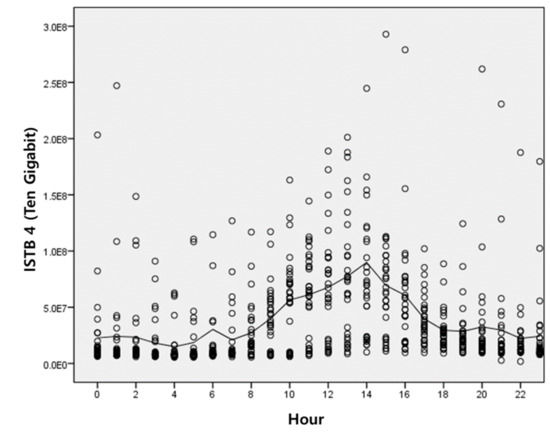
Figure 1.
Ethernet data traffic pattern for the day.
4.1. Temperature vs. Cooling and Heating Loads
The relationship between daily average outside temperature and building cooling and heating loads was examined. Table 1 shows the results of the Pearson correlation analysis, and Figure 2 is a scatter plot of the temperature and the loads. There are significant relationships between temperature and cooling and heating loads. In detail, there is a strong positive relationship between outside temperature and the cooling load and a moderate negative relationship between the temperature and heating load. In other words, if that day was hot, the cooling load rose almost as much as the outside temperature. If the day was cold, the heating load rose to some degree. As shown in Table 2, hourly-based data analysis showed similar results. These results are straightforward and intuitive. In addition, if the outside temperature is lower than approximately 47 °F, the cooling load remains the lowest, but in the case of heating load, there seems no definable borderline. Moreover, it is worth mentioning that it was difficult to determine the cooling and heating load gap between weekdays and weekends in Figure 3, which are scatter plots of the temperature and the loads. In most cases, there are far fewer occupants during weekends and holidays than during weekdays, so cooling and heating loads should also have been far lower, as can be seen from the data traffic in Figure 1, but this was not the case.

Table 1.
Daily-based Pearson correlation analysis—Temperature vs. Energy loads.

Figure 2.
Scatter plot of the temperature and the loads. Notes: (a) Cooling load; (b) Heating load.
Table 2.
Hourly-based Pearson correlation analysis—Temperature vs. Energy loads.

Figure 3.
Hourly-based scatter plot of the temperature and the loads.
4.2. The Number of Wi-Fi Connections vs. Energy Loads
The study investigated the relationship between the number of Wi-Fi connections and building energy loads. Table 3 shows the results of the Pearson correlation analysis; the results indicate that there is a strong positive relationship between the number of Wi-Fi connections and the electricity load but not between the number of Wi-Fi connections and cooling and heating loads. This means that if the number of Wi-Fi connections, which implies the number of occupants, grows, the electricity load, which is related to electric appliances such as desktops, monitors, or refrigerators, also increases. However, even if the number of occupants increases or decreases, cooling and heating loads are immune to occupancy. Figure 4 displays the relationship between the number of Wi-Fi connections and electricity load. There are two groups based on the number of Wi-Fi connections; the upper group, which has more than 500 Wi-Fi connections, represents weekdays after the beginning class. If one looks only at the upper group, there seems to be little relationship between the number of Wi-Fi connections and electricity loads; contrary to this, the lower group, which has lower than 400 Wi-Fi connections, represents weekends, holidays, and weekdays before the beginning class. During these periods, the correlation is stronger than in the upper group.
Table 3.
Results of the Pearson correlation analysis—Wi-Fi user vs. Energy loads.

Figure 4.
Relationship between the number of Wi-Fi connections and electricity load.
4.3. Data Traffic vs. Energy Loads
The research examined the relationship between wired Ethernet data traffic and building energy loads. Table 4 displays the results of the Pearson correlation analysis. It shows that only the electricity load has a significant moderate relationship with the data traffic. The cooling and heating loads have very weak relationships with data traffic. These results are almost the same as the Wi-Fi connection results, but there is a difference. The Pearson correlation analysis measures the linear association strength between two variables; the Pearson correlation coefficient was 0.571 between the data traffic and the electricity load. However, if the relationship is not linear, the coefficient can be distorted. Figure 5 shows a scatter plot of the data traffic and the electricity load, and it indicates that the relationship is logarithmic rather than linear. When the logarithmic relationship was applied to the relationship, the correlation coefficient increased to 0.744. If data traffic increased, the electricity load also increased. However, the more the data traffic increased, the less the margin of the electricity load increased.
Table 4.
Results of the Pearson correlation analysis—Wired data traffic vs. Energy loads.
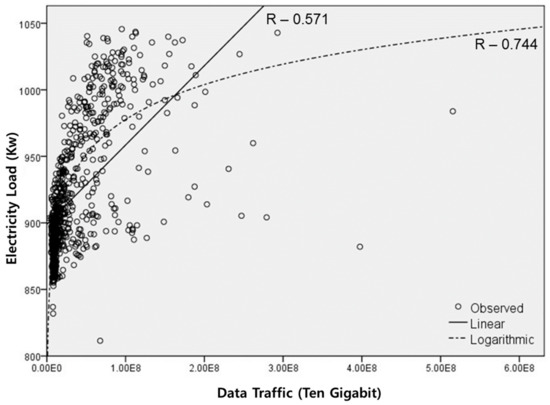
Figure 5.
Scatter plot of the data traffic and the electricity load.
According to the above results, though the correlations were significant, there were weak correlations between the cooling and heating loads and data traffic. The research authors also applied multiple linear regression, in order to verify the relative influences of the data traffic and the temperature to cooling and heating loads. Table 5 and Table 6 show the results in detail. The magnitude of the standardized coefficient of the regression model measures the relative effect of the independent variables on the dependent variables, so it makes comparison readily in the same units. The dependent variable of the first regression model was the cooling load; independent variables were the data traffic and the outside temperature. The result shows that the model was significant and that the R-value of the model was 0.849, which was high enough. The standardized coefficient of temperature was 0.864, and the data traffic was −0.074. This indicates that the temperature’s influence was overwhelming to the cooling load. Though the sign of the data traffic is negative, it can be negligible, because the impact was very limited (Table 5). In the second regression model, the dependent variable was the heating load. The second model was also significant, and the R-value was 0.554, which was less than the first model. The standardized coefficient of temperature was −0.496, and the data traffic was −0.152. In the case of the heating load, the outside temperature had a much stronger impact than the data traffic, but not as much as it did on the cooling load. The data traffic also had a certain influence on the heating load (Table 6).
Table 5.
Multiple linear regression of cooling load.
Table 6.
Multiple linear regression of heating load.
5. Discussion
5.1. Wi-Fi vs. Electricity Load
The results demonstrate that there is a strong positive relationship between the number of Wi-Fi connections, which implies the total number of occupants in the building, and the electricity load. This is because almost all occupants consumed plug-loads during their stay in the building. For example, students who were non-stationary occupants charged their laptops and smartphones, and computers, monitors, and projectors were used during class. Stationary occupants used their own desktop computer, laptop, monitors, and other electric appliances, and also charged a smartphone or other device. The same result was verified by a previous study [7].
However, among the two types of occupancy, stationary occupancy might have a larger impact on the electricity load than non-stationary occupancy. As mentioned at the end of Section 3.2, the lower group in Figure 4, which represents weekends, holidays, and weekdays before the beginning class, had a stronger correlation between the number of Wi-Fi connections and electricity load. This implies that the electricity load is more affected by stationary occupancy than by non-stationary. This is because in most cases, the non-stationary occupants did not come to the building on weekends or similar time periods, but some permanent occupants, such as faculty or graduate students, did. When they did, they increased the electricity load by using their electric appliances. However, the upper group in Figure 4, which is weekdays after the beginning class, had a low relationship between the Wi-Fi connections and the electricity load. This might be because non-stationary occupancy has a lower impact on electricity load. During this period, the electricity load did not rise, even if the number of Wi-Fi connections increased. Normally, the greatest number of faculty members and graduate students were in the building during that period, so the variation of the Wi-Fi connections might be from the students who attended class. Thus, it is surmised that the students’ influence on the electricity load was not significant.
5.2. Data Traffic vs. Electricity Load
It is also proved that there is a significant relationship between the wired Ethernet data traffic as a proxy for stationary occupancy and the electricity load. The relationship is logarithmic rather than linear, which means even if the data traffic increases, after the inflection point the electricity load does not increase that much. There are two probable reasons for the logarithmic relationship. The first reason is that, before the inflection point, the more stationary occupants in the building, the more the data traffic increased, since the stationary occupants use the wired Ethernet. At the inflection point, it seems that the most stationary occupancy had entered the building. After the inflection point, a large amount of the data traffic increase might be from preexisting stationary occupants and not from a new stationary occupant. Since the number of stationary occupants did not increase as much as the data traffic did, the slope of the electricity load increase decreases. Then, if all or almost all stationary occupants stayed in the building, data traffic and the electricity load might only have increased very slightly, since there was almost no change in the number of stationary occupants. The second reason is because of heavy data use. In Figure 5, there are several points that seem like outliers that have large data traffic with a relatively low electricity load. This can happen when a few occupants use the data overwhelmingly at a specific point of time. Thus, the inflection point and heavy data user should be carefully considered when estimating the stationary occupancy using the data traffic.
5.3. Heating and Cooling Load vs. Occupancy
According to the results, there was no correlation between thermal loads and occupancy. In addition, when comparing the impacts of the outside temperature and occupancy on thermal loads by multiple regression analysis, occupancy’s influence was severely limited when compared to the temperature. However, the more occupants that are in a building, the higher the HVAC loads will be. At the least, there must be a significant relationship between the cooling load and occupancy, because the presence of occupants causes metabolic heat and increases the inter heat and indoor temperature [10,32]. Furthermore, the various electrical appliances the occupants use also produce internal heat, which also increases the cooling load [10,32].
Surprisingly, previous studies also revealed that there was a lack of correlation between the HVAC system and occupancy [7], which seems to be due to the current HVAC systems. HVAC systems normally operate based on fixed schedules and maximum occupancy assumptions [2]. For example, during occupied periods, if there are no Wi-Fi connections or wired data traffic in certain rooms, the room does not need cooling or heating. And if there are a few Wi-Fi connections or a little data traffic in a room, the HVAC system only needs to reduce the loads, and vice versa. By doing this simple modification, a large amount of energy can be saved.
In addition, HVAC systems do not consider whether the building is partially occupied; there are only “occupied” or “unoccupied” periods of the day [2]. The object building of this research is operated in a similar way. According to the ASU Facilities Services, the building HVAC system is controlled by periods that are set by a manager, and there are only “occupied,” “unoccupied,” “preoccupancy,” and “setback” periods. This system is too rough and simple, so it is not helpful for energy saving. Thus, there seems to be high energy saving potential if HVAC loads can be adjusted automatically based on real-time occupancy information [2,9].
6. Conclusions
At present, a large amount of thermal and heating loads is being wasted on vacant or partially occupied room. If the HVAC systems could consider occupancy information in real-time, a huge amount of energy can be conserved. Moreover, the accuracy of building energy simulations or predictions can be improved by applying the occupancy data. This is because the current simulations or predictions do not consider the occupancy information, which can cause a big difference in accuracy between the simulated and actual consumption.
This case study investigated the relationship between building occupancy and building energy loads such as electricity, cooling, and heating loads, using correlation and multiple regression analyses. The results revealed that stationary occupants, such as faculty members and graduate students, can be successfully estimated by the existing infrastructure, for example, the wired Ethernet data traffic. There was a significant linear relationship between the electricity load and the total occupancy, and the impact of stationary occupancy on the electricity load was higher than non-stationary occupancy. There was a significant logarithmic relationship between the electricity load and the Ethernet data traffic, which is a proxy of the stationary occupancy. However, there was no relationship between the occupancy and thermal loads; this might be because the current HVAC systems do not consider the actual state of the occupancy, despite the occupancy being roughly divided into categories, such as “occupied” or “unoccupied.”
It is expected that the research results can be utilized practically. Since this study applied the existing infrastructure of Wi-Fi connections and Ethernet data traffic, additional cost and labor-intensive processes, such as sensor installation, are unnecessary. Thus, if the building uses a Wi-Fi and wired Ethernet, the number of occupants in the building can be estimated in real-time. Furthermore, the results can improve previous research; when estimating building occupancy, some advanced studies have employed sensor fusion using CO2, temperature, and humidity sensors. As there is a significant relationship between wired Ethernet traffic and permanent occupants, wired Ethernet traffic can be utilized as a sensor when employing sensor fusion methods for estimating accurate building occupancy.
Unfortunately, this case study analyzed only one month of data because of data unavailability, so more long-term period analyses should be conducted for further research. The object building can be extended to other types of buildings or to a building in another region. This research did not estimate the number of stationary occupants in the building. However, the approximate number, if not an exact estimation, of stationary occupancy can be estimated by using Ethernet data traffic in future research. The final suggestion is to utilize data from existing infrastructure efficiently and successfully. A huge and varied amount of data is produced from existing infrastructure; these data are of great value and can be connected to big data at no additional cost or need for labor. Therefore, the data can be used in various ways, such as optimizing the use of building energy and water to improve occupant comfort.
Author Contributions
Data curation, S.L.; formal analysis, S.L.; methodology, S.L. and W.O.C.; supervision, W.O.C.; visualization, S.L.; writing—original draft, S.L.; writing—review and editing, J.-S.C. All authors have read and agreed to the published version of the manuscript.
Funding
This research received no external funding
Conflicts of Interest
The authors declare no conflict of interest.
References
- EIA, (2018). Monthly Energy Review August 2018. United States Department of Energy. Available online: https://www.eia.gov/totalenergy/data/monthly/pdf/mer.pdf (accessed on 15 January 2020).
- Li, N.; Calis, G.; Becerik-Gerber, B. Measuring and monitoring occupancy with an RFID based system for demand-driven HVAC operations. Autom. Constr. 2012, 24, 89–99. [Google Scholar] [CrossRef]
- IEA 2016. International Energy Outlook; U.S. Energy Information Administration: Washington, DC, USA, 2016. [Google Scholar]
- IEA 2016. Available online: https://www.eia.gov/totalenergy/data/annual/index.php#consumption (accessed on 15 January 2020).
- Diraco, G.; Leone, A.; Siciliano, P. People occupancy detection and profiling with 3D depth sensors for building energy management. Energy Build. 2015, 92, 246–266. [Google Scholar] [CrossRef]
- Yan, D.; O’Brien, W.; Hong, T.; Feng, X.; Burak Gunay, H.; Tahmasebi, F.; Mahdavi, A. Occupant behavior modeling for building performance simulation: Current state and future challenges. Energy Build. 2015, 107, 264–278. [Google Scholar] [CrossRef]
- Martani, C.; Lee, D.; Robinson, P.; Britter, R.; Ratti, C. ENERNET: Studying the dynamic relationship between building occupancy and energy consumption. Energy Build. 2012, 47, 584–591. [Google Scholar] [CrossRef]
- Chen, J.; Ahn, C. Assessing occupants’ energy load variation through existing wireless network infrastructure in commercial and educational buildings. Energy Build. 2014, 82, 540–549. [Google Scholar] [CrossRef]
- Liao, C.L.C.; Barooah, P. An integrated approach to occupancy modeling and estimation in commercial buildings. Am. Control Conf. 2010, 3130–3135. [Google Scholar]
- Kwok, S.S.K.; Lee, E.W.M. A study of the importance of occupancy to building cooling load in prediction by intelligent approach. Energy Convers. Manag. 2011, 52, 2555–2564. [Google Scholar] [CrossRef]
- Fabi, V.; Andersen, R.V.; Corgnati, S.P.; Olesen, B.W. A methodology for modelling energy-related human behaviour: Application to window opening behaviour in residential buildings. Build. Simm. 2013, 6, 415–427. [Google Scholar] [CrossRef]
- Calì, D.; Osterhage, T.; Streblow, R.; Müller, D. Energy performance gap in refurbished German dwellings: Lesson learned from a field test. Energy Build. 2016, 127, 1146–1158. [Google Scholar] [CrossRef]
- Delzendeh, E.; Wu, S.; Lee, A.; Zhou, Y. The impact of occupants’ behaviours on building energy analysis: A research review. Renew. Sustain. Energy Rev. 2017, 80, 1061–1071. [Google Scholar] [CrossRef]
- Erickson, V.L.; Lin, Y.; Kamthe, A.; Brahme, R.; Surana, A.; Cerpa, A.E.; Sohn, M.D.; Narayanan, S. Energy efficient building environment control strategies using real-time occupancy measurements. In Proceedings of the First ACM Workshop on Embedded Sensing Systems for Energy-Efficiency in Buildings; ACM: New York, NY, USA, 2009; pp. 19–24. [Google Scholar] [CrossRef]
- Stoppel, C.M.; Leite, F. Integrating probabilistic methods for describing occupant presence with building energy simulation models. Energy Build. 2014, 68, 99–107. [Google Scholar] [CrossRef]
- Sun, Y. Sensitivity analysis of macro-parameters in the system design of net zero energy building. Energy Build. 2015, 86, 464–477. [Google Scholar] [CrossRef]
- Kabanshi, A.; Ameen, A.; Hayati, A.; Yang, B. Cooling energy simulation and analysis of an intermittent ventilation strategy under different climates. Energy 2018, 156, 84–94. [Google Scholar] [CrossRef]
- Brandemuehl, M.J.; Braun, J.E. Impact of demand-controlled and economizer ventilation strategies on energy use in buildings. ASHRAE Trans. 1999, 105, 39. [Google Scholar]
- Lo, L.J.; Novoselac, A. Localized air-conditioning with occupancy control in an open office. Energy Build. 2010, 42, 1120–1128. [Google Scholar] [CrossRef]
- Yang, Z.; Becerik-Gerber, B. Assessing the impacts of real-time occupancy state transitions on building heating/cooling loads. Energy Build. 2017, 135, 201–211. [Google Scholar] [CrossRef]
- Wang, F.; Feng, Q.; Chen, Z.; Zhao, Q.; Cheng, Z.; Zou, J.; Zhang, Y.; Mai, J.; Li, Y.; Reeve, H. Predictive control of indoor environment using occupant number detected by video data and CO2 concentration. Energy Build. 2017, 145, 155–162. [Google Scholar] [CrossRef]
- Yang, J.; Santamouris, M.; Lee, S.E. Review of occupancy sensing systems and occupancy modeling methodologies for the application in institutional buildings. Energy Build. 2016, 121, 344–349. [Google Scholar] [CrossRef]
- Chen, Z.; Jiang, C.; Xie, L. Building occupancy estimation and detection: A review. Energy Build. 2018, 169, 260–270. [Google Scholar] [CrossRef]
- Dodier, R.H.; Henze, G.P.; Tiller, D.K.; Guo, X. Building occupancy detection through sensor belief networks. Energy Build. 2006, 38, 1033–1043. [Google Scholar] [CrossRef]
- Duarte, C.; Van Den Wymelenberg, K.; Rieger, C. Revealing occupancy patterns in an office building through the use of occupancy sensor data. Energy Build. 2013, 67, 587–595. [Google Scholar] [CrossRef]
- Melfi, R.; Rosenblum, B.; Nordman, B.; Christensen, K. Measuring building occupancy using existing network infrastructure. In Proceedings of the 2011 International Green Computing Conference and Workshops, Orlando, FL, USA, 25–28 July 2011. [Google Scholar] [CrossRef]
- Labeodan, T.; Zeiler, W.; Boxem, G.; Zhao, Y. Occupancy measurement in commercial office buildings for demand-driven control applications - A survey and detection system evaluation. Energy Build. 2015, 93, 303–314. [Google Scholar] [CrossRef]
- Christensen, K.; Melfi, R.; Nordman, B.; Rosenblum, B.; Viera, R.; Christensen, K.; Melfi, R. Using existing network infrastructure to estimate building occupancy and control plugged-in devices in user workspaces. Int. J. Commun. Networks Distrib. Syst. 2014, 12, 4–29. [Google Scholar] [CrossRef]
- Depatla, S.; Muralidharan, A.; Mostofi, Y. Occupancy Estimation Using Only WiFi Power Measurements. J. Sel. Areas Commun. 2015, 33, 1381–1393. [Google Scholar] [CrossRef]
- Lu, X.; Wen, H.; Zou, H.; Jiang, H.; Xie, L.; Trigoni, N. Robust occupancy inference with commodity WiFi. In Proceedings of the 2016 IEEE 12th International Conference on Wireless and Mobile Computing, Networking and Communications (WiMob), New York, NY, USA, 17–19 October 2016. [Google Scholar] [CrossRef]
- Balaji, B.; Xu, J.; Nwokafor, A.; Gupta, R.; Agarwal, Y. Sentinel: occupancy based HVAC actuation using existing WiFi infrastructure within commercial buildings. In Proceedings of the 11th ACM Conference on Embedded Networked Sensor Systems; ACM: New York, NY, USA, 2013; p. 17. [Google Scholar] [CrossRef]
- Page, J.; Robinson, D.; Morel, N.; Scartezzini, J. A generalised stochastic model for the simulation of occupant presence. Energy Build. 2008, 40, 83–98. [Google Scholar] [CrossRef]
© 2020 by the authors. Licensee MDPI, Basel, Switzerland. This article is an open access article distributed under the terms and conditions of the Creative Commons Attribution (CC BY) license (http://creativecommons.org/licenses/by/4.0/).