Article

Revisiting a Water Conflict in Southeastern Oklahoma 6 Years Later: A New Valuation of the Willingness to Pay for Ecosystem Services

1
Department of Geography and Environmental Sustainability, University of Oklahoma, Norman, OK 73019, USA
2
Department of Biology, University of Oklahoma, Norman, OK 73019, USA
3
Oklahoma Biological Survey, University of Oklahoma, Norman, OK 73019, USA
4
Centro Andaluz para La Evaluación y Seguimiento Del Cambio Global (CAESCG), 04120 Almería, Spain
5
Department of Biological Sciences, Idaho State University, Pocatello, ID 83209, USA
6
Department of Communication, University of Oklahoma, Norman, OK 73019, USA
*
Author to whom correspondence should be addressed.
Co-contribution authors: Claire Burch, Michelle Busch, Edward Higgins, Steven Bittner, Kevin Neal, Nuwanthika Perera.
Sustainability 2020, 12(3), 819; https://doi.org/10.3390/su12030819
Submission received: 14 November 2019 / Revised: 17 January 2020 / Accepted: 19 January 2020 / Published: 22 January 2020
(This article belongs to the Collection Urban Water Consumption and Sustainability)

Abstract

:
In recent years, researchers have begun to adopt a perspective evaluating “winners and losers” regarding the consumption and value of ecosystem services. “Winners” tend to benefit from the ecosystem service and “losers” absorb most associated costs. Our study focuses on water use in Oklahoma (USA) and a plan to divert water from the Kiamichi River in southeastern Oklahoma for consumption at residences in the Oklahoma City metropolitan area. Our study is, in part, a follow-up from an initial 2013 survey of Oklahoma City residents and residents of the Kiamichi. For this paper, a survey was distributed within the state of Oklahoma to evaluate changes to ecosystem service willingness to pay and valuation. This survey also included an experimental element assessing if exposure to additional information about ecosystem services influenced respondents on ecosystem service valuation, or willingness to pay. Our results generally aligned with those found in the 2013 survey. Oklahoma City residents are not aware of where their water is coming from and are not willing to pay to protect ecosystem services, despite an overall increase in activism. Our results indicate that a smaller number of significant factors determining willingness to pay for ecosystem service maintenance were identified than the study in 2013. Exposure to additional information had no effect on peoples’ preferences. We found that public opinion surrounding environmental support is context-specific, political conservatism may not always impede valuation of environmental protections. We conclude that cultural, moral, and political values interact in their influence on expressions of valuation and willingness to pay for ecosystem services.

1. Introduction

Valuation of ecosystem services (i.e., nature benefits essential to human wellbeing) is becoming increasingly popular as a method to inform decision making in conservation [1,2]. Many studies have focused on either biophysical assessment—the capacity of an ecosystem to deliver a service—or on the economic value of an ecosystem service to local communities. Few studies, however, focus on the notion of ecosystem valuation from the perspective of the moral and cultural tenets of communities, or socio-cultural preferences toward ecosystem services [3]. To properly evaluate opinions from the diverse stakeholders that use the ecosystem services of interest, it is important to consider the cultural and moral values assigned to ecosystems [4]. Chan et al. [5] define cultural ecosystem services as “…ecosystems’ contributions to the non-material benefits that arise from human–ecosystem relationships…”. Ecosystem services can provide benefits to the human and nature relationships other than the monetary or resource stock and dynamics [5]. It is, therefore, crucial to evaluate community engagement in ecosystem service valuation and to identify this engagement on a scale separate from economic metrics [6,7]. Diaz et al. [8] proposed a framework titled ‘Nature’s Contribution to People’, which emphasizes the importance of culture in influencing the links humans have with nature. According to this framework, people’s values of ecosystem services will differ depending on the cultural context. The framework also suggests that integration of people and their cultural contexts and knowledge is critical for informing relevant policy decisions [9].
Ecosystem services have been used in creating policies globally, particularly in terms of water management [9]. Water management is often challenging, as strategies that take place upstream affect the downstream river network, and most changes are multidirectional [10]. Water management can also be challenging due to its overlapping goals [11,12]. Thus, while freshwater systems can be difficult to properly manage, cultural services of rivers and lakes can provide significant income for people surrounding those areas [10]. Developing an outline of methodologies for assessing ecosystem services would be useful for future analyses, allowing results across various groups to be comparable [9]. Because of these complexities, some researchers have suggested that independent agencies must be created to adjust the valuation of a service to local conditions [13]. Despite these challenges, ecosystem services can be useful to define effective policy and management. For example, in the Skórzynka river catchment, small water retention reservoirs were determined to be the most effective method of preserving the system after using ecosystem services as a way to measure effectiveness [11].
To support environmental policy decisions, methods integrating community values and socioeconomic factors are useful for understanding diverse values of ecosystem service [14,15]. The contingent valuation method (CVM, [16]) has been used to capture socio-economic information that applies to ecosystem services [2,3,4]. CVM is one of the more frequently-used methods in ecosystem services valuation, using the idea of “willingness to pay” or “willingness to accept” [17]. CVM asks individuals how much they would be willing to pay in a hypothetical market to preserve ecosystem services to avoid changes to the related ecosystem. Further, CVM can cluster willingness to pay valuations based on parties benefiting from a given service, termed ecosystem service beneficiaries (ESB), to provide a more accurate portrayal of differences in how stakeholders value ecosystems [16,17]. The issue with CVM as a method for evaluating ecosystem service valuation is that the assessment is highly subjective. For example, unreasonably high willingness to pay (WTP) dollar amounts could be a result of respondents attempting to make a political statement versus taking economic factors into consideration [17]. Services may also be undervalued as they tend to be viewed as “free” services, and individuals, therefore, do not consider any costs associated with accessing those services [18]. Though CVM has limitations, it can effectively establish people’s willingness to pay (WTP) to maintain services [19,20]. WTP also provides information on the social preferences and attitudes towards the ecosystem services rather than monetary measurements [15,21]. This study employs CVM methodology to measure WTP for determining the use and non-use value of ecosystem services provided in our region of interest. This study specifically utilizes an open analysis WTP framework versus a dichotomous framework, where the participants are asked not only if they are or are not willing to pay but also the maximum amount they would be willing to pay [17].
While the CVM methodology for quantifying WTP can be useful in assessing how ecosystem services are valued across groups of people, it is important to distinguish how groups are benefiting from ecosystem services. As culture affects WTP, one cannot assume a uniform valuation among individuals of varying backgrounds and relationships with ecosystems. Considering valuation from a variety of ecosystem service beneficiaries (ESBs) creates a more holistic view of the ecosystem services important to a region [22]. The research presented here employs CVM to measure WTP, by dividing participants into self-identified ESB groups to a situation in Oklahoma, wherein a predicted scarcity for drinking water in Oklahoma City (OKC) has led to a plan to divert water from the Kiamichi River in southeastern Oklahoma to supplement drinking water for metropolitan area (MA) residents. A 2013 survey by Castro et al. [11,14] found differences in WTP and ecosystem services valuation among the ESBs of interest, particularly between OKC residents and Kiamichi River watershed residents. We chose to revisit this survey because of an increase in activism and attention to the water conflict in the region since the initial survey.
Our objective for the present study was to determine how perceptions and valuation of ecosystem services in the Kiamichi River differ amongst various groups, including OKC residents and stakeholders living near the Kiamichi River. Moreover, media attention to the issue of water diversion from the Kiamichi has increased recently in response to a lawsuit by relevant stakeholders in the region based on the Endangered Species Act. These recent events prompted us to determine if valuations and opinions have changed since the survey in 2013. We employed a subset of surveys to test how different text narratives about the Kiamichi river diversion affects opinions and valuation. We used our survey results to test the following hypotheses: (H1) presenting participants with a narrative on the respective positions of watershed residents and Oklahoma City residents will have a significant influence on their response in willingness to pay. (H2) When providing a self-identified relationship to the Kiamichi Watershed, respondents from Southeastern Oklahoma will be more willing to pay than Oklahoma City residents, due to their proximity to the river. (H3) Respondents who are more politically active will value ecosystem services significantly more. (H4) Survey responses will indicate a change in willingness to pay and ecosystem service valuation since the study conducted by Castro et al. [11,14] in 2013.

2. Materials and Methods
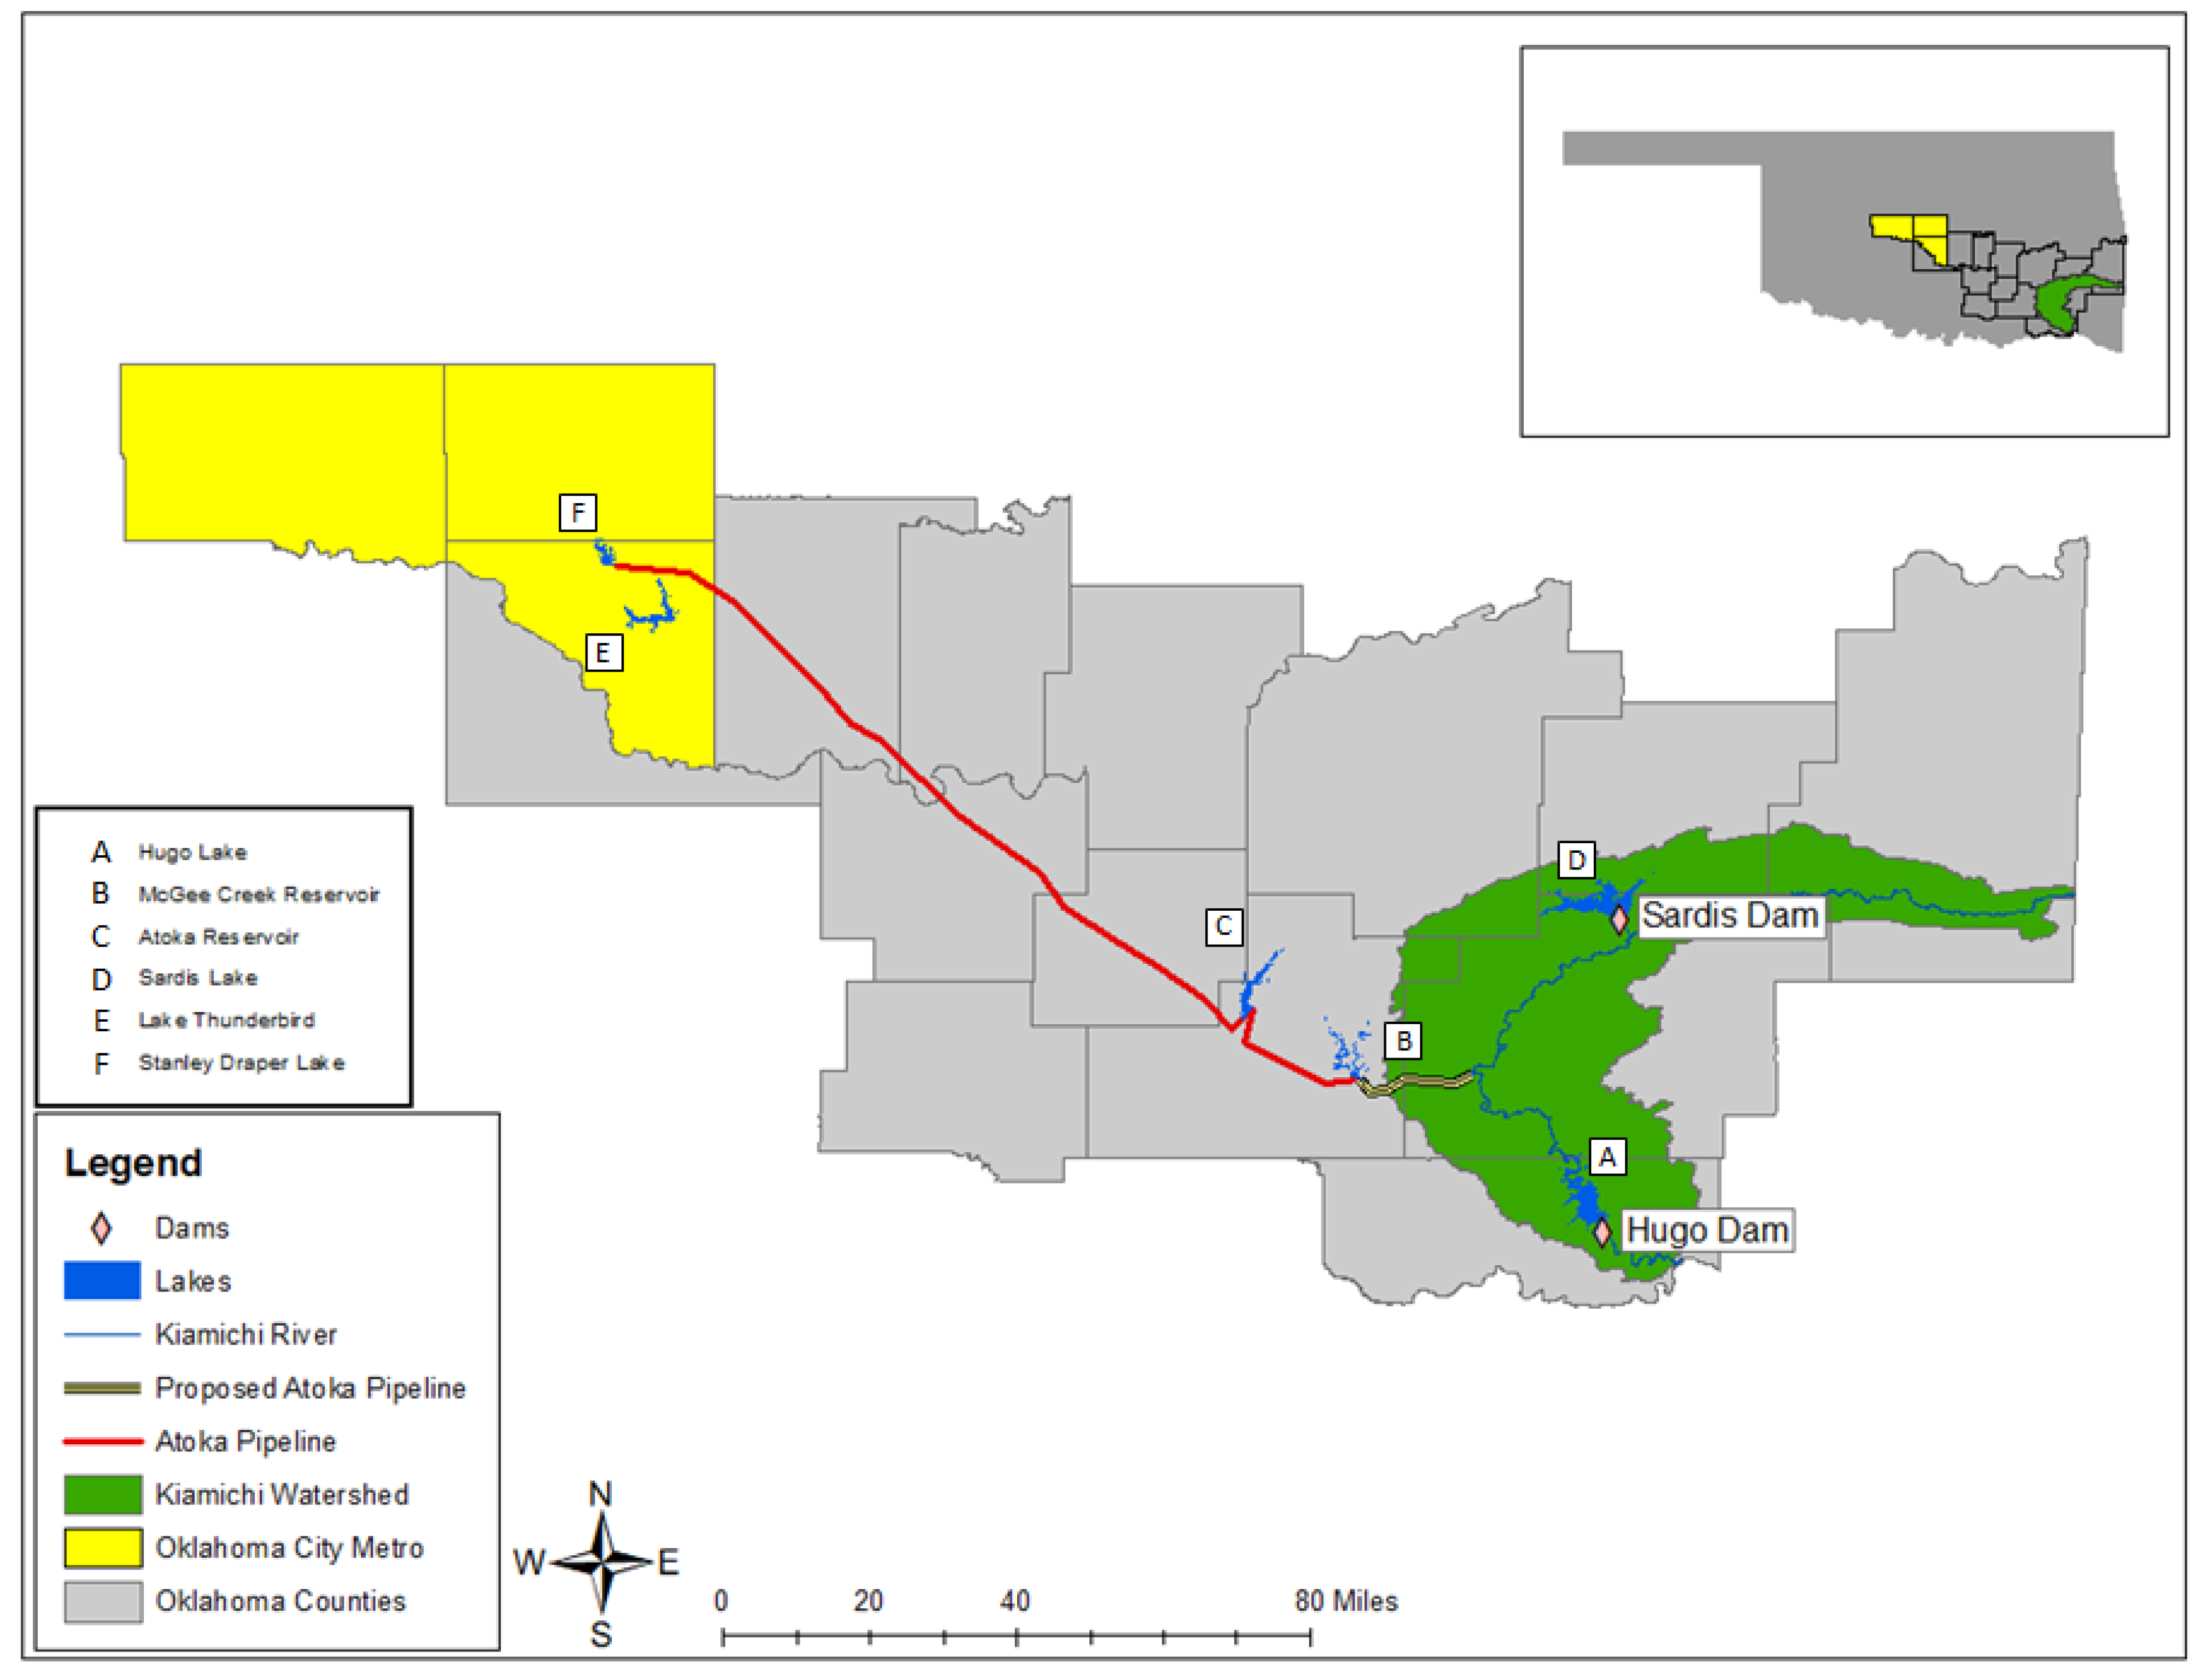
2.1. Study Area

This study focuses on the Kiamichi River, a major tributary to the Red River, located in southeastern Oklahoma. The watershed includes 4719 km3 of land area, of which 65% is forested, 18% is used for agricultural purposes (17% is pasture), and 2.49% is developed, according to the National Land Cover Database in 2016. The area surrounding the Kiamichi watershed is mountainous, making it undesirable for farming or development. Multiple logging companies are present and maintain conifer forest plantations (loblolly pine) [11,14]. Due to the lack of development within the watershed, the Kiamichi River remains relatively pristine, despite the two dams located within the watershed that form Sardis (located on Jackfork Creek, a main tributary of the Kiamichi River) and Hugo Lakes (directly on the Kiamichi). The watershed is home to a high level of biodiversity, there are 86 fish species and 31 mussel species in the river, including three federally endangered mussels [21,23,24].

2.2. Case Study: A Watershed with Intense Regional Conflict

Water availability in Oklahoma City, Oklahoma, is predicted to decrease with increased rates of growth in the metropolitan area (MA) and is predicted to be insufficient to meet metropolitan needs as early as 2060 [25]. Currently, water for the Oklahoma City MA (hereafter referred to as “OKC”) is transported from Lake Atoka (near Atoka, Oklahoma) through the Atoka Pipeline (Figure 1). The Atoka pipeline has been operational since 1964, is 177 km long, and consists of six pumping stations between the Atoka reservoir in southeastern Oklahoma and the Stanley Draper reservoir in central Oklahoma. To reach the Kiamichi River, the current 60 inch diameter pipeline will need to be replaced with 66 inch diameter material, and the pumping capacity of several pumping stations will need to be increased [26]. Each improvement will take multiple years, with the project finishing around 2060 and costing hundreds of millions of dollars [27].
Due to these predicted drinking water shortages, Oklahoma City filed a petition in 2007 to divert water from the Kiamichi River south of Sardis Lake to the Atoka Pipeline by extending the pipeline. The Oklahoma Water Resources Board (OWRB) obtained their permit with the Choctaw and Chickasaw Nations, two Native American nations in Oklahoma. Recent opposition has claimed that residents of the watershed area were uninformed of the decision, and litigation has been ongoing since December 2018, when local landowners and businesses filed a 60-day notice of intent to sue on the grounds of the Endangered Species Act. The new lawsuit cites the Endangered Species Act as grounds to halt pipeline construction, protecting three endangered freshwater mussel species in the river [15,21,23,24,28]. In addition, a public Facebook group titled “Save the Kiamichi River” was created in April of 2017, representing an active public discussion involving over 7000 members (see https://www.facebook.com/groups/SaveTheKiamichiRiver/).
The Kiamichi River as a metropolitan water source has thus become a topic of heavy debate. The two reservoirs located in the watershed currently provide drinking water to 29 counties [11,14], and with increasing demands for water and changing climates across the state, impacts of water diversion on the river are likely to compound in the future [21]. The river and its surrounding communities have already been negatively impacted by the operation of the reservoirs [14,17,21]. During drought months, water is not released from the reservoir, causing drying downstream, which leads to mass mortality of endangered freshwater mussels [14,16,21]. To exacerbate this issue, the water in this region is not only used by the people in southeastern Oklahoma, including the Choctaw and Chickasaw Nations, but is also sought after by central Oklahoma and north Texas [11,14].

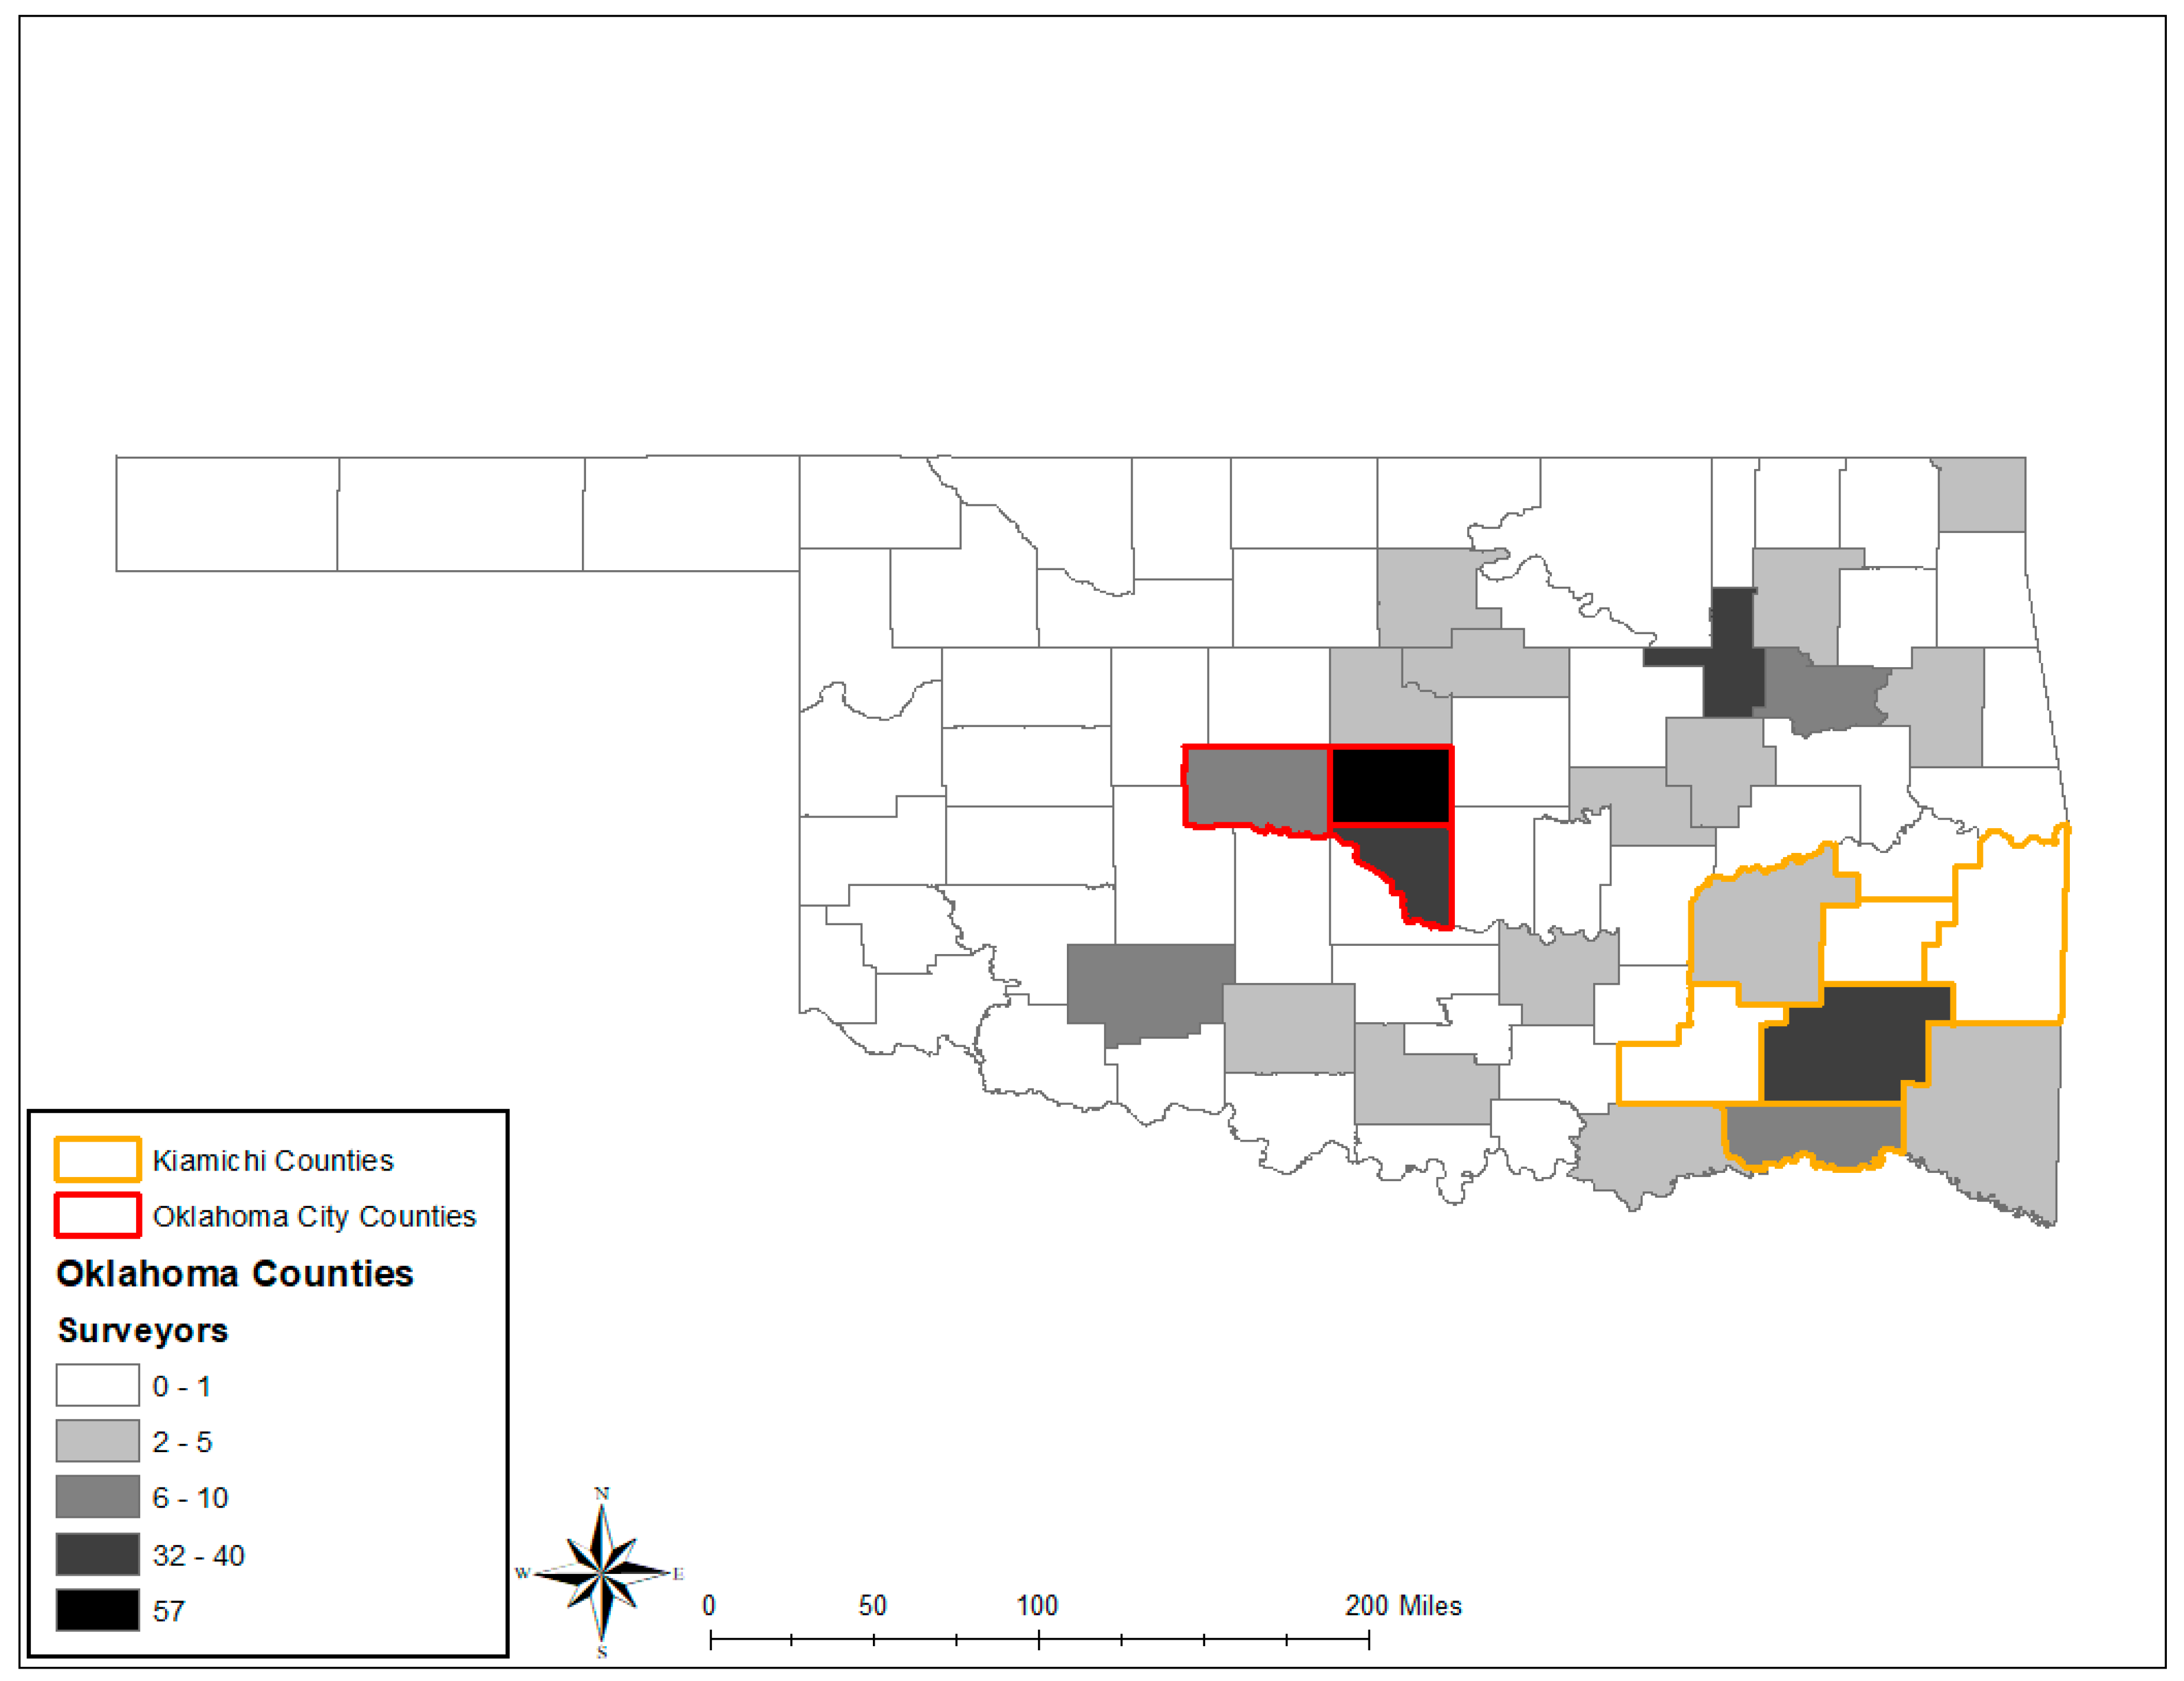
2.3. Antecedents and Sampling Strategy

A social survey was distributed in the summer of 2013 investigating valuation of and willingness to pay for ecosystem services provided by the Kiamichi River to residents in both Oklahoma City and the Kiamichi River watershed at large [11,14]. The survey was conducted via face-to-face interviews with a paper questionnaire at 30 sites within the Kiamichi watershed as well as six sites within Oklahoma City. Participants were selected randomly at these sites, and there was no contact with participants before the in-person solicitation. Surveys were conducted in public places including public libraries and parks, restaurants, etc. The original survey included 27 questions as well as panel illustrations representing differing water flow conditions. The panels were utilized to explore the perception of how ecosystem services may be impacted by changes in water flow (this portion was not included in our survey). The study found differing valuations of watershed resources between OKC and watershed residents. Residents in OKC were more likely to view the Kiamichi as a source of water for human provisioning whereas residents within the watershed were more likely to view the river as habitat for species. Furthermore, individuals who were more politically active were also more likely to be willing to pay for ecosystem services, regardless of location [11,14].
To see how opinions have changed over time and since the lawsuit was filed, we created a survey similar to Castro et al. [11,14]. The survey was hosted on the online platform Qualtrics and distributed the using Amazon Mechanical Turk (mTurk). mTurk is an online crowdsource labor force often used in the social sciences [29]. The participant pool was limited to residents of the state of Oklahoma and participants were compensated $1.00 for survey completion. We attempted to oversample locations relevant to the water diversion plan to capture a greater diversity of ESBs by using email solicitations targeting public libraries in southeastern Oklahoma and Oklahoma City with flyers about our survey. Libraries who agreed to assist in distribution posted fliers in their building and on their respective social media pages.
Due to discrepancies in internet access between OKC and the watershed region, we also traveled to southeastern Oklahoma to administer the survey instrument to residents directly. We traveled to Hugo, Antlers (6 April, 2019), McAlester, and Talihina (12 April, 2019), Oklahoma, to survey residents at public library locations. Surveys were distributed via tablet, and surveyors did not interact with individuals during the survey. While there, we posted flyers in local businesses and gas stations to increase the visibility of our survey to residents in the area. Participants that took the survey in-person or through local recruitment posters were entered to win one of four $25 Walmart gift cards.

2.4. Survey Design

Our social survey first asked how much people knew about the Kiamichi River Watershed and the amount of news that they had seen about the river and the lawsuit. We included a section designed to test the impact of media on ecosystem valuation (H1). In this section, participants were randomly shown one of three options: (1) a news article from the perspective of Oklahoma City residents, (2) a news article from the perspective of Kiamichi Watershed residents, or (3) a no message control. Articles were of similar length, were written to have similar but conflicting tones, and were written in the style of a news article [30,31]. The next section asked people about the ecosystem services provided by the Kiamichi River. We defined eight ecosystem services, as provided in the original survey by Castro et al. [11,14]. We asked how much people would be willing to pay to maintain these ecosystem services (H3). We then compared respondents’ political participation with knowledge and valuation for the river (H2). The final section determined the demographics of the participants. If a participant was randomly selected to read an article about the Kiamichi River, they completed 38 questions. A survey without the article was 35 questions long. The survey content is provided in Appendix A for reference.
To ensure participants were paying attention during the survey, there were two or three attention questions (depending on whether a media article was absent or included in the survey, respectively). If participants failed to answer the majority of the attention questions correctly, they were excluded from our analyses. Similarly, the Qualtrics platform allows reviewers to see the amount of time it took participants to complete the survey. If the 35–38 question survey was completed in less than four minutes, we assumed that the participant was not carefully considering the questions in our survey, and their responses were also excluded. We determined the four-minute threshold by timing researchers testing the survey as well as the average time to complete by participants.

2.5. Sample Characteristics

In total, 262 surveys were completed by residents of Oklahoma in the Spring of 2019. Nineteen of these surveys were removed, following our criteria above, leaving 243 responses for final analysis. More surveys were completed by residents of Cleveland, Oklahoma, and Tulsa counties (50.2%) than other counties in the state of Oklahoma (Figure 2). These three counties represent large centers of population in the state. Within the survey, we asked individuals to identify the type of ecosystem service beneficiary they would classify themselves as, utilizing the beneficiary classes outlined in Castro et al. [11,14]. We found that 13.6% were residents near the river, 28% were residents of the Oklahoma City MA, 21.8% visited the watershed area for recreation and/or tourism, less than 1% visited the area for business, 2.9% said their relationship was not listed, and 33.3% said they had no relationship with the watershed.
The average age of respondents was 39, 63.8% of respondents were female, 35.8% were male, and one individual identified as non-binary. 76.5% of respondents were white, and 23.5% were non-white, including 10.5% Native American, 5% Black, 5% Hispanic, 3% Asian, and one individual who chose an ethnicity not listed. 55% of individuals were employed full time, with only 9% currently students and 6% retired. 62% of respondents had an income of less than $60,000. Most respondents had completed at least some form of higher education, with 12% having completed a two-year degree, 31% having completed a four-year degree, and 25% with some college experience. 39% of individuals said they lived in a rural community, 46% said they lived in a suburban community, and 15% said they lived in an urban community. When looking at political affiliation, 28% of respondents identified as Republican, 37% identified as Democrat, 29% identified as Independent, and 5% identified as “Something Else”. These demographics are similar to the overall state but skewed slightly whiter, a few years older, more female, wealthier, and less likely to identify with a political party [32,33].
To provide context for the demographics of our two focal groups, the OKC group is located within the counties that reside in the city limits of Oklahoma City (Oklahoma, Canadian, and Cleveland Counties). Oklahoma City has a population of 629,191, making it the largest city within the state of Oklahoma. This group is mainly composed of the White community, making up 67.7%, and having a small percentage of Native Americans, 2.8%. As the OKC group contains the capital, the median household income is higher than the watershed group, $51,581, and the population is made up of 19.5% having a bachelor’s degree [34].
The watershed group is located in the Kiamichi watershed of southeastern Oklahoma. This geographic region is comprised of more vegetation than urban land use (National Landcover Database, 2016) in comparison to the OKC group. This rural geographic region has three counties (Le Flore, Pushmataha, and Choctaw Counties) with cities that are of a significant influence on the water supply within the watershed. Kiamichi watershed is a large area but only contains a total population of 75,660. This group contains a much higher native American makeup of its population, 14.17%, and still possess a high population of White demographic background, 71.17%. As the watershed group is in rural Oklahoma, the median household income and percent of population having a bachelor’s degree is lower, $35,598 and 10.37%, respectively [35,36,37].
47.7% of respondents said they knew nothing at all about the river, 28.63% said they knew a little, 17.18% said they knew a moderate amount, and the remaining 6.49% said they knew a lot or a great deal. Individuals were also asked to identify how much news coverage they had seen on issues surrounding the river. 55.34% of individuals said they had seen nothing at all, 25.57% said they had seen a little, 12.98% said they had seen a moderate amount, and the last 6.11% had seen a lot or a great deal of coverage. Lastly, individuals were asked how much they felt the Kiamichi River contributed to their well-being. Irrespective of location, 74% of respondents indicated that the Kiamichi River contributed to their overall wellbeing. The meaning of well-being was not specified and left to the interpretation of the participant.

2.6. Statistical Analysis

We used analysis of variance (ANOVA) to test for differences in binary willingness to pay (WTP) (yes or no) and the amount WTP among participants exposed to media coverage and the control group (H1). We chose to use a type-III ANOVA as it is more robust to differences in sample sizes [38]. Our continuous response variable (amount willing to pay) was non-normally distributed so we used a log(x+1) transformation to improve normality in our linear regression models. Our other continuous variable (willingness to pay) was binary, so we chose to create logistic regression models. We used the type-III ANOVA when evaluating modeled relationships with demographic factors and WTP response variables. After running an ANOVA, to investigate whether demographic characteristics impact willingness to pay, we used pairwise Wilcoxon rank sum tests to test for pairwise differences between groups, adjusting our p-values with a Bonferroni correction for multiple comparisons (H3). For continuous and semi-continuous predictors (i.e., age, income, political participation score), we used linear regression (H2). We created tables for the mean amount WTP ($) and rankings for each ecosystem service broken down by the respondent’s relationship to the Kiamichi. We used Kruskal–Wallis tests to identify WTP differences between ESBs for each ecosystem service. To evaluate how WTP and ecosystem service valuation had changed since 2013, we used the Heckman two-stage model (H4). The model’s first stage processes the binary WTP through a probit-regression analysis. The second stage uses ordinary least squares regression to explain the continuous positive amount a participant is willing to pay. This model is often useful with economic valuation analyses because of its robustness to sample selection bias (i.e., when we subset only values greater than 0) [15]. Further, the Heckman model maintains dependence between the two response variables by computing the between-term error covariance. The Heckman model requires that investigators select variables to input into both stages. We selected variables similar to ones selected by Castro [11,14] for easier comparison. The results of this Heckman model will be referred to as the results of the comparative Heckman. Further, we used an Akaike information criterion (AIC)-based step-forward variable selection process to mitigate potential bias in variable selection for each part of an additional Heckman model. The selection process creates regression models from a suite of candidate explanatory variables by selecting explanatory variables using AIC and adding them stepwise until there are none left. Forward selection is a form of stepwise regression, where we start with a null model and add variables in one at a time. At each forward step, we add one variable that gives us the single best improvement in our model [39]. Variables selected in this manner included political identity, community type, and relationship to the study area, allowing us to evaluate our related hypotheses. The results of this Heckman model will be referred to as results of the AIC-informed Heckman. All analyses were performed in R and leveraged the following packages: ‘sampleSelection’ [40], ‘MuMIn’ [41], ‘ggplot2’ [42], and ‘olsrr’ [43].

3. Results

3.1. Exposure to Information

At the beginning of the survey, participants were randomly assigned one of two articles described above or a no article control to test how reading about the issue from one perspective influences people’s responses to questions (H1). We ran a multi-way ANOVA and found that there was no significant difference between treatments regarding WTP for ecosystem services (F = 1.04, p = 0.355) and for amount WTP (F = 1.93, p = 0.149).

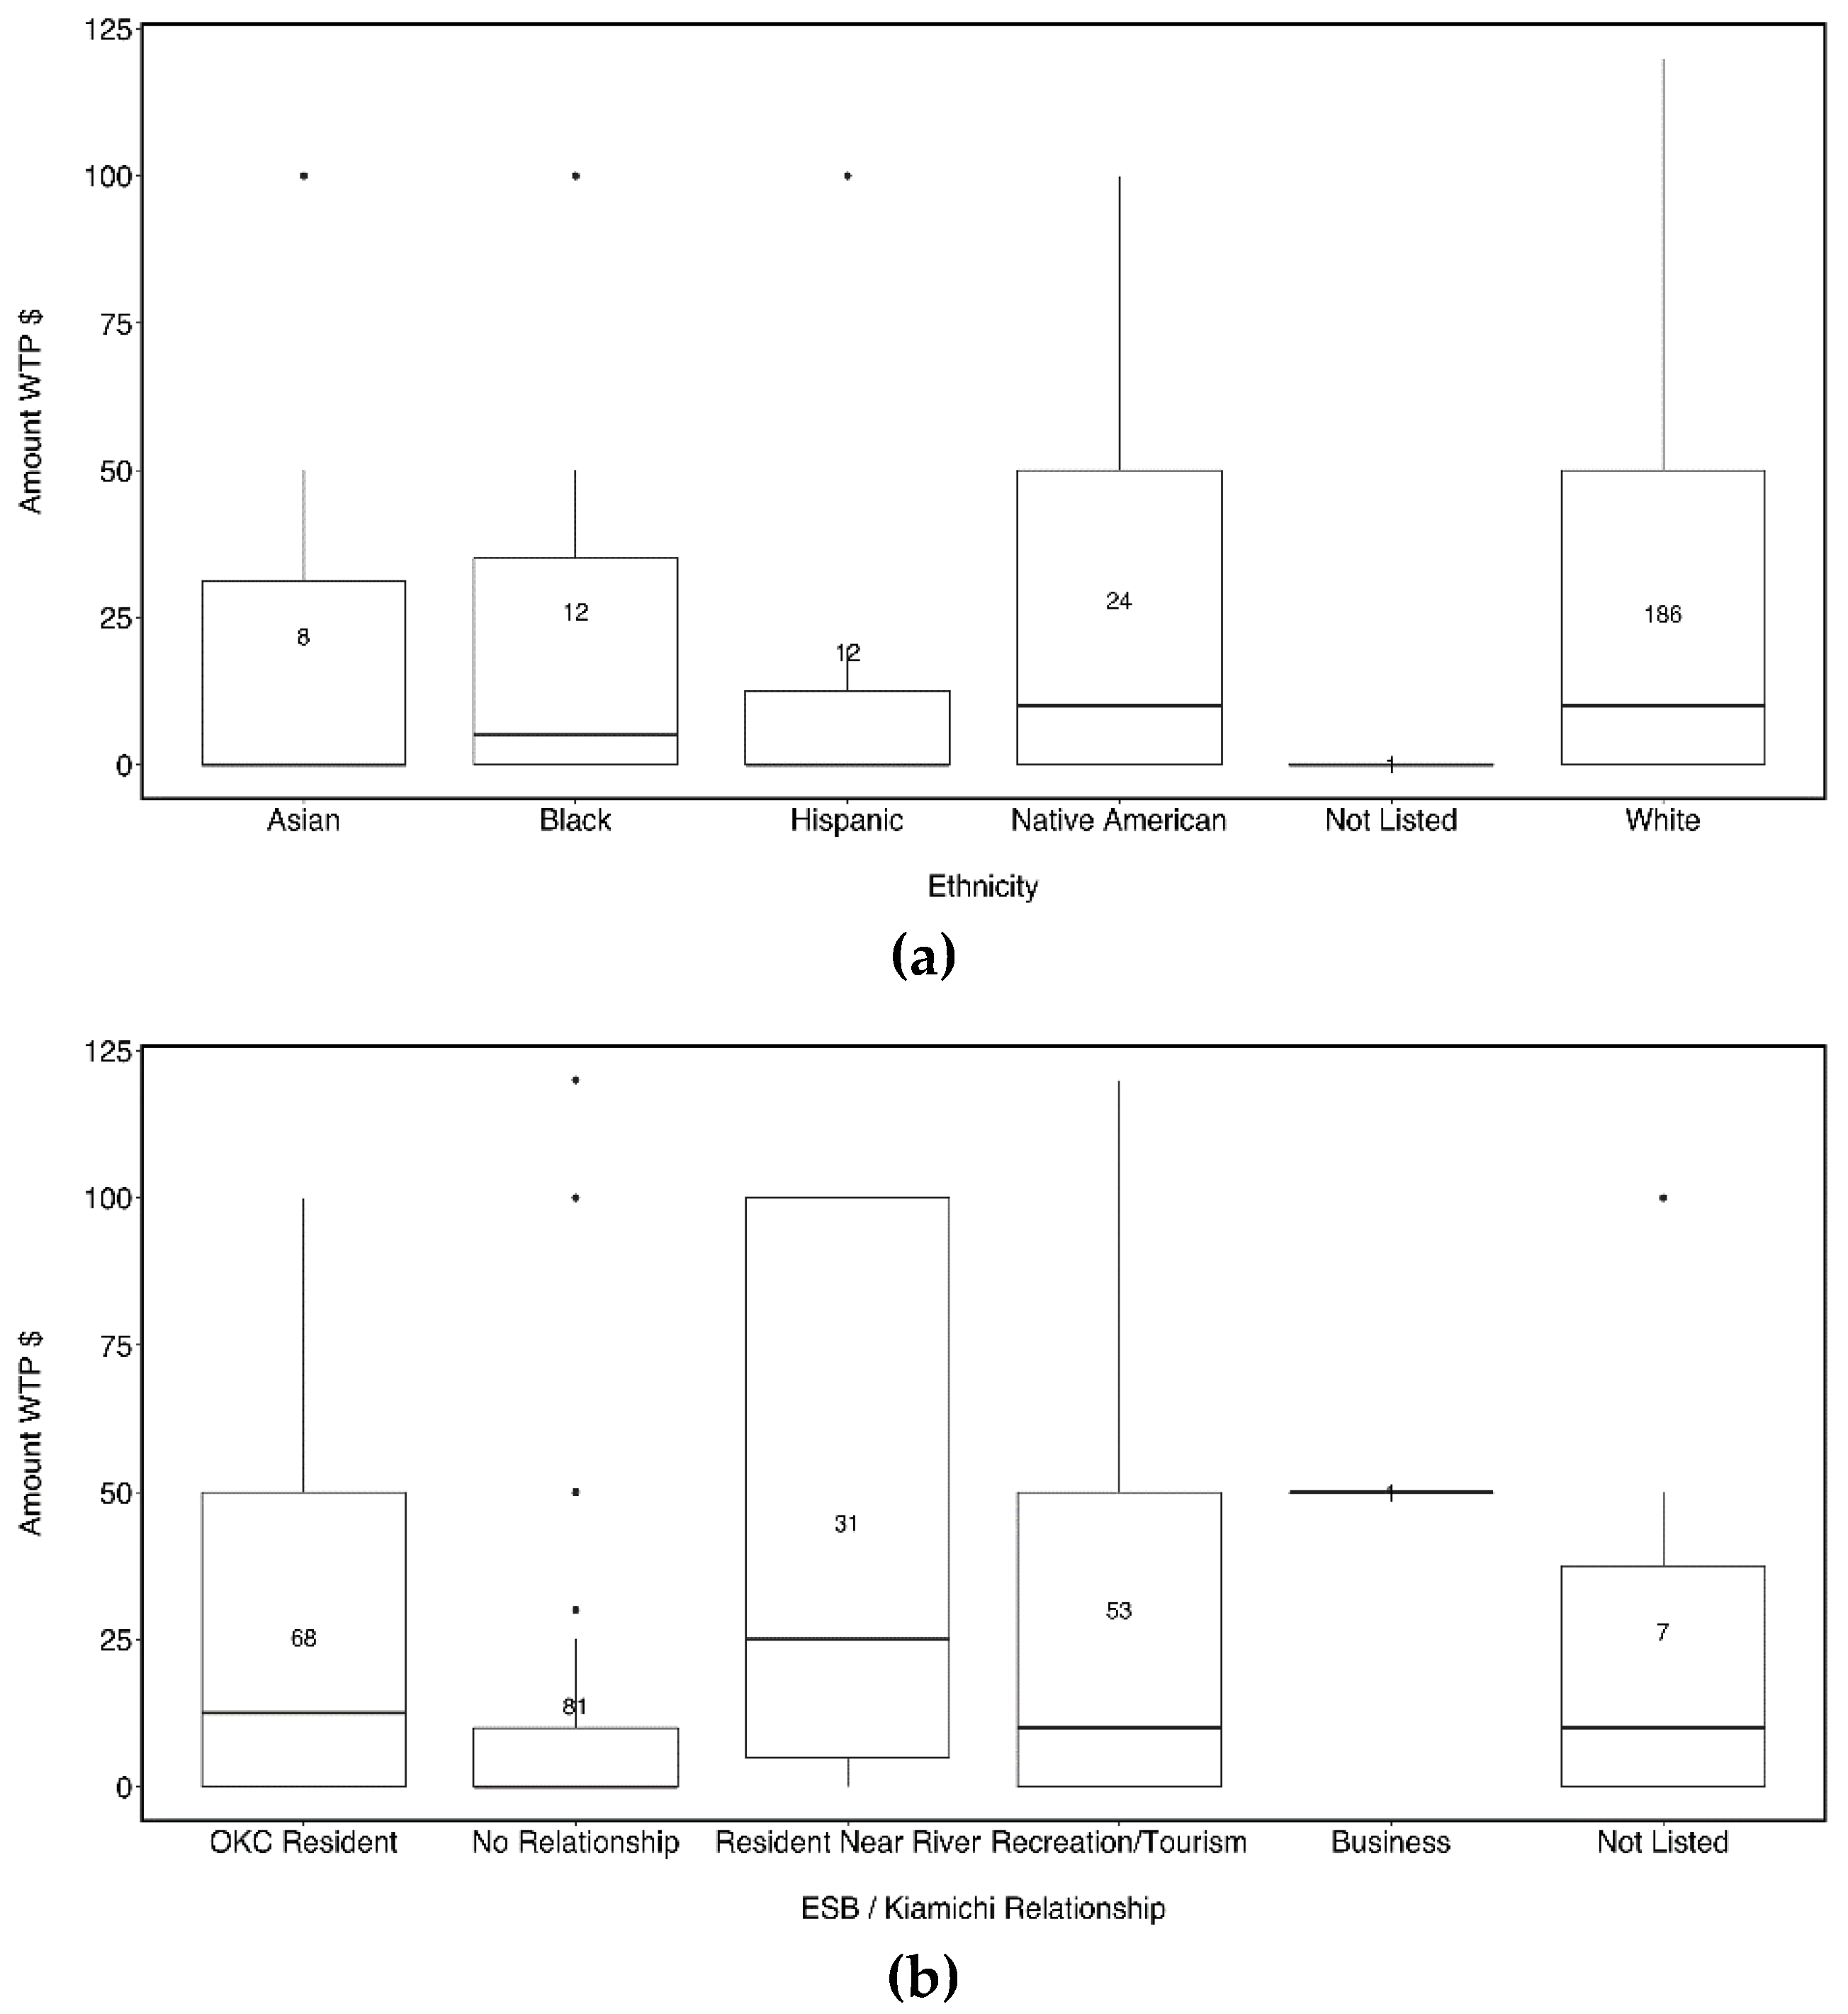
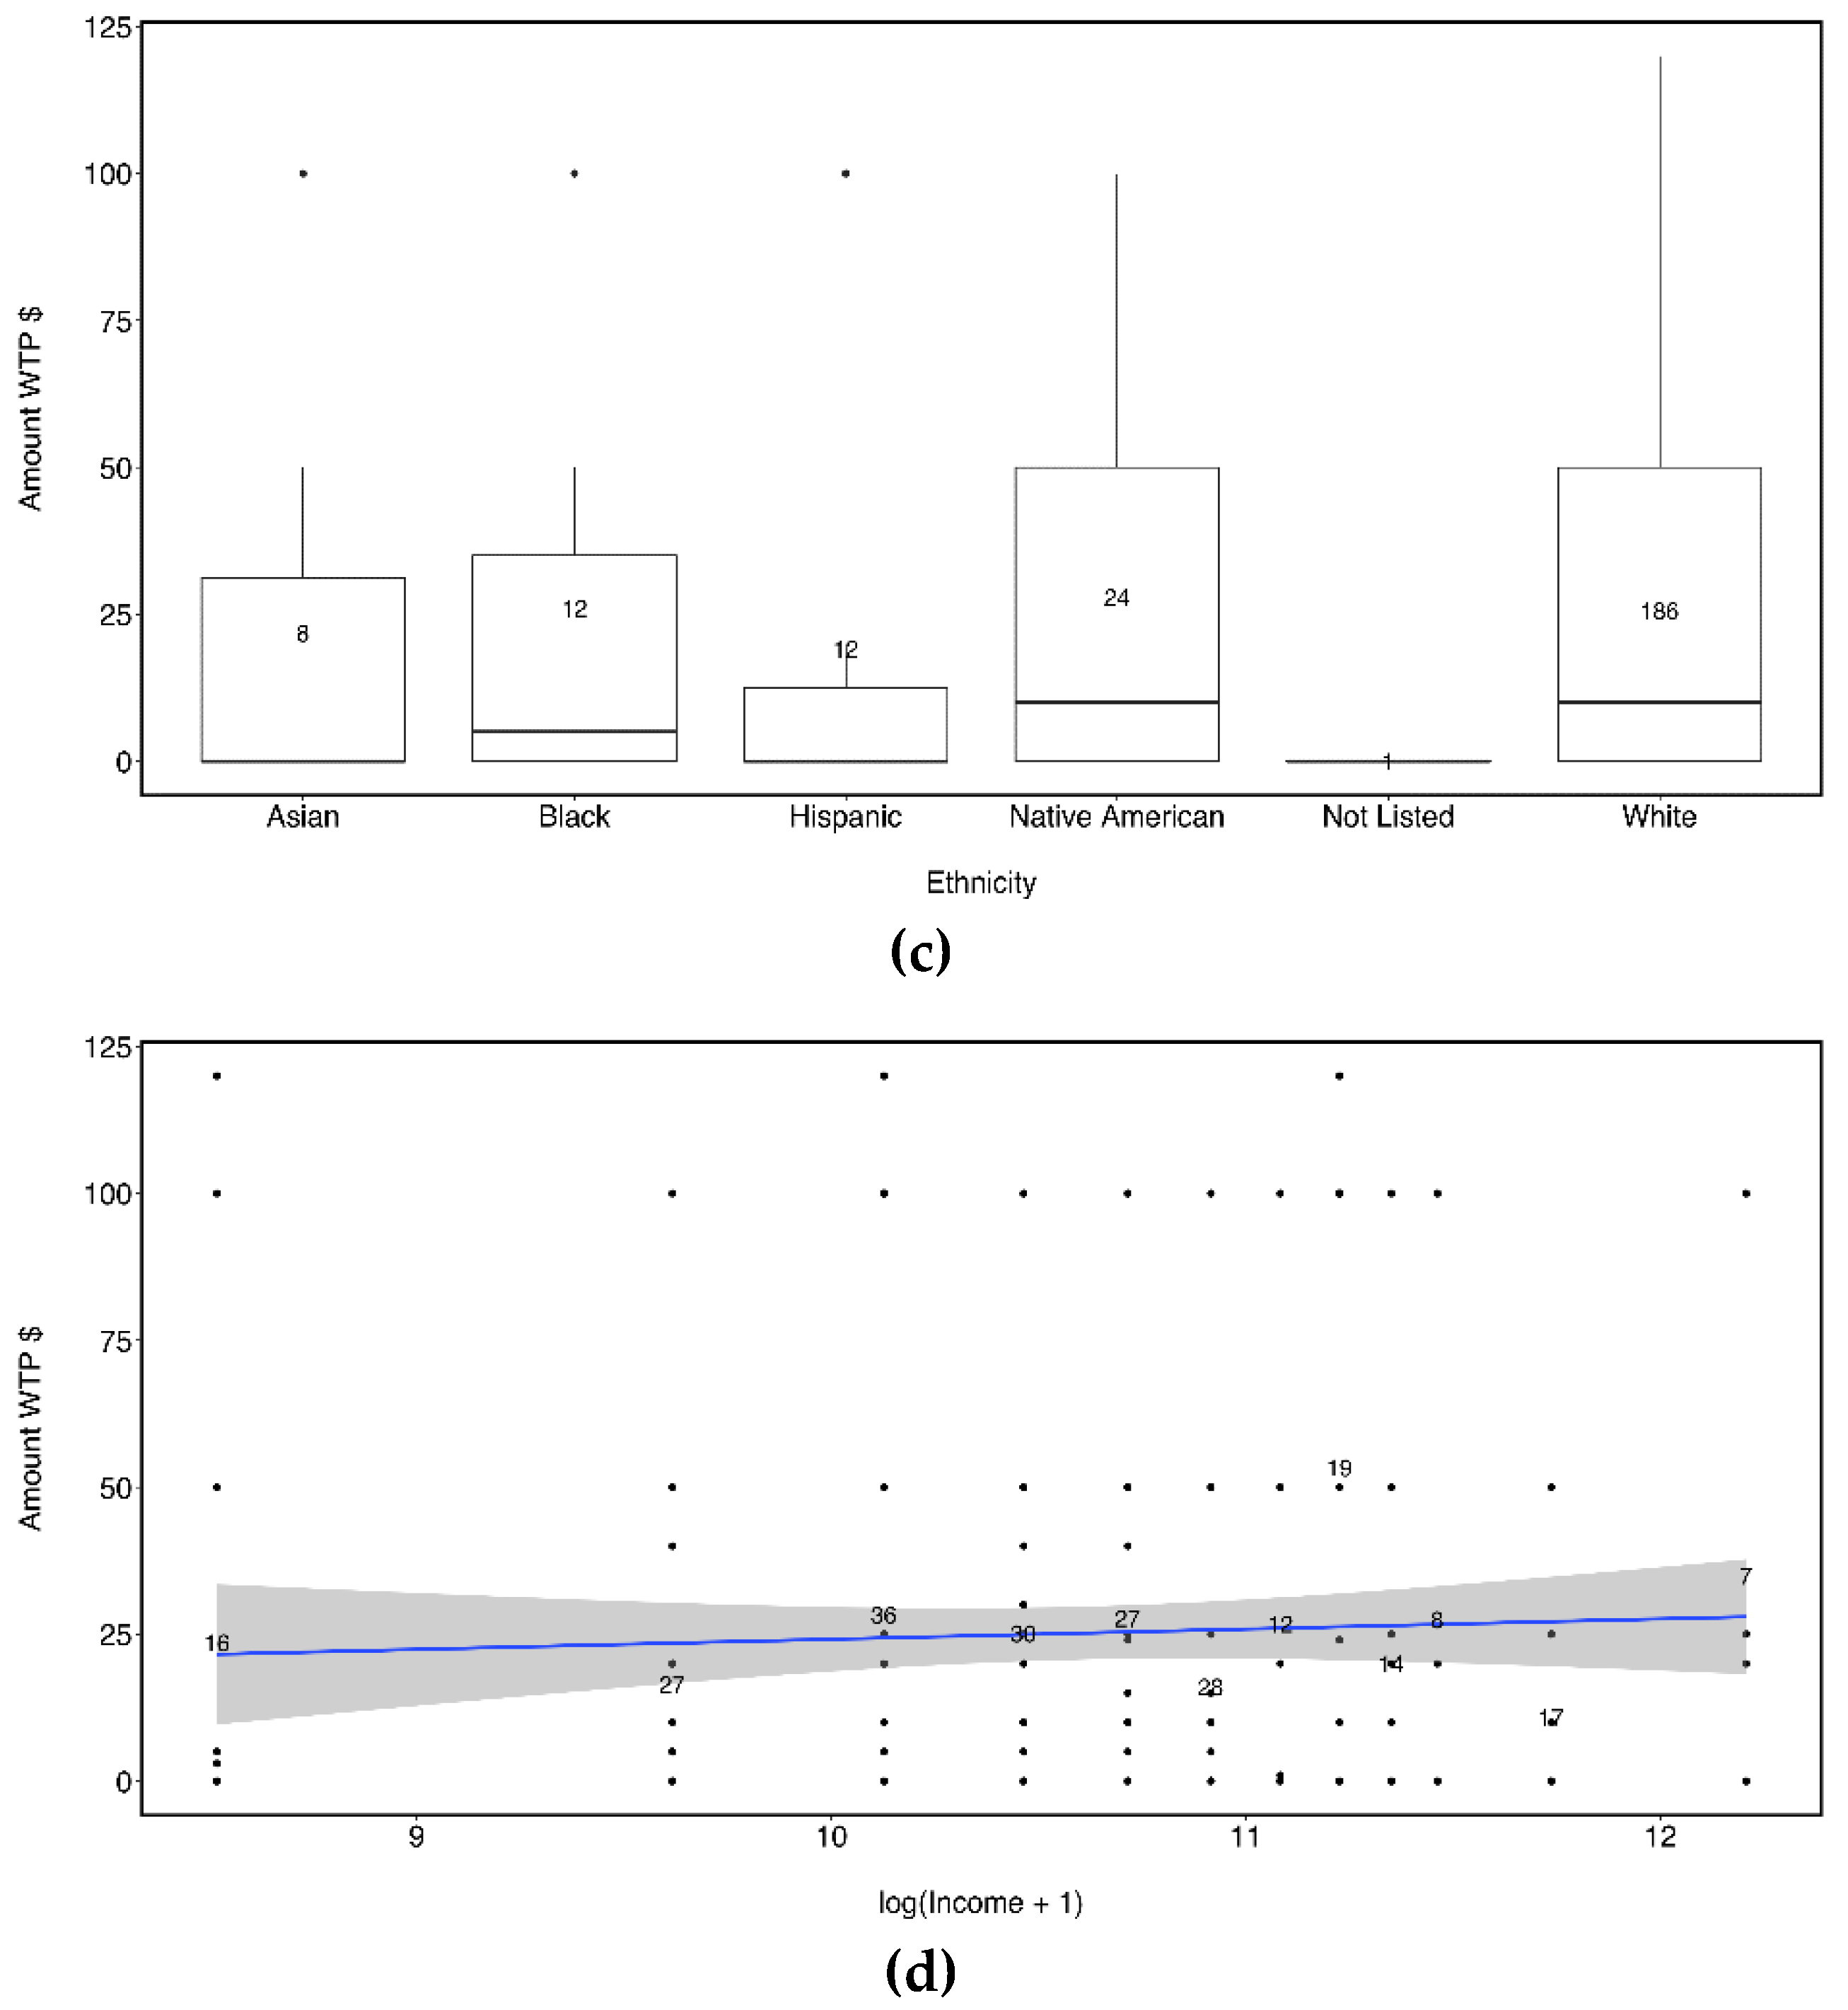
3.2. Demographics and Willingness to Pay for Ecosystem Services

Most of the respondents classified themselves in six different ethnicity groups. Among the responses, one person did not identify with any of these categories. Among the rest of the respondents, the highest willingness to pay were those who identified as Asian, which had only two respondents. One hundred respondents identified as white and had the third-highest willingness to pay. When grouped into white and non-white categories, we see that white respondents were willing to pay more than non-white respondents. We did not find a significant difference in willingness to pay (F = 0.007, p = 0.9320) for ecosystem services or amount willing to pay (F = 0.9701, p = 0.326) between white and non-white ethnicity groupings (Appendix B, Figure A1a).
ESBs were classified into six groups: (1) Oklahoma City MA resident (68 participants), (2) resident near the water (33 participants), (3) business visitors (1 participant), (4) tourism (53 participants), (5) no relationship to the river (81 participants), and (6) not listed (7 participants). As we hypothesized, residents near the river were more likely to pay, whereas people who said their relationship with the river as an OKC resident and people who did not have a relationship to the river were less willing to pay for maintaining watershed services (H2; Figure A1b). We found significant differences in binary WTP among ESBs (F = 1.08, p = 0.001). Post-hoc Wilcoxon rank sum tests showed that ‘no relationship’ (NR) ESBs drove the significant differences between ESBs (NR:OKCMetroRes p = 0.046; NR:ResNearRiv p = 0.002, NR:VisitRecTour p = 0.15). Although an ANOVA showed no significant difference was found in amount WTP between ESBs throughout the state (F = 1.104, p = 0.361), a Wilcoxon rank sum test showed a marginally significant difference between our focal groups: OKC residents and residents near the river (W = 618, p = 0.08) with residents near the river having a higher WTP (H3). In addition, results from the first stage of our AIC-informed Heckman model indicated that having no relationship with the river had a statistically significant, negative impact on the binary WTP response. Partial-omega-squared effect size value and power (for the ‘no relationship to the river’ predictor on the binary response) suggests a moderate practical significance (ωp² = 0.07, power = 0.992).
In our study, respondents associated themselves with one of three community types: (1) rural, (2) suburban, or (3) urban (Figure A1c). An ANOVA showed no significant difference in amount WTP among community types (F = 2.148, p = 0.121). However, we found a significant difference in WTP among community types (X2 = 4.11, p = 0.02). Post-hoc pairwise comparisons of willingness to pay versus community types showed that there was a significant difference between rural and suburban groups (p = 0.028) but not between rural and urban (p = 0.2) or suburban and urban (p = 1). In addition, in the first stage of our AIC-informed Heckman model, we found that living in a rural community had a statistically significant, positive impact on the binary WTP response. Partial-omega-squared effect size value and power (for rural community type predictor on binary response) suggests a moderate practical significance (ωp² = 0.02, power = 0.696, respectively).
We found no relationship between household income and amount willingness to pay for ecological services (R2 < 0.001, p = 0.172), and no relationship between income and WTP (R2 < 0.001, p = 0.55) (Figure A1d).

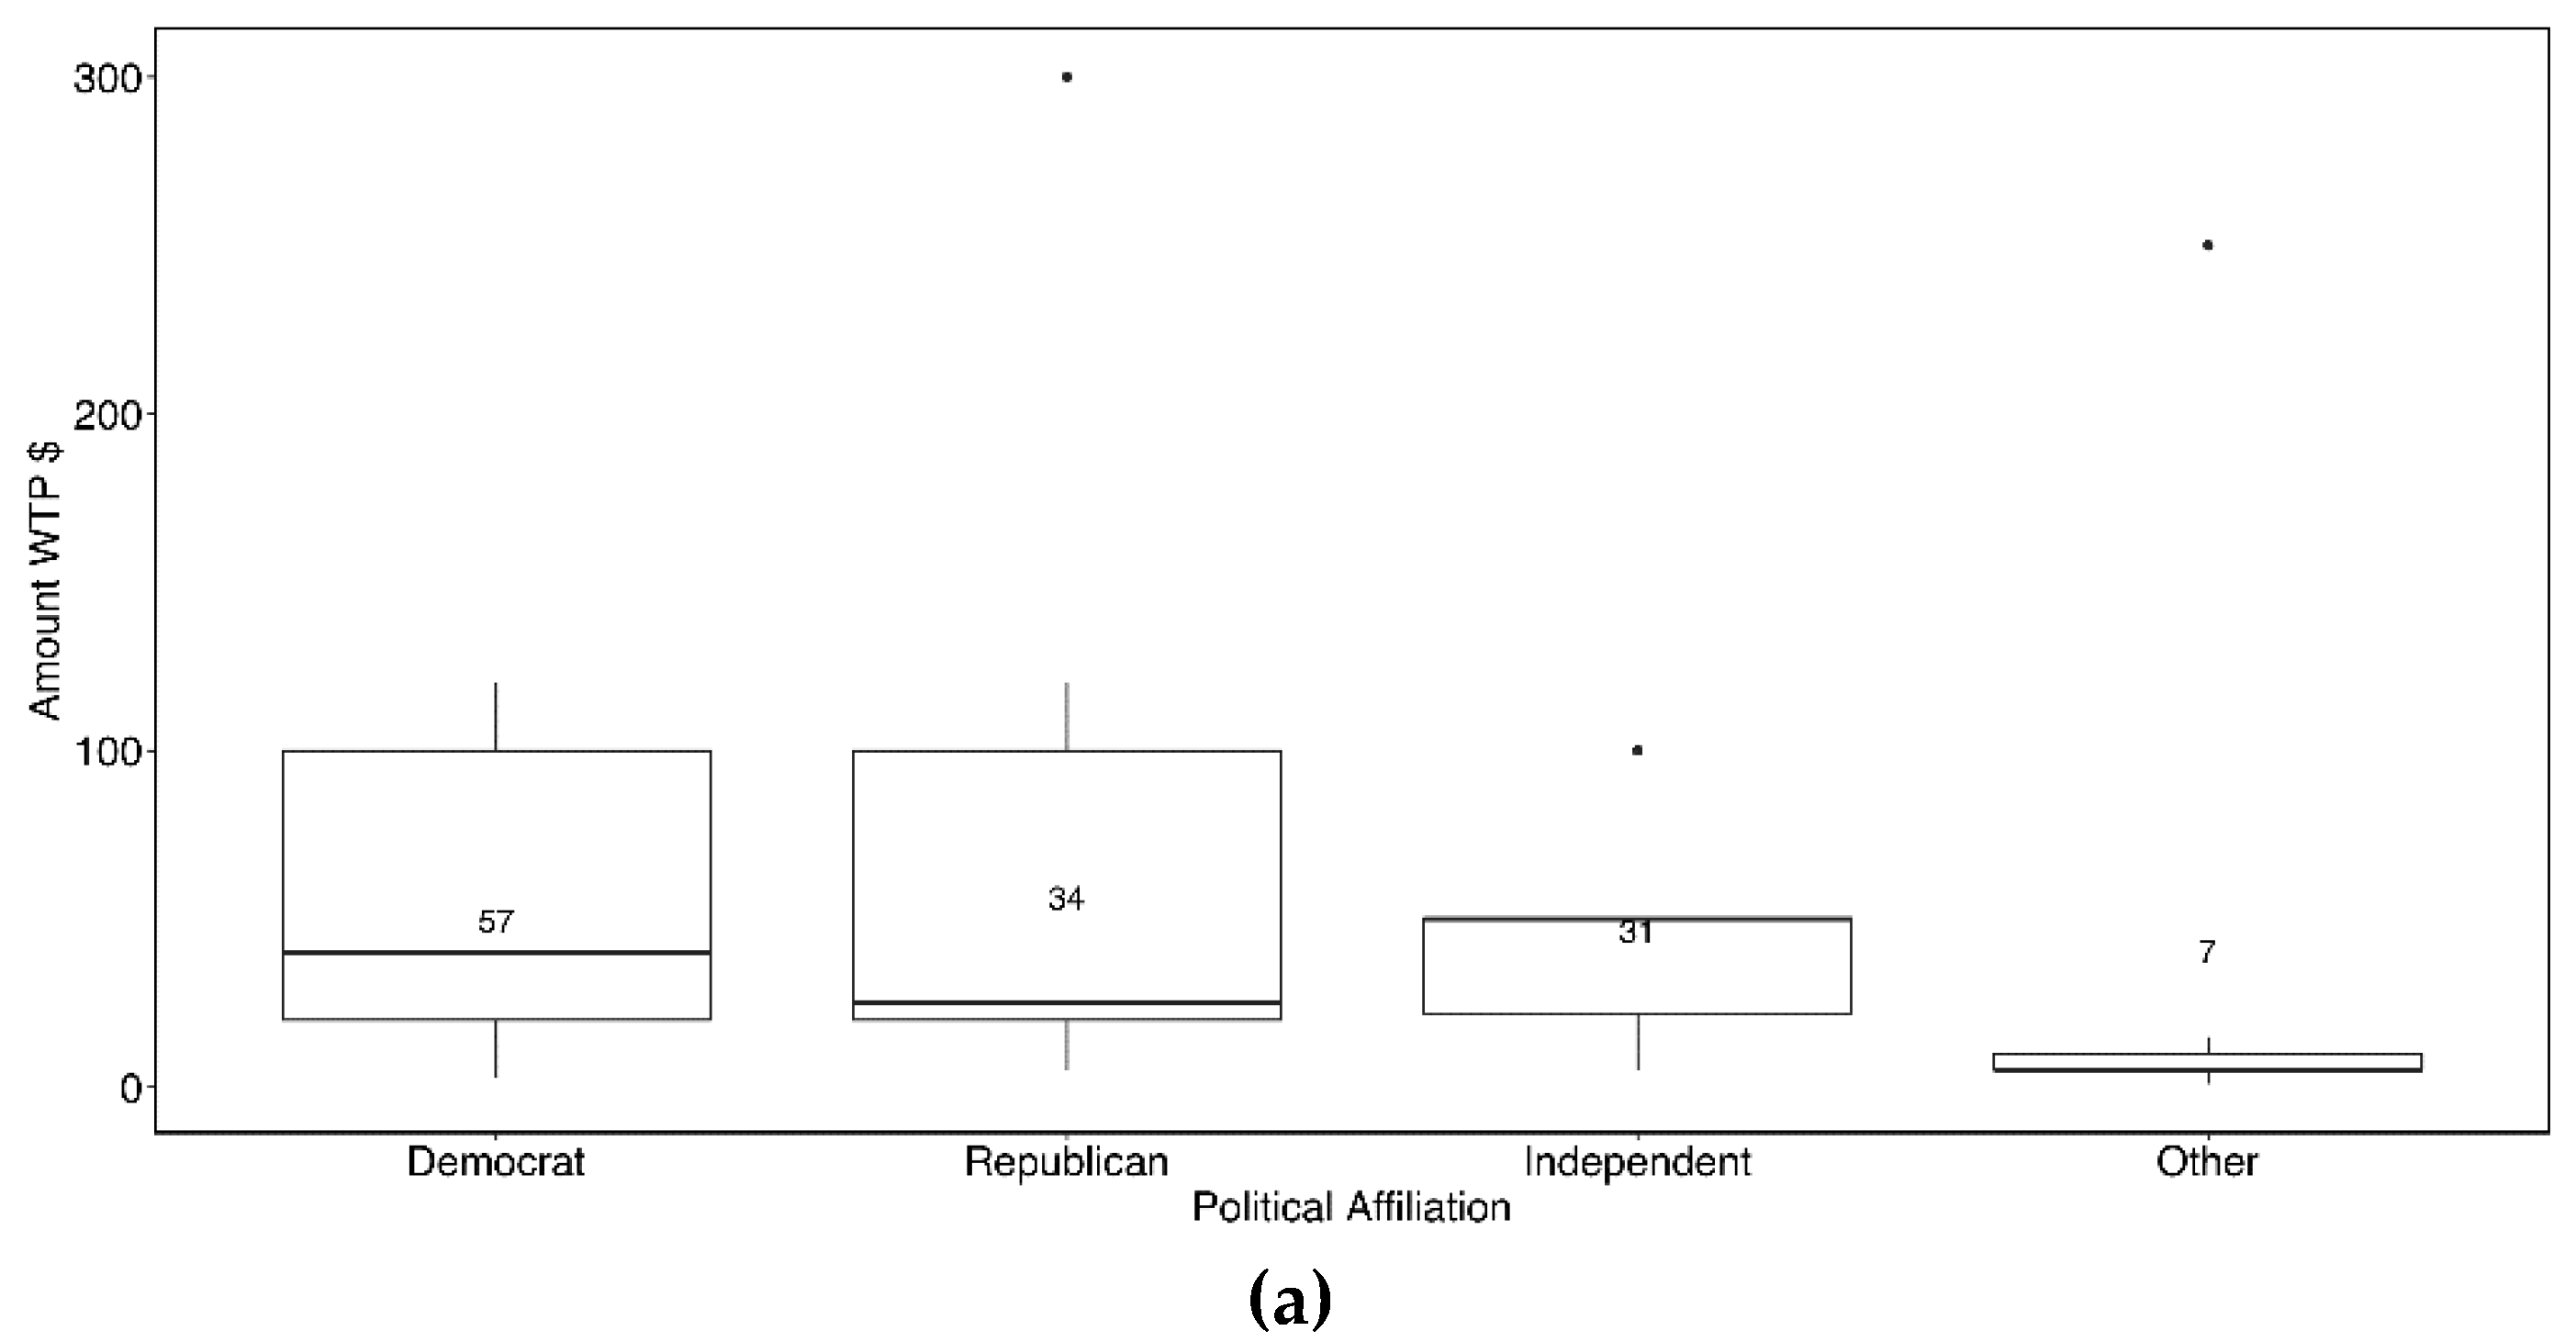
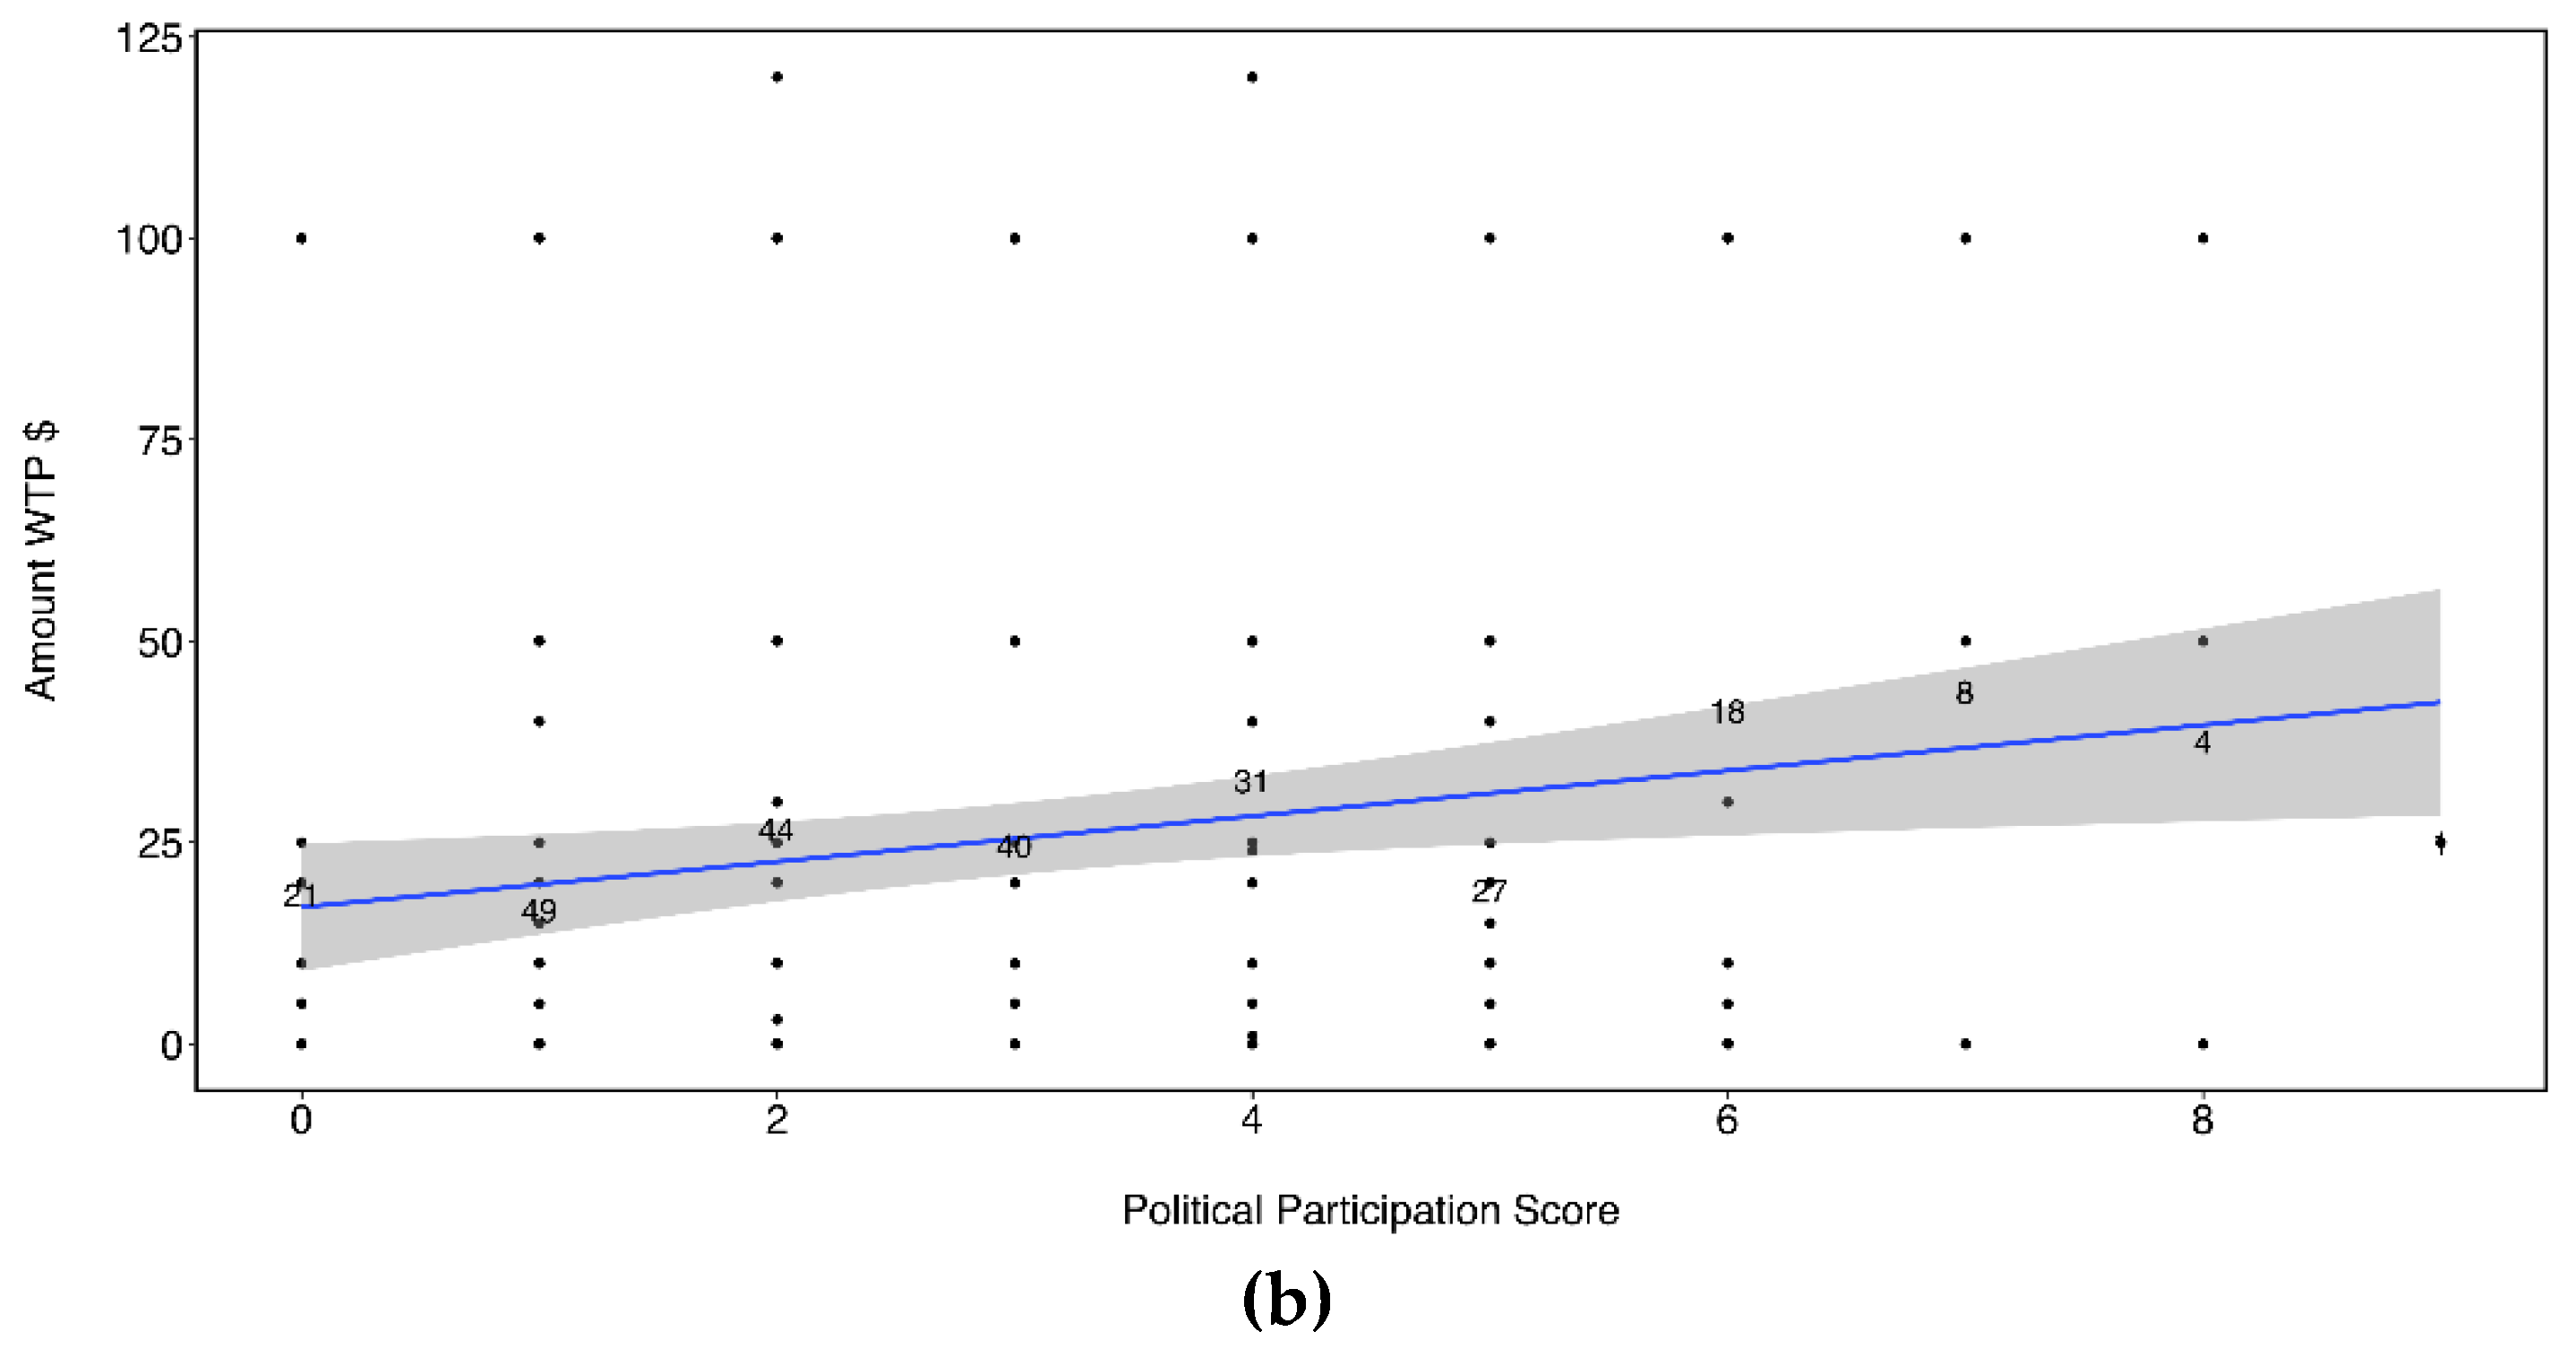
3.3. Political Affiliation

Most respondents classified themselves as either Democrat (37%), Independent (29%), or Republican (28%), while some participants self-identified as “Something Else” (5%). An ANOVA showed a significant difference in amount WTP among political affiliations (F = 6.047, p = 0.001) but no significant differences in binary WTP (F = 1.874, p = 0.115). To further explore differences between political parties, we ran pairwise Wilcoxon tests in which we found significant differences between each major political party included in the survey (Democrat, Independent, and Republican) and those who self-classified as “Something Else” (p = 0.008, 0.003, 0.005, respectively) (Figure A2a). Outliers existed for all groups except Democrats. Multiple options were given for varying levels of political participation (see survey, Appendix B), and each option was weighted the same. Thus, the more activities any individual was involved in, the higher their cumulative score (Figure A2b). We ran an ANOVA on political participation score and found a significant relationship: the more political activities someone participates in, the more likely they are willing to pay to maintain ecosystem services, as we hypothesized (H3). More specifically, with each increasing “point” of political participation, the amount WTP increased about $3.20 ± 1.50 (R2 = 0.02, p = 0.04). Political participation score was not significantly correlated to binary WTP (R2 = 0.01, p = 0.102). The first stage of the AIC-informed Heckman model indicated that identifying as a Democrat had a statistically significant, positive impact on the binary willingness to pay. Partial-omega-squared effect size value and power suggests a slight practical effect and moderate power (ωp² = 0.024, power = 0.775, respectively). The second stage of the AIC-informed Heckman model showed that identifying as ‘something else’ had a statistically significant negative effect on the amount willing to pay. Individuals who identified as ‘something else’ were expected to pay $6.70±1.40 less. Partial-omega-squared effect size value and power suggests a slight practical effect and relatively weak power (ωp² = 0.015, power = 0.585, respectively).

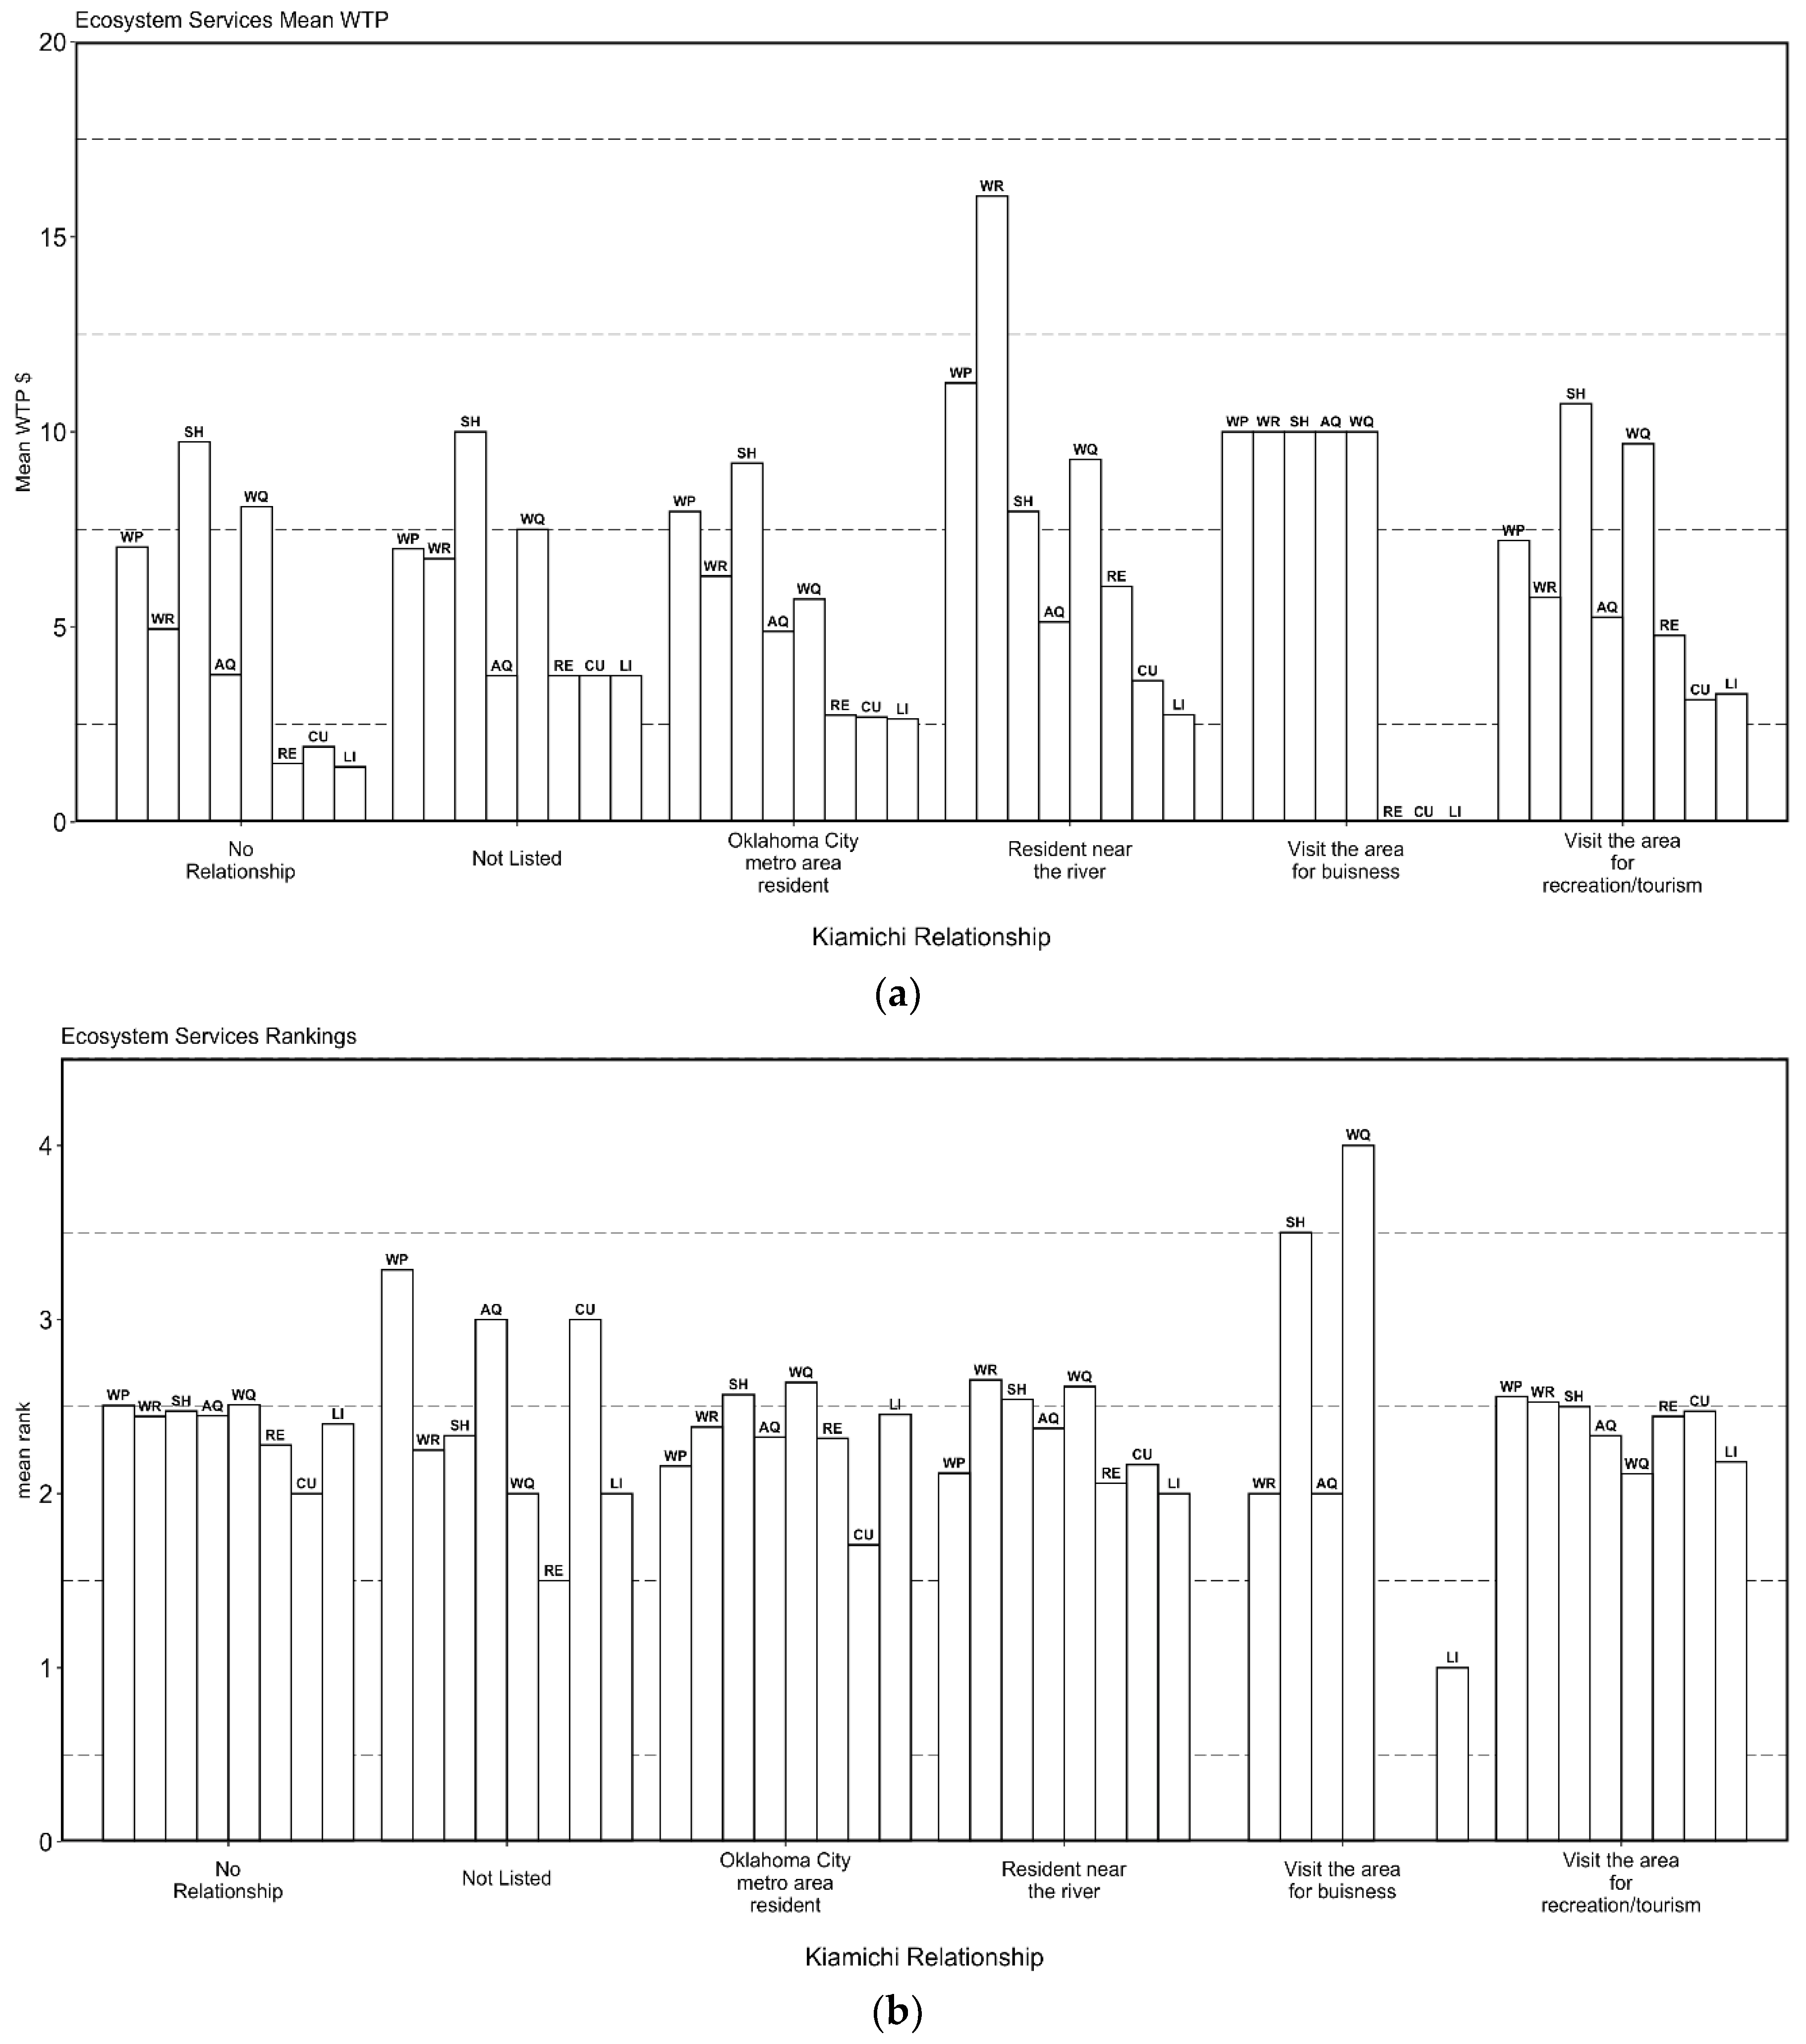
3.4. Willingness to Pay for and Ecosystem Service Preferences

For all ESBs except for residents near the river and those visiting the area for business, individuals were willing to pay the most for the conservation of species habitats. Residents near the river valued water regulation above all other ecosystem services, followed by freshwater provisioning (Figure 3a). There were no clear trends in the ranking of ecosystem services by our ESBs (Figure 3b). It is important to note that the sample size for the ESB group “visiting the area for businesses” was n = 1.

3.5. Castro et al. Comparison

We hypothesized that there would be a change in willingness to pay and ecosystem service valuation since 2013 (H4). Our survey collected responses from 242 respondents versus 505 respondents in Castro et al. [11,14]. Table 1 summarizes our respondent ESBs groups and compares to those from the survey in 2013.
Similar to Castro et al. [11,14], the majority of respondents in our survey expressed they had some relationship with the Kiamichi River. It should be noted that participants were only able to select one value to define their relationship with the Kiamichi River. For example, a participant could live in Oklahoma City and visit the river for tourism but could only identify with one of those relationships during the survey. In our survey, most respondents participated in at least one political activity ranging from 8% (n = 19) who volunteered at a polling location during an election to 74% (n = 180) who signed a petition. While there is no direct comparison in terms of political participation, it is noteworthy that 64.0% (n = 323) of respondents in Castro et al. [11,14] indicated having participated in a social or work organization.
Our survey indicated that 54% (n = 131) of respondents were willing to pay (WTP) for ecosystem services provided by the Kiamichi River while 70% (n = 354) of respondents in Castro et al. [11,14] ranked ecosystem services provided by the Kiamichi River as "very important". In our survey, species habitat ranked as the highest WTP, which is the same for respondents in Castro et al. [11,14]. Water provisions and water regulations (or water quality) WTP were somewhat lower for both our survey and the Castro et al. [11,14] perception ranking, but still ranked rather high in terms of importance for both. Local cultural identity ranked least important in terms of WTP and perception ranking in both our survey and Castro et al. [11,14], respectively.
Comparing Heckman model results, in which the input variables were the same between Castro et al. [11,14] and our own when determining which factors had a statistically significant impact on willingness to pay, Castro et al. [11,14] found that in stage one of the models, having visited the area before, education level, government influence, community affairs, and if the respondent identified with any tribe, all had a positive impact on willingness to pay. In comparison, stage one of our analysis found only one significant factor: if individuals were a resident of the watershed. For stage two of the model, Castro et al. [11,14] found that income, identifying with any tribe, government influence, and education all had a positive impact on willingness to pay while identifying as an Oklahoma City resident had a negative impact. Our survey, in comparison, showed no significant factors.
Looking at the raw dollar amount individuals were willing to pay for ecosystem services, Castro et al. [11,14] found that all ESBs were willing to pay an average of $270.81 annually. Our survey found that all ESBs were willing to pay $238.74 annually. We excluded the “visiting for business” ESB from our total because the sample size was n = 1 and included the “no relationship” and “not listed” ESB groups. To compare the average dollar amount WTP, Table 2 shows three of the ESB groups, including the two focal groups (Oklahoma City MA residents and residents near the watershed). Species habitat had the highest average WTP in Castro’s [11,14] survey ($21.28), whereas water regulation had the highest average WTP in our survey ($9.37). For freshwater provisioning, Castro’s [11,14] respondents were willing to pay $2.96, and our respondents were willing to pay $9.37. Cultural services received the lowest amounts in both Castro et al. [11,14] and our surveys. Castro’s results were $6.06 for recreation, $1.84 for cultural heritage, and $1.35 for local identity. Our results were $4.52 for recreation, $3.15 for cultural heritage, and $2.89 for local identity. Our survey found that watershed residents were willing to pay the highest amount at $62.08 while tourists were willing to pay $49.84, and our one business respondent indicated they would be willing to pay $50. In Castro et al. [11,14], business visitors were willing to pay the highest ($67.95 and $56.58, respectively) while watershed residents were willing to pay $53.82. Both our survey and Castro et al. [11,14] found watershed residents value habitat for species, but Castro et al. [11,14] found recreation ($6.05) and water quality ($9.22) to also have high economic value, while we found that our respondents identified water regulation ($9.37) and water provisioning ($8.81) to have higher economic value. Oklahoma City residents in Castro et al. [11,14] were willing to pay $38.54, whereas they were willing to pay $42.12 in our survey. The 2019 survey found that those who said their relationship to the river was not listed were willing to pay $46.25, and those who said they have no relationship were willing to pay $38.45 (Table 2).

4. Discussion

4.1. Exposure to Information

Studies have shown that message manipulations can lead to changes in psychological states, including interpretations of issues regarding the environmental impacts of development decisions [44,45]. By presenting one of two articles with opposing viewpoints, we expected readers would interpret the issue to be one-sided and their WTP answers (both yes or no, as well as the amount) to be informed by their assigned article. There was, however, no difference between treatments in our study (H1), which could be attributed to several factors. While our articles were pulled from local news sources, the formatting was altered, potentially lowering its credibility. Presenting the article as formatted directly from the news source, including the reference to the news outlet, could have had a different impact. Tewksbury et al. [44] found that their more extremely biased articles had larger impacts, and thus our articles may not have been written with enough bias. Finally, the issue of the Kiamichi River has gained more notoriety so participants may have been exposed to this information before and are therefore less likely to be affected by our introduced articles. Half of our participants stated that they knew at least a little about the Kiamichi River at the time of our survey. These participants may have already formulated their own opinions on the issue and our slightly biased articles may not have been enough to change their minds.

4.2. Demographics

According to our results, residents living near the Kiamichi River, residents of rural communities, and those with higher household incomes, are more likely to be willing to pay for ecosystem services (H2). Rural residents and those along the Kiamichi River (which likely include the same individuals) may be more likely to pay to preserve ecosystem services because they see the river as supporting their economy. This finding agrees with previous research, which characterizes cities as the centers of demand for ecosystem services, while rural areas are thought to be providers of ecosystem services [46]. Additionally, due to a combination of water management practices and droughts over the past decade, reductions in the ability of the Kiamichi River to provide ecosystem services have become more evident. These reductions would be especially clear to residents of the watershed who are more likely to witness these changes [11,14,21]. Therefore, residents along the river would have disproportionate exposure to risks associated with a failure to preserve water resources, which is supported by research conducted by Ward et al. [47] and Welsh et al. [48]. Both studies found that people living in rural areas who face water conflicts had a greater awareness of water issues than others.
As mentioned earlier, a “Save the Kiamichi” community group started within the Kiamichi River basin in 2017. At the time of this survey, the group had over 7800 members on Facebook. Our surveyors intentionally avoided distributing the survey to this group to avoid sampling bias. The group, however, is large and well connected, and our survey was discovered and distributed to the “Save the Kiamichi” members. While the group’s participation may skew results, we believe they accurately represent the opinions of an active subset of residents within the watershed. High participation from members of this group may have contributed to the relatively higher WTP among rural and watershed participants compared to urban and more distant residents. Along these lines, however, this group may accurately represent the sentiments of the region because of their first-hand connection to the impacts.
Rural residents and those who identified as living near the watershed were more likely to be willing to pay for ecosystem services (H2). Individuals had the highest WTP for water regulation services (Figure 3a), which was defined as “watershed helps to regulate the quality and quantity of water available,” followed by freshwater provisioning, defined as “rivers provide water for human consumption and use”. In comparison, Oklahoma City residents had the highest WTP for species habitat, with freshwater provisioning a close second. Residents of the watershed were not only more willing to pay overall but were willing to pay more for water availability and quality as well as access to drinking water compared to Oklahoma City residents.
According to our results, 28% of respondents were from Oklahoma City, and they were less likely to pay to preserve ecosystem services (H2). People residing in urban areas may be unaware of ecological services provided by the river or of their source of drinking water [11,14]. Hence, they are less likely to pay to preserve water-related services. Oklahoma City residents will be the ones who benefit from the drinking water ecosystem service, even though they were willing to pay less to preserve this service. The watershed residents recognized the value of having consistent water volume in their rivers as well as access to drinking water and were willing to pay more to maintain it. Watershed residents, however, are the ones who will likely lose access to both ecosystem services if litigation fails, and Oklahoma City succeeds in being able to draw water from the region. It also seems to be counter-intuitive that Oklahoma City residents are willing to pay slightly more than watershed residents for species habitat (Figure 3a and Table 2), yet drawing water from the watershed for drinking purposes will degrade and destroy these habitats they are willing to pay to maintain [11,14,17,21].
It is important to note that, in our amount WTP results across questions, we found many people across all categories reporting they would be willing to pay $100. While these results may be true, the amount reported for some of these participants could have been chosen out of ease of reporting. Removing these $100 reports could result in higher R2 values with higher significance; however, there is no way to determine if these numbers are good indicators of willingness to pay or just a casual response. It is also important to recognize that our survey was limited to Oklahoma residents, even though the river is near both Texas and Arkansas. Water rights surrounding the Kiamichi River are also pertinent to Texans, who are seeking some water from the Kiamichi as well. Extending our survey to include these groups could alter our results.

4.3. Role of Political Affiliation

We found a significant but weak relationship between how politically involved participants are and how much they would be willing to pay (H3). We speculate that this relationship could be due to the increased knowledge of those who are more politically active regarding current topics of study. Especially for residents in the Kiamichi watershed, those that are more involved would, in theory, have more knowledge about ongoing water issues in the region and would, therefore, have higher WTP. While our options for political participation were broad, we hoped that having as many choices as possible would provide a comprehensive picture of the relationship between political activity and WTP. Due to the broadness of these categories, we were unable to weigh the varying levels of political participation according to the effort required to participate in them, which would potentially increase the significance of our findings. Future research could explore the impact of specific methods of political participation on valuation of the environment.
While environmental issues were broadly viewed as non-partisan when they gained popularity in the 1970s with the celebration of the first Earth Day, the gap between political parties and environmentalism has been growing ever since [49]. Studies in recent years have found that environmentalism is typically negatively influenced by political conservatism [50,51,52]. However, the “widening gap” and polarization of some environmental issues may have less to do with changes in beliefs and more to do with changes in individual voting behavior (voting to match party beliefs even if they do not align with personal beliefs) [39]. In addition, research has emphasized that the context of the environmental question is important—for example, if the ecosystem service can be provided or protected by private entities, Republicans are willing to pay significantly more than Democrats [53]. In our survey, participants living in the Kiamichi watershed mostly self-reported as Republicans (56.25%), and those in Oklahoma City mostly identified as Democrats (48.53%). Aligning with the findings of Cruz [39] and Dupont and Bateman [40], residents of the strongly Republican Kiamichi watershed were more willing to pay to protect ecosystem services.
By using WTP as a proxy of political support instead of solely party registration, the disconnect between the decision made by the Oklahoma Water Resources Board (OWRB) and watershed residents highlights the importance of research investigating the value and opinions of constituents for policymakers. The members of the OWRB serve staggered seven-year terms and are appointed by the governor of Oklahoma. While the OWRB is appointed, their actions reflect on those of the governor and, as with most elected officials, it is in the best interest of re-election to consider the interests of all voters. It is therefore not enough to predict the swathe of Republican voters in the Kiamichi River basin to vote along party lines. Our research instead lends itself to the idea that environmental support may be context-specific, and that political conservatism does not necessarily impede environmental protection.

4.4. Revisiting Preferences and WTP for Ecosystem Services Six Years Later

Our survey results only partially overlapped with the results found by Castro et al. [11,14] (H4). We cannot assume causation as we were not able to replicate the sample size of Castro et al. [11,14], but our broader scope of contact for the survey allowed for the inclusion of individuals from the entire state of Oklahoma. We also introduced a new survey platform to the study, allowing for a continued comparison of the differences between online survey distribution versus face-to-face survey distribution. Castro et al. [11,14] found that 96% of respondents in their study felt the river contributed to their well-being. In our study, although almost 50% of respondents said they knew nothing about the river and 33.3% identified as having no relationship with the river, 74% of respondents indicated they felt the river contributed to their well-being. Castro et al. [11,14] did not have a sample of individuals who identified as having no relationship with the river. Thus, based on our results, even if individuals do not identify a relationship with a given ecosystem, they still recognize its overall importance to human well-being.
We found that a smaller proportion of our survey respondents were willing to pay versus Castro et al. [11,14] (54% versus 70%). This result could be attributed to having surveyed a higher proportion of individuals who identified as having no relationship with the river and therefore felt no strong inclination to pay for ecosystem services provided. Those who had no relationship with the river also had the lowest amount WTP ($38.45 annually), further supporting this idea. In our study, however, our smaller population of watershed residents were willing to pay more than in Castro et al. [11,14] ($62.08 versus $53.82) and valued species habitat, water regulation, and water provisioning as the services with the highest economic value. Castro et al. [11,14], however, identified water quality, recreation, and habitat for species as the services with the highest economic value. These three ecosystem services valued by residents in our survey (i.e., habitat for species, water regulation, and water provisioning) focus specifically on what the water system offers residents tangibly versus what it offers culturally or to species other than humans. The shift in valuation could be related to the pending plan to remove water from the region and being more informed on the latest litigation. In addition, both Castro et al. [11,14] and our study found that cultural services had the lowest economic value, showing a continued trend in not valuing the cultural contributions of the river as highly as physical resources.
Evaluating the results of our comparative Heckman model, we found that fewer variables had a statistically significant impact on binary WTP and the dollar WTP. We found that being a resident of the watershed had a significant, albeit small, positive impact on whether individuals were willing to pay, which aligned with the results of the Wilcoxon statistical analysis but did not directly match any of the significant factors from Castro et al. [11,14]. The significance of being a watershed resident could be connected to stronger ties to the region now that it is being threatened. For the second stage of the Heckman analysis, Castro et al. [11,14] found income to have a positive impact on the amount individuals were willing to pay. Although our results do not show a significant effect of income in either Heckman model, it was selected for both variable processes.
It is important to recognize the potential impacts of the differing survey platform utilized for this study versus Castro’s study when comparing results. While significant differences in end-result analysis values do not appear when comparing data from face-to-face CVM surveys versus web-based CVM surveys, online surveys do tend to under-represent particular groups of people, such as those with a lower level of education [54]. There is also the issue of non-response bias in web-based surveys, as response rates tend to be consistently lower. Face-to-face surveys, however, do risk a different type of response bias—social desirability bias in face-to-face surveys could lead to more “desirable” but inaccurate responses to surveys [41]. For instance, Nielsen [41] found at the end of his evaluation of differing platforms for a similar CVM-related survey that WTP values were indistinguishable between the two modes but that there were differences in factors such as response rate and scope perception of respondents. Castro’s face-to-face survey method versus our online-based method could also contribute to differing final values, although it is reasonable to say that final WTP values reflect changes accurately, as Nielsen [41] found result values to be statistically the same. Because Castro distributed their survey in face-to-face interviews, participants were not limited by state residency, while they were in our 2019 survey, which was distributed online and restricted to Oklahoma residents. As Texans are interested in the future of the water in the Kiamichi River, including their opinions may have altered our results.
In addition to the difference in the survey platform, literature has recognized that utilizing CVM and WTP measures for ecosystem service valuation can lead to over- or under-estimation of the value of ecosystem services. The method is highly subjective, especially when using an open analysis framework for CVM questions and can, therefore, lead to skewed responses. While CVM is a useful way to assess ecosystem services and quantify WTP, it is commonly thought that ecosystem services should not be reduced to simple monetary prices as many services are not simply characterized by market prices and these prices are subjective [10]. As highlighted by Rees [18], condensing ecosystem services into a single metric implies condensing large amounts of information into a single number. This can have implications based on how subjective the resulting valuations are. Spangenberg and Settele [18] highlight, however, that while this method may lead to skewed numeric valuation, it can be valuable for contributing to policy implementation by offering guidance related to public opinion. While the amount WTP presented in both our study as well as the original survey by Castro et al. [11,14] may be an example of over- or under-estimation, it still represents a measurement to distinguish between ESBs and their sentiments towards the ecosystem of interest.

4.5. Towards Addressing Environmental “Winners” and “Losers”

The results of this research also help to address the presence of “winners” and “losers” when looking at the costs and benefits associated with the loss or gain of ecosystem services. Broadly defined, winners are those who “succeed or gain something”, whereas the losers are the ones who “experience disadvantages or deprivations” [55]. While an imbalance between those who receive benefits from services has been recognized, research often fails to identify specific “winners” and “losers”, instead focusing on trade-offs among different ecosystem services—i.e., does utilizing one ecosystem service negatively impact another? [43]. Other investigations, however, describe how negotiations to determine payments for ecosystem services are drastically affected by negotiation power. If one group (the buyers, i.e., the winners) has more power than another (the providers, i.e., the losers), they can set the prices for ecosystem services, undermining the needs of the other group [13,56]. It is standard to place all individuals who utilize an ecosystem into one homogenous group. The reality, however, is that people utilize these ecosystems differently and different beneficiaries will experience different consequences (whether they be positive or negative) [57]. There also often exists some type of distance, whether it be geographic, economic, or cultural, that separates those who own the land and those that currently use or benefit from it [58]. In the case of water resources and the services provided to people, the presence of winners and losers is often quite visible from the diversion of water upstream impacting access downstream [59], which is the case in this research.
In the context of climate change and the environment, the winners are typically the ones that see improved conditions and positive changes to livelihoods, whereas the losers experience increased vulnerability [42]. Taking this one step further, the availability of drinking water in the state of Oklahoma could be attributed in part to changes in climate and associated weather patterns. The winners in the scenario of this research are the Oklahoma City residents, whose livelihood and well-being will be protected by the transfer of drinking water. The losers are the watershed residents, who will experience increased vulnerability in their livelihoods as the threat of a dry riverbed increases.
This case study highlights the importance of disseminating scientific information, and given the right resources, ecosystem service losers are not powerless to the winners. Residents of the Kiamichi River watershed have been able to proactively fight for their water rights because of research investigating endangered species of freshwater mussels [23,24,28]. The autonomy gained by watershed residents is due, in part, to the efforts of the Save The Kiamichi River non-profit group. They are an active subset of the population that attempts to spread awareness of the ongoing water conflict. Collaboration between informed residents of the watershed has been able to afford legal representation for the region and contest the permit granted by the Oklahoma Water Resource Board based on scientific evidence.
The results of this research indicate that the “winners” of an ecosystem service lack attachment to the ecosystem they will be benefiting from. This is made clear by the low amount WTP compared to those with a direct connection to the Kiamichi River. It is possible that by continuing to raise awareness of the issue, not just in the watershed but in Oklahoma City as well, that amount WTP for water conservation may increase for both winners and losers. By giving ESBs direct connections to a resource (e.g., as a resident of the city, you will be receiving water from this river), the inherent value of a resource may increase. If higher WTP can then be translated to a tangible increase in funding, conservation efforts may be better supported.

5. Conclusions

Our research found further evidence to suggest that political conservatism does not always equate to lower support for environmental protection. In the case of the Kiamichi River watershed, in which a large portion of our respondents identified as Republican, these individuals were willing to pay the most to protect the variety of ecosystem services provided by the Kiamichi watershed. This suggests that a direct connection to the ecosystem at risk can alleviate some of the political polarization that occurs when environmentalism becomes a topic of discussion, and that this connection becomes more important than political party stances. Additionally, although we expected large shifts in opinion over time, we found few differences between the research conducted in 2013 [11,14] and our survey results. Among these differences were the positive impact of watershed residency on the binary factor of WTP (yes or no), and a higher willingness to pay among watershed residents. These differences could be attributed to the rising threat to the river, both legal and environmental, and the associated increased valuation of the ecosystem services.
The results of our analysis show a disconnect in WTP between those who will be benefiting from ecosystem services and those who will be losing those ecosystem services. This aligns with the idea that the “winners” of ecosystem services often do not recognize the impacts of their “win”. Oklahoma City residents are less likely to be willing to pay to preserve water resources that they are going to need. Oklahoma City residents are willing to pay a little bit more for services than in 2013, which may indicate a slight rise in awareness towards issues in the Kiamichi River watershed. They are still, overall, less willing to pay than watershed residents, a trend consistent with the 2013 survey. Yet, Oklahoma City also had the highest proportion of Democrats, the political group most likely to be willing to pay (binary WTP) to maintain ecosystem services according to our Heckman model.
This research had limitations related to the population surveyed. The survey was performed on an online platform and distributed using mTurk. The proportion of individuals in Oklahoma that utilize this platform may represent a specific group of individuals within the state and expanding distribution to include other online platforms may have balanced out final group sample sizes. Utilizing this method, however, and comparing it to face-to-face surveying techniques presents an analysis that could indicate that online distribution can also provide valid responses to studies such as this one. Limitations related to rural internet access prevented the research from obtaining many online responses using mTurk of the Kiamichi River region, but we did find distributing via alternate channels helped to mitigate this issue. Further research on this topic could include evaluating new ways of distributing an online survey to regions where internet access may be limited.
Further research into context and environmentalism could add to our findings that political conservatism does not always hinder environmental protectionism and assist in adjusting how environmental protection policies are approached. Our findings suggest an interaction of socio-cultural aspects, influencing how ESBs value ecosystems that reach beyond simple economic valuation, which merits further research. Broadly, further research evaluating conflicts surrounding water management, in which groups of individuals are impacted disproportionately, is necessary to ensure that all stakeholders and interests are considered when making water resource management decisions. In the context of Oklahoma and the Great Plains, further work needs to be done including the perspective of indigenous groups in the region, as they are often stakeholders in the conflict surrounding water management issues. By including relational, cultural, moral, and political values of ecosystem services with the CVM model methodology across groups of people, researchers will better understand how environmental valuations change over time and from there, better inform decision-makers who ultimately decide which groups are impacted [3].

Author Contributions

Conceptualization, C.B., M.B., E.H., S.B., N.P., K.N., L.B., and C.A.; Data curation, S.B. and K.N.; Formal analysis, M.B., E.H., S.B., and K.N.; Investigation, C.B., M.B., E.H., N.P., K.N., and L.B.; Methodology, C.B., M.B., E.H., S.B., N.P., K.N., L.B., and C.A.; Project administration, C.B.; Software, S.B. and K.N.; Supervision, C.B., A.J.C., and C.A.; Validation, S.B. and K.N.; Visualization, S.B. and K.N.; Writing—original draft, C.B., M.B., E.H., and N.P.; Writing—review and editing, C.B., M.B., E.H., S.B., N.P., K.N., A.J.C., and C.A. Equal contribution, C.B., M.B., E.H., S.B., N.P., and K.N. All authors have read and agreed to the published version of the manuscript.

Funding

This manuscript was supported by funding from the US National Science Foundation (NSF DGE-1545261).

Acknowledgments

The Authors would like to thank many people for their help and support during this project. We would like to thank Eli Bridge and Phillip Chilson for their time, patience, support, and advice during our course work. We would also like to thank Jeffrey Kelly, Sara Mata, Justin Reedy, and the rest of the National Traineeship Program membership at the University of Oklahoma for their consistent and persistent support. We would like to thank Rebecca Loraamm for her willingness to review our manuscript and offer feedback and revision suggestions. We would like to thank Caryn Vaughn for her advice and time spent sharing her experiences and knowledge with us, which led to creating a successful project.

Conflicts of Interest

The authors declare no conflict of interest. The funders had no role in the design of the study; in the collection, analyses, or interpretation of data; in the writing of the manuscript, or in the decision to publish the results.

Appendix A

We have provided the content of our survey for reference. For further questions, please contact the lead author.
Attention question: Some questions in this survey are designed to ensure you are paying attention and will be required to receive compensation. For these purposes please be aware that according to this survey, Millard Fillmore was the twelfth president of the United States of America.

Appendix A.1. Pre-Message Knowledge Questions

  • How would you characterize your knowledge of the Kiamichi River Watershed?
    • None at all
    • A little
    • A moderate amount
    • A lot
    • A great deal
  • How much news coverage would you estimate you have seen on the Kiamichi River Watershed?
    • None at all
    • A little
    • A moderate amount
    • A lot
    • A great deal
  • To ensure you are paying attention please leave this question blank.
    • None at all
    • A little
    • A moderate amount
    • A lot
    • A great deal

Appendix A.2. Experimental Component

Appendix A.2.1. Message 1

Please spend the next few minutes reading this excerpt from OK News:
Case history
Oklahoma City first filed for a permit to appropriate water from the Kiamichi basin in 2007. The city plans to divert water from the Kiamichi River at Moyers Crossing, downstream from Sardis Lake and a short distance north of Antlers.
Southeastern Oklahoma’s Lake Atoka and McGee Creek reservoir already supply drinking water to Oklahoma City and surrounding communities in central Oklahoma.
The Atoka pipeline has carried water to the Oklahoma City area for more than 50 years. A second, parallel pipeline is to provide sufficient capacity to move the Kiamichi basin water.
Central Oklahoma’s demand for water is projected to nearly double to 353,000 acre-feet per year by 2060 as population and metro-area economic activity grow.
Attorneys for the city said all requirements under state law had been met, and Martin-Diehl agreed the city was entitled to the permit.
Petition to stop pipeline
Opponents of plans to transfer Kiamichi River water from southeastern Oklahoma to Oklahoma City are asking a judge to hear their reasoning for why their court challenge should continue.
Oklahoma City received a permit from the Oklahoma Water Resources Board in October for up to 115,000 acre-feet of water annually from the Kiamichi basin.
The city has storage rights at Sardis Lake reservoir, upstream from Antlers in Pushmataha County.
Permit opponents filed a petition asking that a Pushmataha County judge invalidate the permit or order the Oklahoma Water Resources Board to reopen the permit hearing. Opposition attorney, Kevin Kemper, contends in the petition for judicial review that the state agency lacked sufficient evidence to make an informed decision before granting the permit. Attorneys for Oklahoma City and the Oklahoma Water Resources Board responded by arguing the petition should be dismissed.
Opponents should have named the city and other parties to the administrative proceeding that preceded the board’s Oct. 10 vote granting the permit, attorneys argue.
Arguments to dismiss petition
Attorneys for the Oklahoma Water Resources Board wrote in their argument seeking dismissal of the petition that “judicial review of an agency order is a special proceeding and, as such, the procedural requirements are mandatory.”
An attorney for the city wrote that permit opponents’ reading of state law and court rulings was flawed and requested again that the petition be dismissed.
Kemper asserted the disagreement was a matter of procedure rather than substance. “It would be inequitable for petitioners and inefficient for this court to dismiss this action simply because of a procedural dispute,” he wrote.
Attention question: Based on the news article, who is Kevin Kemper?
  • Out of state lobby representative
  • An attorney for the city
  • The opposition attorney

Appendix A.2.2. Message 2

Please spend the next few minutes reading this excerpt from OK News:
Case History
Opponents of Oklahoma City’s permit for water from southeast Oklahoma’s Kiamichi River basin say a state agency lacked sufficient evidence to make an informed decision before granting the permit.
The Oklahoma Water Resources Board voted in October to grant Oklahoma City a permit for up to 115,000 acre-feet of water annually from the Kiamichi basin, where the city has storage rights in the Sardis Lake reservoir.
“We believe there is a lot of evidence that exists with the state of Oklahoma that ought to be considered by the board,” said Kevin Kemper, an attorney challenging the permit.
Kiamichi basin residents who oppose the transfer of water intend for Oklahoma City to get “not one drop of southeast Oklahoma water, and if they do get it, that they don’t kill the river,” he said.
Kemper has filed a petition in Pushmataha County District Court, asking a judge to invalidate the permit or order the Oklahoma Water Resources Board to reopen the permit hearing.
After a five-day hearing in August, hearing examiner Lyn Martin-Diehl concluded Oklahoma City was entitled to a permit. Attorneys for the city said all requirements under state law had been met.
Oklahoma City first filed for a permit to appropriate water from the basin in 2007. The city plans to divert water from the Kiamichi River at Moyers Crossing in Pushmataha County. Pipelines will carry water to Lake Stanley Draper.
Oklahoma City depends on water from two other southeast Oklahoma reservoirs: Lake Atoka and McGee Creek. The Atoka pipeline has carried water to central Oklahoma for more than 50 years. When the Choctaw and Chickasaw nations, the state of Oklahoma and the city of Oklahoma City reached a water settlement last year, City Manager Jim Couch characterized the Sardis water as “generational water” to sustain growth until 2060 or beyond.
Demand for water in central Oklahoma is projected to nearly double to 353,000 acre-feet per year by 2060 as population grows and economic activity concentrates in the metro area.
Arguments for petition
In their petition, permit opponents say the Oklahoma Water Resources Board’s decision granting the permit was unconstitutional because the city failed to provide sufficient notice to those living along the Kiamichi River.
They also contend the model used to determine the availability of water for transfer out of the basin was based on outdated information and that environmental effects were not considered.
They also said the board was unduly influenced by pressure associated with the water settlement, which was intended to end litigation over water resource management in traditional tribal homelands.
Attention question: Based on the news article, who is Kevin Kemper?
  • Out of state lobby representative
  • The hearing examiner
  • An attorney challenging the permit

Appendix A.3. Ecosystem Services

4.
Do you think the Kiamichi River and the area around it are providing benefits that are contributing to your well-being or to overall human well-being?
  • Extremely unlikely
  • Moderately unlikely
  • Slightly unlikely
  • Neither likely nor unlikely
  • Slightly likely
  • Moderately likely
  • Extremely likely
5.
Please rank the following ecosystem services provided by Kiamichi River Watershed from the most important to least important to you. (Drag and drop in order).
  • Fresh Water Provisions (Rivers provide water for human consumption and use)
  • Water Regulation (Watershed helps to regulate the quality and quantity of water available)
  • Habitat for Species (Rivers provide habitat for species like catfish or deer)
  • Water Quality (River species purify water for human use, like mussels’ filter water)
  • Air Quality (Forests maintain the quality of air e.g., the role of ecosystems in carbon storage)
  • Recreation (Rivers provide experiences like fishing, canoeing, or wildlife viewing)
  • Cultural Heritage (Oklahomans have used the watershed for generations)
  • Local Identity (Oklahomans are proud of their connection to the river)
6.
Do you think that the ecosystem service, (highest ranked service goes here), is more or less vulnerable compared to 10 years ago?
  • Much more vulnerable
  • Moderately more vulnerable
  • Slightly more vulnerable
  • About the same
  • Slightly less vulnerable
  • Moderately less vulnerable
  • Much less vulnerable
  • Not Sure
7.
Do you think that ecosystem service, (lowest ranked service goes here), is more or less vulnerable compared to 10 years ago?
  • Much more vulnerable
  • Moderately more vulnerable
  • Slightly more vulnerable
  • About the same
  • Slightly less vulnerable
  • Moderately less vulnerable
  • Much less vulnerable
  • Not Sure

Appendix A.3.1. Willingness to Pay

8.
Due to water management policies and recent droughts, water flows in the Kiamichi River have been negatively affected and this affects the benefits that humans obtain. If an environmental association which is working on its preservation through different conservation programs asked you, would you be willing to pay through an annual donation to protect the Kiamichi River watershed to continue providing these benefits to the society?
  • No
  • Yes
If they answered yes:
9.
What is the maximum amount per year you would be willing to pay in your household?
(only enter numbers, rounded to the nearest whole dollar)
________________________________________________________________
If they answered no:
10.
Why would you not want to provide financial support?
________________________________________________________________
If they answered yes:
11.
How would you divide that money to support the different ecosystem services? Your total must equal (the amount participant identified that he/she would be willing to pay).
  • Fresh Water Provisions (Rivers provide water for human consumption and use)
  • Water Regulation (Watershed help to regulate the quality and quantity of water available)
  • Habitat for Species (Rivers provide habitat for species like catfish or deer)
  • Water Quality (River species purify water for human use, like mussels’ filter water)
  • Air Quality (Forests maintain the quality of air e.g., the role of ecosystems in carbon storage) Recreation (Rivers provide experiences like fishing, canoeing, or wildlife viewing)
  • Cultural Heritage (Oklahomans have used the watershed for generations)
  • Local Identity (Oklahomans are proud of their connection to the river)
  • Total: ________
If they answered no:
12.
If you were in charge of distributing the funds for the environmental association how would you divide that money to support the different ecosystem services? Your total must equal 100.
  • Fresh Water Provisions (Rivers provide water for human consumption and use)
  • Water Regulation (Watershed help to regulate the quality and quantity of water available)
  • Habitat for Species (Rivers provide habitat for species like catfish or deer)
  • Water Quality (River species purify water of human use, like mussels’ filter water)
  • Air Quality (Forests maintain the quality of air e.g., the role of ecosystems in carbon storage)
  • Recreation (Rivers provide experiences like fishing, canoeing, or wildlife viewing)
  • Cultural Heritage (Oklahomans have used the watershed for generations)
  • Local Identity (Oklahomans are proud of their connection to the river)
  • Total: ________

Appendix A.3.2. Political Participation

13.
Not everyone has time to participate in political activities, but if you have, have you… (select all that apply)
  • Donated time or money to a political campaign
  • Attended a town hall or city council meeting
  • Attended a rally/demonstration/march
  • Signed a petition
  • Joined and/or contribute to a community-lead group (via social media or in-person)
  • Called or written to a representative (local, state, or national)
  • Served on a committee or board
  • Volunteered to register voters or work at a polling place
  • Voted in the last federal election
14.
I feel that my opinion is considered in political decision making.
  • Strongly disagree
  • Disagree
  • Somewhat disagree
  • Neither agree nor disagree
  • Somewhat agree
  • Agree
  • Strongly agree
Attention question: According to this survey who was the twelfth president of the United States?
  • James K. Polk
  • Zachary Taylor
  • Millard Fillmore
  • James Buchanan

Appendix A.3.3. Demographics

15.
What is your age?
16.
How do you identify?
  • Male
  • Female
  • Non-Binary
17.
What is your race/ethnicity?
  • White
  • Black or African American
  • American Indian or Alaska Native
  • Asian
  • Native Hawaiian or Pacific Islander
  • Hispanic
  • Middle Eastern
  • Not Listed
18.
Is English your first language?
  • Yes
  • No
19.
In what county do your currently reside?
Drop-down list of all Oklahoma counties was provided
20.
In years, how long have you lived in Oklahoma? If you have lived in Oklahoma under a year, please write 0.
21.
What kind of area do you live in?
  • Rural
  • Suburban
  • Urban
22.
Which of these would you say most closely represents your relationship to the Kiamichi River Watershed? (Please pick one)
  • Oklahoma City metro area resident
  • Visit the area for business
  • Visit the area for recreation/tourism
  • Resident near the river
  • Professional expertise with watershed and related issues
  • Not Listed (if participant selected this, he/she was prompted to explain)
  • No Relationship
23.
Please mark all of the following activities you have engaged in the last year.
  • Hiked
  • Camped
  • Gone "off-roading"
  • Biked for recreation
  • Gone boating (kayaking, canoeing, motorboating...)
  • Hunted
  • Fished
  • Visited a local park
  • Visited a wildlife refuge or state park
  • Visited a national park (anywhere in the US)
24.
What is the highest level of education you have completed?
  • Less than high school
  • High school graduate
  • Some college
  • 2-year degree
  • 4-year degree
  • Professional degree
  • Doctorate
25.
What is your current employment status?
  • Employed full-time
  • Employed part-time
  • Unemployed, looking for work
  • Unemployed, not looking for work
  • Retired
  • Student
  • Disabled
26.
What is your total gross household income?
  • Less than $10,000
  • $10,000–$19,999
  • $20,000–$29,999
  • $30,000–$39,999
  • $40,000–$49,999
  • $50,000–$59,999
  • $60,000–$69,999
  • $70,000–$79,999
  • $80,000–$89,999
  • $90,000–$99,999
  • $100,000–$149,999
  • More than $150,000
27.
Generally speaking, do you usually think of yourself as a Republican, a Democrat, an Independent, or something else?
  • Republican
  • Democrat
  • Independent
  • Something else (if participant selected this, he/she was prompted to explain)
28.
Do you think of yourself as more of a conservative or more of a liberal?
  • Conservative
  • 2
  • 3
  • Neither/Even Split
  • 5
  • 6
  • Liberal

Appendix B

This appendix contains additional visual figures, referenced in the text. They are supplemental to the results section.
Figure A1. Numbers within boxplots indicate the sample size of each group, dots outside of the boxplots indicate outliers (a–c). (a) Willingness to pay values by identified ethnicity group, (b) willingness to pay based on an identified relationship with the river—representative of the ecosystem service beneficiary groups (ESBs), (c) willingness to pay based on identified community type, and (d) correlation model between household income and the willingness to pay. The blue line indicates the relationship between the log value of household income and how much people were willing to pay. The gray area surrounding the blue line indicates standard error. Willingness to pay dollar amount and sample size for analysis determined by removing participants who indicated they were not willing to pay (reduced sample size from n = 242 to n = 131).
Sustainability 12 00819 g0a1aSustainability 12 00819 g0a1b
Figure A2. Political affiliations and Amount WTP. (a) Survey results of political party affiliation. The only differences detected in the results were found between the three main parties and those who identified as something else. (b) Amount willing to pay based on political participation score.
Sustainability 12 00819 g0a2aSustainability 12 00819 g0a2b

References

  1. Harrison, P.A. Ecosystem services and biodiversity conservation: An introduction to the RUBICODE project. Biodivers. Conserv. 2010, 19, 2767–2772. [Google Scholar] [CrossRef]
  2. Castro, A.J.; Martín-López, B.; García-LLorente, M.; Aguilera, P.A.; López, E.; Cabello, J. Social preferences regarding the delivery of ecosystem services in a semiarid Mediterranean region. J. Arid Environ. 2011, 75, 1201–1208. [Google Scholar] [CrossRef]
  3. Martín-López, B.; Iniesta-Arandia, I.; García-Llorente, M.; Palomo, I.; Casado-Arzuaga, I.; Amo, D.G.D.; Gómez-Baggethun, E.; Oteros-Rozas, E.; Palacios-Agundez, I.; Willaarts, B.; et al. Uncovering Ecosystem Service Bundles through Social Preferences. PLoS ONE 2012, 7, e38970. [Google Scholar] [CrossRef] [Green Version]
  4. Chan, K.M.A.; Satterfield, T.; Goldstein, J. Rethinking ecosystem services to better address and navigate cultural values. Ecol. Econ. 2012, 74, 8–18. [Google Scholar] [CrossRef] [Green Version]
  5. Chan, K.M.A.; Satterfield, T. Managing Cultural Ecosystem Services for Sustainability. In Routledge Handbook of Ecosystem Services; Potschin, M., Haines-Young, R., Fish, R., Turner, R.K., Eds.; Routledge: New York, NY, USA, 2016; pp. 343–358. ISBN 978-1-315-77530-2. [Google Scholar]
  6. Martín-López, B.; Gómez-Baggethun, E.; García-Llorente, M.; Montes, C. Trade-offs across value-domains in ecosystem services assessment. Ecol. Indic. 2014, 37, 220–228. [Google Scholar] [CrossRef]
  7. Stålhammar, S.; Pedersen, E. Recreational cultural ecosystem services: How do people describe the value? Ecosyst. Serv. 2017, 26, 1–9. [Google Scholar] [CrossRef]
  8. Díaz, S.; Pascual, U.; Stenseke, M.; Martín-López, B.; Watson, R.T.; Molnár, Z.; Hill, R.; Chan, K.M.A.; Baste, I.A.; Brauman, K.A.; et al. Assessing nature’s contributions to people. Science 2018, 359, 270–272. [Google Scholar] [CrossRef] [PubMed] [Green Version]
  9. Mizgajski, A.; Bernaciak, A.; Kronenberg, J.; Roo-Zielińska, E.; Solon, J.; Śleszyński, J. Development of the ecosystem services approach in poland. Ekon. Środowisko 2014, 4, 11–19. [Google Scholar]
  10. Mizgajski, A. Ecosystem Services Assessment for Poland—Challenges and Possible Solutions. Ekon. Środowisko 2012, 2, 54–73. [Google Scholar]
  11. Mrozik, K.; Idczak, P. The capactiy of ecosystem services in small water retention measures. Environ. Policy Manag. 2017, 3, 37–48. [Google Scholar]
  12. Glenn, E.P.; Lee, C.; Felger, R.; Zengel, S. Effects of Water Management on the Wetlands of the Colorado River Delta, Mexico. Conserv. Biol. 1996, 10, 1175–1186. [Google Scholar] [CrossRef]
  13. Kronenberg, J.; Hubacek, K. Could Payments for Ecosystem Services Create an “Ecosystem Service Curse”? Ecol. Soc. 2013, 18. [Google Scholar] [CrossRef] [Green Version]
  14. Martín-López, B.; Montes, C.; Benayas, J. The non-economic motives behind the willingness to pay for biodiversity conservation. Biol. Conserv. 2007, 139, 67–82. [Google Scholar] [CrossRef]
  15. Castro, A.; Vaughn, C.; Julian, J.; Atkinson, C.; Atkinson Carla, L. Willingness to Pay for Ecosystem Services among Stakeholder Groups in a South-Central, U.S. Watershed with Regional Conflict. J. Water Resour. Plan. Manag. 2016, 142, 05016006. [Google Scholar] [CrossRef]
  16. Mitchell, R.C.; Carson, R.T. Using Surveys to Value Public Goods: The Contingent Valuation Method; Rff Press: New York, NY, USA, 2013; ISBN 1-135-88774-8. [Google Scholar]
  17. Spangenberg, J.H.; Settele, J. Precisely incorrect? Monetising the value of ecosystem services. Ecol. Complex. 2010, 7, 327–337. [Google Scholar] [CrossRef]
  18. Rees, W.E. Why conventional economic logic won’t protect biodiversity. Gaining Ground Purs. Ecol. Sustain. 2006, 14, 207–226. [Google Scholar]
  19. Castro, A.J.; Garcia-Llorente, M.; Martin-Lopez, B.; Palomo, I.; Iniesta-Arandia, I. Multidimensional Approaches to Ecosystem Services Assessment. In Earth Observation of Ecosystem Services; CRC Press: Boca Raton, FL, USA, 2013; pp. 442–461. ISBN 978-1-4665-0588-9. [Google Scholar]
  20. Venkatachalam, L. The contingent valuation method: A review. Environ. Impact Assess. Rev. 2004, 24, 89–124. [Google Scholar] [CrossRef]
  21. Castro, A.J.; Vaughn, C.C.; Julian, J.P.; García-Llorente, M. Social Demand for Ecosystem Services and Implications for Watershed Management. JAWRA J. Am. Water Resour. Assoc. 2016, 52, 209–221. [Google Scholar] [CrossRef]
  22. García-Llorente, M.; Martín-López, B.; Díaz, S.; Montes, C. Can ecosystem properties be fully translated into service values? An economic valuation of aquatic plant services. Ecol. Appl. 2011, 21, 3083–3103. [Google Scholar] [CrossRef] [Green Version]
  23. Vaughn, C.C.; Mather, C.M.; Pyron, M.; Mehlhop, P.; Miller, E.K. The Current and Historical Mussel Fauna of the Kiamichi River, Oklahoma. Southwest. Nat. 1996, 41, 325–328. [Google Scholar]
  24. Galbraith, H.S.; Spooner, D.E.; Vaughn, C.C. Status of Rare and Endangered Freshwater Mussels in Southeastern Oklahoma. Southwest. Nat. 2008, 53, 45–50. [Google Scholar] [CrossRef]
  25. Oklahoma Water Resources Board Water for 2060 Advisory Board: Background Report 2013. Available online: https://www.owrb.ok.gov/2060/advisorycouncil/BackgroundReport.pdf (accessed on 14 November 2019).
  26. Issa, R.; Hare, J.L.; Samandi, S.; Hernandez, S.; Ferguson, C. The Existing Atoka Pipeline Surge Protection System: The Full Story. In Proceedings of the Pipelines 2016, Kansas City, MO, USA, 17–20 July 2016; pp. 1369–1378. [Google Scholar]
  27. City of Oklahoma. Memorandum—Council Agenda, Item No. VIII.C.3. 2016. Available online: http://www.okc.gov/home/showdocument?id=3323 (accessed on 14 November 2019).
  28. Vaughn, C.C.; Atkinson, C.L.; Julian, J.P. Drought-induced changes in flow regimes lead to long-term losses in mussel-provided ecosystem services. Ecol. Evol. 2015, 5, 1291–1305. [Google Scholar] [CrossRef] [PubMed]
  29. Sheehan, K.B.; Pittman, M. Amazon’s Mechanical Turk for Academics: The HIT Handbook for Social Science Research; Melvin & Leigh: Irvine, CA, USA, 2016; ISBN 978-0-9786638-6-5. [Google Scholar]
  30. Crum, W. Opponents Seek Hearing on Plan to Transfer Water from Kiamichi River to Oklahoma City. Oklahoman. 24 December 2017. Available online: https://oklahoman.com/article/5576912/opponents-seek-hearing-on-plan-to-transfer-water-from-kiamichi-river-to-oklahoma-city (accessed on 14 November 2019).
  31. Crum, W. Water Transfer Opponents Seek to Block Oklahoma City’s Permit. Oklahoman. 27 November 2017. Available online: https://oklahoman.com/article/5573639/water-transfer-opponents-seek-to-block-oklahoma-citys-permit (accessed on 14 November 2019).
  32. United States Census Bureau. Quick Facts Oklahoma; U.S. Census Bureau: Washington, DC, USA, 2018.
  33. Gallup. State Party Affiliation; Gallup: Omaha, NE, USA, 2017. [Google Scholar]
  34. United States Census Bureau. Oklahoma City, Oklahoma; U.S. Census Bureau: Washington, DC, USA, 1986.
  35. United States Census Bureau. Le Flore County, Oklahoma; U.S. Census Bureau: Washington, DC, USA, 1973.
  36. United States Census Bureau. Pushmataha County, Oklahoma; U.S. Census Bureau: Washington, DC, USA, 2006.
  37. United States Census Bureau. Choctaw County, Oklahoma; University of Oklahoma: Norman, OK, USA, 1975. [Google Scholar]
  38. Quinn, G.P.; Keough, M.J. Experimental Design and Data Analysis for Biologists; Cambridge University Press: Cambridge, UK, 2002; ISBN 978-1-139-43289-4. [Google Scholar]
  39. Davidian, M. Nonlinear Models for Repeated Measurement Data; Routledge: New York, NY, USA, 2017; ISBN 978-0-203-74550-2. [Google Scholar]
  40. Toomet, O.; Henningsen, A. Sample selection models in R: Package sampleSelection. J. Stat. Softw. 2008, 27, 1–23. [Google Scholar] [CrossRef] [Green Version]
  41. Barton, K.; Barton, M.K. Package ‘MuMIn’. Version 2013, 1, 18. [Google Scholar]
  42. Wickham, H. ggplot2: Elegant Graphics for Data Analysis; Springer: Berlin/Heidelberg, Germany, 2016; ISBN 3-319-24277-6. [Google Scholar]
  43. Hebbali, A. Olsrr: Tools for Building OLS Regression Models; R package Version 0.4.0; 2017; Available online: https://rdrr.io/cran/htmltools/ (accessed on 14 November 2019).
  44. Tewksbury, D.; Jones, J.; Peske, M.W.; Raymond, A.; Vig, W. The Interaction of News and Advocate Frames: Manipulating Audience Perceptions of a Local Public Policy Issue. Journal. Mass Commun. Q. 2000, 77, 804–829. [Google Scholar] [CrossRef]
  45. O’Keefe, D.J. Message Properties, Mediating States, and Manipulation Checks: Claims, Evidence, and Data Analysis in Experimental Persuasive Message Effects Research. Commun. Theory 2003, 13, 251–274. [Google Scholar] [CrossRef]
  46. Elmqvist, T.; Setälä, H.; Handel, S.; van der Ploeg, S.; Aronson, J.; Blignaut, J.; Gómez-Baggethun, E.; Nowak, D.; Kronenberg, J.; de Groot, R. Benefits of restoring ecosystem services in urban areas. Curr. Opin. Environ. Sustain. 2015, 14, 101–108. [Google Scholar] [CrossRef] [Green Version]
  47. Welsh, L.W.; Endter-Wada, J.; Downard, R.; Kettenring, K.M. Developing Adaptive Capacity to Droughts: The Rationality of Locality. Ecol. Soc. 2013, 18, 2. [Google Scholar] [CrossRef] [Green Version]
  48. Ward, D.; Ngairorue, B.T.; Apollus, A.; Tjiveze, H. Perceptions and realities of land degradation in arid Otjimbingwe, Namibia. J. Arid Environ. 2000, 45, 337–356. [Google Scholar] [CrossRef]
  49. Dunlap, R.E.; Xiao, C.; McCright, A.M. Politics and Environment in America: Partisan and Ideological Cleavages in Public Support for Environmentalism. Environ. Politics 2001, 10, 23–48. [Google Scholar] [CrossRef]
  50. Hamilton, L.C.; Saito, K. A four-party view of US environmental concern. Environ. Politics 2015, 24, 212–227. [Google Scholar] [CrossRef]
  51. Newman, B.; Guth, J.L.; Cole, W.; Doran, C.; Larson, E.J. Religion and environmental politics in the US House of Representatives. Environ. Politics 2016, 25, 289–314. [Google Scholar] [CrossRef]
  52. Peifer, J.L.; Khalsa, S.; Howard Ecklund, E. Political conservatism, religion, and environmental consumption in the United States. Environ. Politics 2016, 25, 661–689. [Google Scholar] [CrossRef]
  53. Dupont, D.P.; Bateman, I.J. Political affiliation and willingness to pay: An examination of the nature of benefits and means of provision. Ecol. Econ. 2012, 75, 43–51. [Google Scholar] [CrossRef]
  54. Nielsen, J.S. Use of the Internet for willingness-to-pay surveys: A comparison of face-to-face and web-based interviews. Resour. Energy Econ. 2011, 33, 119–129. [Google Scholar] [CrossRef]
  55. O’Brien, K.L.; Leichenko, R.M. Winners and Losers in the Context of Global Change. Ann. Assoc. Am. Geogr. 2003, 93, 89–103. [Google Scholar] [CrossRef]
  56. Kronenberg, J.; Hubacek, K. From poverty trap to ecosystem service curse. Sustain. Sci. 2016, 11, 903–907. [Google Scholar] [CrossRef] [Green Version]
  57. Daw, T.; Brown, K.; Rosendo, S.; Pomeroy, R. Applying the ecosystem services concept to poverty alleviation: The need to disaggregate human well-being. Environ. Conserv. 2011, 38, 370–379. [Google Scholar] [CrossRef] [Green Version]
  58. Brauman, K.A.; Daily, G.C.; Duarte, T.K.; Mooney, H.A. The Nature and Value of Ecosystem Services: An Overview Highlighting Hydrologic Services. Annu. Rev. Environ. Resour. 2007, 32, 67–98. [Google Scholar] [CrossRef]
  59. Asquith, N.M.; Vargas, M.T.; Wunder, S. Selling two environmental services: In-kind payments for bird habitat and watershed protection in Los Negros, Bolivia. Ecol. Econ. 2008, 65, 675–684. [Google Scholar] [CrossRef]
Figure 1. Study Area and regions of interest, Oklahoma City (OKC) metropolitan area (MA) and the Kiamichi Watershed, are highlighted. The current Atoka pipeline is highlighted in red and connects Lake Stanley Draper (Oklahoma City MA) with the Atoka Reservoir (just outside the Kiamichi watershed). The proposed additional pipeline which would connect with the Kiamichi River is highlighted in yellow and black.
Sustainability 12 00819 g001
Figure 2. Location of participants of survey. The focal areas of OKC and the watershed are highlighted by their relevant counties.
Sustainability 12 00819 g002
Figure 3. (a) WTP for ecosystem services by ESB group, (b) Ranking of ecosystem services from most important to least important. For determining the ranking of ecosystem services, the top four ecosystem services were utilized and valuation was re-determined, where 4 now equaled most important and 1 equaled less important (utilizing the same valuation scale as Castro et al. [11,14], WTP is expressed as raw dollar amount annually). WP = water provisions, WR = water regulations, SH = species habitat, AQ = air quality, WQ = water quality, RE = recreation, CU = cultural, LI = local identity.
Sustainability 12 00819 g003
Table 1. Castro et al. [11,14] comparison with results from this study. Residents Near the Kiamichi River, Oklahoma City MA Residents, Business Visitors to (Kiamichi River) Watershed, Tourists/Recreators of Kiamichi River, Experts, Not Listed, No Identified Relationship (with Kiamichi River), and Total Number of Respondents for Castro et al [11,14] versus our survey, are shown.
GroupSurvey in 2013 Survey in 2019
Residents Near the Kiamichi River44.8%13.6%
Oklahoma City Metropolitan Residents29.1%28%
Business Visitors to Watershed5.5%0.4%
Tourists/Recreator of Kiamichi9.9%21.84%
Experts10.5%0
Not listed02.9%
No identified relationship033.3%
White61%76.5%
Native American22%9.9%
Some College Education68%83%
Total Number of Participants505243
Table 2. Mean raw dollar amount for annual WTP, comparison between Castro et al. [3] and current study (n = 505, n = 242), raw dollar amounts from Table 3 in Castro et al. [3], raw dollar amount means include 0 values. We removed the business visitor ESB because the current study had only one respondent as well as the expert ESB because the current study had none.
2013 Raw Dollar WTP by ESB2019 Raw Dollar WTP by ESB
Ecosystem ServiceTouristWatershed ResidentOKC ResidentTouristWatershed ResidentOKC Resident
Freshwater provision1.724.462.707.2211.257.96
Water regulation4.444.852.785.7616.046.30
Habitat for species24.9421.2417.6610.737.969.20
Air quality1.723.193.825.255.134.88
Water quality11.339.067.279.699.295.71
Recreation9.416.252.514.786.042.74
Cultural heritage1.722.781.023.133.632.69
Local identity1.292.000.783.282.752.64
Total56.5753.8338.5449.8462.0842.12

