Evaluation Methods of Water Environment Safety and Their Application to the Three Northeast Provinces of China


Abstract
:1. Introduction
2. Materials and Methods
2.1. Selection of Evaluation Indicators and Data Source
2.2. Evaluation Standards of Water Environment Safety
2.3. Improved Fuzzy Comprehensive Evaluation Method
2.3.1. Membership Function Calculation
2.3.2. Weight Determination
2.3.3. Overall Evaluation
3. Results
3.1. Evaluation of Water Environment Safety
- (1)
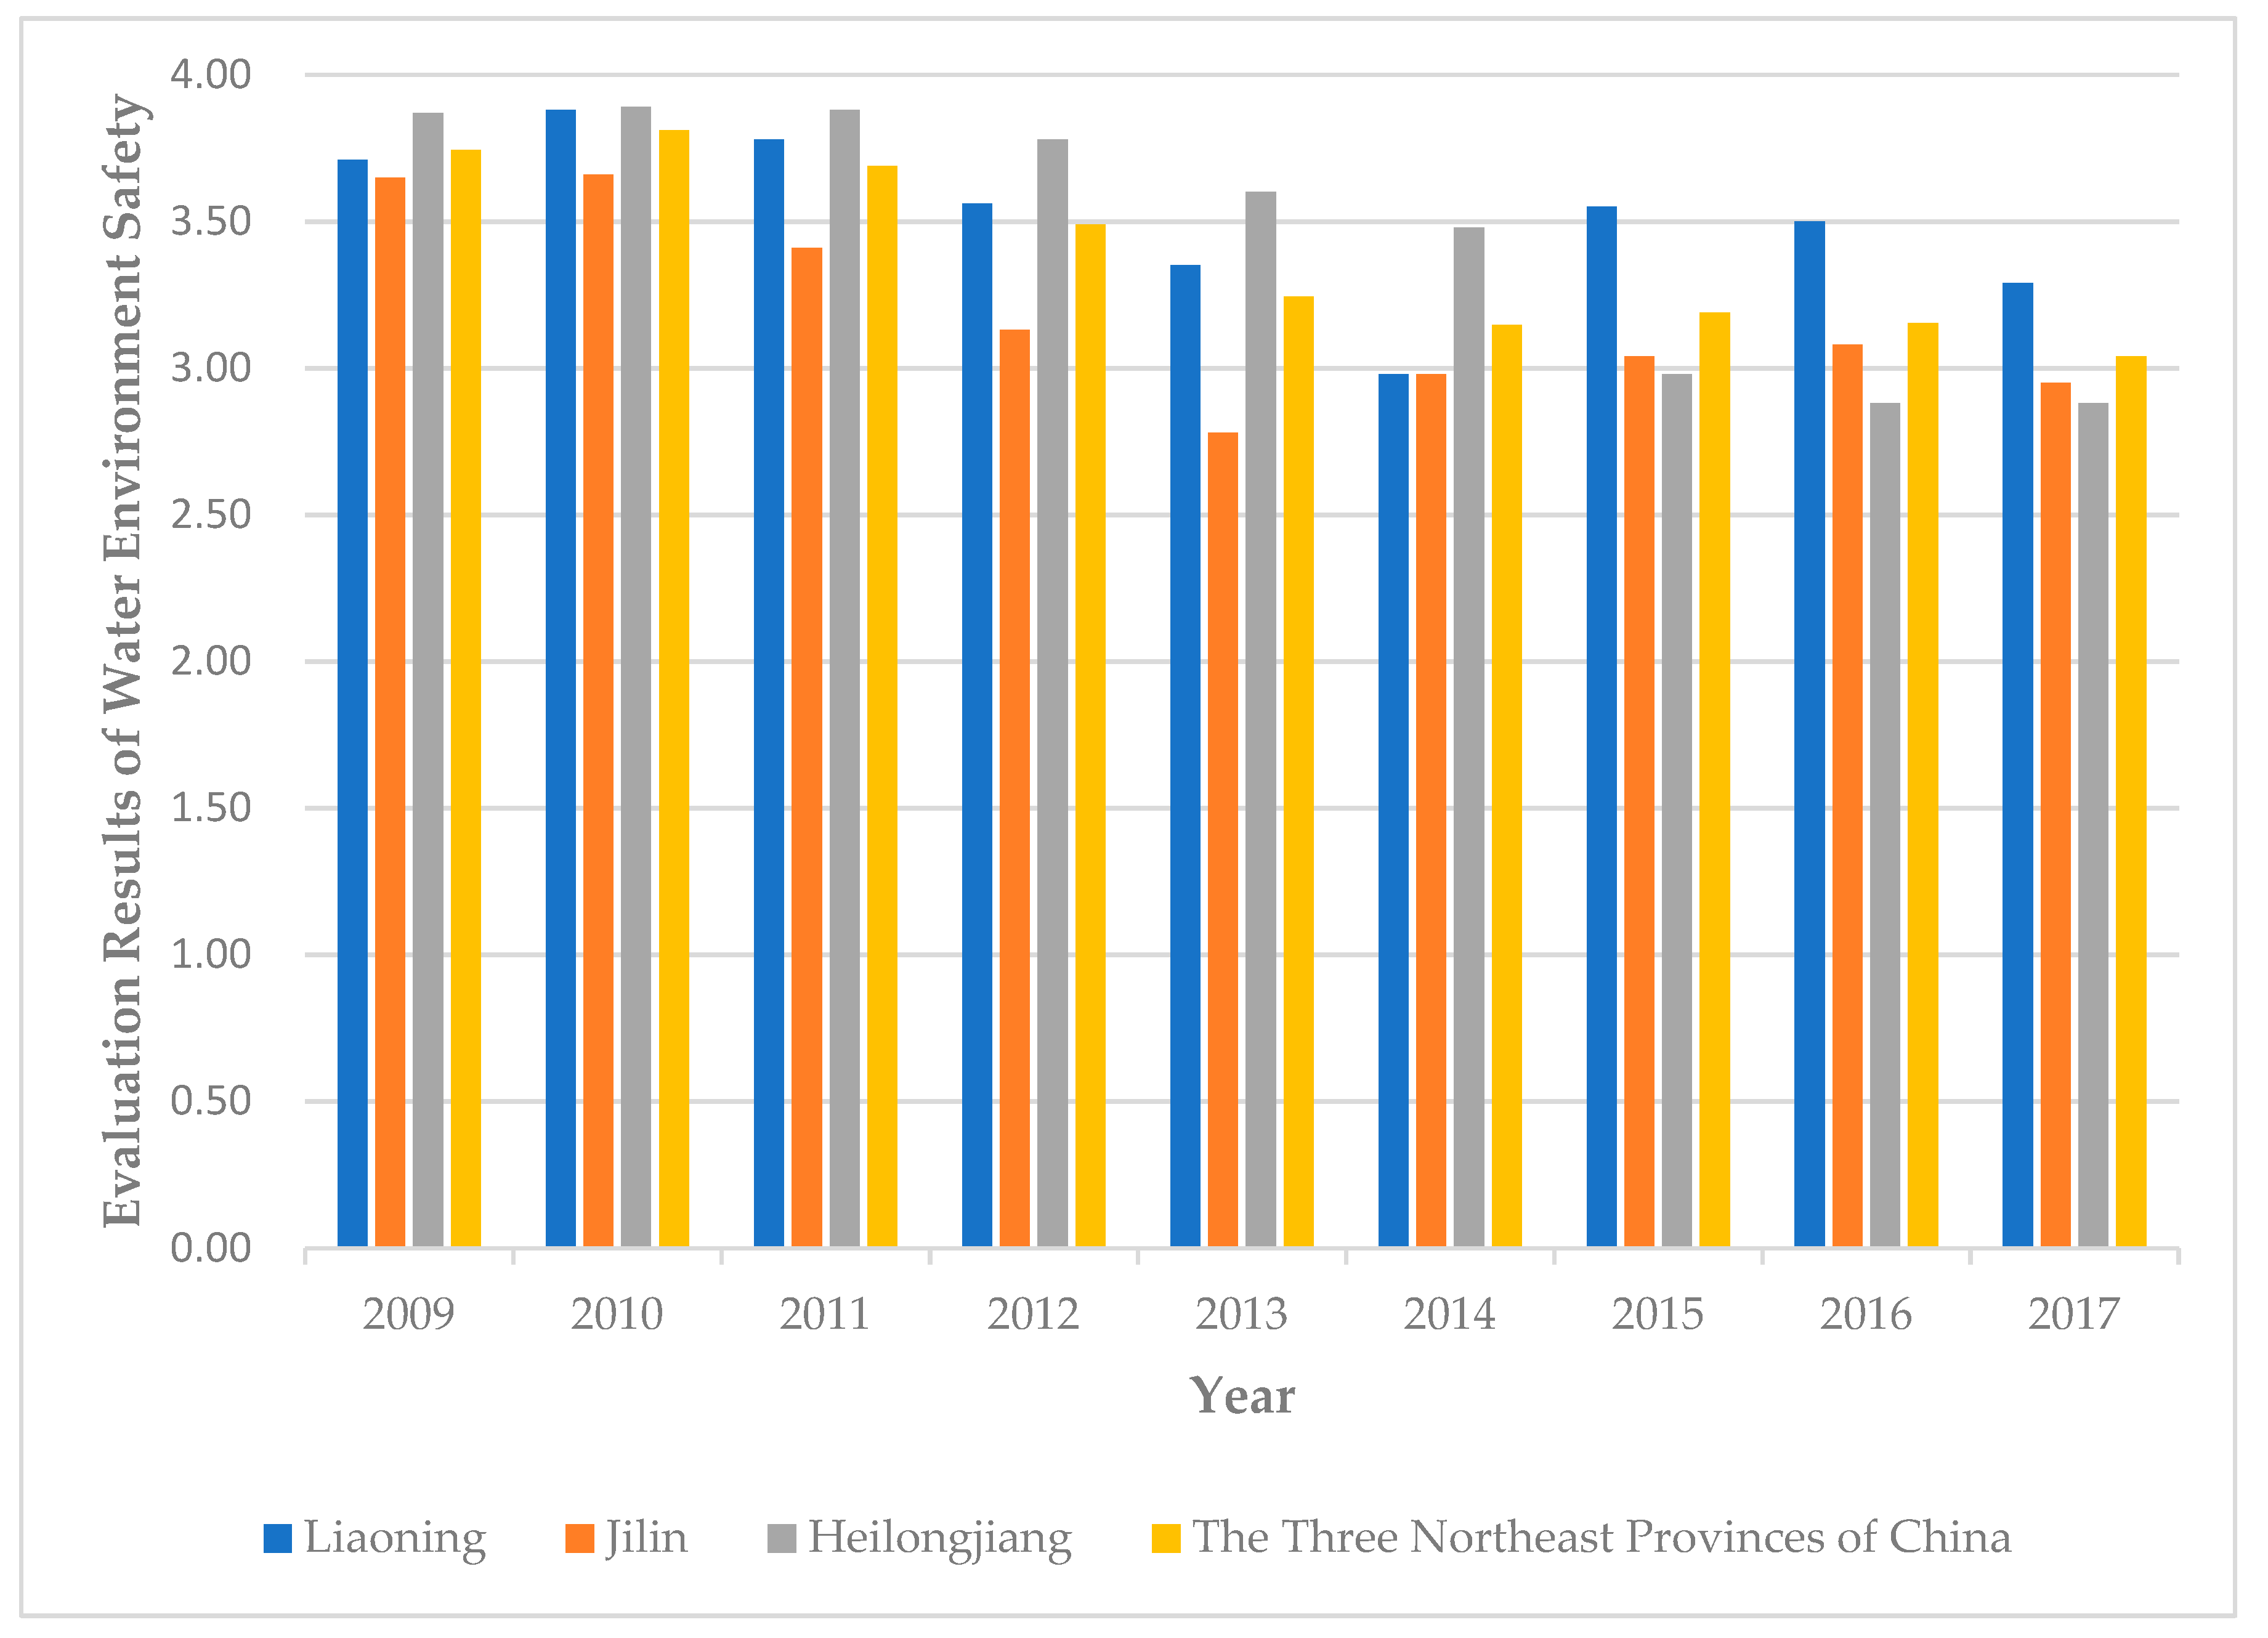
- From 2009 to 2017, Jilin Province’s water environment safety score was basically in the Level 3 range, with an average level number of 3.1. From 2009 to 2011, the water environment safety score of this province was at Level 4, with an average level number of 3.6; in 2013, 2014, and 2017, the water environment safety score of Jilin Province was at Level 2, with an average level number of 2.48. Therefore, overall speaking, there has been an improvement trend in the water environment of Jilin Province, which was deteriorating since 2013 but improving since 2017.
- (2)
- From 2009 to 2017, Heilongjiang Province’s water environment safety score was basically in the Level 4 range, with an average level number of 3.5. From 2015, its water environment safety score had improved to Level 3, with an average level number of 2.9. Therefore, overall speaking, there has been an improvement trend in the water environment of Heilongjiang Province, and its water environment safety score has been around Level 3 since 2014.
- (3)
- From 2009 to 2017, Liaoning Province’s water environment safety score was basically in the Level 4 range, with an average level number of 3.6. Within the study period, its water environment safety score reached its best level of 3.4 in 2014, which belonged to Level 3. For the rest of the years, its water environment safety scores were all in the Level 4 range, with an average level number of 3.75. Therefore, overall speaking, Liaoning Province’s water environment safety score belonged to Level 4 during the study period, and since 2013, its water environment safety level has improved first and then worsened, showing an overall improvement trend.
- (4)
- During the study period of 2009–2017, the overall water environment safety level of the three northeast provinces has shown an improvement trend and has become more stable, with the water safety score improving between 2009 and 2014, and fluctuating around a certain level since 2014. Since 2013, the overall water environment safety level of these northeast provinces has been in Level 3, with an average level number of 3.15. Although the safety score sometimes moves close to the Level 4 range, most of the time it falls in the Level 3 range.
3.2. Indicator Influence Analysis
4. Discussion
4.1. Advantages of Evaluation Method
4.2. Analysis of Evaluation Results
- (1)
- Heilongjiang Province suffered serious water pollution in its rivers in 2009. By the end of 2017, the qualification rate of river water that meets the water quality standards in Heilongjiang Province had exceeded 75.2%; the percentage of water whose quality met Level I, II, and III standards had reached 67.5%; while the water whose quality fell into Level V only accounted for 3.1% of the sample. Therefore, there have been significant improvements in the river water quality and water environment safety in Heilongjiang Province.
- (2)
- In 2009, in the section of major rivers of Liaoning Province, the percentage of water whose quality was above Level V standards was 65.8%. According to the 2017 data, the percentage of water whose quality met Level I, II, and III standards was 30.6%; the percentages of water whose quality fell under Level IV, V, and below V were 52.8%, 8.3%, and 8.3%, respectively.
- (3)
- In 2009, in the monitored section of major rivers in Jilin Province, the percentages of water whose quality fell into Level II, III, IV, and V were 16.9%, 35.0%, 20.8%, and 10.4%, respectively. According to the 2017 Environmental Bulletin data, in the monitored river sections of Jilin Province, the percentages of water whose quality fell into Level II, III, IV, and V improved to 34.1%, 37.6%, 8.6%, and 4.7%, respectively.
- (1)
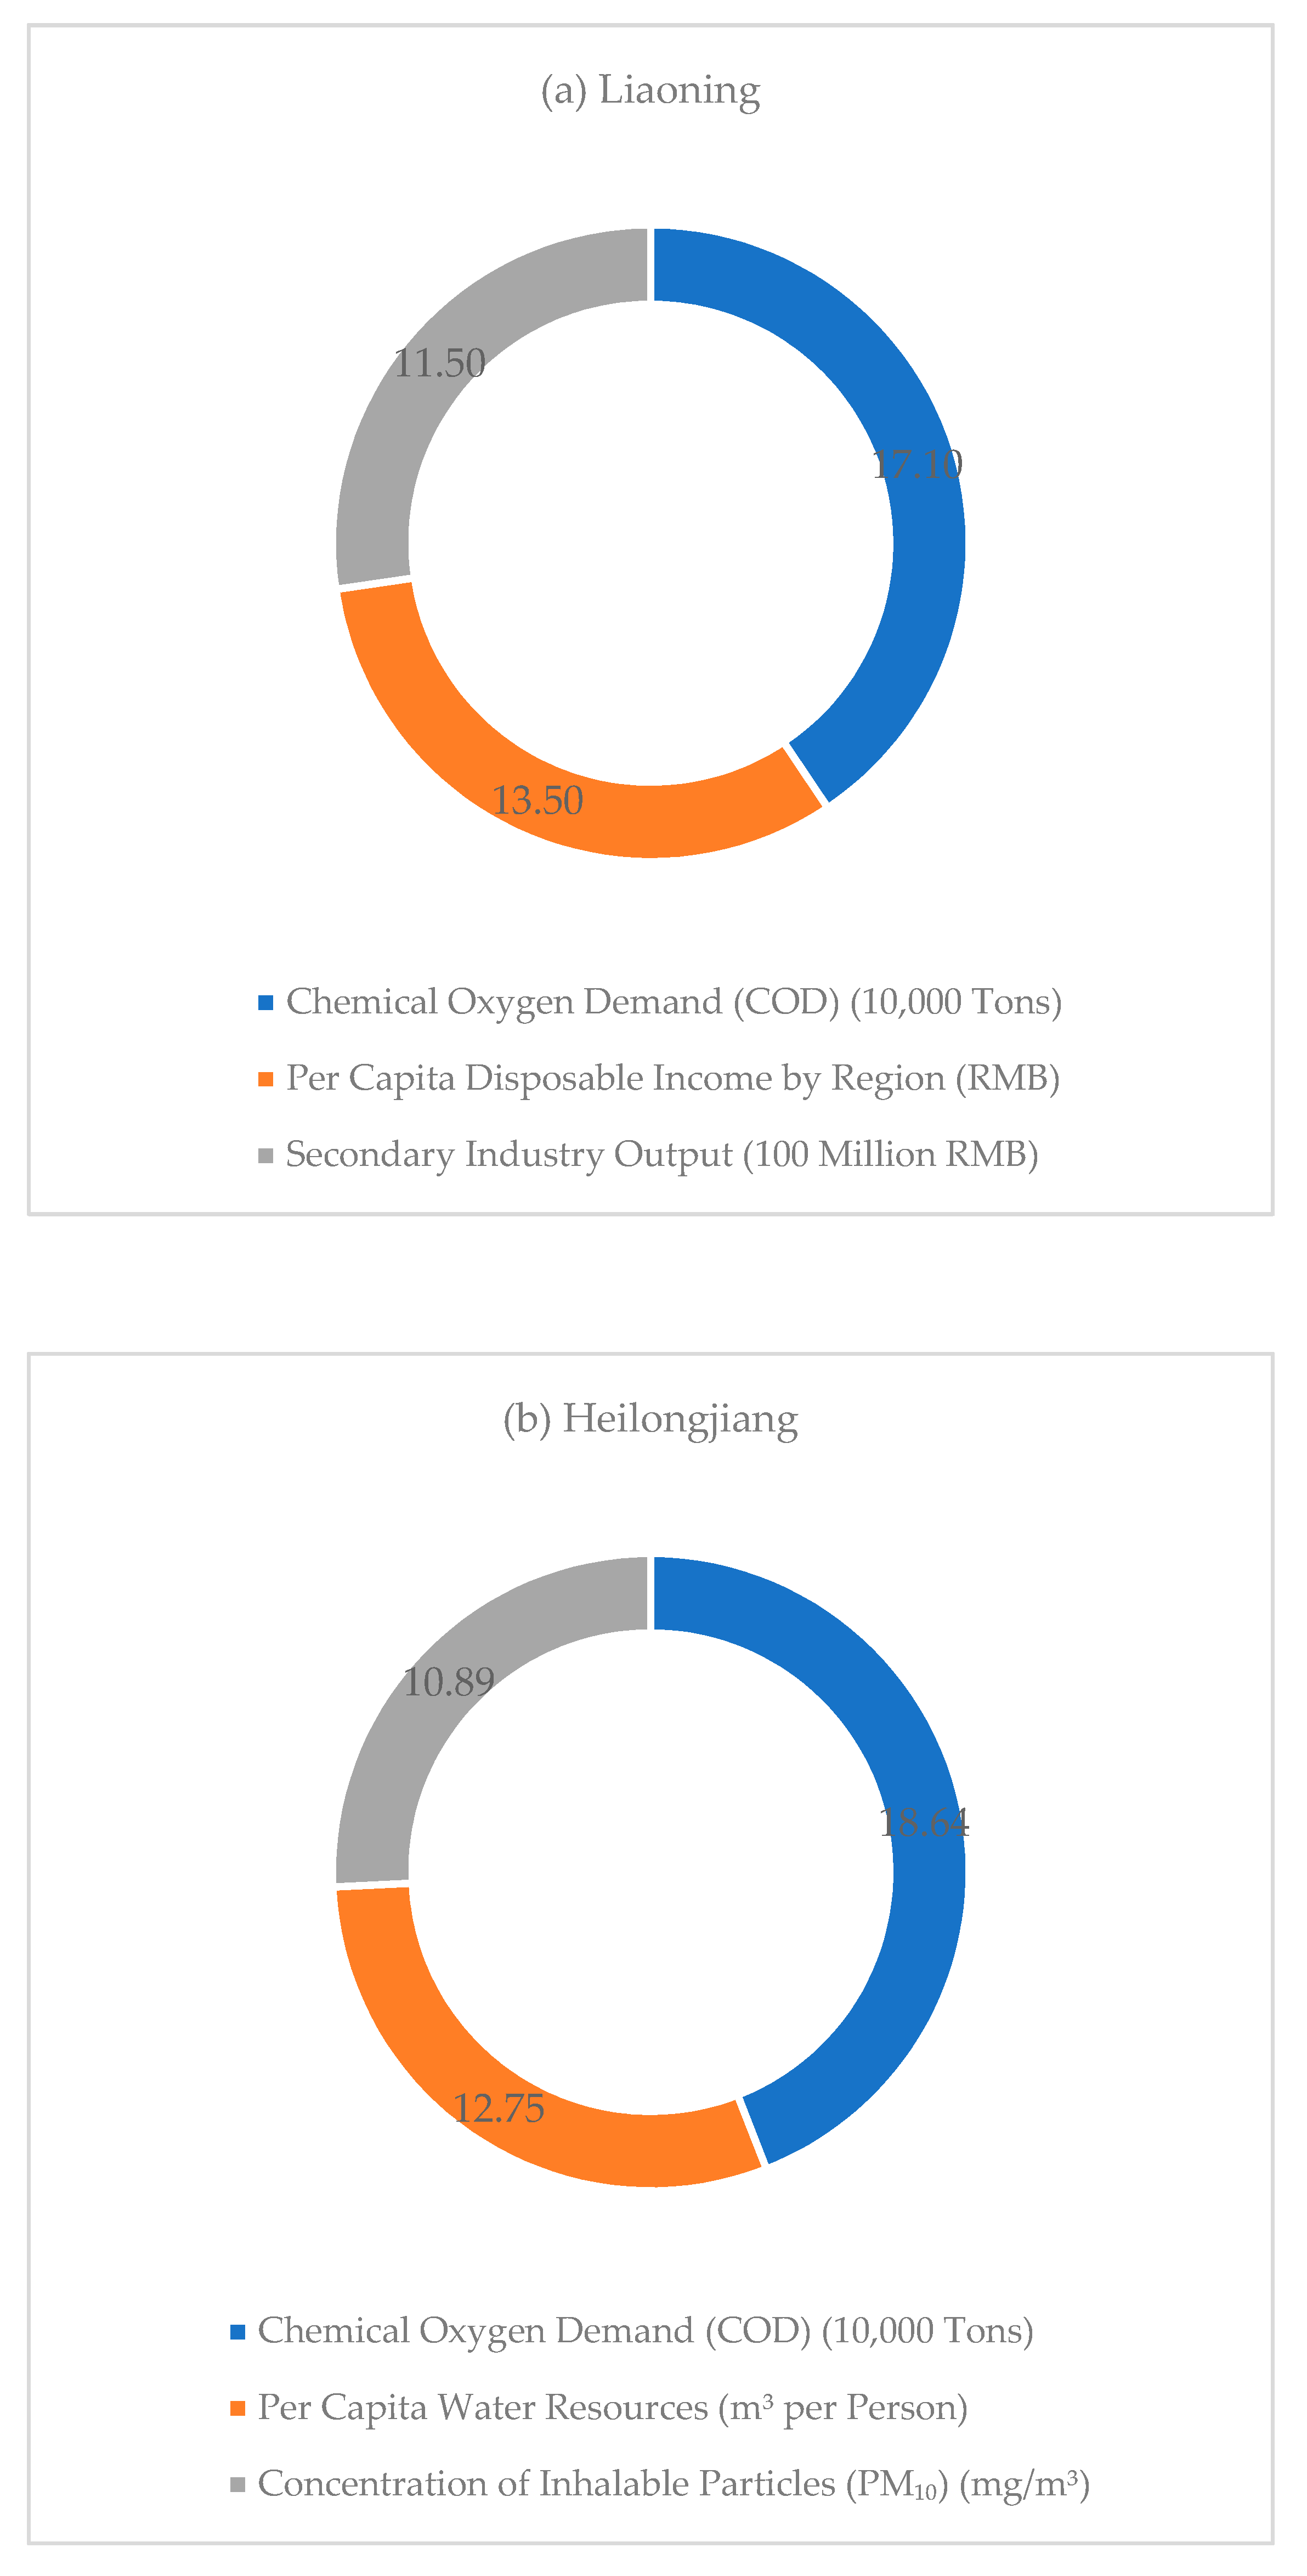
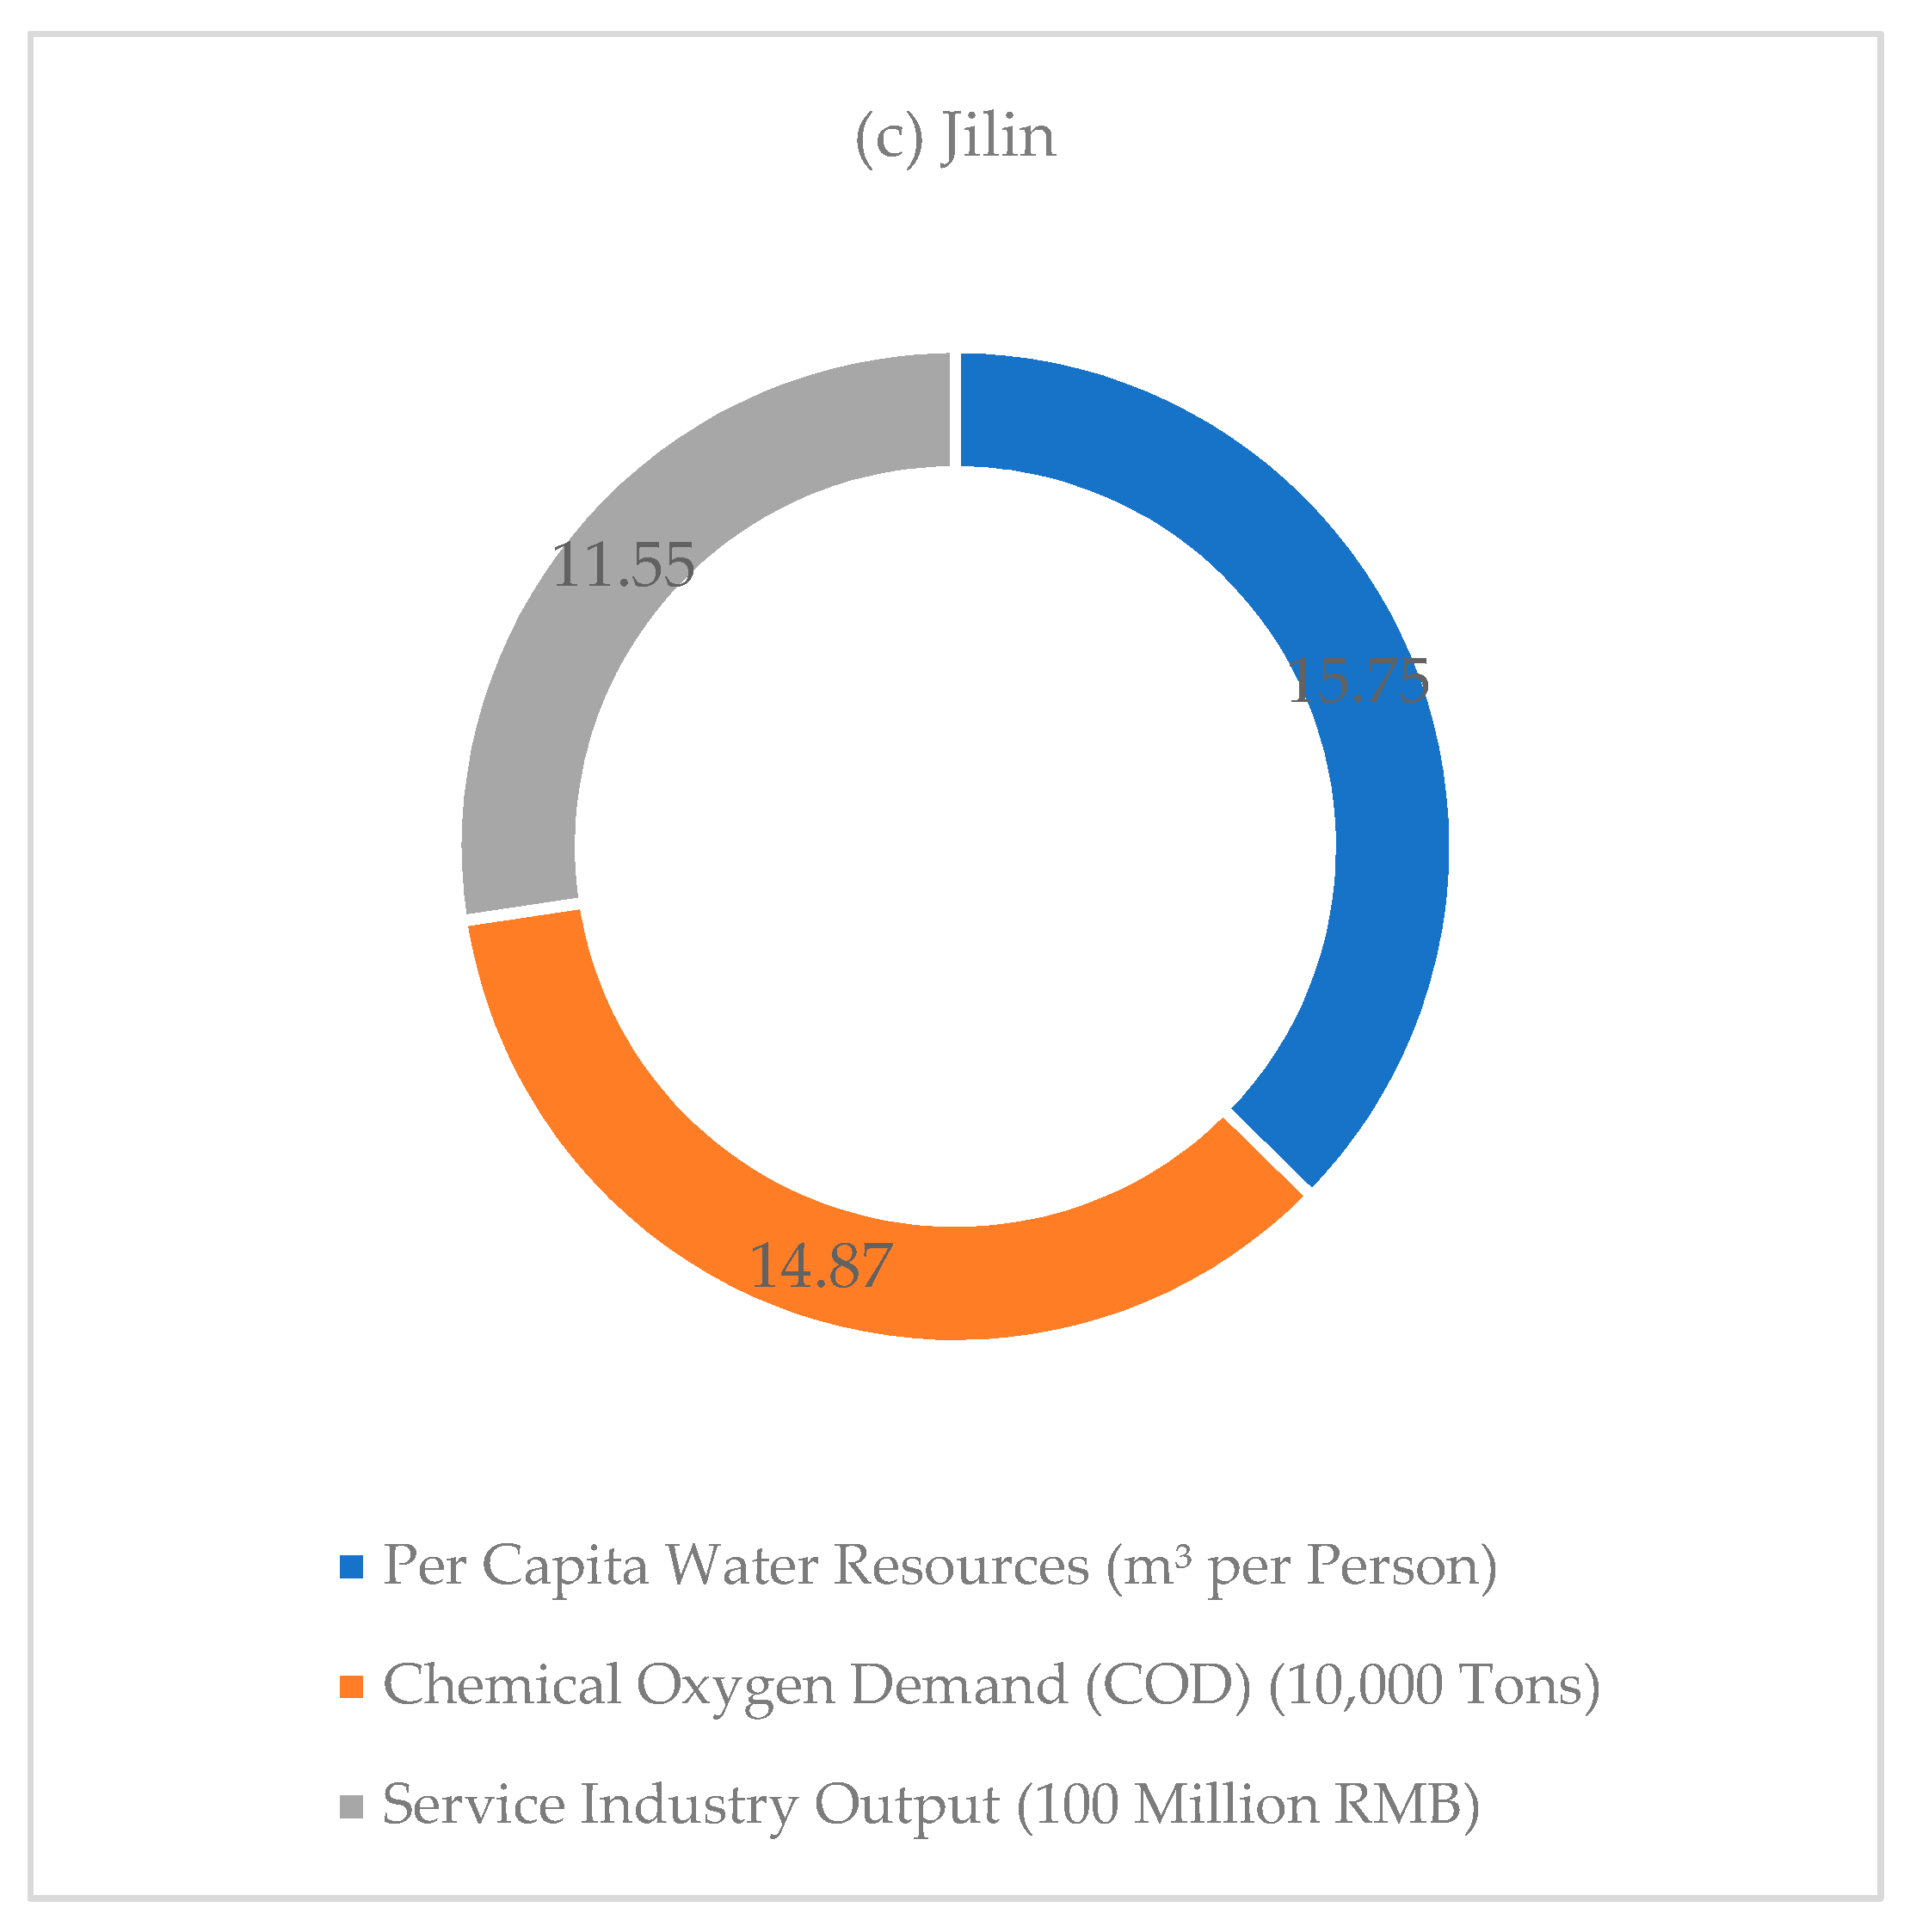
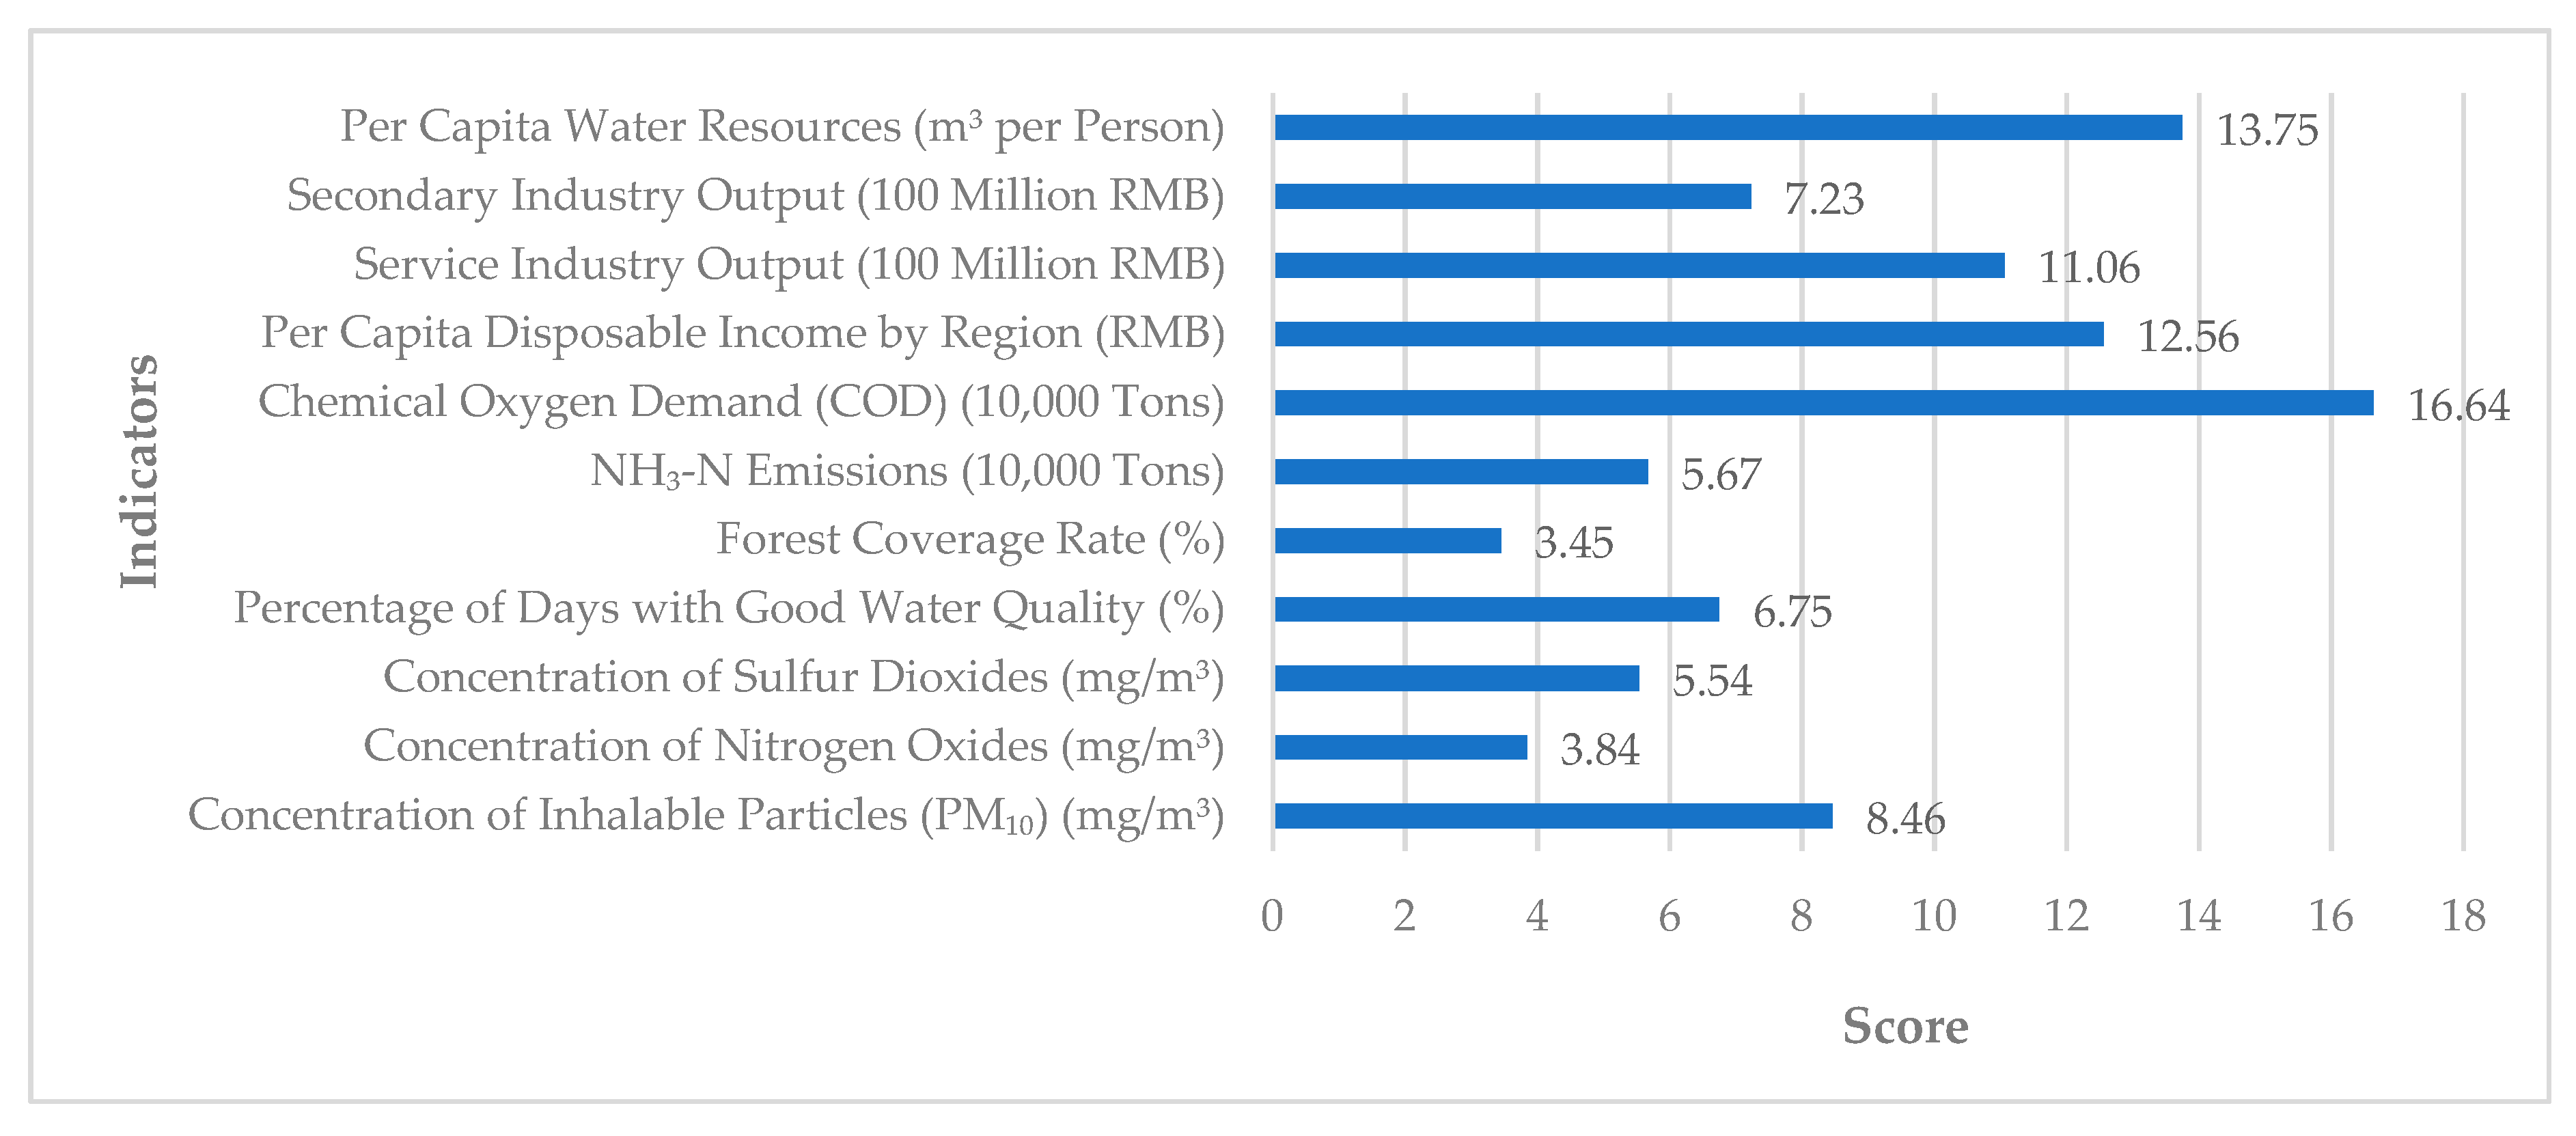
- Chemical Oxygen Demand (COD): This indicator reflects the quality of water and its impact on the ecological environment. The reducing substances in water are mainly organic substances, and their main sources are the decomposition of animals and plants and the discharge of domestic sewage and industrial wastewater. When the water is contaminated by organic matters, the Chemical Oxygen Demand (COD) increases [60,61,62]. According to our results, this indicator had the greatest impact on the water environment safety of northeast China. The industrial development in the past years has brought considerable damages to the water environment in this region. The discharge of industrial wastewater and agricultural wastewater has caused organic pollution of the water bodies. Chemical Oxygen Demand (COD) was the most influential factor in the water environment of both Liaoning Province and Heilongjiang Province, which indicates the significance of organic pollution control in the northeast region.
- (2)
- Per Capita Water Resources: This indicator reflects the capacity of water resources in a certain region. The fact that this indicator has a huge impact on the water environment safety of northeast China has reflected the problem of water shortage and waste of water resources in this region. The northeast provinces are endowed with an admirable natural and geographical environment, as well as famous rivers such as the Heilongjiang River, Nen River, Songhua River, and Liao River. However, despite their abundant river systems, the northeast provinces face serious problems including waste of water resources, low water recycling rate, and extensive irrigation style in agricultural practice. Due to the dry climate in recent years, this region has experienced droughts during springtime, which has aggravated the issue of water shortage in the northeast region. Such problems are particularly prominent in Heilongjiang Province [63,64,65].
- (3)
- Per Capita Disposable Income: This is an important economic indicator that reflects the impact of human economic activities on the generation of water resources and the number of water resources available. The higher the per capita disposable income, the stronger the investment capacity in water conservancy infrastructure, which could further ensure economic security and facilitate the improvement of water environment safety [66,67]. This indicator was the third most important indicator that affects the water environment safety in northeast China, indicating that the water environment management is closely related to the local economic development level. Economic development is an important source of local government’s fiscal revenue, supporting the government’s efforts in environmental protection policy implementation and construction of related infrastructure. Meanwhile, economic development is also the basis of technological innovation and institutional reform of enterprises, which drives the research and development as well as promotion of wastewater treatment technologies and improvement in the utilization efficiency of water resources. In addition, per capita disposable income also plays an important role in advancing the reform of agricultural production technology. Therefore, increasing per capita disposable income is an important condition and foundation for water environment safety enhancement.
5. Conclusions and Measures
- (1)
- Improve wastewater treatment methods, especially for pollutants containing industrial organic matters. First, it is crucial to improve the treatment method for industrial wastewater with organic matters and improve the treatment efficiency, selecting appropriate technology according to the nature of different pollutants in the wastewater. For wastewater that contains low-boiling organic matters, the steam stripping method can be used; for wastewater that contains surface-active materials, the foam separation method can be used; for wastewater that contains macromolecular hydrophobic materials, method such as coagulating sedimentation can be used. Meanwhile, technical improvement should be performed on existing equipment, such as installing additional processes including coagulating sedimentation, filtration, and activated carbon adsorption to the end of biological treatment process. For water pollution containing agricultural organic matter, biological means can be adopted in pollution prevention and control [68,69].
- (2)
- Improve the utilization efficiency of water resources. According to the research results of the paper, Per Capita Water Resources has a great impact on the water environment safety of the northeast region. The water resources in China are not evenly distributed. This is especially true for the northeast region. These northeast provinces should formulate scientific water policies according to the natural environment, socioeconomic conditions, and regional development needs, as well as improve the allocation efficiency of water resources and utilize water wisely. Local governments should keep in mind the importance of effective allocation of water resources, guiding the utilization of water resources with a recycling and comprehensive perspective, as well as enhance scientific water resource utilization planning to achieve efficient resource allocation, and improve the utilization efficiency by effective and strict supervision measures. It is necessary to strengthen the recycling of water resources and save water by improving the treatment and recovery of sewage and wastewater and encouraging the recycling of water resources [70,71,72].
- (3)
- Promote economic development. According to the research results of this paper, increasing per capita disposable income is an important way to improve the water environment safety in northeast China. Deepening reform and promoting the revitalization of the old industrial base in northeast China are both critical ways to advance the economic development in this region [73]. Meanwhile, improving the income distribution system and social equity is also an important measure in increasing per capita disposable income and thus improving the environment. The local governments should narrow the income gap by adjusting the income distribution policy, and increase per capita disposable income in order to provide economic support to the sustainable development of the northeast region [74]. The local governments should adhere to the people-oriented principle, pay more attention to social equity, and make use of economic adjustment mechanisms including fiscal and monetary policies, and adjust the redistribution policy in order to cultivate a fair competitive environment, protect legitimate income, and establish appropriate mechanisms for worker wage increase and guarantee for wage payments.
Author Contributions
Funding
Conflicts of Interest
References
- United Nations. Report of the United Nations Conference on Human Environment; United Nations: San Francisco, CA, USA, 1972. [Google Scholar]
- World Water Council. Ministerial Declaration of The Hague on Water Security in the 21st Century; World Water Council: Marseille, France, 2000. [Google Scholar]
- Li, L.; Yang, W. Total factor efficiency study on China’s industrial coal input and wastewater control with dual target variables. Sustainability 2018, 10, 2121. [Google Scholar] [CrossRef]
- Yang, W.; Li, L. Analysis of total factor efficiency of water resource and energy in China: A study based on DEA-SBM model. Sustainability 2017, 9, 1316. [Google Scholar] [CrossRef]
- Yang, W.; Li, L. Efficiency evaluation and policy analysis of industrial wastewater control in China. Energies 2017, 10, 1201. [Google Scholar] [CrossRef]
- National Bureau of Statistics of China. China Statistical Yearbook, 2018; China Statistic Press: Beijing, China, 2019. [Google Scholar]
- Roeger, A.; Tavares, A.F. Water safety plans by utilities: A review of research on implementation. Util. Policy 2018, 53, 15–24. [Google Scholar] [CrossRef]
- Duan, W.; Takara, K.; He, B.; Luo, P.; Nover, D.; Yamashiki, Y. Spatial and temporal trends in estimates of nutrient and suspended sediment loads in the Ishikari River, Japan, 1985 to 2010. Sci. Total Environ. 2013, 461–462, 499–508. [Google Scholar] [CrossRef] [PubMed]
- Duan, W.; Chen, Y.; Zou, S.; Nover, D. Managing the water-climate- food nexus for sustainable development in Turkmenistan. J. Clean. Prod. 2019, 220, 212–224. [Google Scholar] [CrossRef]
- Central Committee of the Communist Party of China. Central Committee of the Communist Party of China: Recommendations for the 13th Five-Year Plan for Economic and Social Development; People’s Publishing House: Beijing, China, 2015. [Google Scholar]
- Cao, T.; Wang, S.; Chen, B. Water shortage risk transferred through interprovincial trade in Northeast China. Energy Procedia 2019, 158, 3865–3871. [Google Scholar] [CrossRef]
- Zhao, R.; Chen, Q.; Wang, Y. Historical inevitability and path choices of Northeast China’s economic Revival from the view of industrial development. Commer. Res. 2018, 5, 1–11. [Google Scholar]
- Fan, J.; Liu, H.; Wang, Y.; Zhao, Y.; Chen, D. “The Northeast China Phenomenon” and prejudgment on economic revitalization in Northeast China: A primary research on stable factors to impact national spatial development and protection pattern. Sci. Geogr. Sin. 2016, 36, 1445–1456. [Google Scholar]
- Zhou, H. “Northeast Phenomenon” and the revitalization strategy. Econ. Rev. J. 2017, 1, 13–19. [Google Scholar]
- National Bureau of Statistics of China. China Statistical Yearbook, 2009–2017; China Statistic Press: Beijing, China, 2018. [Google Scholar]
- Yang, W.; Li, L. Energy efficiency, ownership structure, and sustainable development: Evidence from China. Sustainability 2017, 9, 912. [Google Scholar] [CrossRef]
- Bu, H.; Song, X.; Zhang, Y. Using multivariate statistical analyses to identify and evaluate the main sources of contamination in a polluted river near to the Liaodong Bay in Northeast China. Environ. Pollut. 2019, 245, 1058–1070. [Google Scholar] [CrossRef] [PubMed]
- Xia, J.; Liu, M.; Jia, S.; Song, X.; Luo, Y.; Zhang, S. Water security problem and research perspective in North China. J. Nat. Resour. 2004, 19, 550–560. [Google Scholar]
- Zhong, H.; Geng, L. Visual water and water safety. Chin. Water Resour. 2004, 5, 22–23. [Google Scholar]
- Anderson, J.D.; Wu, C.H. Development and application of a real-time water environment cyberinfrastructure for kayaker safety in the Apostle islands, lake superior. J. Great Lakes Res. 2018, 44, 990–1001. [Google Scholar] [CrossRef]
- Li, J.; Qiao, Y.; Lei, X.; Kang, A.; Wang, M.; Liao, W.; Wang, H.; Ma, Y. A two-stage water allocation strategy for developing regional economic-environment sustainability. J. Environ. Manag. 2019, 244, 189–198. [Google Scholar] [CrossRef]
- Ding, X.; Zhu, Q.; Zhai, A.; Liu, L. Water quality safety prediction model for drinking water source areas in three gorges reservoir and its application. Ecol. Indic. 2019, 101, 734–741. [Google Scholar] [CrossRef]
- Duan, W.; He, B.; Chen, Y.; Zou, S.; Wang, Y.; Nover, D.; Chen, W.; Yang, G. Identification of long-term trends and seasonality in high-frequency water quality data from the Yangtze river basin, China. PLoS ONE 2018, 13, e0188889. [Google Scholar] [CrossRef] [PubMed]
- Zhou, Z.; Zhang, X.; Dong, W. Fuzzy comprehensive evaluation for safety guarantee system of reclaimed water quality. Procedia Environ. Sci. 2013, 18, 227–235. [Google Scholar] [CrossRef]
- Duan, W.; He, B.; Nover, D.; Yang, G.; Chen, W.; Meng, H.; Zou, S.; Liu, C. Water quality assessment and pollution source identification of the eastern Poyang lake Basin using multivariate statistical methods. Sustainability 2016, 8, 133. [Google Scholar] [CrossRef]
- Xiao, Q.; He, R.; Ma, C.; Zhang, W. Evaluation of urban taxi-carpooling matching schemes based on entropy weight fuzzy matter-element. Appl. Soft Comput. 2019, 81, 105493. [Google Scholar] [CrossRef]
- Arnold, J.G.; Allen, P.M.; Bernhardt, G. A comprehensive surface-groundwater flow model. J. Hydrol. 1993, 142, 47–69. [Google Scholar] [CrossRef]
- Zhang, H.; Xie, J.; Lu, W.; Zhang, Z.; Fu, X. Novel ranking method for intuitionistic fuzzy values based on information fusion. Comput. Ind. Eng. 2019, 133, 139–152. [Google Scholar] [CrossRef]
- Sun, Y.; Zhang, B.; Yan, Y.; Pan, F. Fuzzy comprehensive assessment model for the urban water resource safety assessment based on the entropy weight. J. Saf. Environ. 2014, 14, 87–91. [Google Scholar]
- Ilic, M.; Jovic, S.; Spalevic, P.; Vujicic, I. Water cycle estimation by neuro-fuzzy approach. Comput. Electron. Agric. 2017, 135, 1–3. [Google Scholar] [CrossRef]
- Lu, S.; Shang, Y.; Li, Y. A research on the application of fuzzy iteration clustering in the water conservancy project. J. Clean. Prod. 2017, 151, 356–360. [Google Scholar] [CrossRef]
- Milan, S.G.; Roozbahani, A.; Banihabib, M.E. Fuzzy optimization model and fuzzy inference system for conjunctive use of surface and groundwater resources. J. Hydrol. 2018, 566, 421–434. [Google Scholar] [CrossRef]
- Tiri, A.; Belkhiri, L.; Mouni, L. Evaluation of surface water quality for drinking purposes using fuzzy inference system. Groundw. Sustain. Dev. 2018, 6, 235–244. [Google Scholar] [CrossRef]
- Fang, Y.; Zheng, X.; Peng, H.; Wang, H.; Xin, J. A new method of the relative membership degree calculation in variable fuzzy sets for water quality assessment. Ecol. Indic. 2019, 98, 515–522. [Google Scholar] [CrossRef]
- Moghaddam, R.G.; Allahviranloo, T. On the fuzzy poisson equation. Fuzzy Sets Syst. 2018, 347, 105–128. [Google Scholar] [CrossRef]
- Gao, H.; Yang, W.; Yang, Y.; Yuan, G. Analysis of the air quality and the effect of governance policies in China’s Pearl river Delta, 2015–2018. Atmosphere 2019, 10, 412. [Google Scholar] [CrossRef]
- Zeinalzadeh, K.; Rezaei, E. Determining spatial and temporal changes of surface water quality using principal component analysis. J. Hydrol. Reg. Stud. 2017, 13, 1–10. [Google Scholar] [CrossRef]
- Yuan, G.; Yang, W. Study on optimization of economic dispatching of electric power system based on Hybrid Intelligent Algorithms (PSO and AFSA). Energy 2019, 183, 926–935. [Google Scholar] [CrossRef]
- Yang, W.; Yuan, G.; Han, J. Is China’s air pollution control policy effective? Evidence from Yangtze river Delta cities. J. Clean. Prod. 2019, 220, 110–133. [Google Scholar] [CrossRef]
- Ferrero, G.; Setty, K.; Rickert, B.; George, S.; Rinehold, A.; DeFrance, J.; Bartram, J. Capacity building and training approaches for water safety plans: A comprehensive literature review. Int. J. Hyg. Environ. Health 2019, 222, 615–627. [Google Scholar] [CrossRef] [PubMed]
- Ministry of Environment Protection of the People’s Republic of China. Annual Statistic Report on Environment in China (2009–2017); China Environmental Science Press: Beijing, China, 2018. [Google Scholar]
- The Water Resources Department of Liaoning Province. The Water Resource Bulletin of Liaoning, 2009–2017; Liaoning Science and Technology Publishing House: Shenyang, Liaoning, 2018. [Google Scholar]
- Jilin Provincial Water Resources Department. The Water Resource Bulletin of Jilin Province, 2009–2017; Jilin People’s Publishing House: Changchun, China, 2018. [Google Scholar]
- Heilongjiang Provincial Water Resources Department. The Water Resource Bulletin of Heilongjiang, 2009–2017; Heilongjiang Publishing Group: Harbin, China, 2018. [Google Scholar]
- Liu, Q.; Shi, T. Spatiotemporal differentiation and the factors of ecological vulnerability in the Toutun river Basin based on remote sensing data. Sustainability 2019, 11, 4160. [Google Scholar] [CrossRef]
- Tripathi, M.; Singal, S.K. Use of principal component analysis for parameter selection for development of a novel water quality index: A case study of river Ganga India. Ecol. Indic. 2019, 96, 430–436. [Google Scholar] [CrossRef]
- Zhang, C.; Liu, W.; Su, Z.; Wang, L. Index system and method for assessing water environment security of Luan river-Tianjin water diversion project. In Proceedings of the 2010 4th International Conference on Bioinformatics and Biomedical Engineering, Chengdu, China, 18–20 June 2010; pp. 1–5. [Google Scholar]
- Liu, X.; Tu, Z. Assessment method on water environment security and its application in Jing-Jin-Ji region. Chin. J. Manag. Sci. 2018, 26, 160–168. [Google Scholar]
- Xu, H.; Ma, C.; Lian, J.; Xu, K.; Chaima, E. Urban flooding risk assessment based on an integrated k-means cluster algorithm and improved entropy weight method in the region of Haikou, China. J. Hydrol. 2018, 563, 975–986. [Google Scholar] [CrossRef]
- Yunlong, W.; Kai, L.; Guan, G.; Yanyun, Y.; Fei, L. Evaluation method for Green jack-up drilling platform design scheme based on improved grey correlation analysis. Appl. Ocean Res. 2019, 85, 119–127. [Google Scholar] [CrossRef]
- He, Y.; Pang, Y.; Zhang, Q.; Jiao, Z.; Chen, Q. Comprehensive evaluation of regional clean energy development levels based on principal component analysis and rough set theory. Renew. Energy 2018, 122, 643–653. [Google Scholar] [CrossRef]
- Couso, I.; Strauss, O.; Saulnier, H. Kendall’s rank correlation on quantized data: An interval-valued approach. Fuzzy Sets Syst. 2018, 343, 50–64. [Google Scholar] [CrossRef]
- Mao, G. Testing independence in high dimensions using Kendall’s tau. Comput. Stat. Data Anal. 2018, 117, 128–137. [Google Scholar] [CrossRef]
- Fang, S.; Yao, X.; Zhang, J.; Han, M. Grey correlation analysis on travel modes and their influence factors. Procedia Eng. 2017, 174, 347–352. [Google Scholar] [CrossRef]
- Jong, J.; Rim, C.; Choi, M.; Om, H. Comprehensive evaluation of marine waste heat recovery technologies based on hierarchy-grey correlation analysis. J. Ocean Eng. Sci. 2019. [Google Scholar] [CrossRef]
- Tu, I.; Huang, S.; Hsieh, D. The generalized degrees of freedom of multilinear principal component analysis. J. Multivar. Anal. 2019, 173, 26–37. [Google Scholar] [CrossRef]
- Heo, S.; Lee, J.H. Parallel neural networks for improved nonlinear principal component analysis. Comput. Chem. Eng. 2019, 127, 1–10. [Google Scholar] [CrossRef]
- Ma, X.; Ma, Y. The spatiotemporal variation analysis of virtual water for agriculture and livestock husbandry: A study for Jilin province in China. Sci. Total Environ. 2017, 586, 1150–1161. [Google Scholar] [CrossRef]
- Gao, X.; Zhao, Y.; Lu, S.; Chen, Q.; An, T.; Han, X.; Zhuo, L. Impact of coal power production on sustainable water resources management in the coal-fired power energy bases of Northern China. Appl. Energy 2019, 250, 821–833. [Google Scholar] [CrossRef]
- Yang, W.; Li, L. Efficiency evaluation of industrial waste gas control in China: A study based on data envelopment analysis (DEA) model. J. Clean. Prod. 2018, 179, 1–11. [Google Scholar] [CrossRef]
- Wang, J.; Li, L.; Li, F.; Kharrazi, A.; Bai, Y. Regional footprints and interregional interactions of chemical oxygen demand discharges in China. Resour. Conserv. Recycl. 2018, 132, 386–397. [Google Scholar] [CrossRef]
- Yuan, G.; Yang, W. Evaluating China’s air pollution control policy with extended AQI indicator system: Example of the Beijing-Tianjin-Hebei region. Sustainability 2019, 11, 939. [Google Scholar] [CrossRef]
- Cai, J.; Varis, O.; Yin, H. China’s water resources vulnerability: A spatio-temporal analysis during 2003–2013. J. Clean. Prod. 2017, 142, 2901–2910. [Google Scholar] [CrossRef]
- De Clercq, D.; Smith, K.; Chou, B.; Gonzalez, A.; Kothapalle, R.; Li, C.; Dong, X.; Liu, S.; Wen, Z. Identification of urban drinking water supply patterns across 627 cities in China based on supervised and unsupervised statistical learning. J. Environ. Manag. 2018, 223, 658–667. [Google Scholar] [CrossRef] [PubMed]
- Yang, Y.; Yang, W. Does whistleblowing work for air pollution control in China? A study based on three-party evolutionary game model under Incomplete Information. Sustainability 2019, 11, 324. [Google Scholar] [CrossRef]
- Pories, L. Income-enabling, not consumptive: Association of household socio-economic conditions with safe water and sanitation. Aquat. Procedia 2016, 6, 74–86. [Google Scholar] [CrossRef]
- Tyllianakis, E.; Skuras, D. The income elasticity of Willingness-To-Pay (WTP) revisited: A meta-analysis of studies for restoring Good Ecological Status (GES) of water bodies under the Water Framework Directive (WFD). J. Environ. Manag. 2016, 182, 531–541. [Google Scholar] [CrossRef] [PubMed]
- Wong, J.K.H.; Tan, H.K.; Lau, S.Y.; Yap, P.-S.; Danquah, M.K. Potential and challenges of enzyme incorporated nanotechnology in dye wastewater treatment: A review. J. Environ. Chem. Eng. 2019, 7, 103261. [Google Scholar] [CrossRef]
- Sarode, S.; Upadhyay, P.; Khosa, M.A.; Mak, T.; Shakir, A.; Song, S.; Ullah, A. Overview of wastewater treatment methods with special focus on biopolymer chitin-chitosan. Int. J. Biol. Macromol. 2019, 121, 1086–1100. [Google Scholar] [CrossRef]
- Wang, S.; Wang, S. Implications of improving energy efficiency for water resources. Energy 2017, 140, 922–928. [Google Scholar] [CrossRef]
- Song, M.; Wang, R.; Zeng, X. Water resources utilization efficiency and influence factors under environmental restrictions. J. Clean. Prod. 2018, 184, 611–621. [Google Scholar] [CrossRef]
- Chen, Q.; Ai, H.; Zhang, Y.; Hou, J. Marketization and water resource utilization efficiency in China. Sustain. Comput. Inform. Syst. 2019, 22, 32–43. [Google Scholar] [CrossRef]
- Ren, W.; Geng, Y.; Xue, B.; Fujita, T.; Ma, Z.; Jiang, P. Pursuing co-benefits in China’s old industrial base: A case of Shenyang. Urban Clim. 2012, 1, 55–64. [Google Scholar] [CrossRef]
- Gao, J.; Liu, Y.; Chen, J.; Cai, Y. Demystifying the geography of income inequality in rural China: A transitional framework. J. Rural Stud. 2019. [Google Scholar] [CrossRef]


| Indicator | Principal Component 1 | Principal Component 2 | Principal Component 3 | Principal Component 4 | Principal Component 5 | Screening Result |
|---|---|---|---|---|---|---|
| Percentage of Urban Population by End of Year (%) | 0.136 | 0.231 | 0.462 | −0.489 | −0.430 | Drop |
| Natural Population Growth Rate (%) | −0.003 | −0.118 | −0.166 | 0.454 | 0.315 | Drop |
| Per Capita Water Resources (m3 per Person) | 0.197 | −0.414 | −0.704 | 0.592 | 0.685 | Keep |
| Regional GDP (100 Million RMB) | 0.168 | 0.375 | 0.480 | −0.597 | −0.445 | Drop |
| Secondary Industry Output (100 Million RMB) | 0.142 | 0.401 | 0.446 | −0.607 | −0.335 | Keep |
| Service Industry Output (100 Million RMB) | 0.125 | 0.179 | 0.322 | −0.626 | −0.304 | Keep |
| Per Capita Disposable Income by Region (RMB) | −0.024 | 0.080 | 0.221 | −0.732 | −0.269 | Keep |
| Proportion of Water of Quality Level 1–3 (%) | −0.156 | −0.242 | −0.453 | 0.415 | 0.248 | Drop |
| Proportion of Water of Poor Quality Below Level 5 (%) | −0.267 | −0.009 | −0.002 | −0.211 | 0.054 | Drop |
| Waste Water Emission (100 Million Tons) | 0.216 | 0.409 | 0.563 | −0.333 | −0.565 | Drop |
| Chemical Oxygen Demand (COD) (10,000 Tons) | 0.802 | 0.609 | −0.171 | 0.070 | 0.142 | Keep |
| NH3−N Emissions (10,000 Tons) | 0.652 | 0.579 | 0.083 | −0.072 | −0.056 | Keep |
| Forest Coverage Rate (%) | 0.278 | −0.378 | −0.827 | 0.201 | 1.000 | Keep |
| Percentage of Days with Good Water Quality (%) | −0.006 | −0.175 | −0.282 | 0.729 | 0.201 | Keep |
| Concentration of Sulfur Dioxides (mg/m3) | −0.426 | 0.297 | 0.349 | −0.282 | −0.827 | Keep |
| Concentration of Nitrogen Oxides (mg/m3) | 0.529 | 0.689 | 0.297 | −0.175 | −0.378 | Keep |
| Concentration of Inhalable Particles (mg/m3) | 0.639 | 0.529 | −0.426 | −0.006 | 0.278 | Keep |
| Focus | Indicator | Very Safe | Safe | Neutral | Unsafe | Very Dangerous |
|---|---|---|---|---|---|---|
| Economic | Percentage of Urban Population by End of Year (%) | 0.84 | 0.79 | 0.69 | 0.5 | 0.47 |
| Economic | Natural Population Growth Rate (%) | 6.3 | 5 | 4.1 | 3.5 | 2.5 |
| Economic | Regional GDP Growth Rate (%) | 6.75 | 7 | 7.25 | 7.75 | 8.25 |
| Economic | Secondary Industry as a Percentage of GDP (%) | 0.693 | −0.063 | 0.364 | −0.006 | −0.097 |
| Economic | Service Industry as a Percentage of GDP (%) | 65 | 60 | 51.4 | 46 | 35.4 |
| Economic | Per Capita Disposable Income by Region (RMB) | 0.975 | −0.183 | 0.072 | 0.029 | 0.017 |
| Environmental | Proportion of Water of Quality Level 1–3 (%) | 80 | 70 | 60 | 50 | 40 |
| Environmental | Percentage of Days with Good Water Quality (%) | −0.692 | −0.029 | −0.616 | 0.139 | 0.300 |
| Ecological | Per Capita Water Resources (m3 per Person) | 2300 | 1700 | 1100 | 700 | 500 |
| Indicator | Entropy Weight Method | Principal Component Analysis Method | Grey Correlation Method |
|---|---|---|---|
| Per Capita Water Resources (m3 per Person) | 0.3537 | 0.1771 | 0.1525 |
| Secondary Industry as a Percentage of GDP (%) | 0.0813 | 0.0596 | 0.0961 |
| Service Industry as a Percentage of GDP (%) | 0.1158 | 0.1217 | 0.1250 |
| Per Capita Disposable Income by Region (RMB) | 0.1282 | 0.1504 | 0.1332 |
| Chemical Oxygen Demand (COD) (10,000 Tons) | 0.1585 | 0.2078 | 0.1791 |
| NH3-N Emissions (10,000 Tons) | 0.0124 | 0.0426 | 0.0306 |
| Forest Coverage Rate (%) | 0.0066 | 0.0032 | 0.0055 |
| Percentage of Days with Good Water Quality (%) | 0.0329 | 0.0147 | 0.0699 |
| Concentration of Sulfur Dioxides (mg/m3) | 0.0102 | 0.0283 | 0.0292 |
| Concentration of Nitrogen Oxides (mg/m3) | 0.0576 | 0.0414 | 0.0876 |
| Concentration of Inhalable Particles (PM10) (mg/m3) | 0.0935 | 0.0771 | 0.0525 |
© 2019 by the authors. Licensee MDPI, Basel, Switzerland. This article is an open access article distributed under the terms and conditions of the Creative Commons Attribution (CC BY) license (http://creativecommons.org/licenses/by/4.0/).
Share and Cite
Li, Y.; Sun, M.; Yuan, G.; Liu, Y. Evaluation Methods of Water Environment Safety and Their Application to the Three Northeast Provinces of China. Sustainability 2019, 11, 5135. https://doi.org/10.3390/su11185135
Li Y, Sun M, Yuan G, Liu Y. Evaluation Methods of Water Environment Safety and Their Application to the Three Northeast Provinces of China. Sustainability. 2019; 11(18):5135. https://doi.org/10.3390/su11185135
Chicago/Turabian StyleLi, Yuangang, Maohua Sun, Guanghui Yuan, and Yujing Liu. 2019. "Evaluation Methods of Water Environment Safety and Their Application to the Three Northeast Provinces of China" Sustainability 11, no. 18: 5135. https://doi.org/10.3390/su11185135
APA StyleLi, Y., Sun, M., Yuan, G., & Liu, Y. (2019). Evaluation Methods of Water Environment Safety and Their Application to the Three Northeast Provinces of China. Sustainability, 11(18), 5135. https://doi.org/10.3390/su11185135