Article

The Alerting Effect from Rising Public Awareness of Air Quality on the Outdoor Activities of Megacity Residents

1
School of Business Administration, Dankook University, Yongin 16890, Korea
2
Department of Information Systems & Technology Management, School of Business, George Washington University, Washington, DC 20052, USA
3
Department of Information Systems, W.P. Carey School of Business, Arizona State University, Tempe, AZ 85287, USA
4
Air Resources Laboratory, National Oceanic and Atmospheric Administration, College Park, MD 20740, USA
5
Cooperative Institute for Satellite Earth System Studies, University of Maryland, College Park, MD 20740, USA
*
Author to whom correspondence should be addressed.
Sustainability 2020, 12(3), 820; https://doi.org/10.3390/su12030820
Submission received: 3 January 2020 / Revised: 17 January 2020 / Accepted: 20 January 2020 / Published: 22 January 2020

Abstract

:
This study investigated how the public awareness of air quality affects people’s decisions to participate in outdoor activities. Given that the keyword search volume of particulate matter (PM) in Seoul, South Korea started to grow dramatically only after November 2013, we defined two periods (low and high public awareness of PM) and conducted a series of comparative analyses to investigate the impact of public awareness of air quality on the relationship between PM level and people’s outdoor activities. In the low public awareness period, people’s outdoor activities measured by the number of daily subway passengers did not significantly vary over PM levels, even in the ’unhealthy’ range (80 < PM10 < = 150 µg/m3). On the contrary, during the high awareness period, people’s activities were significantly affected by the PM level, even in the ’moderate’ range. Specifically, the perceived safety threshold of PM10 level that people use to decide for engaging outdoor activities has decreased from 120 to 70 µg/m3. These results suggest that public awareness of air quality and its harmful ramifications on health is a key determinant of outdoor activities rather than PM10 concentration itself. Thus, this study alludes to a need for more timely and effective dissemination of air quality information to the public as much as for curbing anthropogenic emissions.

Graphical Abstract

1. Introduction

Air pollution is produced from a wide range of sources, such as automobiles (e.g., diesel-powered vehicles), power generation facilities (e.g., fossil fuel power plants), industrial processes (e.g., factories and cement kilns), agricultural and residential emissions (e.g., use of fertilizers and heating), natural sources (e.g., volcano, wildfires, and dust storms), and transboundary transports [1,2,3,4]. At high concentrations, air pollution poses a significant threat to public health and well-being [5,6,7,8]. Researchers have shown the risks associated with ambient air pollution, particularly the adverse health consequences of exposure to PM10 (i.e., particulate matter with a diameter of 10 micrometers or less), including mortality [9,10], respiratory ailments [9,11,12], cardiovascular disease [13,14], stroke [15], and early menarche [16].
In the context of increasingly concentrated air pollution, it is critical to prevent people from exposure to harmful environments. As such, modern governments should protect the public from hazardous air pollution, especially in countries that have achieved rapid economic growth at the expense of environmental protection. To achieve this goal, many governments, including those of Asian countries with high levels of air pollution, have mainly worked on two tasks: Controlling anthropogenic emissions and reducing public exposure to polluted conditions. While governments enforce stringent emission control policies, government agencies have also started providing relevant information, such as the air quality index (AQI), to empower the public to avoid the risk of being exposed to hazardous air conditions. At the same time, the recent availability of educational materials has raised public awareness of the sources and effects of air pollution.
South Korea is one such country. Over several decades, it has experienced air quality degradation, especially due to occasional invasions of severe yellow dust storms and high PM concentration caused by domestic or foreign emission sources [17]. The South Korean government has thus spent significant efforts and resources on controlling pollutant emissions [18], thereby decreasing the level of PM10 concentration in Seoul from 75 µg/m3 in 2002 to 46 µg/m3 in 2015 [19]. In parallel with such a pollutant emission reduction effort, the government has also developed an information system to publish air quality levels with the aim of enabling citizens to make informed decisions about their outdoor activities in a more health-conscious manner [20]. For example, real-time PM10 information has been provided to the public through the government’s air quality portal AirKorea (www.airkorea.or.kr) since its inception in April 2002.
Of these two main government efforts, the efficiency of emission control is relatively easy to confirm based on actual measurements of pollutants and their precursors [21,22,23]. However, it is not clear how much the information disclosure approach to timely provision of air quality information has been successful for achieving its intended goal, and thus it needs a thorough assessment to validate whether it actually helps citizens to avoid hazardous environments, and if so, how it affects public awareness on air quality, which in turn changes people’s decision for outdoor activities.
Extant studies have found that the major factors influencing people’s outdoor activity patterns are mostly meteorological, such as severe weather conditions, especially precipitation and extremely hot or cold temperatures, and wind velocity [24,25,26,27]. In addition, some studies have argued that the level of air quality can affect people’s decisions on whether to participate in outdoor activities. Keiser et al. (2018) demonstrated that surface ozone concentration is associated with the number of U.S. national park visitors [28]. Wen et al. (2009) reported the correlation between the outdoor activities of asthma patients and AQI warnings by the media [29]. These studies, however, have mostly relied on subjective survey data limited in time and spatial coverage, and little, if any, research has used sufficient large-scale observational data to reveal empirically the direct relationship between PM10 concentration and people’s outdoor activities. More importantly, no study, to the best of the authors’ knowledge, has addressed the impact of people’s awareness of air pollution on their decision to pursue outdoor activities.
Given the paucity of research in this area, this study investigates how rising attention to PM and its harmful ramifications on health affects citizens’ responses to actual PM10 levels in determining their outdoor activities. To this end, we first examine the relation between the environmental variables and people’s outdoor activities in an Asian megacity, Seoul, South Korea. Then, using a paired t-test, we further examine how people respond to varying levels of pollution concentrations as well as how their responses change when their awareness on air pollution increases.

2. Methods

2.1. Data

Our data set contains surface PM10 concentrations, meteorological variables, the number of subway passengers, and the keyword search volume and the number of articles on PM in South Korea. In total, 3288 daily observations for 2008 to 2016 were collected and analyzed to test separately the effects of the day of the week, month, temperature, and precipitation on the number of subway passengers.
Surface observations. Surface PM10 concentration in the Seoul metropolitan area from January 2008 to December 2016 was obtained from the portal “Air Korea” (www.airkorea.or.kr). PM10 measurements, based on the beta-ray absorption method [30], were collected from 39 urban air monitoring network sites across Seoul on an hourly basis (Supplementary Materials Figure S1). The data were confirmed and finalized by the National Institute of Environmental Research. The data on weather conditions, which are known to affect outdoor activity frequency, namely daily mean temperature (in degrees centigrade) and the daily amount of precipitation (in millimeters), were retrieved from the publicly accessible Korea Meteorological Administration website (https://data.kma.go.kr).
Korea’s comprehensive AQI system provides four levels of pollutant concentrations associated with health impact and behavioral guidelines: ’Good’, ’moderate’, ’unhealthy’, and ’very unhealthy’. According to the AQI, when PM10 concentration is less than 30 μg/m3, air quality is considered to be ’good’ (i.e., it poses little or no risk). When PM10 concentration is 31–80 μg/m3, air quality is ’moderate’ (i.e., there may be a moderate health concern for a small number of people). A PM10 concentration of 81–150 μg/m3 is classified as ’unhealthy’, which is a level that may have harmful impacts on patients and members of sensitive groups or cause the general public unpleasant feelings. The ’very unhealthy’ level (>151 μg/m3) may have a serious impact on patients and members of sensitive groups in the case of acute exposure.
Subway passengers. We operationalize a population’s daily outdoor activity level by measuring the number of subway passengers. Since people usually have routine patterns of daily life, we defined outdoor activity as the non-routine part of such a life pattern. Unlike routine activity (e.g., work schedule), which most megacity residents cannot change easily, outdoor activity was assumed to be correlated with personal life and relaxation, such as working out, going to a restaurant or a theater, or going on a trip.
Our data set includes the total daily subway passengers in the Seoul metropolitan area from January 2008 to December 2016, obtained from the Seoul Open Data Portal Services (http://data.seoul.go.kr). In general, people in the Seoul metropolitan area tend to use public transportation services due to heavy traffic during commuting times and a lack of parking spaces. In 2016, 65% of people used public transportation (e.g., subways and buses) compared with 24% who used cars (e.g., personal vehicles and taxis). The subway system is the most popular mode of public transportation in Seoul, accounting for around 60% of all public transportation. Thus, in this study, we use the number of subway passengers (more specifically, the deviations after controlling yearly, seasonal, and weekly variations) as an indicator of the outdoor activities of people in Seoul.
Search volume index (SVI). To represent the public perception of the adverse effects caused by PM10 levels, the monthly volume of keywords from Google and a number of articles on ’particulate matter’ from 2008 to 2016 were used to investigate the public awareness of the negative effect of PM. Google Trends provides the SVI scaled on a range of 0 to 100 based on the relative keyword search volumes during the period [31]. The articles referring to PM were acquired from the Korea Press Foundation, which provides all the articles from 47 press outlets in Korea (www.kinds.or.kr).

2.2. Analytical Method

2.2.1. Index and Comparison Days

In general, the relationship between air pollution and human behavior can be confounded by other factors that affect the latter, such as the day of the week, seasonal trends, and weather conditions. To control for such confounding effects caused by long-term time series patterns, weekly and annual variations, temperature, and precipitation, we compared an index day group with a symmetrical comparison day group [9,11,15,32].
Paired t-tests were conducted on the numbers of daily subway passengers for the index and comparison day groups to investigate the relationship between PM10 and public outdoor activities. ’Index’ days are defined as the days with a daily mean PM10 concentration higher than a certain concentration threshold. ’Comparison’ days are defined as the days a week before or after the index days if the daily mean PM10 concentration of those days is lower than the same concentration threshold. Therefore, an index day can be paired with zero, one, or two comparison days. If an index day had zero comparison days, the set was discarded. If two comparison days were available, their average was paired with the index day. With this approach, we controlled for the confounding effects caused by weekly cycles, seasonal variation, annual trends, and other meteorological conditions, such as temperature. Holidays were screened to remove the weekly cycle properly. As this data sampling process normalizes the data, the differences of subways passengers between index days and comparison days represent the none-routine portion of the total subway passengers and are compared with the outdoor activity defined earlier (i.e., non-routine part of total activity).
Controlling for weather conditions should be noted in more detail. Pairing data a week before and after can control for weather conditions with a longer frequency (e.g., annual variation). However, short-term variation (e.g., daily variation) is not completely separated because these short-term weather conditions are strongly tied to PM10 concentration, as discussed later. Precipitation, however, is too critical for PM10 concentration. Hence, we utilized a rain flag (i.e., ’rain’ or ’no rain’) to compare index days with comparison days under the same precipitation conditions to reduce noise effects.

2.2.2. High and Low Public Awareness Periods

While the surface PM10 concentration level in South Korea was high in the early 2000s, it has drawn little public attention until recent years. People used to consider severe haze cases to be a part of the Asian dust phenomenon, and few paid serious attention to aerosols with anthropogenic sources. The main trigger for the sudden increase in public interest and concern about the PM level was the announcement of the World Health Organization (WHO) in October 2013 that PM is a cancer-causing agent. The International Agency for Research on Cancer (IARC), a part of the WHO, has classified outdoor air quality as a carcinogenic substance, along with previously reported substances including diesel engine exhaust emissions, solvents, metals, and dust. In its evaluation, the IARC concluded that outdoor air pollution may cause lung or bladder cancer. Figure 1 shows the time series of monthly PM10 concentration in Seoul, along with Google’s SVI and the number of articles on PM during 2008–2016. Although PM10 concentration in Seoul was high in the early years, there are few search volumes or news articles until October 2013. However, both search volume and the number of news articles escalated after November 2013. For further analysis, we defined two periods of public awareness of PM before and after November 2013: The low public awareness (January 2008 to October 2013) and the high public awareness (November 2013 to December 2016).

3. Results

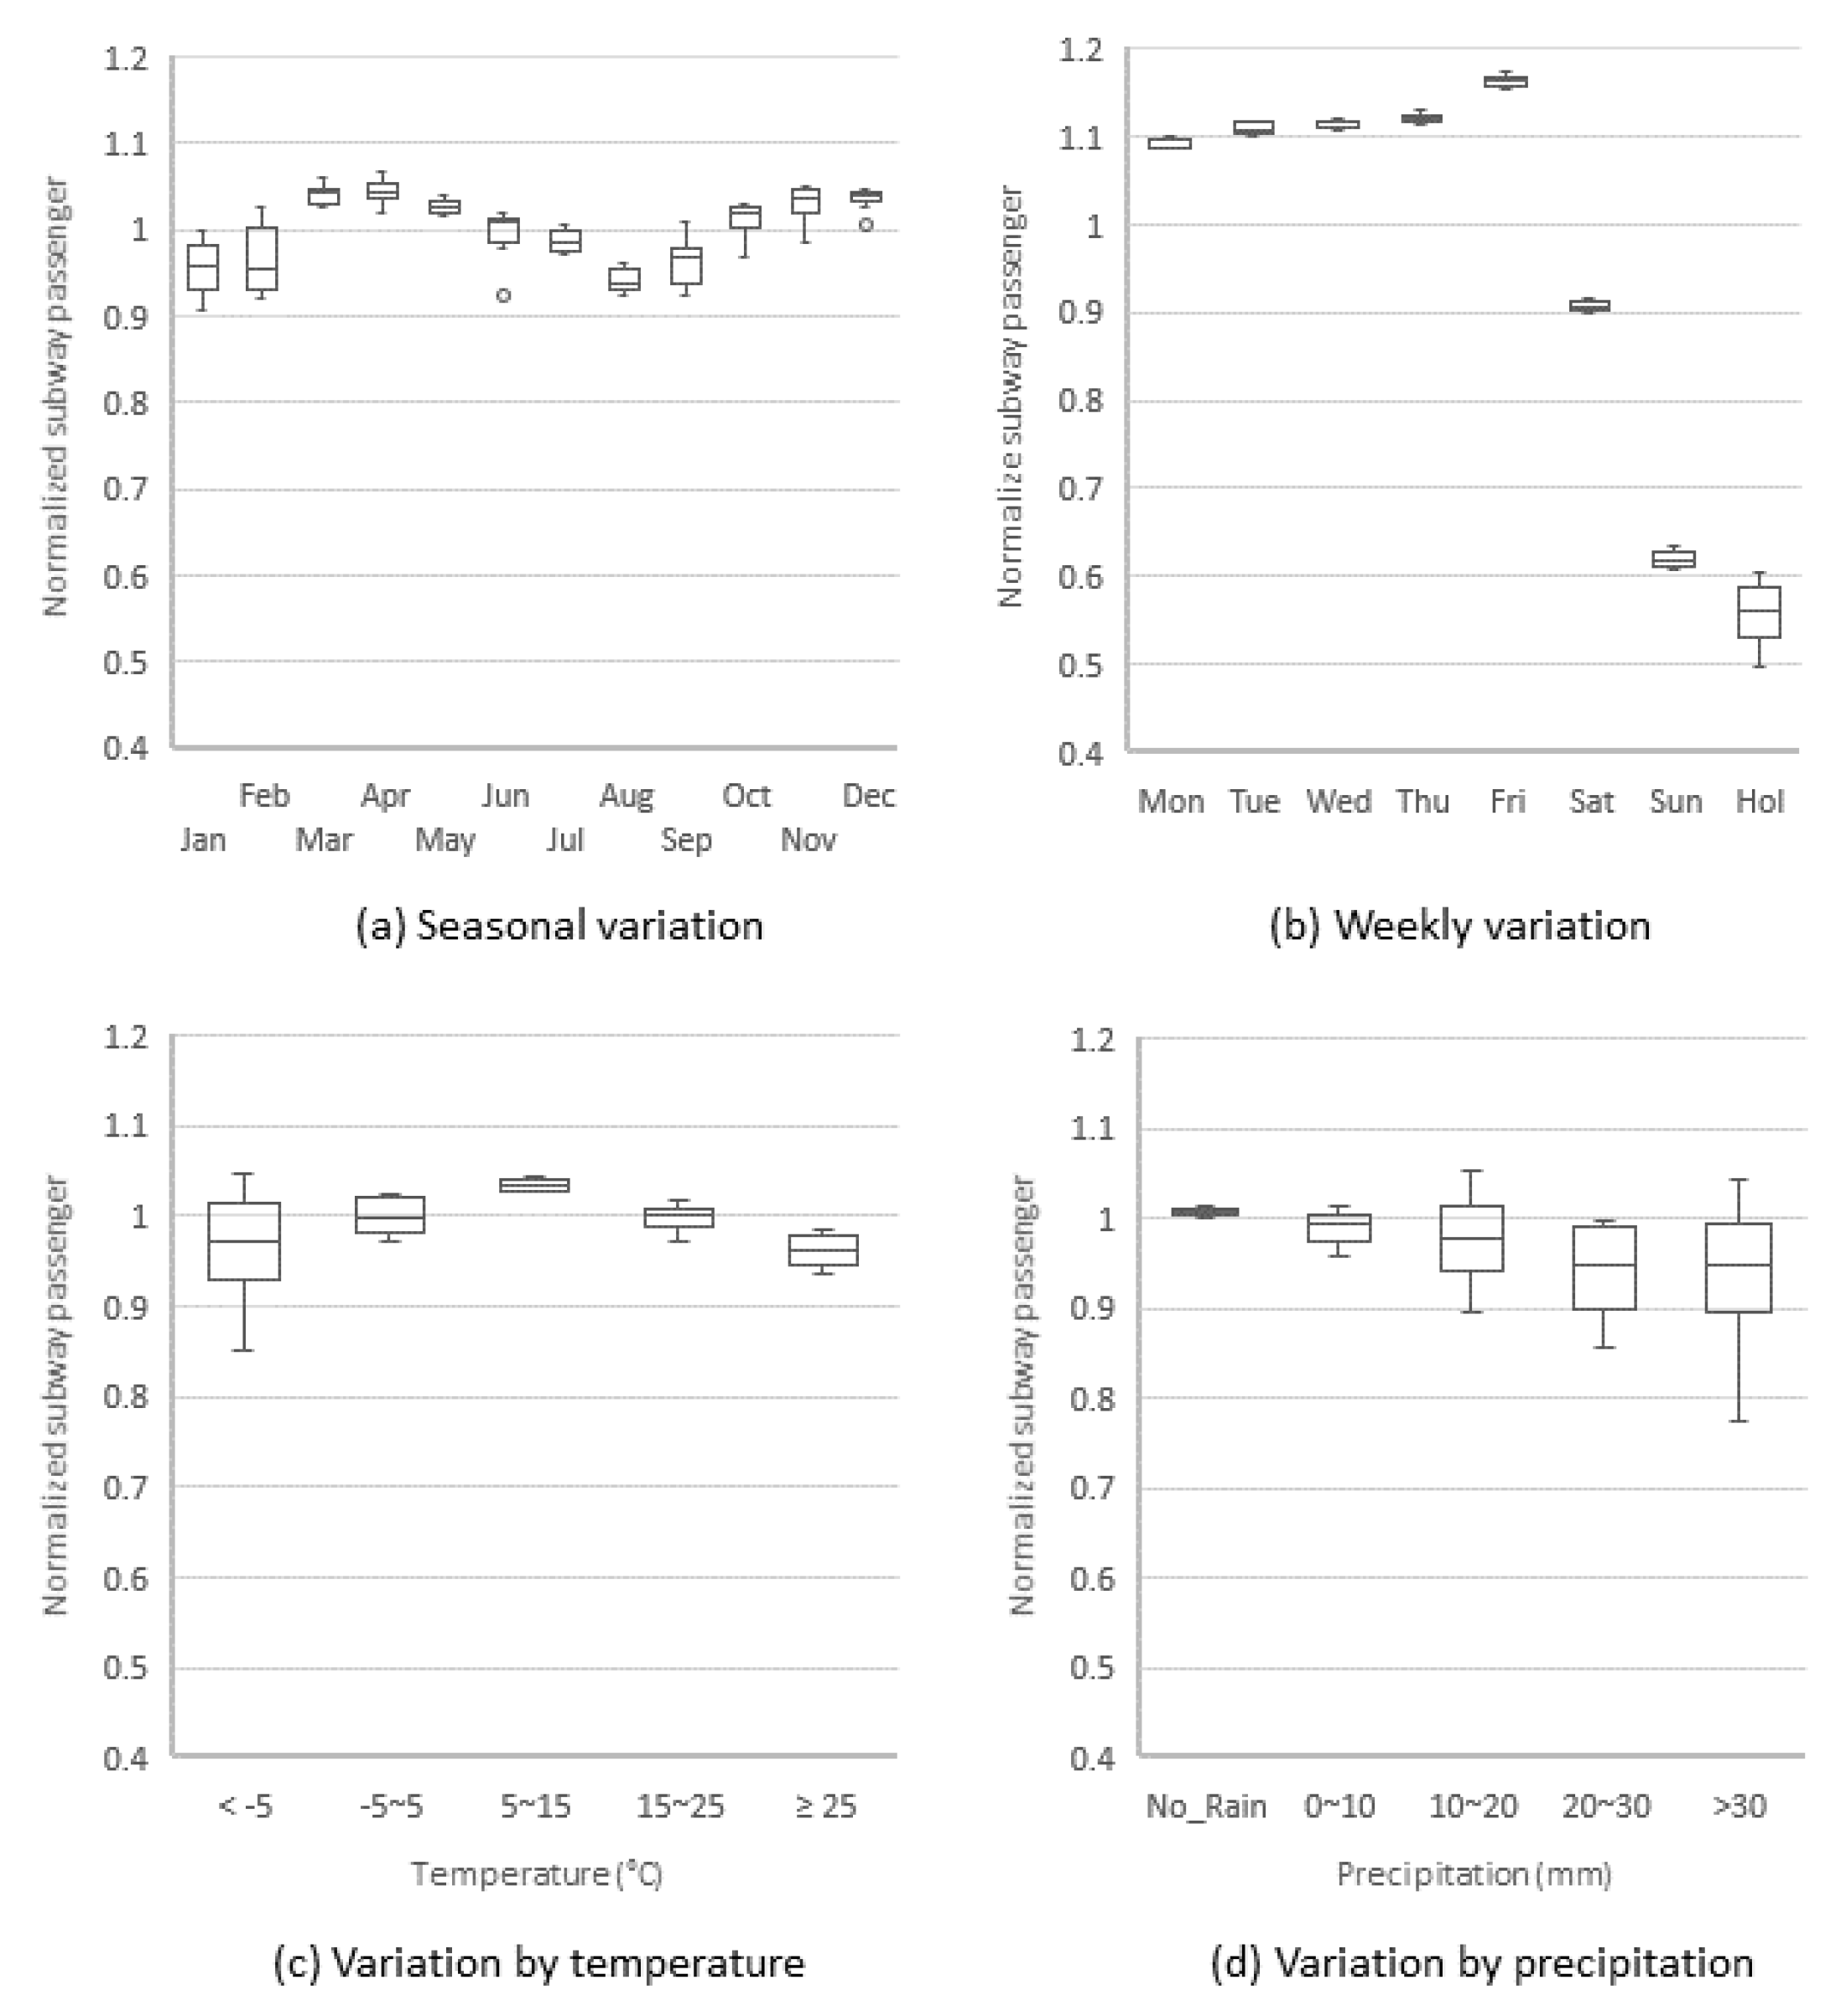
3.1. Environmental Variables and Outdoor Activity

We first analyzed the change in the number of subway passengers according to the environmental variables (e.g., temperature, precipitation, and PM concentration) and temporal variations (e.g., seasonal and weekly variations). Since the outdoor activity level in Seoul, Korea showed a gradually increasing trend, we removed the annual trend by normalizing with the annual average. The data on subway passengers were transformed into a normalized subway passenger (nSP) value for each of the seasonal and environmental factors to avoid the effect of an increasing trend over time. n S P i j , the index value of factor level i in year j, is defined as follows:
n S P i j =   S P i j /   S P ¯ j
where S P i j is the average number of daily subway passengers for factor level i in year j and S P ¯ j is the average number in year j. For instance, if we were to inspect the effect of month, the index value for month i in year j would be calculated by dividing the average number of daily subway passengers for month i in year j ( S P i j ) by the daily average number in year j ( S P ¯ j ) for every i = 1, 2, …, 12 and j = 2008, 2009, …, 2016.
The number of subway passengers differed according to the time of year (e.g., month and day of the week). Figure 2a shows the boxplot of the nSP values for each month. Monthly seasonality presents a low level of outdoor activities in January, February, and August, which implies people aim to avoid extreme heat or cold. On the contrary, the level of outdoor activity is high in spring (e.g., March to May) and autumn (e.g., October and November) when fine weather is expected. December, although already in the cold season, also has high activity patterns because it includes the end-of-year holiday season. The weekly variation in outdoor activities is apparent in Figure 2b. nSPs are high during weekdays, with the highest ratios on Friday, and low during weekends, showing the lowest frequencies on Sundays and holidays.
Weather conditions had modest but significant effects on the number of daily subway passengers (Figure 2c,d). On days with a daily mean temperature of 5–15 °C (41–59 °F), the nSPs are the highest. For each 10 °C bin, the outdoor activity nSPs change by around 3%–4% per 10 °C temperature change. As expected, nSPs are high on no rain days and tend to decrease as the amount of precipitation increases. Moreover, nSPs also seem to be spread widely for higher precipitation, implying higher uncertainty in predicting patterns of subway passenger counts in high precipitation conditions.
The comparison of PM10 concentration with nSPs reveals an interesting correlation between PM10 concentration and activity. Figure 3 shows the nSPs and the detrended number of daily subway passengers according to PM10 concentration. Four concentration intervals are set to the four stages of the AQI. Unlike initial expectations, the nSPs have a positive correlation with PM10 concentration. The number of daily subway passengers is the lowest in the ’good’ stage and increases as the AQI moves toward the ’moderate’ and ’unhealthy’ stages. The mean of the nSPs for the ’very unhealthy’ condition is slightly lower than that in the ’unhealthy’ case, whereas it has a wider spread of values with more extreme cases either higher or lower than the values in the ’unhealthy’ stage. This result is intuitive if we consider the high correlation between synoptic weather and pollution level [33,34,35,36,37]. High PM concentration events tend to happen in anticyclonic weather conditions, under which we typically have a warmer temperature, higher surface pressure, calm and stagnant wind velocity, and less or no precipitation. Therefore, we cannot directly conclude that there is a positive correlation between PM10 concentration and outdoor activities (Figure 3) because the effects of weather and pollution might be combined. People seem to determine their outdoor activities primarily on the basis of the weather conditions as far as the air quality is good or moderate. However, when the air pollution becomes severe, the air quality level becomes a deciding factor for one’s outdoor decision.

3.2. Weather and Pollution Effects on Activity

To examine the activity–pollution correlation more carefully, a series of paired t-tests were designed and conducted. As described in the Method Section, the index days and comparison days were selected to examine the sensitivity of PM10 concentration to the number of subway passengers. Conceptually, index days mean relatively polluted conditions compared with comparison days. If the number of subway passengers is lower on index days than on comparison days, this can be interpreted as the pollution level discouraging people from going outside.
Figure 4 and Table 1 compare the number of subway passengers according to the index days and comparison days as well as their p-values from the paired t-tests. PM10 concentration on the x-axis denotes the PM10 concentration thresholds used to define each index day. It is notable that the number of subway passengers on index and comparison days tend to diverge as PM10 threshold levels become either extremely low or high. When the PM10 threshold is lower than 90 μg/m3, the subway passenger counts are higher on index days than on comparison days. This pattern is the opposite for the PM10 threshold higher than 90 μg/m3.
This result is consistent with the activity–pollution correlation shown in Figure 3, implying the potential role of weather in promoting outdoor activities in less polluted conditions. As we addressed earlier, pairing data with ±7 days can control for annual variations in meteorology, but this approach still contains signals from daily variations in weather conditions. In most cases, the weather conditions on index days are warmer and less windy than on comparison days (see Supplementary Materials Figure S2). As aforementioned, this result confirms our inference that two main factors (i.e., weather and pollution) determine outdoor activities. Thus, we named the region above PM10 90 μg/m3 as the ’pollution-considered zone’ and the region below that level as the ’weather-considered zone’ (Figure 3).
The p-values in Table 1 also confirm the pattern of two-tailed decision making. Below the 90 μg/m3 PM10 threshold, the difference between index days and comparison days is statistically significant (p < 0.05), implying the role of weather conditions in people’s decisions to participate in outdoor activities. Over the 130 μg/m3 PM10 threshold, the difference between index days and comparison days is statistically significant at the p = 0.1 level, implying people tend to avoid going out when PM pollution is high.

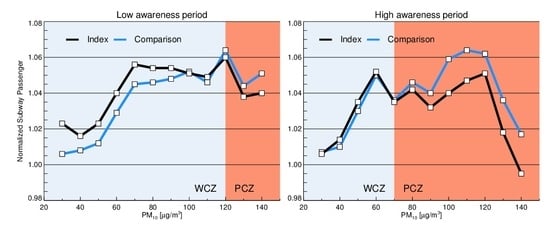
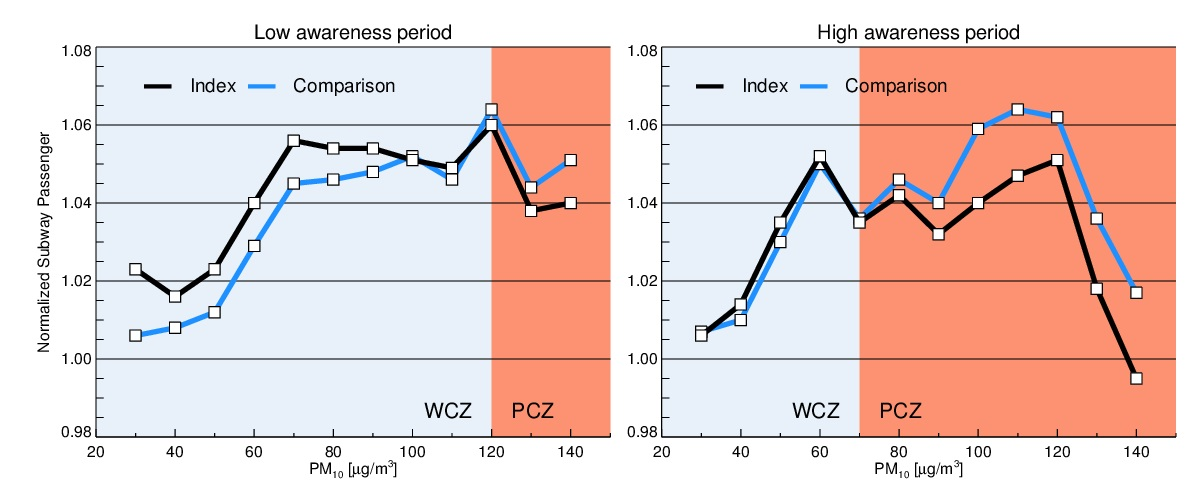
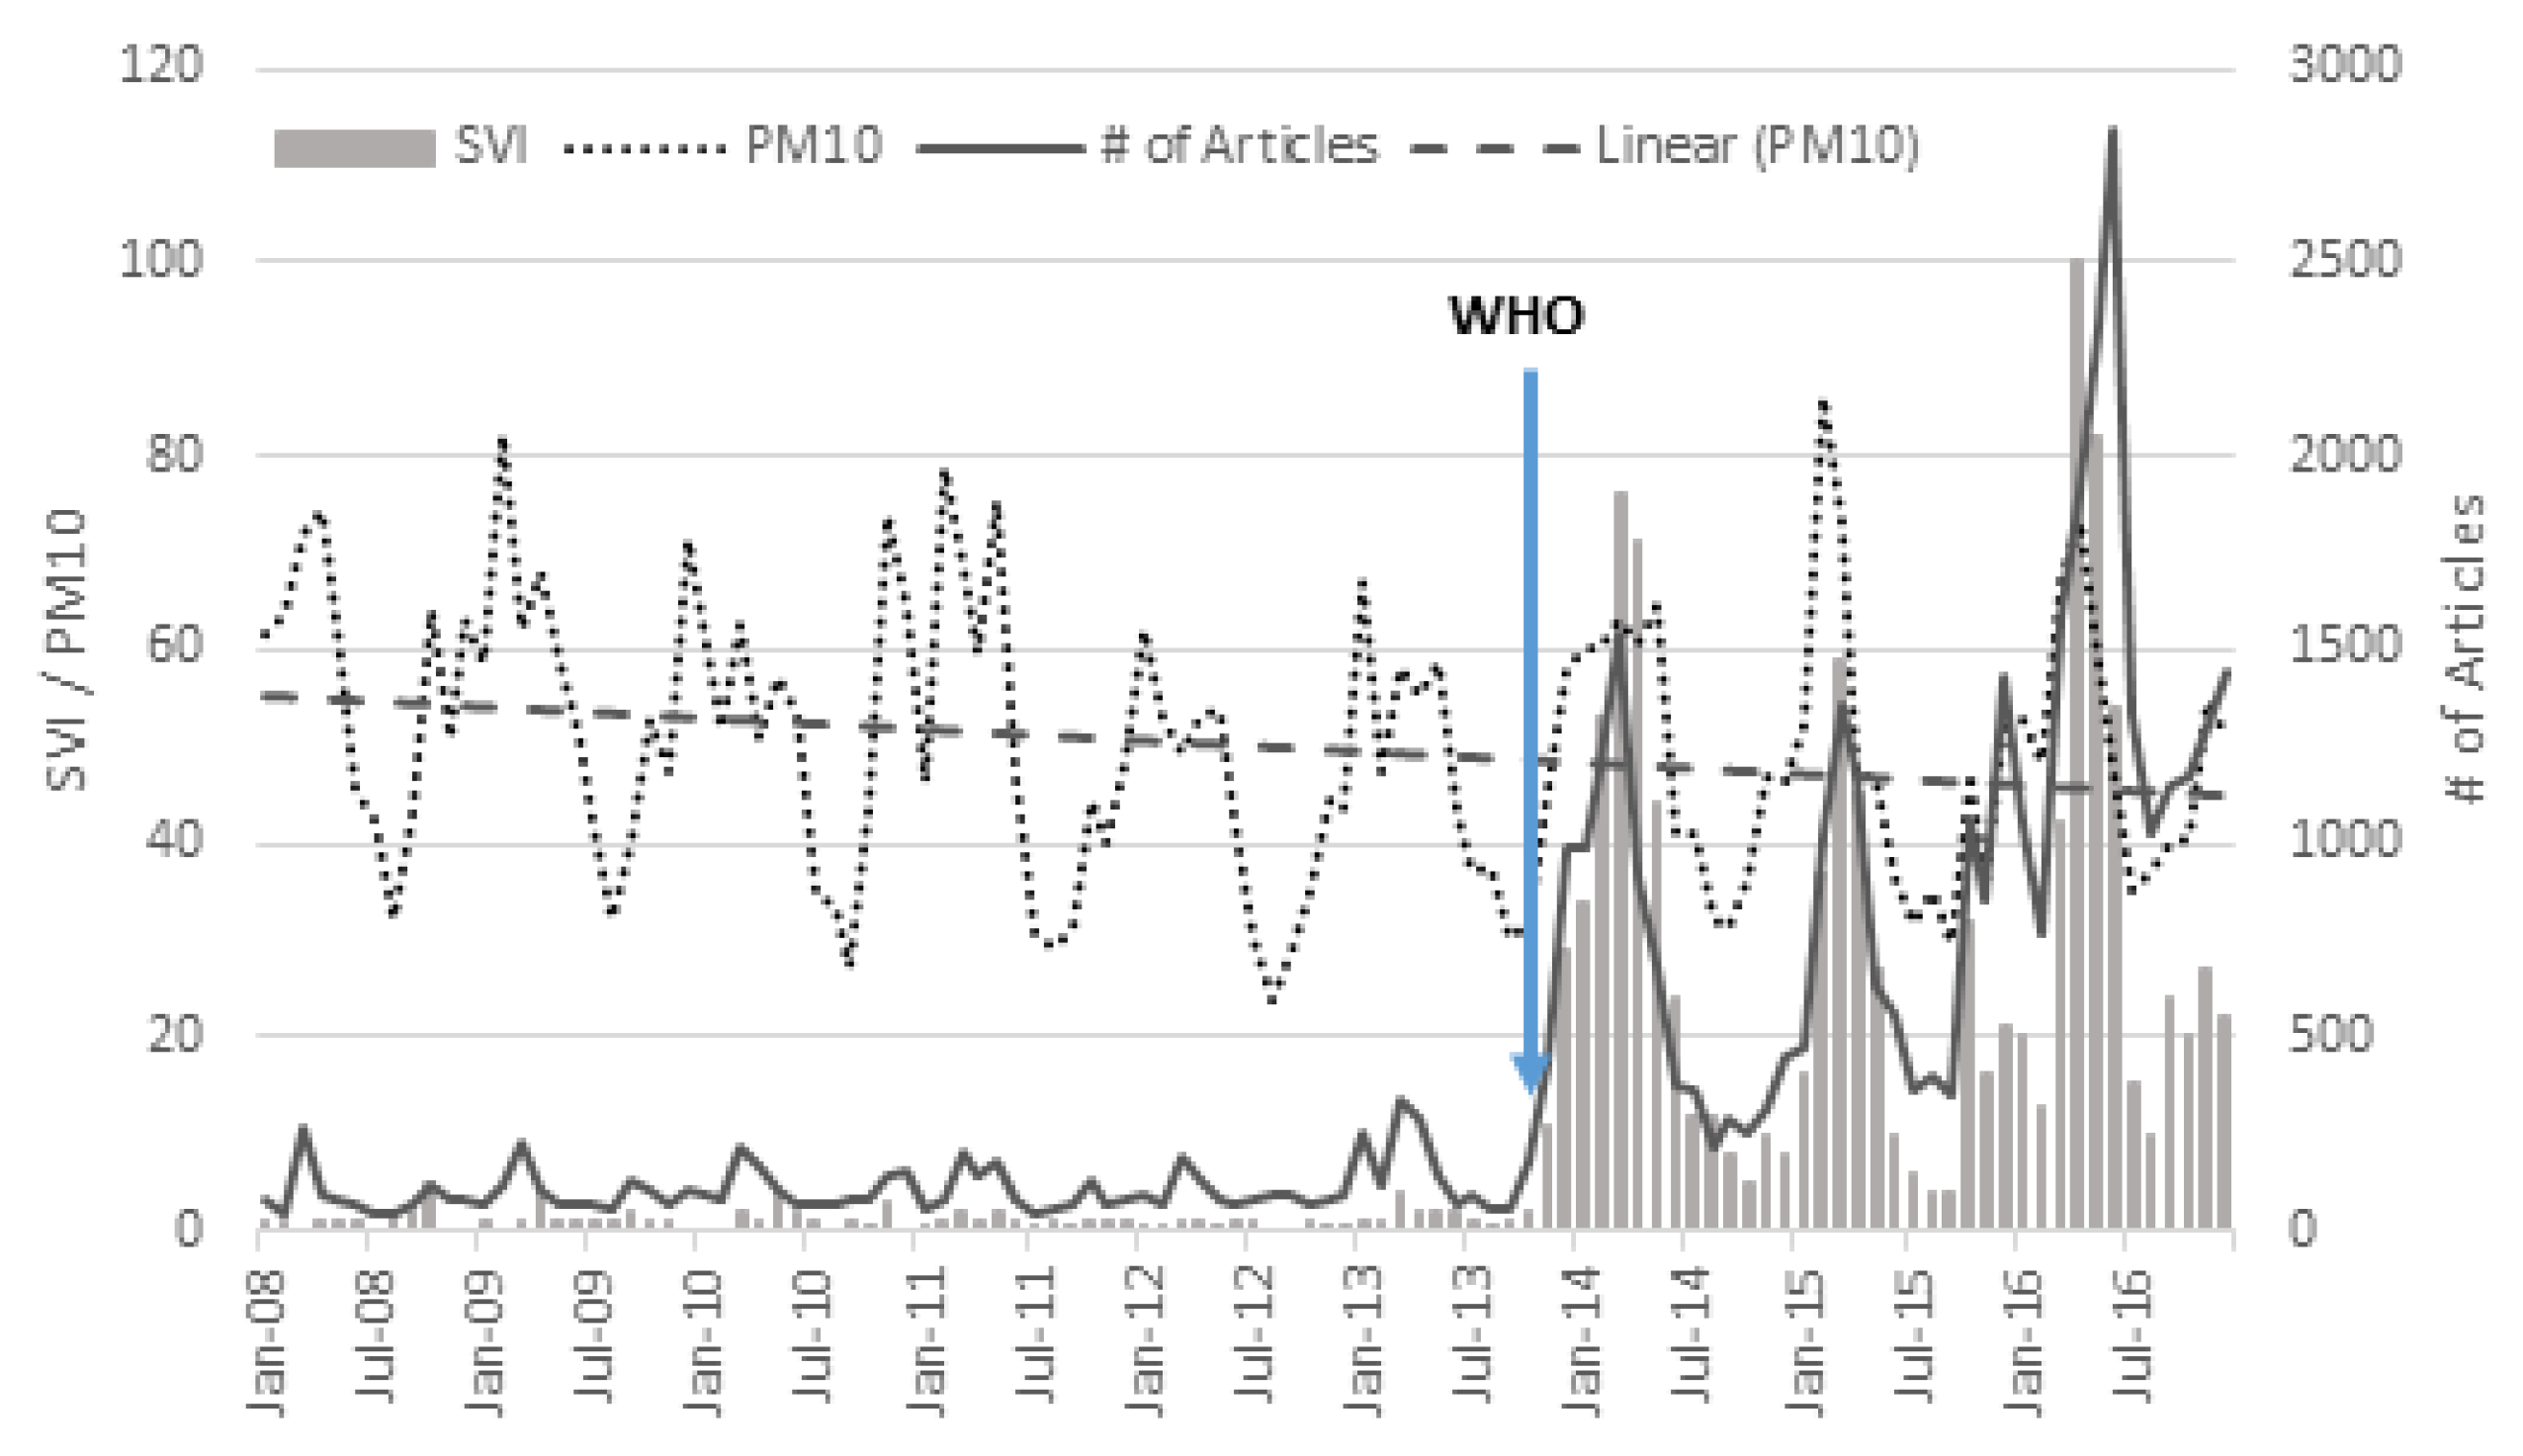
3.3. Effect of Public Awareness

Public interest in PM can be clearly shown in the monthly trend of Google’s SVI on ’particulate matter’ and the number of news articles (Figure 1). While the annual level of surface PM10 concentration in South Korea has declined continuously since 2008, the monthly search volume and number of news articles suddenly increased after November 2013. Moreover, since then, the correlation between the monthly SVI and monthly PM10 concentration had increased rapidly. The Pearson correlation between PM10 concentration and the SVI showed a clear increase, changing from 0.196 before November 2013 to 0.725 thereafter.
We analyzed the impact of this increased public interest in PM on the actual pattern of public outdoor activities. We separated the data into two periods, namely before and after November 2013 when public interest in PM dramatically increased, which we defined as low and high awareness periods. We applied the same paired t-test analysis between index and comparison days, as explained in the analysis Methods Section, and the results are presented in Figure 5 and Table 2.
In the low public awareness period (Figure 5a), the number of subway passengers on index days is significantly higher than the number on comparison days, implying that weather conditions are a factor in people’s decisions to participate in outdoor activities. During the low public awareness period, people seem to refer to the pollution level for their outdoor activity decisions only when PM10 concentration is higher than 120 μg/m3, although we cannot confirm its significance.
Interestingly, this pattern changed dramatically after November 2013 (Figure 5b). In the high public awareness period, the threshold for differentiating between the weather-considered zone and pollution-considered zone shifted significantly to the level of PM10 70 μg/m3. The number of subway passengers on index days is almost the same as or slightly higher than the number on comparison days in the weather-considered zone, whereas it is significantly lower in the pollution-considered zone over 70 μg/m3. Thus, it is evident that people began to use pollution information as a way to decide on their outdoor activities to avoid potential adverse health effects.
Lastly, Figure 6 shows the percentage change in the number of subway passengers on index days against comparison days in the ’moderate’ and ’unhealthy’ stages during the low and high awareness periods. People’s decision-making pattern for outdoor activities has clearly changed. People used to consider the weather conditions rather than the pollution factor in the ’moderate’ PM condition in the low public awareness period. However, in the high awareness period, people began to consider both weather and pollution factors in the ’moderate’ pollution condition and consider the pollution factor four to five times more seriously in the high awareness period, deciding not to go outside when they perceived high pollution. This result clearly shows the effectiveness of pollution-related information in the decision making of megacity residents on whether to participate in outdoor activities. Finally, further studies to investigate if this behavior change resulted in the actual exposal reduction and health impact improvement are warranted in the future.

4. Conclusions

Air pollution has become a pressing priority of environmental, economic, and health problems globally. Recent studies have documented the harmful health effects of particle pollution exposure. Countries and regulatory agencies have developed air quality guidelines and proper monitoring systems to mitigate the harmful effects by minimizing public exposure to unhealthy air pollution. However, our understanding of outdoor activity patterns influenced by outdoor air pollution has been limited. The objective of this study was to enhance our understanding by investigating the effect of PM, a major component of air pollution, on public outdoor activities using empirical data on PM10 levels and the daily volume of subway passengers recorded for 2008–2016.
The key findings of this study are as follows. First, the level of PM tends to suppress public outdoor activities in polluted conditions, implying that people react to avoid such a hazardous environment. Combined with the traditional explanation of weather–activity relations, we conclude that people consider weather conditions when deciding on outdoor activities in less polluted conditions, while the pollution level is more important in their decision in more polluted conditions. Second, public awareness of PM has shifted the sensitivity of people’s responses for the frequency of going out. Since November 2013, when public awareness became higher, external activities have decreased significantly in a PM10 range over 70 μg/m3, which used to be much higher (i.e., 120 μg/m3) in low public awareness. Third, the shift of activity is statistically significant in the ’unhealthy’ stage (80 < PM10 < = 150 μg/m3), suggesting that people’s reactions may reflect the stages of the AQI provided by the government. This fact implies that the AQI intervals should be determined carefully based on actual epidemiological research.
To conclude, this study demonstrates that public interest in PM is a major factor affecting people’s decisions to participate in outdoor activities rather than PM10 concentration itself. Hence, timely and accurate information on pollution is as important as emission control efforts in reducing public exposure to harmful environments.

Supplementary Materials

The following are available online at https://www.mdpi.com/2071-1050/12/3/820/s1, Figure S1: Spatial distribution of annual mean surface PM10 concentration over South Korea (left) and Seoul Metropolitan Area. Thick black line indicates the administrative boundary of Seoul. Figure S2: Daily mean temperatures (upper) and daily mean wind speed (lower) on index and comparison days during 2008–2016.

Author Contributions

Conceptualization, K.-K.L. and H.C.K.; Formal analysis, K.-K.L.; Methodology, K.-K.L.; Writing—original draft, K.-K.L. and H.C.K.; Writing—review & editing, Y.P. and S.-P.H. All authors have read and agreed to the published version of the manuscript.

Funding

This research received no external funding.

Conflicts of Interest

The authors declare no conflict of interest.

References

  1. Huang, R.-J.; Zhang, Y.; Bozzetti, C.; Ho, K.-F.; Cao, J.-J.; Han, Y.; Daellenbach, K.R.; Slowik, J.G.; Platt, S.M.; Canonaco, F.; et al. High secondary aerosol contribution to particulate pollution during haze events in China. Nature 2014, 514, 218–222. [Google Scholar] [CrossRef] [PubMed] [Green Version]
  2. Kim, B.-U.; Kim, O.; Kim, H.C.; Kim, S. Influence of fossil-fuel power plant emissions on the surface fine particulate matter in the Seoul Capital Area, South Korea. J. Air Waste Manag. Assoc. 2016, 66, 863–873. [Google Scholar] [CrossRef] [PubMed] [Green Version]
  3. Lighty, J.S.; Veranth, J.M.; Sarofim, A.F. Combustion Aerosols: Factors Governing Their Size and Composition and Implications to Human Health. J. Air Waste Manag. Assoc. 2000, 50, 1565–1618. [Google Scholar] [CrossRef] [PubMed]
  4. Simoneit, B.R. Biomass burning—A review of organic tracers for smoke from incomplete combustion. Appl. Geochem. 2002, 17, 129–162. [Google Scholar] [CrossRef]
  5. Lelieveld, J.; Evans, J.S.; Fnais, M.; Giannadaki, D.; Pozzer, A. The contribution of outdoor air pollution sources to premature mortality on a global scale. Nature 2015, 525, 367–371. [Google Scholar] [CrossRef]
  6. Pope, C.A.; Ezzati, M.; Dockery, D.W. Fine-particulate air pollution and life expectancy in the United States. N. Engl. J. Med. 2009, 360, 376–386. [Google Scholar] [CrossRef] [Green Version]
  7. Pope, C.A.; Dockery, D.W. Health Effects of Fine Particulate Air Pollution: Lines that Connect. J. Air Waste Manag. Assoc. 2006, 56, 709–742. [Google Scholar] [CrossRef]
  8. Kim, K.-H.; Kabir, E.; Kabir, S. A review on the human health impact of airborne particulate matter. Environ. Int. 2015, 74, 136–143. [Google Scholar] [CrossRef]
  9. Lei, Y.-C.; Chan, C.-C.; Wang, P.-Y.; Lee, C.-T.; Cheng, T.-J. Effects of Asian dust event particles on inflammation markers in peripheral blood and bronchoalveolar lavage in pulmonary hypertensive rats. Environ. Res. 2004, 95, 71–76. [Google Scholar] [CrossRef]
  10. Lee, J.-T.; Son, J.-Y.; Cho, Y.-S. A comparison of mortality related to urban air particles between periods with Asian dust days and without Asian dust days in Seoul, Korea, 2000–2004. Environ. Res. 2007, 105, 409–413. [Google Scholar] [CrossRef]
  11. Lee, J.-W.; Lee, K.-K. Effects of Asian dust events on daily asthma patients in Seoul, Korea. Meteorol. Appl. 2014, 21, 202–209. [Google Scholar] [CrossRef]
  12. Hong, Y.-C.; Pan, X.-C.; Kim, S.-Y.; Park, K.; Park, E.-J.; Jin, X.; Yi, S.-M.; Kim, Y.-H.; Park, C.-H.; Song, S.; et al. Asian Dust Storm and pulmonary function of school children in Seoul. Sci. Total Environ. 2010, 408, 754–759. [Google Scholar] [CrossRef] [PubMed]
  13. Meng, Z.; Lu, B. Dust events as a risk factor for daily hospitalization for respiratory and cardiovascular diseases in Minqin, China. Atmos. Environ. 2007, 41, 7048–7058. [Google Scholar] [CrossRef]
  14. Middleton, N.; Yiallouros, P.; Kleanthous, S.; Kolokotroni, O.; Schwartz, J.; Dockery, D.W.; Demokritou, P.; Koutrakis, P. A 10-year time-series analysis of respiratory and cardiovascular morbidity in Nicosia, Cyprus: The effect of short-term changes in air pollution and dust storms. Environ. Health 2008, 7, 39. [Google Scholar] [CrossRef] [PubMed] [Green Version]
  15. Yang, C.; Chen, Y.; Chiu, H.; Goggins, W.B. Effects of Asian dust storm events on daily stroke admissions in Taipei, Taiwan. Environ. Res. 2005, 99, 79–84. [Google Scholar] [CrossRef]
  16. Jung, E.M.; Kim, H.S.; Park, H.; Ye, S.; Lee, D.; Ha, E.H. Does exposure to PM 10 decrease age at menarche? Environ. Int. 2018, 117, 16–21. [Google Scholar] [CrossRef]
  17. Kim, H.C.; Kim, E.; Bae, C.; Cho, J.H.; Kim, B.-U.; Kim, S. Regional contributions to particulate matter concentration in the Seoul metropolitan area, South Korea: Seasonal variation and sensitivity to meteorology and emissions inventory. Atmos. Chem. Phys. 2017, 17, 10315–10332. [Google Scholar] [CrossRef] [Green Version]
  18. Kim, Y.P.; Lee, G. Trend of Air Quality in Seoul: Policy and Science. Aerosol Air Qual. Res. 2018, 18, 2141–2156. [Google Scholar] [CrossRef] [Green Version]
  19. Kim, H.C.; Kim, S.; Kim, B.-U.; Jin, C.-S.; Hong, S.; Park, R.; Son, S.-W.; Bae, C.; Bae, M.; Song, C.-K.; et al. Recent increase of surface particulate matter concentrations in the Seoul Metropolitan Area, Korea. Sci. Rep. 2017, 7, 4710. [Google Scholar] [CrossRef] [Green Version]
  20. Chang, L.-S.; Cho, A.; Park, H.; Nam, K.; Kim, D.; Hong, J.-H.; Song, C.-K. Human-model hybrid Korean air quality forecasting system. J. Air Waste Manag. Assoc. 2016, 66, 896–911. [Google Scholar] [CrossRef] [Green Version]
  21. Wang, S.X.; Zhao, B.; Cai, S.Y.; Klimont, Z.; Nielsen, C.P.; Morikawa, T.; Woo, J.H.; Kim, Y.; Fu, X.; Xu, J.Y.; et al. Emission trends and mitigation options for air pollutants in East Asia. Atmos. Chem. Phys. 2014, 14, 6571–6603. [Google Scholar] [CrossRef] [Green Version]
  22. Zheng, B.; Tong, D.; Li, M.; Liu, F.; Hong, C.; Geng, G.; Li, H.; Li, X.; Peng, L.; Qi, J.; et al. Trends in China’s anthropogenic emissions since 2010 as the consequence of clean air actions. Atmos. Chem. Phys. 2018, 18, 14095–14111. [Google Scholar] [CrossRef] [Green Version]
  23. Krotkov, N.A.; McLinden, C.A.; Li, C.; Lamsal, L.N.; Celarier, E.A.; Marchenko, S.V.; Swartz, W.H.; Bucsela, E.J.; Joiner, J.; Duncan, B.N.; et al. Aura OMI observations of regional SO 2 and NO 2 pollution changes from 2005 to 2015. Atmos. Chem. Phys. 2016, 16, 4605–4629. [Google Scholar] [CrossRef] [Green Version]
  24. Pivarnik, J.M.; Reeves, M.J.; Rafferty, A.P. Seasonal Variation in Adult Leisure-Time Physical Activity. Med. Sci. Sport Exerc. 2003, 35, 1004–1008. [Google Scholar] [CrossRef]
  25. Plasqui, G.; Westerterp, K.R. Seasonal Variation in Total Energy Expenditure and Physical Activity in Dutch Young Adults. Obes. Res. 2004, 12, 688–694. [Google Scholar] [CrossRef] [Green Version]
  26. Tucker, P.; Gilliland, J. The effect of season and weather on physical activity: A systematic review. Public Health 2007, 121, 909–922. [Google Scholar] [CrossRef]
  27. Bélanger, M.; Gray-Donald, K.; O’loughlin, J.; Paradis, G.; Hanley, J. Influence of Weather Conditions and Season on Physical Activity in Adolescents. Ann. Epidemiol. 2009, 19, 180–186. [Google Scholar] [CrossRef]
  28. Keiser, D.; Lade, G.; Rudik, I. Air pollution and visitation at U.S. national parks. Sci. Adv. 2018, 4, eaat1613. [Google Scholar] [CrossRef] [Green Version]
  29. Wen, X.-J.; Balluz, L.; Mokdad, A. Association Between Media Alerts of Air Quality Index and Change of Outdoor Activity Among Adult Asthma in Six States, BRFSS, 2005. J. Community Health 2009, 34, 40–46. [Google Scholar] [CrossRef]
  30. Shin, S.E.; Jung, C.H.; Kim, Y.P. Analysis of the measurement difference for the PM 10 concentrations between beta-ray absorption and gravimetric methods at gosan. Aerosol Air Qual. Res. 2011, 11, 846–853. [Google Scholar] [CrossRef] [Green Version]
  31. Carneiro, H.A.; Mylonakis, E. Google Trends: A Web-Based Tool for Real-Time Surveillance of Disease Outbreaks. Clin. Infect. Dis. 2009, 49, 1557–1564. [Google Scholar] [CrossRef]
  32. Bateson, T.F.; Schwartz, J. Control for Seasonal Variation and Time Trend in Case-Crossover Studies of Acute Effects of Environmental Exposures. Epidemiology 1999, 10, 539–544. [Google Scholar] [CrossRef] [PubMed]
  33. Liu, X.G.; Li, J.; Qu, Y.; Han, T.; Hou, L.; Gu, J.; Chen, C.; Yang, Y.; Liu, X.; Yang, T.; et al. Formation and evolution mechanism of regional haze: A case study in the megacity Beijing, China. Atmos. Chem. Phys. 2013, 13, 4501–4514. [Google Scholar] [CrossRef] [Green Version]
  34. Kallos, G.; Kassomenos, P.; Pielke, R.A. Synoptic and mesoscale weather conditions during air pollution episodes in Athens, Greece. Bound. Layer Meteorol. 1993, 62, 163–184. [Google Scholar] [CrossRef]
  35. Hamburger, T.; McMeeking, G.; Minikin, A.; Birmili, W.; Dall’Osto, M.; O’Dowd, C.; Flentje, H.; Henzing, B.; Junninen, H.; Kristensson, A.; et al. Overview of the synoptic and pollution situation over Europe during the EUCAARI-LONGREX field campaign. Atmos. Chem. Phys. 2011, 11, 1065–1082. [Google Scholar] [CrossRef] [Green Version]
  36. Liao, Z.; Gao, M.; Sun, J.; Fan, S. The impact of synoptic circulation on air quality and pollution-related human health in the Yangtze River Delta region. Sci. Total Environ. 2017, 607, 838–846. [Google Scholar] [CrossRef]
  37. Lin, J.-T.T.; McElroy, M.B. Impacts of boundary layer mixing on pollutant vertical profiles in the lower troposphere: Implications to satellite remote sensing. Atmos. Environ. 2010, 44, 1726–1739. [Google Scholar] [CrossRef]
Figure 1. Time series of monthly PM10 concentration in Seoul, Google’s SVI, and the number of articles on ’particulate matter’ during 2008–2016. ’WHO’ denotes the date of the announcement of PM as a carcinogenic substance (17 October 2013).
Sustainability 12 00820 g001
Figure 2. Variations in the subway passenger index responding to temporal and meteorological conditions during 2008–2016. (a) Seasonal, (b) weekly, (c) by temperature, and (d) by precipitation.
Sustainability 12 00820 g002
Figure 3. Variations in the subway passenger index according to the PM10 concentration in Seoul during 2008–2016.
Sustainability 12 00820 g003
Figure 4. Normalized subway passengers on index and comparison days during 2008–2016.
Sustainability 12 00820 g004
Figure 5. Normalized subway passengers on index and comparison days during (a) the low public awareness period (January 2008 to October 2013 and (b) the high public awareness period (November 2013 to December 2016). ’WCZ’ and ’PCZ’ denote the ’weather-considered zone’ and ’pollution-considered zone’, respectively.
Sustainability 12 00820 g005
Figure 6. Percentage increase in the average number of daily subway passengers on index days for the ’moderate’ and ’unhealthy’ stages of the air quality index (AQI).
Sustainability 12 00820 g006
Table 1. Results of the pairwise t-test for daily subway passengers on index and comparison days during 2008–2016.
PM10 (µg/m3)Index DaysComparison Daysp-Value
Mean (1000)95% CIMean (1000)95% CI
306145(6038, 6252)6078(5970, 6186)0.000 **
406124(6036, 6212)6084(5997, 6171)0.003 **
506185(6104, 6266)6133(6054, 6212)0.000 **
606281(6198, 6364)6233(6151, 6315)0.000 **
706309(6212, 6406)6267(6172, 6362)0.006 **
806317(6204, 6430)6291(6180, 6402)0.046 **
906298(6163, 6433)6289(6179, 6418)0.336
1006301(6145, 6457)6339(6206, 6472)0.198
1106307(6130, 6484)6329(6169, 6489)0.241
1206351(6151, 6551)6383(6201, 6565)0.159
1306192(5927, 6457)6247(6006, 6488)0.091 *
1406178(5869, 6487)6262(5989, 6535)0.053 *
* Significant at the 0.10 level, ** significant at the 0.05 level, CI: Confidence interval.
Table 2. Statistics of the pairwise t-test for daily subway passengers on index and comparison days during the low public awareness period (January 2008 to October 2013) and high public awareness period (November 2013 to December 2016).
PM10 (µg/m3)Low Awareness PeriodHigh Awareness Period
95% CI on Index Days (1000)95% CI on Comparison Days (1000)p-Value95% CI on Index Days (1000)95% CI on Comparison Days (1000)p-Value
306155 ± 1346050 ± 1360.000 **6126 ± 1806129 ± 1770.451
406103 ± 1126057 ± 1090.009 **6158 ± 1436130 ± 1430.082 *
506135 ± 1026071 ± 1010.000 **6277 ± 1306246 ± 1250.080 *
606227 ± 1026164 ± 1020.000 **6389 ± 1416375 ± 1350.244
706321 ± 1136256 ± 1130.001 **6282 ± 1836287 ± 1750.420
806312 ± 1346262 ± 1340.009 **6328 ± 2066352 ± 2010.070 *
906305 ± 1576269 ± 1550.074 *6284 ± 2616333 ± 2340.092 *
1006280 ± 1856283 ± 1610.4816344 ± 2916456 ± 2350.063 *
1106264 ± 2096251 ± 2010.3526405 ± 3326509 ± 2550.058 *
1206328 ± 2316349 ± 2120.2996422 ± 4126487 ± 3570.073 *
1306187 ± 3076225 ± 2820.2286208 ± 5436315 ± 4750.032 **
1406216 ± 3626284 ± 3210.1616072 ± 6216203 ± 5460.025 **
* Significant at the 0.10 level, ** significant at the 0.05 level, CI: Confidence interval.

