Article

Research on the Relationship between the Individual Characteristics of Electric Bike Riders and Illegal Speeding Behavior: A Questionnaire-Based Study

1
School of Traffic and Transportation, Lanzhou Jiaotong University, Lanzhou 730070, China
2
College of Transportation Engineering, Tongji University, Shanghai 200092, China
3
Intelligent Transport System (ITS) R & D Center, Shanghai Urban Construction Design and Research Institute (Group) Co., Ltd., Shanghai 200125, China
*
Authors to whom correspondence should be addressed.
Sustainability 2020, 12(3), 799; https://doi.org/10.3390/su12030799
Submission received: 17 December 2019 / Revised: 17 January 2020 / Accepted: 20 January 2020 / Published: 21 January 2020
(This article belongs to the Special Issue Sustainable Urban Transport Policy in the Context of New Mobility)

Abstract

:
To examine the relationship between electric bike riders’ individual characteristics and their riding speed, this paper obtained 350 valid survey responses from e-bike riders using an on-site sampling survey method. Using the non-aggregate theory, we take the individual attributes of the rider’s age, driving age, personality, and corrective vision as potential influencing factors. The metric model of the influencing factors of the rider’s personal characteristics on riding speed is established, and we analyze the sensitivity of many influencing factors by using the theory of elasticity. The results show that the absolute value of the elasticity value corresponding to the rider’s gender, age, corrected visual acuity, and other factors is less than 1, which indicates that the above factors have no flexibility regarding the rider’s riding speed selection behavior. However, in four selection intervals, the elasticity values of the rider’s education level are 1.577, 2.484, 1.810, and 1.667; those of their driving age are −1.537, −2.061, −1.547, and −1.606, and those of their riding proficiency are 3.302, 12.038, 10.370, and 11.177, which indicate that the three factors of rider’s education level, driving age, and riding proficiency have a significant impact on the riding speed choice behavior. The finding of the study is helpful for the relevant government departments to formulate more accurate classified intervention measures, and effectively prevent the occurrence of illegal speeding behavior.

1. Introduction

The electric bicycle (e-bike) has become an important transportation choice for some urban residents to travel daily due to its advantageous lightness, fast speed, economy, flexibility, and low carbon characteristics [1,2,3,4]. However, traffic accidents associated with e-bikes are frequent. According to traffic statistics in China, the number of non-motorized vehicle accidents in 2015 and 2016 was 15,437 and 17,747, respectively, including 11,233 and 12,672 e-bike accidents [5,6]. E-bikes are fast, have no protection facilities and lack protection measures for riders. Casualties are higher for accidents with e-bikes than for those with other motor vehicles. The data show that 26.3% of deaths involving e-bikes are caused by e-bike riders, which is significantly higher than other modes of transportation other than motorcycles [7,8,9,10,11].
In response to this problem, scholars have carried out a series of studies based on the characteristics of e-bikes and accidents. For example, Wu et al. [12] used survey data to study the relationship between e-bike riders’ riding behavior and riders’ age and gender. It was found that young people and middle-aged people were more likely to run red lights than the elderly; males are more likely than females to run red lights, especially when the e-bikes used are more powerful. Schepers et al. [13] found that the number of e-bikes in the Netherlands with speeds exceeding 25 km/h is constantly increasing, but there are few impact assessments on road safety. They surveyed emergency departments at hospitals and investigated cyclists who had a traffic accident and found that the severity of e-bike accidents is much greater than that of bicycle accidents, and after limiting the age, gender, and bicycle usage of riders, e-bike riders are more likely to become involved in more serious traffic accidents. Tibor Petzoldt et al. [14] studied the differences between bicycles and e-bikes in traffic conflicts by collecting data from 80 volunteers. They found that, on the whole, there is no difference between the two in traffic conflicts, but at intersections, traffic conflicts on e-bikes are twice as numerous as those on bicycles, the riding speed of e-bikes is higher than that of bicycles when these conflicts occur, and e-bikes are more likely to be involved in a traffic accident. However, e-bikes are a new transportation group, and other road users need more time to adapt to them. Marilyn and Geoff [15] conducted an online survey of the use of e-bikes by Australians over the age of 65. They found that because elderly riders were more familiar with the use of e-bikes and the safety knowledge of e-bike riding, 84.1% of the elderly riders did not have a traffic accident related to e-bikes. Hu et al. [16] discussed the influencing factors of e-bike traffic accidents in Hefei City. The results show that riders’ age, gender, and e-bike models have significant impacts on traffic accidents. Cheng et al. [17] noted that traffic accidents caused by the personal factors of e-bike riders accounted for 91% of the total traffic accidents of e-bikes and found that the high incidence of e-bike accidents is closely related to riders’ failure to strictly obey traffic rules. Xing et al. [18] conducted a roadside observation study on the dangerous behavior of e-bike riders in a city in Anhui Province. They found that the average speed of the rider was 24 km/h in multiple time periods on one day, and 74.60% of riders had speeds greater than 20 km/ h. Based on the study of the dynamic visuals and static visuals of human vision, Wang et al. [19] examined that due to the different age and physical characteristics of the rider, as the rider’s moving field during riding, the range of view is different based on the different speeds of the vehicles; the faster the speed is, the narrower the visual field. Similarly, the illusion will also arise from the difference between the senses, which are all important factors that can cause traffic accidents. Fu [20] noted that because the speed of e-bikes is faster than that of bicycles, it is easier for riders to exhibit psychological states such as victory, competition, empathy, and independence, which make many riders prone to unsafe riding (such as speeding, running red lights, etc.). Guo et al. [21] designed a bivariate probability (BP) model to simultaneously examine the important factors associated with e-bike-related collisions and e-bike license plates and considered the correlation between them, calculating the marginal effects of contributing factors to quantify their impact on the results. The results show that e-bike riders’ gender, age, education level, driver’s license, family car, experience with e-bikes, compliance with laws, and active driving behavior have a major impact on e-bike accidents and license plate usage.
In general, many scholars have conducted many studies on the riding behavior of e-bike riders, e-bike traffic accidents and riding speed, and the research results are quite rich [22,23,24]. However, research on the relationship between the personal characteristics of e-bike riders and the choice of riding speed is not related to the measures and methods of determining the mechanisms of riding speed because behavioral characteristics are more influential on riding speed. In particular, the personal characteristics of e-bike riders vary greatly, and it is often difficult to select representative factors, creating a lack of targeted and universal measures of actual speed control. Therefore, the purpose of this study is to study the relationship between the personal characteristics of e-bike riders and their riding speed by exploring the correlation between the two in view of this, based on research on the characteristics of e-bike traffic. The correlation between personal characteristics and riding speed is obtained by a reasonable riding speed selection interval corresponding to different riders, and then, the corresponding traffic management methods and safety education training strategies are proposed for e-bike riders with different personal characteristics; as a result, this paper strives to find ways to improve the riding safety and travel efficiency of e-bike riders at a fundamental level.

2. Method

2.1. Survey Design

First, we designed a questionnaire for e-bike riders’ personal characteristics and then used an on-site sampling survey to obtain data with the assistance of the traffic police. First, a radar speedometer was used to obtain the riding speed of the survey sample (i.e., the e-bike riders), and then, in the downstream section of 200 m, with the assistance of the traffic police, the rider was asked to stop to participate in our survey. In addition, if we encountered a rider who declined to participate in the survey, we allowed the rider to leave. The selected survey sections were two-way, three-lane roads, and we avoided bus stops and intersections to minimize the impact of other traffic factors on e-bike riders.

2.2. Demographic Information

In this survey, eight personal characteristics closely related to e-bike riders were selected during the data collection, namely, gender, age, education level, driving age, personality, occupation, corrective vision, and riding proficiency. All the above factors can affect the riding state during the riding process of the e-bike rider. This state is manifested mainly in the selection behavior of the riding speed interval.

2.3. Speed Selection Behavior

To make a more reasonable use of survey data to explore the impact of e-bike riders’ personal characteristics on riding speed, this paper divided the rider’s riding speed into four categories, namely, 0–15 km/h, 15–25 km/h, 25–35 km/h, 35 km/h and above, which are represented by A, B, C, and D, respectively. In accordance with the survey data, the number of riders, the average speed and the maximum value of each speed interval are countered, respectively. Based on the relevant provisions of the Safety Technical Specifications for E-bikes [25], the speed of e-bikes on urban roads exceeding 25 km/h qualified as speeding, so the speed limit for the rider to choose speeding riders is limited to 25 km/h. Taking these four values as a threshold, the relationship between the e-bike rider’s personal characteristics and his/her riding speed is illustrated in the following analysis. We were able to study riders exhibiting the personal characteristics that are prone to speeding when riding; with this information, we can cooperate with the relevant departments to manage the use of e-bikes.

2.4. Data Collection

The questionnaire [2,3,11,21] was targeted toward e-bike riders. A total of 352 questionnaires were obtained. After screening, there were 350 valid questionnaires. According to the statistics, there were 310 male riders (88.57%) and 40 female riders (11.43%). The age range of the riders was from 18 to 61 years old, and the driving age was more than one year. Through the statistical processing of the survey data, a statistical result of the personal characteristics of the e-bike riders is obtained (see Table 1).
The behavior selection data for the specific riding speed of the e-bike riders are shown in Table 2.

2.5. Reliability and Validity Tests

To test the internal consistency of the questionnaire, we use the Cronbach’s alpha coefficient. Through the reliability analysis using SPSS19.0 statistical software, it was found that the Cronbach’s alpha coefficients of the three potential variables (educational level, driving age, and riding proficiency) were all greater than 0.7, and the overall reliability of the eight indicators (gender, age, education level, driving age, personality, occupation, corrective vision, riding proficiency) in the questionnaire was 0.768. This result shows that the reliability analysis results of the questionnaire are good, that is, the questionnaire design is reasonable.
The Kaiser-Meyer-Olkin (KMO) test and Bartlett’s test were used to determine the sampling adequacy. The test results show that the KMO value is 0.863, which is greater than 0.50; the Sig is 0.00, which is less than 0.05, indicating that the questionnaire can be used for factor analysis. In the factor analysis of the questionnaire, the principal component analysis method was used to test the structural validity of the questionnaire. In the extraction of common factors, there are three influencing factors with latent roots greater than 1, and the explanatory variation is 30.340%, 20.560%, and 14.102%; the cumulative explanatory variation is 64.947%, which shows that the potential variables obtained after testing have good structural validity.

2.6. Disaggregate Model and Riding Selection Behavior

When applying the disaggregate theory to analyze the personal traffic behavior of the traveler, the data creation and calibration models are based on personal data. Since the 1970s, the disaggregate model has been widely used in the transportation field and has had abundant research achievements [26,27,28,29,30,31,32]. The model hypothesis is based on the fact that the traveler will choose the most effective scheme to carry out the behavioral activities. The utility function is divided into fixed and random parts, which are generally expressed as
U i n = V i n + ε i n
V i n = k = 1 k θ k X i n k
where U i n is the utility function of the i-th scheme for the n-th traveler; V i n is the fixed item of U i n ; ε i n is the random item of U i n ; k is the specific number of attribute variables; θ k is the parameter value of the k-th variable; X i n k is the k-th attribute variable value of the i-th scheme for the n-th traveler.
In the above disaggregate model, when ε i n obeys the double exponential distribution and the multidimensional normal distribution, respectively, the logit model and the probit model can be established. In the transportation system, the most unstable factor is the human-related factor, and the rider is the main participant in traffic behavior. It is difficult to accurately grasp changes in personal traffic behavior, which makes traffic system changes show certain randomness. When e-bike riders choose the riding speed and the motor vehicle riding lane, personal factors, and environmental factors have a strong impact on them, but environmental factors have a small impact on all riders. The final riding speed and the choice of riding lanes in the motorway are discrete, mainly because the individual characteristics of the rider have different perceptions of environmental factors. That is, in the same environment, the rider’s cognition is different, and the riding speed and the riding route are different. Therefore, the nature of the rider’s riding speed and the motorbike’s occupancy riding selection are personal characteristics. Conventional models cannot capture the discrete and nonlinear dual characteristics of riding behavior caused by the rider’s personal characteristics, but the disaggregate model is mainly applicable for the above characteristics and shows strong adaptability. At the same time, the riding speed and the choice of occupying a motor vehicle to ride are completed by the rider according to his maximum expected utility under the combined influence of many factors, which is in accordance with the initial assumptions of the disaggregate theory. Therefore, this paper applies the disaggregate model to analyze e-bike riders’ riding speed and the riding behavior on the road.

2.7. The Selection of the Behavioral Model

Based on valid data on the personal characteristics of e-bike riders obtained from the above survey, disaggregate theory was applied to study the rider’s riding speed and selection of the occupied motorway. Finally, the disaggregate model of riding speed selection behavior and occupancy of motor vehicle lanes is constructed separately.

2.7.1. Building the Model

In this paper, we use multinomial logit (multinomial logit, MNL) theory [3,33,34,35] to construct the speed of e-bike riders and the non-motor vehicle lane selection behavior model. First, based on the basic form of the MNL model, ε i n obeys the double exponential distribution, and ε i n and V i n are independent of each other, and according to the speed of the e-bike or the non-motor vehicle lane selection behavior, it can express that the probability that the n-th rider chooses the i-th selection behavior as
P i n = e V i n i = 1 I n e V i n
where I n is the total number of currently selected behaviors.

2.7.2. Determining Alternative Parts and Affected Factors

According to the disaggregate model theory, the four sections A, B, C, and D corresponding to the riding speed selection behavior of the rider are selected as the four selected limbs of the model, and they are represented as the values of 0, 1, 2, and 3. Determining the influencing factors can be based on the impact of the rider’s personal characteristics on speed selection, as shown in Table 3.

3. Results and Discussion

3.1. Relationship between a Rider’s Personal Attributes and Riding Speed

3.1.1. Model Influencing Factor Calibration

In this paper, the influencing factors are calibrated and selected by SPSS, as shown in Table 4. The minimum value (absolute value) of the t-test is 2.282, and its value is greater than 1.960, indicating that the eight selected influencing factors can significantly affect the riding speed selection behavior of the e-bike rider.
In the statistical analysis of SPSS data (see Table 5), the model fitness is indicated by R 2 , and R 2 is called the correlation coefficient, where R 2 ( 0 , 1 ) ; the closer R 2 is to 1, the better the linear regression relationship, and the closer the model is to the real situation. Here, the correlation coefficient R 2 is equal to 0.554, and the adjusted correlation coefficient R 2 is equal to 0.515, indicating that the established model works well.

3.1.2. Utility Function

In the four intervals, the parameter values of each influencing factor are shown in Table 6. Table 6 shows that the utility functions M, N, V, and E corresponding to the four intervals V 0 , V 1 , V 2 and V 3 are, respectively,
V 0 = 0.691 X 1 + 1.591 X 3 + 0.702 X 5 + 0.699 X 6 + 6.246 X 8 V 1 = 1.036 X 2 + 1.591 X 3 1.550 X 4 + 0.702 X 5 + 0.140 X 7 V 2 = 1.591 X 3 1.550 X 4 + 0.702 X 5 + 0.699 X 6 + 6.246 X 8 V 3 = 0.691 X 1 + 1.036 X 2 + 0.699 X 5 + 0.140 X 7 + 6.246 X 8
To obtain the relationship between various influencing factors and the speed of e-bike riders, a sensitivity analysis of each influencing factor and riding speed is carried out. The degree of sensitivity is usually expressed in terms of elasticity values. In disaggregate theory, when a certain influencing factor changes, the elastic value E for the selection probability change of the i scheme can be expressed as
E = θ k X i n k ( 1 P i n )
The elastic value has positive and negative points. When the two variables change positively, the value is positive; otherwise, the value is negative. When the absolute values of the elastic values corresponding to the four selection intervals are greater than 1, it indicates that the influencing factors are flexible for the riding speed interval selection behavior, and when the elastic values are less than 1, it indicates a lack of elasticity. First, based on survey data on the e-bike rider’s personal characteristics and the riding speed selection behavior, the average value of the riding speed interval corresponding to each rider’s personal characteristics is counted. Second, the parameter values obtained in Table 6 are substituted into formulas (2) and (3), and the probability values of the corresponding e-bike rider’s riding speed interval selection behavior are calculated. Then, through the calculation formula (4) of the elastic value, the elastic value of each influencing factor on the probability of selecting the behavior of the rider’s riding speed interval can be obtained.

3.2. Analysis of the Calculation Results

3.2.1. Gender and Age

According to the calculation method of the utility function mentioned, the selection probability, parameter value, sample mean and elastic value of each influencing factor in each interval for the sex and age of the e-bike rider in different selection intervals can be calculated. The specific calculation results are shown in Table 7. Similarly, the values corresponding to the influencing factors below are calculated in this way. Table 7 shows that the average gender corresponding to the four intervals shows an increasing trend, and the average value of the riding speed is greater than 0.500. This indicates that more male drivers than female drivers exhibit speeding behavior. Male riders are more prone to speeding than female drivers. The elasticity values of the rider’s gender corresponding to the four selection intervals are less than 1, indicating that the sex of the e-bike rider lacks flexibility in the riding speed selection behavior. Therefore, the elasticity value corresponding to interval D is −0.488, the absolute value of elasticity is larger than the other three intervals, and the value is smaller than 0.500, which indicates that the gender of the rider has the greatest influence on the rider’s long-term speeding behavior.
Average age shows an increasing trend, and the increase is obvious. This finding indicates that as the e-bike rider’s age increases, the more likely they are to speed and the continuous speeding time increases, which is closely related to older people’s overconfidence and desire to pursue speed. The age elasticity values corresponding to the four intervals are less than 1, which indicates that the age of the rider is not flexible enough for the riding speed selection behavior. However, the elastic values corresponding to intervals B and D are larger, indicating that compared with the other two intervals, the influence of age on whether the e-bike rider is speeding is more obvious. Then, people in this age range in B and D, the elasticity value is the most obvious, indicating that these people have the smallest likelihood to speed.

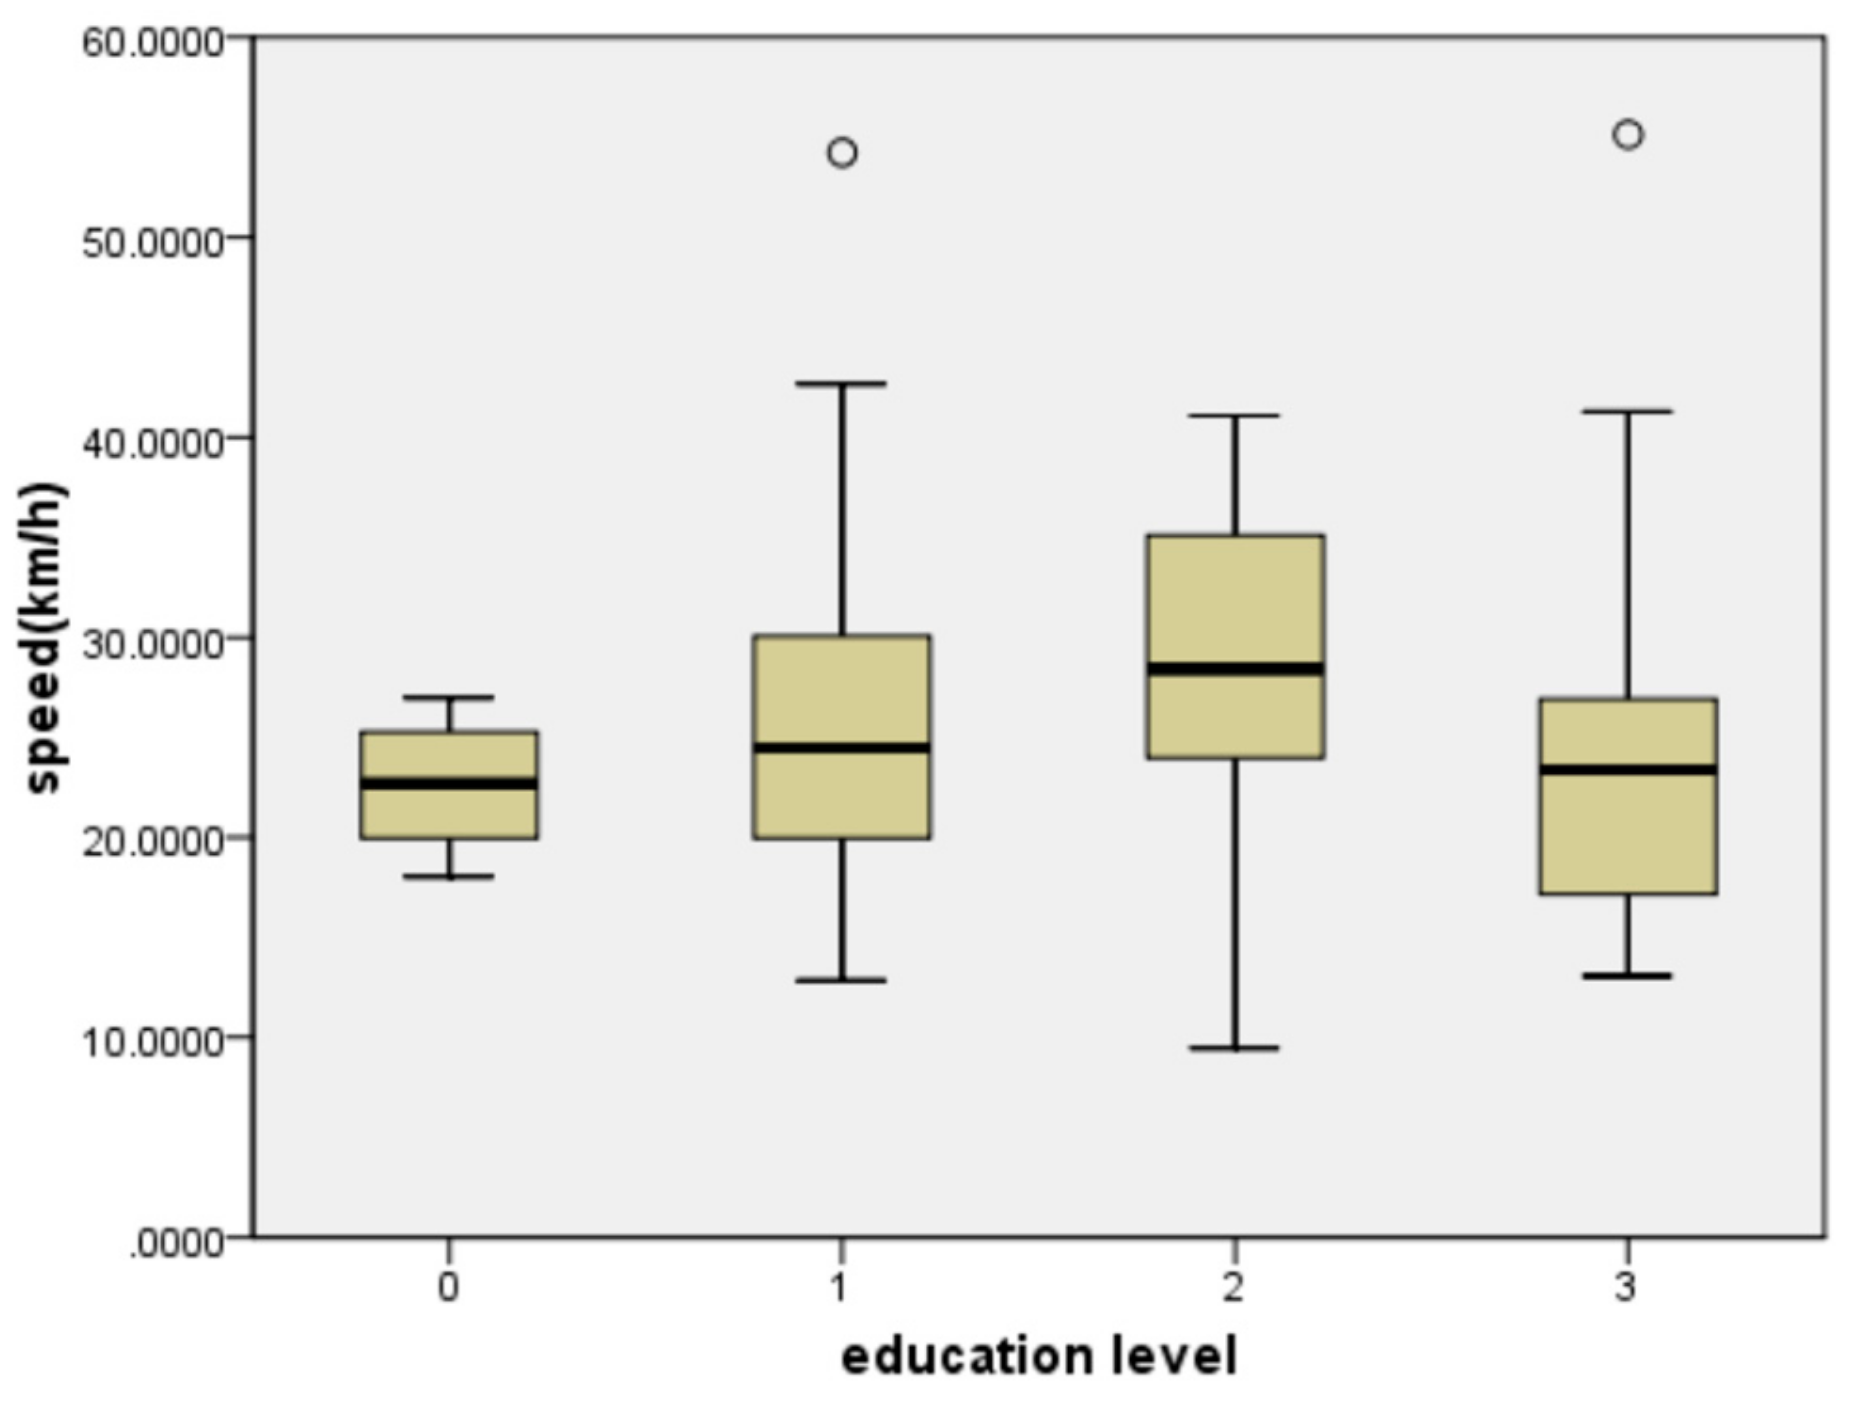
3.2.2. Education level and Driving Experience

Table 8 shows the results of the correlation between education level and driving age. Table 8 shows that the average value of the education level of the riders corresponding to the four selection intervals is stable, with a mean value of 1.5723. Therefore, the average value corresponding to interval B is the largest, and the value is 1.657, which indicates that when the education level of the e-bike rider is approximately at the level of junior high school, the probability that the rider chooses to ride in the high-speed range is the largest. The elasticity values of rider education level corresponding to the four selection intervals are all greater than 1, indicating that the rider’s education level is flexible for speed selection behavior. It follows that the educational level plays a decisive role in the rider’s personal speed selection process.
Among them, the elastic value of the B interval is the largest compared with the other three intervals, and the elastic value is 2.484, indicating that educational level has the greatest impact on an e-bike rider’s low-speed and stable riding. This type of rider has the highest average educational level, and the rider chooses the B-segment speed to have the lowest probability of riding. The probability of a rider choosing to ride in a high-speed range is as high as 60.4%, and the level of education of such riders is lower than that of a rider in a low-speed range. The relationship between the educational level of the specific e-bike rider and the riding speed interval selection behavior is shown in Figure 1.
From Figure 1, it can be seen that the riding speed range corresponding to an e-bike rider with high school education is the highest; before high school education is completed, as a rider’s educational level continues to increase, the speed range selected by the rider constantly rises. However, for e-bike riders with education levels at the university level and above, these riders’ speed range is lower, indicating that when the education level is high, the safety awareness of the rider and the consciousness of obeying the traffic rules and regulations are greatly improved, which is also the embodiment of the superiority of the rider with a high education level.
As the average age of the rider’s driving experience declines first and then increases, the highest average driving age chooses the lowest riding speed. However, there is no significant difference between the two speeding zones C and D. The driving age elasticity values corresponding to the four intervals are all greater than 1, indicating that the driving age is flexible to the speed selection behavior; that is, the change in the rider’s driving age has a greater influence on the speeding riding selection behavior. However, the driving age elasticity values of the four intervals are all negative, indicating that the driving age is negatively correlated with the rider’s speed selection behavior. That is, as the driving age increases, the speed range in which the rider chooses to ride will continuously decrease because the rider’s riding experience and the sense of safe riding have gradually increased with increasing riding time. It is more reasonable to control the riding environment and master the selection of the real-time speed range. The absolute value of the elastic value of non-speeding behavior corresponding to the selection interval is larger than that of speeding behavior. The absolute value of the elastic value of the B interval is the largest, and the value is 2.061; the A interval is the smallest, and the value is 1.537. Combined with the average age of driving, this value indicates that the probability that a low-speed e-bike rider rides at low speed is approximately 1.3 times that of the probability that he/she speeds.

3.2.3. Personality and Vision Correction

According to Eysenck’s personality test, which is based on people’s feedback, people’s personalities can be categorized into a melancholic temperament, phlegmatic temperament, sanguine temperament, and a choleric temperament, and the external manifestations of each personality are different; the perception of the same thing is quite different from the feedback behavior. It can be seen from Table 9 that the average value of the personality from four intervals is greater than 0.500, and the average of the personality averages is increasing, which explains that active, violent, and outward-looking riders choose to ride faster as their personalities change from a melancholic temperament to a choleric temperament. The elastic value of the B interval is relatively the largest at 1.264, which indicates that personality has the most significant influence on the e-bike rider’s choice of low-speed stable riding. However, as observed, the elastic value of the A interval is 0.788, which is less than 1, indicating that personality lacks flexibility in the speed interval selection behavior.
More than 80% of the information obtained by e-bike riders is obtained visually, and more than 90% of the information is dynamic. That is, information has a strong relationship with the rider’s dynamic vision, and the basis of the dynamic vision is the rider’s static vision, which is his/her perception and judgment of the traffic environment. Although corrective vision can meet the general information acquisition needs of the rider, it is difficult for the rider to achieve normal vision. Moreover, the lens has a certain curvature, which will cause a small amount of deformation in the surrounding environment. The impact on information acquisition is not obvious when riding at low speed, but it has a high impact when riding at higher speeds. As shown in Table 9, the average corrected visual acuity of the riders corresponding to the four sections is approximately 0.157, and the average of the four sections is less than 0.500. This finding shows that a slightly larger proportion of riders who speed have normal vision compared to corrected vision, indicating that corrected vision has no significant effect on the speed selection behavior of the rider. The elastic values corresponding to the four intervals are between 0.009 and 0.029, and the values are all less than 1, indicating that the rider’s corrected vision lacks elasticity for the riding speed interval selection behavior, and this effect is not significant.

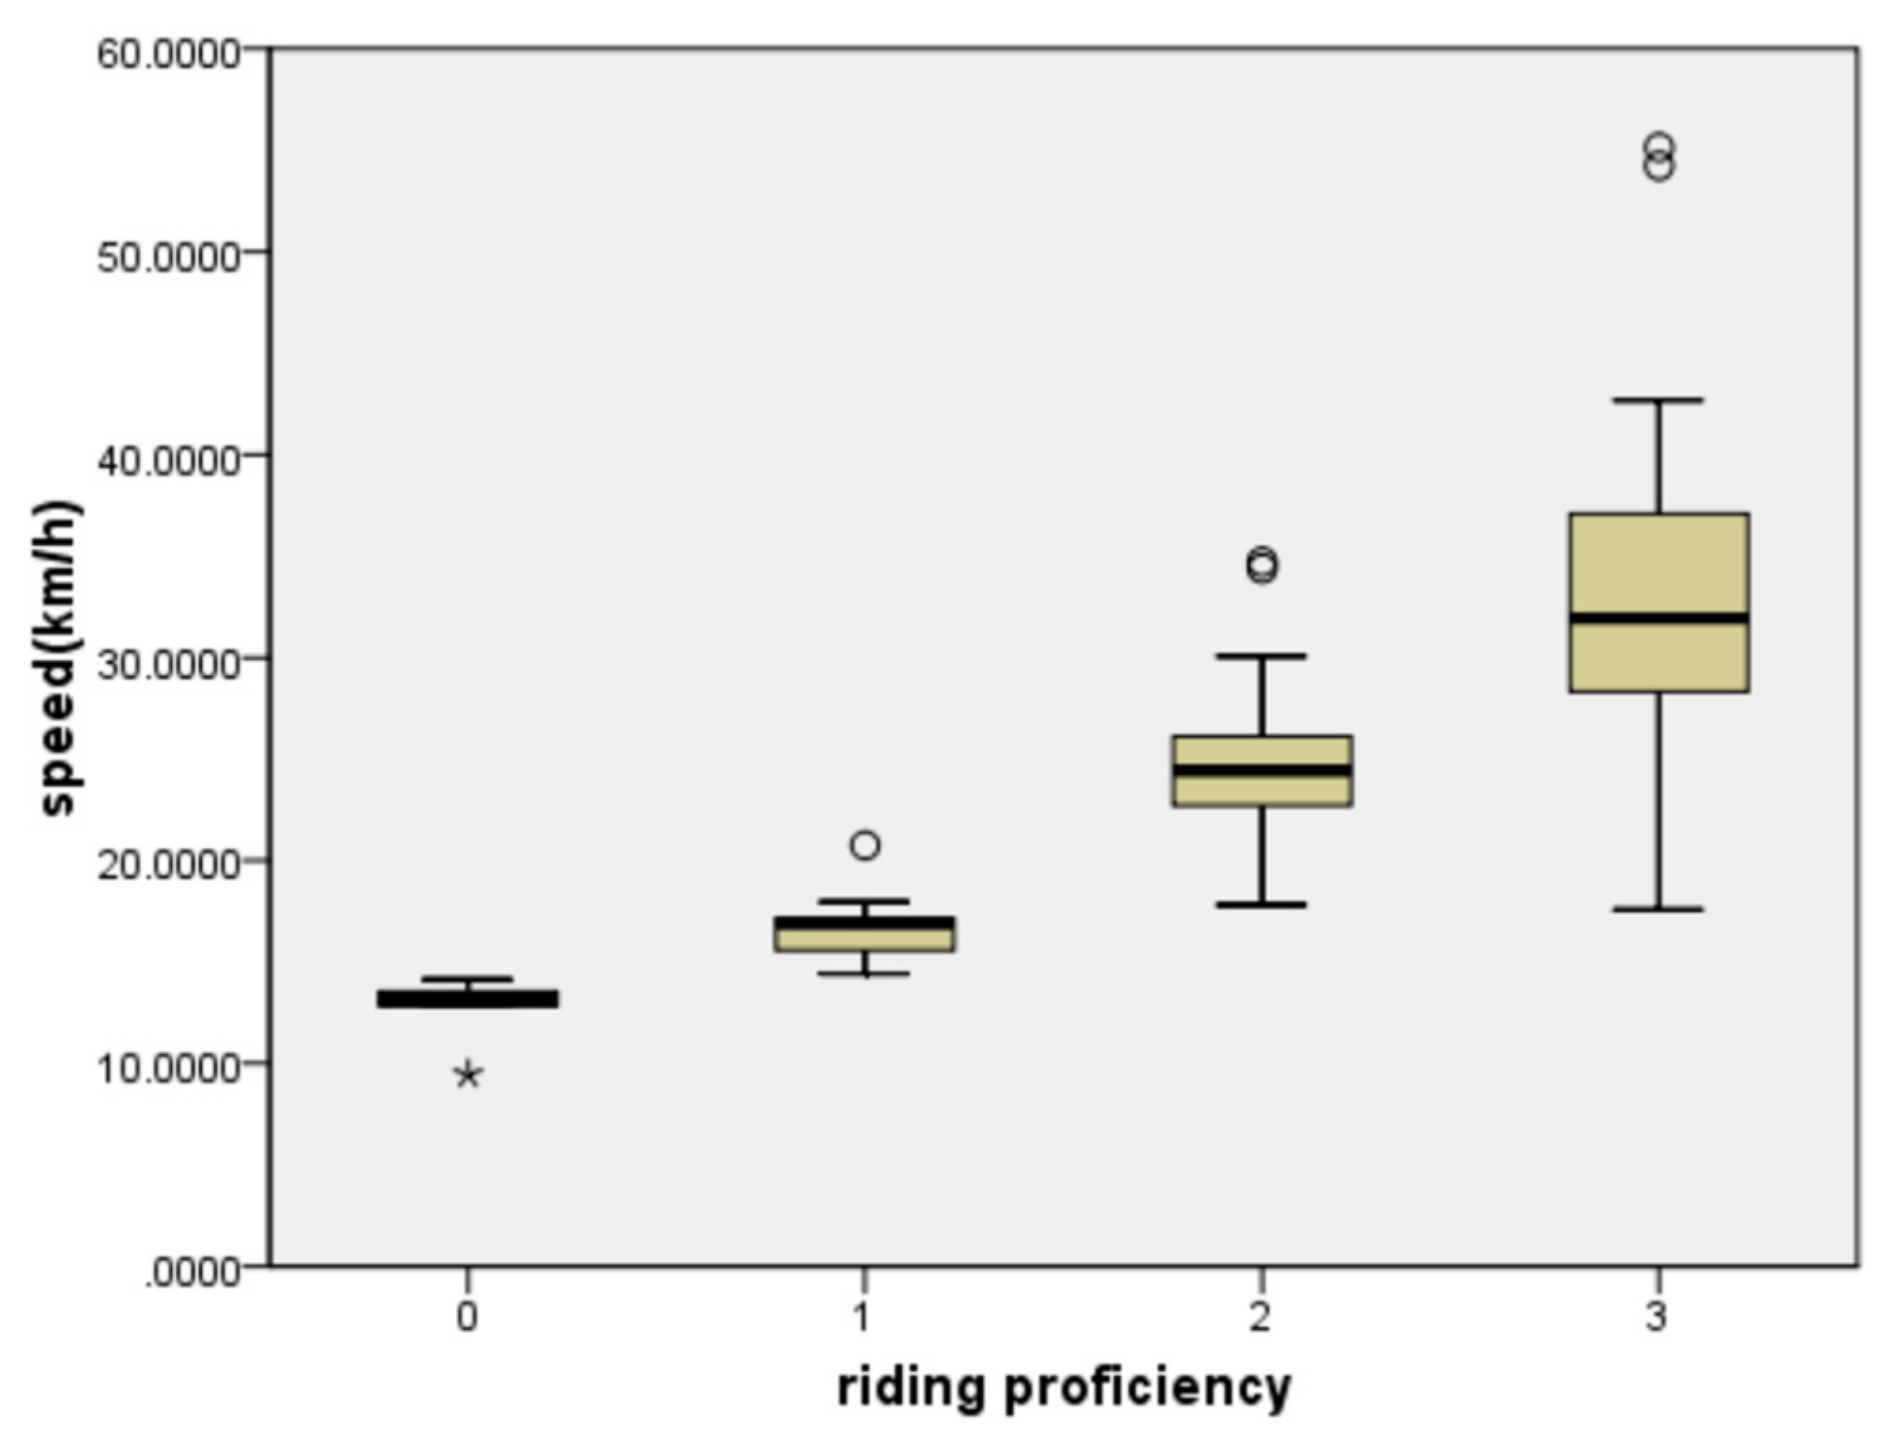
3.2.4. Occupational and Cycling Proficiency

Table 10 shows the calculation results for the occupational and riding proficiency of e-bike riders. According to the data in the table, the average occupation value of the rider is 1.544, and the average values of intervals B and C are not significantly different, while the mean value of the D interval is 1.633 and that of the A interval is 1.700, which is the largest, indicating that students are most likely to avoid speeding when riding an e-bike, which is related to the nature of students, that is, very disciplined. The average value of the elasticity of the riders’ occupation corresponding to the four selection intervals is 1.03, wherein the elastic value of the C interval is less than 1 and that of the other three intervals are greater than 1. Because the elasticity value is close to 1, it indicates that the occupation has a strong elasticity to the rider’s speed selection behavior. The occupation of the e-bike rider has a certain influence on the selection behavior of the riding speed range.
Table 10 shows that the average rider’s riding proficiency is increasing, and the growth trend of the four intervals is more obvious. The growth rates are 15.563%, 17.604%, and 5.322%, and the average value is 1.946, indicating that the probability that the rider chooses to speed increases continuously as the degree of proficiency increases. The average value of the flexibility of the rider’s riding proficiency corresponding to the four intervals is greater than 1, indicating that the rider’s proficiency is flexible for the rider’s speed selection behavior. The overall increase in elasticity values, combined with the increase in the average level of riding proficiency, indicates that as the rider’s riding experience increases, the rider knows more about the environment, infrastructure and traffic conditions, and the probability of speeding during riding is greater. The relationship between the specific rider’s riding proficiency and the riding speed interval selection behavior is shown in Figure 2.
As e-bike riding skill increases, the riding speed continuously increases and is constantly expanding. It reveals that the rider’s riding experience is constantly accumulating, and he is more familiar with the riding section and the surrounding environment. Thus, one has less influence on external factors during riding, and thus, the riding speed is faster.

4. Conclusions

Based on previous studies on the behavior of e-bike traffic, this paper further studies the relationship between the personal characteristics of e-bike riders and riding speed. By exploring the personal characteristics of the e-bike rider and the riding speed, we find the relevant influencing factors and propose exclusive management strategies and safety education and skill training programs for riders with different characteristics. We try to maximize the rider’s traffic safety awareness and reduce the rider’s unsafe riding behavior and traffic accidents.
Two main findings can be drawn from the results of the study. First, the absolute value of the elasticity value corresponding to the rider’s gender, age, corrected visual acuity, and other factors is less than 1, which indicates that the above factors have no flexibility regarding the rider’s riding speed selection behavior. Second, in four selection intervals, the elasticity values of the rider’s education level are 1.577, 2.484, 1.810, and 1.667; those of their driving age are −1.537, −2.061, −1.547, and −1.606, and those of their riding proficiency are 3.302, 12.038, 10.370, and 11.177, which indicate that the three factors of rider’s education level, driving age, and riding proficiency have a significant impact on the riding speed choice behavior. The finding of the study is helpful for the relevant government departments to formulate more accurate classified intervention measures, and effectively prevent the occurrence of illegal speeding behavior.
Furthermore, given the limited value of the model samples, in subsequent studies the sample size can be further increased, and other influencing factors, such as marital status and height, can be added. We constantly revise the parameters of the influencing factors in the model, making the results of the sensitivity analysis more accurate and more in line with the real situation on the road.

Author Contributions

C.M. and J.Z. designed research methods and wrote the manuscript, D.Y. collected and analyzed the data, Y.F. and J.Z. edited and revised the manuscript, and D.Y. drew the figures. All authors have read and agreed to the published version of the manuscript

Funding

This study was supported by the National Natural Science Foundation of China (No. 71861023), Program of Humanities and Social Science of Education Ministry of China (No. 18YJC630118), Natural Science Foundation of Zhejiang Province (No. LQ19E080003), Natural Science Foundation of Ningbo Municipality (No. 2018A610127), and Foundation of A Hundred Youth Talents Training Program of Lanzhou Jiaotong University.

Conflicts of Interest

The authors declare that they have no conflicts of interests.

References

  1. Cherry, C.; Cervero, R. Use characteristics and mode choice behavior of electric bike users in China. Transp. Policy 2007, 14, 247–257. [Google Scholar] [CrossRef] [Green Version]
  2. Guo, Y.; Wu, Y.; Lu, J.; Zhou, J. Modeling the unobserved heterogeneity in e-bike collision severity using full Bayesian random parameters multinomial logit regression. Sustainability 2019, 11, 2071. [Google Scholar] [CrossRef] [Green Version]
  3. Guo, Y.; Li, Z.; Wu, Y.; Xu, C. Evaluating factors affecting electric bike users’ registration of license plate in China using Bayesian approach. Transp. Res. Part F Traffic Psychol. Behav. 2018, 59, 212–221. [Google Scholar] [CrossRef]
  4. Ma, C.; Yang, D.; Zhou, J.; Feng, Z.; Yuan, Q. Risk riding behaviors of urban e-bikes: A literature review. Int. J. Environ. Res. Public Health 2019, 16, 2308. [Google Scholar] [CrossRef] [PubMed] [Green Version]
  5. Traffic Management Bureau of Ministry of Public Security. Statistics of Road Traffic Accidents in PRC (2015); Traffic Management Bureau of Ministry of Public Security: Beijing, China, 2016.
  6. Traffic Management Bureau of Ministry of Public Security. Statistics of Road Traffic Accidents in PRC (2016); Traffic Management Bureau of Ministry of Public Security: Beijing, China, 2017.
  7. Zhu, J.; Dai, S.; Zhu, X. Accedent characteristics and safety method of electric cyclists. Urban Traffic 2018, 16, 15–20. [Google Scholar]
  8. Li, Q.; Yu, S.; Chen, T.; Bishai, D.M.; Bachani, A.; Hyder, A.A. Road safety risk factors for non-motorised vehicle users in a Chinese city: An observational study. Inj. Prev. 2019, 2018, 1–10. [Google Scholar] [CrossRef] [PubMed]
  9. Haustein, S.; Møller, M. E-bike safety: Individual-level factors and incident characteristics. J. Transp. Health. 2016, 3, 386–394. [Google Scholar] [CrossRef] [Green Version]
  10. Yan, X.; He, J.; King, M.; Hang, W.; Zhou, B. Electric bicycle cost calculation models and analysis based on the social perspective in China. Environ. Sci. Pollut. Res. 2018, 25, 20193–20205. [Google Scholar] [CrossRef]
  11. Bai, L.; Chan, C.; Liu, P.; Xu, C. Identifying factors affecting the safety of mid-block bicycle lanes considering mixed 2-wheeled traffic flow. Traffic Inj. Prev. 2017, 18, 761–766. [Google Scholar] [CrossRef]
  12. Wu, C.; Yao, L.; Zhang, K. The red-light running behavior of electric bike riders and cyclists at urban intersections in China: An observational study. Accid. Anal. Prev. 2012, 49, 186–192. [Google Scholar] [CrossRef]
  13. Schepers, J.P.; Fishman, E.; Den Hertog, P.; Wolt, K.K.; Schwab, A.L. The safety of electrically assisted bicycles compared to classic bicycles. Accid. Anal. Prev. 2014, 73, 174–180. [Google Scholar] [CrossRef] [PubMed]
  14. Petzoldt, T.; Schleinitz, K.; Heilmann, S.; Gehlert, T. Traffic conflicts and their contextual factors when riding conventional vs. e-bikes. Transp. Res. Part F Traffic Psychol. Behav. 2017, 46, 477–490. [Google Scholar] [CrossRef]
  15. Johnson, M.; Rose, G. Extending life on the bike: Electric bike use by older Australians. J. Transp. Health 2015, 2, 276–283. [Google Scholar] [CrossRef]
  16. Hu, F.; Lv, D.; Zhu, J.; Fang, H. Related risk factors for injury severity of e-bike and bicycle crashes in Hefei. Traffic Inj. Prev. 2014, 15, 319–323. [Google Scholar] [CrossRef]
  17. Chen, B. Study on Traffic Safety of Electric Bicycles Based on Traffic Conflict Technique; Southwest Jiaotong University: Chengdu, China, 2014. [Google Scholar]
  18. Xing, X.Y.; Xu, W.; Chen, Y.; Liu, Z.; Bian, Z.; Liu, Y. A roadside observation study of unsafe riding acts among e-bike riders in a city of Anhui Province. Chin. J. Dis. Control 2017, 21, 943–946,952. [Google Scholar]
  19. Wang, M.L. Safety Analysis of Elecreic Bicycle on Urban Road; Southwest Jiaotong University: Chengdu, China, 2010. [Google Scholar]
  20. Fu, Q.; Ma, G.Z. Study on Traffic Safety and Management of City E-Bike; Southwest Jiaotong University: Chengdu, China, 2016. [Google Scholar]
  21. Guo, Y.; Zhou, J.; Wu, Y.; Chen, J. Evaluation of factors affecting e-bike involved crash and e-bike license plate use in China using a bivariate probit model. J. Adv. Transp. 2017, 2017, 1–12. [Google Scholar] [CrossRef] [Green Version]
  22. Dong, S.; Zhou, J.; Tang, K. Safety effect of flashing green on e-bikes’ stop-go decision-making behavior. China Saf. Sci. J. 2015, 25, 27–33. [Google Scholar]
  23. Zhang, Y.Q.; Wu, C.X. The effects of sunshields on red light running behavior of cyclists and electric bike riders. Accid. Anal. Prev. 2013, 52, 210–218. [Google Scholar] [CrossRef]
  24. Chen, F.; Chen, S. Injury severities of truck drivers in single-and multi-vehicle accidents on rural highways. Accid. Anal. Prev. 2011, 43, 1677–1688. [Google Scholar] [CrossRef]
  25. GB17761-2018, Electric Bicycle Safety Technical Specifications; State Market Supervisory Administration; China National Standardization Administration: Beijing, China, 2018.
  26. Malyshkina, N.V.; Mannering, F.L. Markov switching multinomial Logit model: An application to accident-injury severities. Accid. Anal. Prev. 2009, 41, 829–838. [Google Scholar] [CrossRef] [Green Version]
  27. Yuan, H.; Feng, Z.X.; Jian, X.P.; Liu, J. Selection model of car parking facility in urban central region. J. Highw. Transp. Res. Dev. 2012, 29, 137–141. [Google Scholar]
  28. Feng, Z.X.; Liu, H.X.; Zhang, J.F. Selection model of trip modes for rural population. J. Traffic Transp. Eng. 2010, 10, 77–83. [Google Scholar]
  29. Ma, C.X.; He, R.C.; Zhang, W. Path optimization of taxi carpooling. PLoS ONE 2018, 13, e0203221. [Google Scholar] [CrossRef] [PubMed]
  30. Hao, W.; Wang, A.; Zhao, H. Developing a coordinated signal control system for urban ring road under the vehicle-infrastructure connected environment. IEEE Access 2018, 6, 52471–52478. [Google Scholar]
  31. Ma, C.X.; Hao, W.; Xiang, W.; Yan, W. The impact of aggressive driving behavior on driver injury severity at highway-rail grade crossings accidents. J. Adv. Transp. 2018, 2018, 9841498. [Google Scholar] [CrossRef] [Green Version]
  32. Chen, F.; Chen, S.; Ma, X. Analysis of hourly crash likelihood using unbalanced panel data mixed logit model and real-time driving environmental big data. J. Saf. Res. 2018, 65, 153–159. [Google Scholar] [CrossRef]
  33. Wang, C.; Xu, C.; Xia, J.; Qian, Z. Modeling faults among e-bike-related fatal crashes in China. Traffic Inj. Prev. 2017, 18, 175–181. [Google Scholar] [CrossRef]
  34. Cherry, C.; Yang, H.; Jones, L.; He, M. Dynamics of electric bike ownership and use in Kunming, China. Transp. Policy 2016, 45, 127–135. [Google Scholar] [CrossRef] [Green Version]
  35. Shen, Q.; Chen, P.; Pan, H. Factors affecting car ownership and mode choice in rail transit-supported suburbs of a large Chinese city. Transp. Res. Part A Policy Pract. 2016, 94, 31–44. [Google Scholar] [CrossRef]
Figure 1. Relationship between education level and riding speed selection behavior.
Sustainability 12 00799 g001
Figure 2. Relationship between riding proficiency and riding speed selection behavior.
Sustainability 12 00799 g002
Table 1. Statistics for the personal characteristics of e-bike riders.
Personal CharacteristicsThe Number of E-Bike Riders
GenderMale ridersFemale riders
31040
Age18–3030–4545–60>60
1081428119
Education levelPrimary school and belowJunior high schoolHigh schoolUniversity or above
2712115745
Driving age≤1 year1–3 year3–5 year ≥5 year
2118012227
CharacterMelancholic temperamentPhlegmatic temperamentSanguineous temperamentCholeric temperament
112914971
Job/occupationStudentsIn-service staffSelf-employedRetirees
1117914119
Vision correction YesNo
28565
Cycling proficiencySkilledMore skilledAverageBeginner
130189256
Table 2. The speed of e-bike riders.
Speed Behavior Selection IntervalABCD
Number of riders1013314760
Average speed13.303720.713728.833940.7376
Maximum speed average14.506624.9462 34.974955.1362
Table 3. Influencing factors.
Influencing FactorsVariablesExplanation
GenderX1Male is 1 and female is 0
AgeX2Divided into four levels: 18–30 years old, 30–45 years old, 45–60 years old, and 60 years old or older; respectively, the values are 0, 1, 2, and 3
Educational levelX3Divided into four levels: Primary school and below, junior high school, high school, university and above; respectively, the values are 0, 1, 2, and 3
Driving ageX4Time of actually riding an e-bike
CharacterX5Divided into four levels: Melancholic temperament, phlegmatic temperament, sanguine temperament, choleric temperament, with values 0, 1, 2, and 3
Job/occupationX6Divided into four levels: Students, incumbents, freelancers, and retirees (others) have values of 0, 1, 2, and 3, respectively
Vision correction X7Dummy variable is 1 if vision is corrected and 0 otherwise
Cycling proficiencyX8Divided into four levels: Novice, general, more skilled, skilled; respectively, the values are 0, 1, 2, and 3
Table 4. Results of model influencing factor calibration.
Influencing FactorsVariableParameter ValueStandard Deviationt-Test Value
GenderX1−0.691 0.321 16.944
AgeX21.036 0.870 6.419
Educated levelX31.591 0.803 22.773
Driving ageX4−1.550 0.722 26.951
CharacteristicX50.702 0.744 26.472
Job occupationX60.699 0.649 28.670
Whether to correct visionX70.140 0.393 4.975
Cycling proficiencyX86.246 0.677 25.466
Table 5. The fit of the calibrated model.
ModelRR2Adjusted R2Error in Standard Estimates
10.7450.5540.5155.925
Table 6. Influencing factors and parameter values.
Influencing FactorsVariableInterval
ABCD
GenderX1−0.691 −0.691
AgeX2 1.036 1.036
Education levelX31.5911.5911.591
Driving ageX4 −1.550−1.550
CharacterX50.7020.7020.7020.702
Job/occupationX60.699 0.699
Vision correctionX7 0.140 0.140
Cycling proficiencyX86.246 6.2466.246
Table 7. The results for gender and age.
Speed Selection Behavior IntervalSelection ProbabilityGenderAge
Parameter ValuesAverage ValuesElasticityParameter ValuesAverage ValuesElasticity
A0.339 −0.691 0.923−0.422 1.036 0.9000.616
B0.057 −0.691 0.824−0.537 1.036 0.9780.955
C0.310 −0.691 0.938−0.447 1.036 1.0540.754
D0.294 −0.691 1.000 −0.488 1.036 1.1170.817
Table 8. Education level and driving age calculation results.
Speed Selection Behavior IntervalSelection ProbabilityEducation Level Driving Age
Parameter ValuesAverage ValuesElasticityParameter ValuesAverage ValuesElasticity
A0.339 1.591 1.5001.577 −1.550 1.500−1.537
B0.057 1.591 1.6572.484 −1.550 1.410−2.061
C0.310 1.591 1.6491.810 −1.550 1.446−1.547
D0.294 1.591 1.4831.667 −1.550 1.467−1.606
Table 9. Personality and corrected visual acuity calculation results.
Speed Selection Behavior IntervalSelection ProbabilityPersonalityCorrected Visual Acuity
Parameter ValuesAverage ValuesElasticityParameter ValuesAverage ValuesElasticity
A0.3390.7951.5000.7880.1400.1000.009
B0.0570.7951.6871.2640.1400.2160.029
C0.3100.7951.8651.0230.1400.1960.019
D0.2940.7952.0501.1510.1400.1170.012
Table 10. Calculation of occupational and cycling proficiency.
Speed Selection Behavior IntervalSelection ProbabilityJob OccupationCycling Proficiency
Parameter ValuesAverage ValuesElasticityParameter ValuesAverage ValuesElasticity
A0.339 0.899 1.7001.010 6.246 0.8003.302
B0.057 0.899 1.3581.151 6.246 2.04512.038
C0.310 0.899 1.4860.922 6.246 2.40510.370
D0.294 0.899 1.6331.037 6.246 2.53311.177

