Abstract
Synergetic development is the basis and means for the sustainable development of regional economies. Research on the synergetic economic relationship between cities and the exposure of the internal structure and evolution mechanisms of the Urban Economic Synergetic Development Network (UESDN) in the context of industrial agglomeration promote the construction and sustainable development of such a system. Industrial agglomeration not only affects the spatial distribution of industrial structures and enterprise activities but also causes differences in city positions. Using input–output theory, this study constructed a UESDN for China in 2005, 2010, and 2015, and employed social-network analysis to analyze the spatial and temporal evolution characteristics of China’s synergetic development pattern. The degree centrality, betweenness centrality, and cohesive subgroups of the UESDN were computed using models in complex-network theory. This study found that the synergetic development pattern of Chinese urban economies has gradually developed from the hub-spoke model focused on Eastern provincial capitals to the network model of eastern and central cities over the period of 2005–2015. A few key cities act as intermediaries that carry economic factors with the shortest path in the UESDN. The Yangtze River economic belt, the axis belt of the Eastern coast and that of the Western economic belt were gradually formed. The number and strength of the correlation between cities within the subgroups have also continually increased. In our conclusion, we offer some suggestions for establishing a system of synergetic development between cities to improve urbanization levels.
1. Introduction
A new round of technological revolution and the rapid development of the knowledge economy have gradually intensified the uncertainty associated with urban economic development. The traditional closed development mode can no longer satisfy the requirements of sustainable development. Constructing an open environment and actively integrating a region’s economy into the global network has become an important way to accumulate production factors within the region. In this context, synergetic development has become an important basis and means for sustainable development. Today, cities and city groups play a dominant role as spatial containers for regional economic development, and the report from China’s Nineteenth National Congress proposed “taking urban agglomeration as the main body to construct a coordinated structure of large, medium, and small cities and towns” [1]. This clearly suggests that the construction of an urban economic synergetic-development pattern with urban agglomeration at the core is the practical choice to accelerate the overall development of regional economies.
With the rapid development of the urban agglomeration economy, the spatial structure of urban agglomeration and its socioeconomic performance have attracted extensive attention in academia. A rational spatial structure contains a regulator and booster to promote the sustainable development of an urban economy [2]. Marshall pointed out that a typical urban hierarchy system can promote collaborative cooperation among cities in urban-agglomeration structures, cultivate their industrial characteristics, and realize the efficient economic development of the urban agglomeration economy [3]. According to Perroux’s growth-pole theory, the social and economic development of different cities is always unbalanced [4]. When the factors of production in urban agglomeration are inadequate, we can obtain greater economic benefits and lower development costs by redirecting various development factors toward realizing the advantages of cities and industries and promoting such cities to become regional growth poles, thus promoting the social and economic development of surrounding cities. Rondinelli pointed out that the mutual flow of various production factors between cities, and between cities and regions, can cause regional development to undergo polarization and radiation, the division of labor and cooperation, and the strengthening of systems, thus ultimately improving the overall efficiency of the entire region [5]. Haughton and Hunter believe that higher urban density in urban agglomerations is conducive to the sustainable and comprehensive utilization of centralized public facilities, effectively reducing traffic distance and pollution emissions, thereby promoting the sustainable development of urban agglomerations [6]. The spatial structure of urban agglomerations is an important factor affecting the input–output efficiency of various internal production factors and is also the key to the sustainable economic development of urban agglomerations. A scientific and reasonable spatial structure can not only optimize the allocation of various production factors in urban agglomerations and achieve the best use of production factors, but it can also realize complementary advantages through the construction of mutual-relationship networks among cities in urban agglomerations, thereby generating output that is greater than the sum of its parts [7].
On the basis of flow [8] and synergy space [9] theories, the economic structure of urban agglomeration is composed of the relationship between cities (for example, flows of personnel, technology, capital, and information) [10]. Synergetic development depends on intercity relationships to rationally allocate resources and accelerate the cross-regional flow of production factors. This forms a self-organizing structure with specific functions in a city-group economic system. Thus, disorderly development can be gradually transformed into a more ordered state, resulting in value-added and scale advantages.
At present, the urban–economic correlation network model formed by the flow of production factors is well regarded and closely related to the notion of socio-economic development. Taylor (2015) pointed out that the second essence of cities is the economic relationships between them [11]. Batty (2013) believes that the city is not only a spatial concept but should also be regarded as a complete network and flow system [12]. With the deepening of regional trade liberalization, economic integration, and informatization, urban network theory has become a more effective concept to study spatial organization [13], which posits that with the continuous flow, concentration, and distribution of production factors (capital, information, personnel, and technology), a synergetic economic development network with multiple connotations has been formed. With respect to the economic structure of city groups, the importance of cities not only depends on intrinsic socioeconomic attributes, but also the transmission efficiency and density of production factors. In the Urban Economic Synergetic Development Network (UESDN) model, the status and function of each city has changed from central to node, and the location and structure of a city determine the breadth and depth of labor division and cooperation [14]. Therefore, this study assumes that:
- (1)
- due to the influence of natural resources, location conditions, and economic-development levels, the location and structure of cities in the urban economic coordination network are different;
- (2)
- the radiation-driving ability and function of key cities affects the efficiency and benefits of the overall coordinated development of an urban-agglomeration economy;
- (3)
- analyzing the structure of the UESDN is helpful to determine key and weak urban nodes.
For a city, if the influence of the spatial structure of urban agglomeration is not fully considered, its planning leads to a loss of efficiency for the whole urban-agglomeration structure and the internal structure of a single city. Therefore, the main objective of this study was to build an urban economic co-ordinated development network on the basis of industrial input–output theory. To this effect, the social-network method was used to analyze the strength and structure of urban economic connections, discover the nodes that need to be optimized and controlled in the process of urban economic synergetic development, and explore the practical path to promoting urban economic synergetic development. The structure of this paper is as follows: Section 2 summarizes related research and introduces the UESDN model. Section 3 discusses data sources and research methods. Section 4 contains UESDN analysis from the perspective of degree centrality, betweenness centrality, average path length, and cohesive subgroups. Section 3 discusses the research results, and Section 4 concludes the paper.
2. Industrial Agglomeration and Urban Economic Synergetic Development Network (UESDN)
2.1. Industrial Agglomeration
Urban development is inseparable from industrial economics, as the former is generally accompanied by an improvement in industrial–geographic agglomeration. Using industrial value chains to divide work in a region is also key to the realization of industrial agglomeration and the professional division of labor to bring about scale effects. New economic geography, a school of thought emphasizing the importance of geography for economics through the construction of spatial-concentration models, points out that, in order to reduce transaction costs and obtain scale returns, enterprises in an industry, together with the industry’s upstream and downstream relationships, form a spatial agglomeration under supply–demand correlation and then self-strengthen to form an industrial agglomeration under circular causality [15,16,17]. As one of the fundamental driving forces of urban development, industrial agglomeration is supported by extensive labor, capital, and population aggregation, which, in turn, leads to the formation of cities and city groups [18]. Accordingly, industrial agglomeration not only affects the spatial distribution of industrial structures and enterprise activities but also causes differences in city positions. Studying the effect of industrial agglomeration, which helps to determine the pattern and the pull of industries and key cities, thereby narrows the gap in economic development between cities to help achieve a more coordinated development pattern.
In the process of economic globalization, liberalization, and informatization development, industrial agglomeration and urban economic synergetic-development theories have attracted widespread attention. Industrial agglomeration developed in the context of new economic geography. As a particular branch of new economic geography, industrial-agglomeration models from the perspectives of transportation costs, changes in scales, and externalities explain how enterprises undergo a spatial-agglomeration process with forward and backward correlation [15,16]. For example, Swann (1996) and Porter (1998) [19,20] stated that industrial agglomeration is a geographical aggregation of several related industries (institutions) around production chains, and that internal integration includes both technical cooperation and competition [21]. Other scholars have affirmed the promotion of industrial agglomeration in regional economic development from various perspectives [22,23,24].
2.2. Urban Economic Synergetic Development Network (UESDN)
Contemporary studies of the synergetic development of urban economies focused on the theories, conditions, challenges, and relevant empirical analyses of synergetic development. Focus areas include the connotations of urban economic cooperation and linkages and the integration of industrial cluster and urban agglomerations. Higgins (2017) [25] emphasized the promotion of regional development through the spatial layout and coordination of industries and enterprises.. In addition, some scholars measured the degree of the synergetic development of an urban economy by using the Data Envelopment Analysis (DEA) model and the Harken model. For example, Li Haidong (2014) [26] made an improvement to distance collaborative model combined with TOPSIS idea and grey relational theory, and relative distance rate is used to measure the degree of collaborative development between cities.. In addition, some scholars used the deviation-coefficient method, multi-index comprehensive analysis, analytic-hierarchy process, and other methods to measure the degree of the synergetic development of urban economies [27,28].
To construct the UESDN model, scholars weakened the location attributes of the city, instead emphasizing the reintegration of flowing spaces, infrastructure organization, and enterprise organization. Flowing spaces were analyzed through urban associations formed by capital, information, products, and personnel on facilities (e.g., road traffic and information networks) [29,30,31], while infrastructure and enterprise organizations were analyzed through the relationship between cities through business activities [32,33,34].
Using input–output theory, this study constructed a UESDN for China. The essence of the UESDN is cooperation between different levels and characteristics in the industrial and geographical division of labor. The core is cross-regional resource integration and coordination. The basis is the input–output relationship of regional industries, which is the foundation of enterprise communication and urban synergetic development; to reduce transaction costs, upstream and downstream enterprises in the industrial chain are gathered in developed and active regions relying on industrial spatial agglomeration. As an advanced subdivision of industrial organization, these enterprises are also the microrealization of urban economic synergetic development—the exchange of production factors such as material, energy, and information in the city [35]. Therefore, according to the input–output relationship between industries, the strong correlation between industries can be measured, and the influence of the agglomeration of industries and enterprises around this industry on the synergetic development of urban economy can then be studied.
With a background in industrial agglomeration, a UESDN model is constructed through analyzing correlations between the industrial attributes, business activities and location attributes of enterprises. The inherent logical relationship between industry, enterprise, and city is industry → enterprise → city. The relationship between industry and enterprise refers to enterprises that may be situated within a particular industry, or industries to which a certain enterprise may belong; the relationship between a company and a city refers to cities in which a certain enterprise may exist, or enterprises that may be included in a certain city. The substance of the model consists mainly of industrial-correlation networks based on strong correlations, and the systematic coupling of three-layer networks according to the mapping relationship, which then led to the construction of the synergetic enterprise network and UESDN. The steps taken to build the model are now shown.
2.2.1. Building Industry Association Network
Input-output technology can quantify the interdependence between industries and is an effective tool to measure the forward and backward relationship. This paper calculated the correlation between industries on the basis of input–output theory. Suppose the number of industries is n, and i,j = 1,2, …, n. First, we computed industry complete demand coefficient matrix A, with A(i,j) denoting the quantity of industry product i when industry j adds one unit of the final product. Then, we determined element threshold α in matrix A by using sensitivity-test calculation of the inflection point [36]. If A(i,j) ≥ α, the industry strong correlation matrix is B(i,j) = A(i,j); otherwise, if B(i,j) = 0, B(i,j) ≠ 0 denotes that there is significant support and dependence between industry i and industry j.
2.2.2. Building Enterprise Synergetic-Development Network
Industry agglomeration shapes the pattern of the enterprise-related network through business activities. To construct the network, suppose the number of enterprises is m, and p,q = 1,2, …, m. First, we found the industrial sector in the input–output table of the enterprise by comparing the industry code in the company’s financial annual report with the National Economic Industry Classification (GB/T4754-2017). The industry code in the enterprise annual report and the industrial-sector division in the industrial input-output table refers to the National Economic Industry Classification. According to the Guidelines for the Classification of Listed Companies, if the proportion of the operating income of a certain type of business of a listed company ≥50%, it is classified into the corresponding industry of the business; if it is ≤50% but the income and profit of a certain type of business are the highest among all businesses and both account for more than 30% of the company’s total revenue and total profit, then the company belongs to the industry category [37].
Second, let main business enterprises p and q belong to industries i,j and cities u,w, respectively, with the distance of u and w being represented by D (u,w). Finally, we constructed enterprise-related matrix E as follows:
We also used sensitivity-test calculation of the inflection point to obtain urban strong correlation matrix E′, E′(p,q) ≠ 0, which indicated that there was a strong relationship between enterprises p and q.
2.2.3. Building the UESDN
Interenterprise business communication, as a microrealization of urban economic exchange, is an important point for building the UESDN. The network is determined according to the enterprise association and the city where the headquarters is located. Suppose the number of cities is k, and u,w = 1,2, …, k. First, if enterprises p,q are located in cities u,w, respectively, E′(p,q) ≠ 0, with C(p,q)(u,w) = 1 in urban association matrix C. If there are many pairs of enterprise correlations between cities u and w, the correlated weight between two cities is described as follows:
Then, for matrix C, the sensitivity of the test calculation of the inflection point was also used to filter and obtain strong correlation matrix C′. Finally, the UESDN was constructed according to urban strong correlation matrix C′.
3. Methods and Data
3.1. Data Collection
Due to the large scale and influence of listed companies, most high-quality enterprises in China are listed companies, and information is relatively easy to obtain. Therefore, on the basis of the representativeness, completeness, and desirability of enterprise data, this paper selected the listed companies as the subject of study [38]. This paper built the network using China’s published input-output data and China’s A-shares listed companies from the National Bureau of Statistics of China [39]. The data on input-output are characterized by 42 different sectors from 2005, 2010, and 2015. The data of national A-shares listed companies for the same time periods were obtained from the Guotai’an Economic and Financial Research Database (CSMAR). Among them, 1357, 2105, and 2822 listed companies were selected [40]. These companies are located in 324 cities, and the shortest road distance was measured by ArcGIS9. version 3 (2009).
Using the above method, strong correlations between industries were observed. There were 210, 234, and 279 strong correlations in 2005, 2010, and 2015, respectively, indicating that, with the development of the economy and the national economic system, correlation strength and agglomeration ability between industries have gradually increased, and the supporting role of industry in urban economic development is becoming more significant.
3.2. Analytical Method
Network theory pursues a balanced, cooperative, and coordinated relationship. Social-network theories and methods are used in the process of analyzing the synergetic development of urban economy. Compared with hierarchical relationships, network relationships have the effect of automatically improving the economic growth of all parties and are suitable for solving the imbalance of regional economic development [41]. For example, TerWal (2009) [42] believed that social network analysis is a promising tool for empirically investigating the structure and evolution of inter-organizational interaction within and across regions, and proposed an analytical framework for network methods to study economic geography. Eisingerich (2010) [43] used an SNA to study the reasons for the continued growth of urban clusters and draws on social network theory to develop a model of regional cluster performance. Strumsky (2013) [44] used an SNA to study urban innovation-related networks in the United States.
Social-network analysis is the most common method for measuring intercity flows, which can measure and analyze the relevance and complexity of the synergetic development of cities. This paper measures and analyzes the structural characteristics of network structures according to their degree centrality, betweenness centrality, average path length, and cohesive subgroups.
3.2.1. Degree Centrality
Degree centrality is the most direct indicator to describe the importance of nodes and measure the ability of a node to approach the center of the network. In the UESDN model, the greater the degree centrality of the city node is, the closer it is to the center of the network, and thus the higher its importance as a city in a particular region or country. We denoted N as the total number of city network nodes, and the in and out degrees of a given city u as . and . The degree centrality of city u is described as follows:
3.2.2. Node-betweenness Centrality
The node-betweenness centrality of a node is the sum of the proportion of the number of paths passing through the node in all shortest paths to the total number of shortest paths in the network, and it describes the ability of the node to control the transmission of elements and information along the shortest path in the network. The larger the value of a node is, the stronger that node is in transmitting factors and information as a medium. The average betweenness centrality of city u is described as follows:
where gst represents the number of shortest paths between cities s and t, and represents the number of shortest paths through city u in the gst shortest paths from city s to city t.
3.2.3. Betweenness Centrality of an Edge
The betweenness centrality of an edge is the sum of the proportion of the number of all the shortest paths passing through the connected edge to the total number of shortest paths and characterizes the intermediary control ability of the connected edge to the flow and accumulation of production elements along the shortest path. The greater the value of the betweenness centrality of the edge is, the greater the edge control effect for the flow aggregation of the whole network element.
Edge uw between cities u and w is described as follows:
where gst denotes the shortest paths from city s to city t, and denotes the number of shortest paths through uw in gst shortest paths from city s to city t.
3.2.4. Cohesive Subgroups
Cohesive subgroups can analyze a node group within the network. A cohesive subgroup exists when some nodes are closely connected and form a subgroup. This paper is based on the Concor algorithm to measure the relationship between cities.
4. Results
4.1. Evolution Analysis of Intercity Association Hierarchy
On the basis of strong industry correlation, a network under the background of industrial agglomeration was constructed through business activities. The ArcGIS visualization is shown in Figure 1.
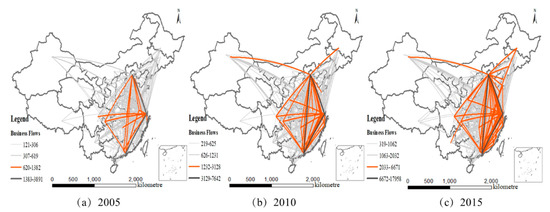
Figure 1.
Evolution analysis of intercity association hierarchy.
The calculation shows that, from 2005 to 2015, the number of inter-city business flows rose from 516,156 to 2,619,778 (407.6%), and intercity-enterprise-flow density increased from 59.04 to 156.22, indicating that the synergetic ability between cities improves with the enhancement of industrial agglomeration. Natural Breaks (Jenks) was used to classify intercity-enterprise-flow intensity into four levels and analyze various hierarchical characteristics. It can be seen from Figure 1 that Beijing, Shanghai, and Shenzhen constitute the core framework of the network, and enterprise-flow intensity is at the first level. In 2005, second-level cities in the network included Beijing, Tianjin, Shanghai, Nanjing, Hangzhou, Wuhan, Changsha, Guangzhou, Shenzhen, Chongqing, and Chengdu. The business flow between these cities was 41,546, with the average being 1122.9.
Intercity synergetic correlation was most strongly observed between the eastern and southwestern regions, with northwestern and northeastern regions not being as significant, and Chongqing, Chengdu, and Wuhan in particular being supporting cities in the southwestern region. In 2010, business flow between second-level cities was 165,824, with the average at 2591. This included Harbin in the northeast; Tianjin, Jinan, and Qingdao in the Bohai Rim; Nanjing, Wuxi, Suzhou, Hangzhou, Ningbo, Shaoxing, and Taizhou in the Yangtze River Delta; Guangzhou and Shenzhen in the Pearl River Delta; Chongqing and Chengdu in the southwest, Urumqi in the northwest, and Wuhan and Changsha in the central region, which were all closely connected with the core cities (Beijing, Shanghai, Shenzhen). Furthermore, in 2015, business flow between second-level cities was 471,815, the average was 4409.5, and newcomer cities into this level were Changchun in northeast China, Hefei in the Yangtze River Delta, Fuzhou and Xiamen in the southeastern coastal area, Yantai and Weifang in the Bohai Rim, Foshan in the Pearl River Delta, Kunming in the southwest, and Xi’an in the northwest.
Specifically, second-level-associated cities in the UESDN from 2005 to 2015 are shown in Table 1. The number of second-level cities in the network and average enterprise flows gradually increased, indicating that industrial agglomeration and synergetic-development capacity between cities strengthened. In addition, the pattern of development gradually changed from the hub-spoke model based on provincial eastern capitals to the network of eastern and central cities. Combined with the distribution of enterprises and enterprise-flow intensity, the increased enterprise flows were mainly distributed among provincial capitals and existing associated cities.

Table 1.
Cities in Urban Economic Synergetic Development Network (UESDN) from 2005 to 2015.
4.2. Analysis of Network Betweenness Centrality
The betweenness centrality of urban nodes in the network is shown in Figure 2.
Figure 2.
Network-node betweenness. Note: betweenness of remaining cities is 0.
As shown in Figure 2, in 2005, the developed provincial capital cities with significant mediation were mainly Suzhou, Hangzhou, Chongqing, Kunming, and Xi’an, and they had close interaction with others through economic factors. In 2010, with the development of the industrial economic system and urban economy, some developed cities’ intermediary role became increasingly prominent (Zhengzhou, Wuhan, Guangzhou, and Haikou). These cities are important transportation hubs that enhance the turnover ability of domestic production factors. In 2015, production factors’ transferring effect of existing cities, such as Beijing, Shanghai, Nanjing, Suzhou, Hangzhou, Wuhan, Guangzhou, Shenzhen, and Kunming, became more significant, indicating that the status of these cities further improved.
In addition, the intermediary role of Changchun, Wuxi, Ningbo, Hefei, Qingdao, and Urumqi gradually emerged in the process of national industrial-factor flow agglomeration and urban synergistic development. Wuxi, Ningbo, Hefei, and Qingdao, as eastern important central cities with a developed economy and superior location advantages, exchanged frequently with other regions. Changchun and Urumqi are, respectively, the economic, cultural, and transportation centers of the northeast and northwest, which became the fulcrum connecting the northeast and northwest with the central and eastern regions. Therefore, its intermediary role has been relatively prominent.
UESDN edge betweenness in the process of industrial agglomeration as shown in Figure 3.
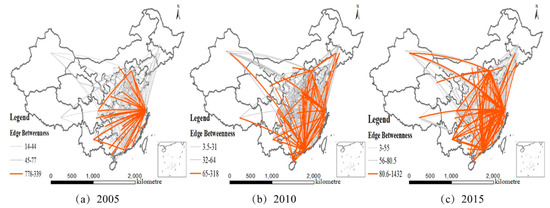
Figure 3.
Evolution of network-edge betweenness.
From 2010 to 2015, with the development of the national industrial system, the intensity and scope of exchange between cities have generally increased. The natural breakpoint was also used to divide centrality. In 2005, cities in the Yangtze River Delta were the national UESDN core, forming the pattern based on its basis to radiate to the whole country through the shortest hub. There exists the shortest hub road for the exchange of production factors between Yangtze River Delta cities and other cities such as Henan, Shaanxi, Sichuan, Yunnan, Hunan, Hubei, Guangxi, and Guangdong, indicating that these provinces and Yangtze River Delta cities have strong synergetic-development capability. Meanwhile, the role of the intermediary hub for elemental exchange between northwest, northeast, and east China is not as clear. In 2010, the ability of other peripheral cities across the country in the Beijing-Tianjin-Hebei region and Pearl River Delta cities was enhanced by the shortest path. Furthermore, the number of shortest channels between Shandong, Hebei, Sichuan, Guangdong, and the central cities in Beijing-Tianjin-Hebei Yangtze River Delta, and Pearl River Delta region generally increased, and these provinces integrated themselves into the national UESDN through several of the shortest channels. In 2015, the number of intermediary hubs between the Beijing-Tianjin-Hebei Yangtze River Delta and Pearl River Delta regions generally increased. Moreover, the association of Urumqi, Xining, and Lhasa with the Beijing-Tianjin-Hebei region and Yangtze River Delta cities constituted an intermediary hub for of factor flows between the northwestern and eastern regions. Meanwhile, the association of Changchun and Dalian with Beijing-Tianjin-Hebei region and Yangtze River Delta cities constituted an intermediary hub for factor flows between the northeastern and eastern regions, which all integrated northwest and northeast China into the national UESDN.
4.3. UESDN Central Analysis
The degree of network centrality in the process of industrial agglomeration is shown in Figure 4.
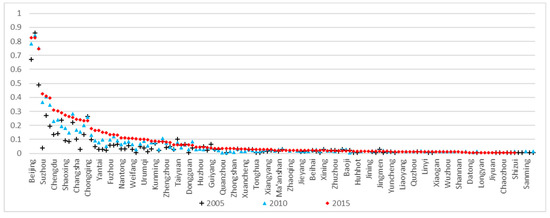
Figure 4.
Network degree-centrality values.
As shown in Figure 4, degree-centrality distribution is consistent with long-tail distribution and has an obvious trend towards the right, indicating that most cities in the process of industrial agglomeration have less influence, and a few key cities formed a relatively close network. From 2005 to 2015, the variation coefficient of degree centrality decreased from 1.993 to 1.469, which indicates that the capability gap of cities is gradually narrowing.
Here, the natural breakpoint was also used to divide degree centrality into four levels, namely national-, regional-, and provincial-core cities and general cities. Shanghai, Beijing, Shenzhen, and Hangzhou ranked in the top four as national-core cities and were thus important for the formation of the synergistic system and the improvement of circulation efficiency for production factors among cities.
From 2005 to 2015, the siphon effect of industry agglomeration in the national-core cities gradually rose, increasing the number of regional-core cities from 9 to 22. Regional-core cities were mostly located in developed provinces of the eastern, central and coastal areas, which then similarly influenced surrounding cities. From 2005 to 2015, the number of provincial-core cities increased from 17 to 29, which consisted mostly of provincial capital cities and regional developed cities. The number of general cities increased from 64 to 75.
Inverse distance weighting was used to carry out spatial-interpolation analysis of urban centrality as shown in Figure 5. In 2005, we found that the pattern showed five relatively dispersed industrial-agglomeration centers as the highland in Beijing and Tianjin, Chongqing, Shanghai and Nanjing, Wuhan, Guangzhou, and Shenzhen. Then, in 2011, Chengdu, Xi’an, Wuxi, Nanjing, Ningbo, and other cities were added to this category. During this time, the axis of the Yangtze River Economic Belt composed of Chengdu-Wuhan-Yangtze River Delta also gradually emerged. In 2015, industrial-agglomeration centers based in Harbin, Yantai, Qingdao, Changsha, Kunming, Hefei, and Urumqi were added, and Changsha and Hefei became new members of the axis of the Yangtze River economic belt. Since then, the western economic axis consisting of Xi’an-Chengdu-Kunming, and the eastern coastal economic axis consisting of Beijing-Tianjin-Hebei-Shandong Peninsula-Yangtze River Delta-Pearl River Delta, gradually appeared, forming the pattern of two verticals and one horizontal. Finally, the new highlands of urban economic development emerged with Harbin as the core in the northeast and Urumqi in the northwest.
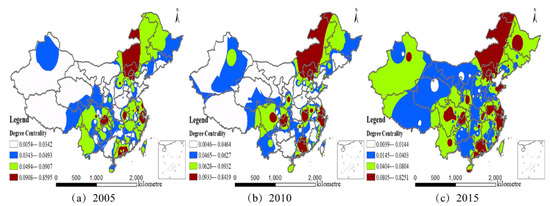
Figure 5.
Network degree-centrality evolution.
4.4. Cohesion-Subgroup Analysis in UESDN Network
The Concord subgroup based on the Concord algorithm can measure the group phenomenon in the UESDN and calculate the urban-core degree through a network core-edge structure to quantify the synergistic effect of the core city on the edge. Compared with degree centrality, core degree is less dependent on geographic distribution.
Figure 6 shows that the relevant cities can be divided into six kinds of subgroups, with the core value within subgroups 1–3 being larger. In 2005, cities in subgroup 1 consisted of Shanghai, Beijing, and Shenzhen, with Chongqing, Nanjing, Wuhan, Guangzhou, and Wuxi added in 2010. By 2015, Tianjin, Suzhou, Changsha, Shaoxing, and Taizhou were added, whose core degree was at the first level, indicating that cities in subgroup 1 were the core fulcrum and had a strong driving effect on others. Subgroup density was one in three years (i.e., those cities were closely related and had a more obvious boosted effect on urban synergy with the flow of industrial elements). Core fulcrums were gradually expanded from the three nation-core cities to encompass coastal and Yangtze River Economic Belt areas. Subgroup 2 mainly consisted of provincial capital cities and a few regional developed cities, whose core degrees were at the first or second level.
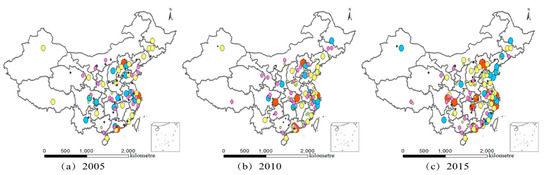
Figure 6.
Core degree and evolution of cohesive subgroups in network. Note: Point color, subgroup classification; point size, r city-core level.
In 2005, subgroup 2 included 14 cities, including Tianjin, Zhengzhou, Hefei, Chengdu, Shenyang, Jinan, and Kunming. Xi’an, Haikou, Ningbo, and Harbin were added to sum up to 19 cities by 2010, and Qingdao, Dalian, Urumqi, Shenyang, and Fuzhou were added to comprise a total of 24 cities in 2015. The network density of subgroup 2 increased from 0.46 to 0.52, and then to 0.56, indicating that cities in subgroup 2 were relatively well-connected. The number of cities and the intensity of synergistic development had an increasing trend with the continuous expansion of the industrial system.
From 2005 to 2015, the number of cities in subgroup 3 increased from 22 to 34, which consisted of mainly eastern coastal cities such as Dongguan, Zhuhai, Wuhu, Yangzhou, Quanzhou, Wenzhou, Lianyungang, and other provincial capital cities (e.g., Shijiazhuang, Nanchang, Changchun, Guiyang, and Jilin). To some extent, the core degree of these cities increased, mostly in the second and third levels, which implied that the number of core fulcrums and their influence on the pattern under the background of industrial agglomeration are constantly increased. Subgroups 4–6 were mostly prefecture-level cities in various regions. Although core degree and subgroup density slightly increased, they remained at a relatively low level. In addition, the variation coefficient of subgroup density decreased from 1.028 to 0.826 between 2005 and 2015, indicating that the urban-group pattern tended to be balanced. Furthermore, average density within the six subgroups increased from 0.129 to 0.261, showing that self-organization and correlation increased within each subgroup.
5. Discussion
The technological-economic relationship between industries is the basis of UESDN, as the measured agglomeration level affects the function and status of a city in regional and national network systems. We found that the UESDN is relatively concentrated in eastern and central regions and needs to be further improved among western cities. In the UESDN, a few key cities with a developed economy and superior location advantages play the intermediary role of carrying the economic factors circulating between cities over the shortest path. Beijing, Shanghai, and Shenzhen formed the core framework of the UESDN and became the hub of productive factors’ flow and agglomeration in that process, which have strong control over the flow of economic elements along the shortest paths. This finding is consistent with the existing ranking of Chinese cities in the world economy.
From 2005 to 2015, with the comprehensive implementation of the national regional synergetic-development strategy and the improvement of the industrial system, the industrial-agglomeration capability of core cities among the major city groups became clear. The core degree of eastern coastal cities, provincial eastern and central capitals, and the developed cities of major city groups all increased. These cities were mostly in the center of the network. However, some general cities with lower cores were in the subordinate status due to constraints of population, location, and economic-development level. Strengthening the association between general and core cities is an important way to promote UESDN construction and systems.
Thus, some suggestions are put forward.
- (1)
- Building a national urban synergetic-development system is a systematic and holistic project; therefore, all cities should actively optimize their industrial structure, extend and broaden the industrial chain to strengthen interindustry cooperation by combining regional industrial comparative advantages, strengthen industrial agglomeration, and improve the urban industrial-development system.
- (2)
- All provinces should focus on the integration of production factors across cities, and the former should rely on their individual industrial conditions and the scale of existing production factors. The industrial-agglomeration spillover effect of regional-core cities should be utilized to strengthen the exchange of elements with core cities, promote the deep integration of regional economies, and accelerate UESDN development.
- (3)
- Effort should be made to strengthen the construction of infrastructure and public services and eliminate the restrictive elements of cross-regional flow. It is also important to support the cross-city and interprovincial flow of production factors with modern integrated transportation systems and information services.
- (4)
- When formulating the urban economy synergetic-development strategy, the coordination and adaptability of the relationships between industries, businesses, and cities should be emphasized. In addition, stimulating the internal driving force of industrial agglomeration and leading the investment layout of enterprises according to market capacity are also necessary.
6. Conclusions
From 2005 to 2015, we found that strong correlations between industries increased from 210 to 279, the number of intercity business flows rose from 516,156 to 2,619,778, the number of second-level cities in the network and average enterprise flows gradually increased, the variation coefficient of degree centrality decreased from 1.993 to 1.469, average density within the six subgroups increased from 0.129 to 0.261 etc. This indicated that with the construction of the national infrastructure network and the improvement of the industrial system, the exchange of production factors among cities was strengthened in terms of their relationships. The urban–economic correlation network resulted from the extensive improvement of industrial-agglomeration intensity. On the basis of industrial input–output correlation, the UESDN was constructed to analyze industrial agglomeration, which has an important role in promoting the sustainable development of the urban economy and building a national synergetic development system.
To summarize, this study constructed a UESDN for China by considering the relationship of industrial agglomeration between cities and analyzing network-structure characteristics. UESDN degree centrality, betweenness centrality, and cohesive subgroups were computed using models in complex-network theory before concluding with relevant policy suggestions based on the results. However, some limitations still exist in this study that need to be addressed in future research. For example, due to problems with data collection, enterprises now mostly adopt diversified business models and have multiple business operations. However, guidance on the industry classification of listed companies only clarifies the main business of listed companies and does not consider other subsidiary businesses. Therefore, we were unable to comprehensively consider the impact of all business operations of the listed companies on the urban economic coordinated development network. When we are able to obtain the related data, we aim to build a more comprehensive and detailed urban economic-development network. In addition, this paper used input–output theory to build an urban economic coordinated development network model on the basis of the correlation of all industries. In future studies, we can further consider the use of environmentally extended input–output analysis (EEIOA), which only analyzes the impact of industries closely related to the environment so as to make it more intuitive to analyze the sustainable development of the urban economy.
Author Contributions
Conceptualization, C.W. and Q.M.; methodology, C.W. and Q.M.; formal analysis, Q.M. and C.W.; writing—original-draft preparation, C.W. and Q.M.; writing—review and editing, Q.M. and C.W.; visualization, C.W. and Q.M.; supervision, Q.M. and C.W. All authors have read and agreed to the published version of the manuscript.
Funding
This research was funded by the Key Project of the National Social Science Fund of China (grant no. 16AZD009), the National Nature Science Foundation of China (grant no. 71803105), and General Program of Soft Science Research Project of Shandong Province (grant no.2019RKB01187).
Conflicts of Interest
The authors declare no conflict of interest. The funders had no role in the design of the study; in the collection, analyses, or interpretation of data; in the writing of the manuscript, or in the decision to publish the results.
References
- Report of the Nineteenth National Congress of the Communist Party of China. Available online: http://cpc.people.com.cn/n1/2017/1028/c64094-29613660.html (accessed on 19 August 2019).
- Monstadt, J. Conceptualizing the political ecology of urban infrastructures: Insights from technology and urban studies. J. Environ. Plann. Man. 2009, 41, 1924–1942. [Google Scholar] [CrossRef]
- Marshall, J.U. Beyond the rank-size rule: A new descriptive model of city sizes. J. Urban Geogr. 1997, 18, 36–55. [Google Scholar] [CrossRef]
- Perroux, F. Economic space: Theory and applications. Q. J. Econ. 1950, 64, 89–104. [Google Scholar] [CrossRef]
- Rondinelli, D.A. Regional disparities and investment allocation policies in the Philippines: Spatial dimensions of poverty in a developing country. CJDS/CASID 1980, 1, 262–287. [Google Scholar] [CrossRef]
- Haughton, G.; Rowe, I.; Hunter, C. The Thames Gateway and the re-emergence of regional strategic planning: The implications for water resource management. JSTOR 1997, 68, 407. [Google Scholar] [CrossRef]
- Rogers, P.P.; Jalal, K.F.; Boyd, J.A. An Introduction to Sustainable Development; Routledge: London, UK, 2012. [Google Scholar]
- Castells, M. The Rise of the Network Society, 2nd ed.; Wiley-Blackwell: New York, NY, USA, 2011. [Google Scholar]
- Haken, H. Synergetics: Introduction and Advanced Topics; Third Revised and Enlarged Edition; Springer-Verlag Berlin Heidelberg: Berlin, Germany, 2013. [Google Scholar]
- Watson, A.; Beaverstock, J.V. World City Network Research at a Theoretical Impasse: On the Need to R e-Establish Qualitative Approaches to Understanding Agency in World City Networks. Tijdschr. Econ. Soc. Geogr. 2014, 105, 412–426. [Google Scholar] [CrossRef]
- Taylor, P.; Derudder, B. World City Network: A Global Urban Analysis, 2nd ed.; Routledge: London, UK, 2015. [Google Scholar]
- Batty, M. The New Science of Cities; MIT Press: Cambridge, MA, USA, 2013. [Google Scholar]
- Castells, M. Networks of Outrage and Hope: Social Movements in the Internet Age, 2nd ed.; Wiley-Blackwell: New York, NY, USA, 2015. [Google Scholar]
- Huggins, R.; Thompson, P. A network-based view of regional growth. J. Econ. Geogr. 2013, 14, 511–545. [Google Scholar] [CrossRef]
- Krugman, P. The new economic geography, now middle-aged. J. Reg. Stud. 2011, 45, 1–7. [Google Scholar] [CrossRef]
- Fujita, M.; Thisse, J.F. New economic geography: An appraisal on the occasion of Paul Krugman’s 2008 Nobel Prize in Economic Sciences. RSUE 2009, 39, 109–119. [Google Scholar] [CrossRef]
- Ellison, G.; Glaeser, E.L.; Kerr, W.R. What causes industry agglomeration? Evidence from coagglomeration patterns. Am. Econ. Rev. 2010, 100, 1195–1213. [Google Scholar] [CrossRef]
- Zhang, Y.; Zhao, X. Testing the scale effect predicted by the Fujita–Krugman urbanization model. IJEBO 2004, 55, 207–222. [Google Scholar] [CrossRef]
- Swann, P.; Prevezer, M. A comparison of the dynamics of industrial clustering in computing and biotechnology. Res. Policy. 1996, 25, 1139–1157. [Google Scholar] [CrossRef]
- Porter, M.E. Clusters and the new economics of competition. Harv. Bus. Rev. 1998, 76, 77–90. [Google Scholar] [PubMed]
- Lin, C.H.; Tung, C.M.; Huang, C.T. Elucidating the industrial cluster effect from a system dynamics perspective. Technovation 2006, 26, 473–482. [Google Scholar] [CrossRef]
- Delgado, M.; Porter, M.E.; Stern, S. Clusters, convergence, and economic performance. Res. Policy. 2014, 43, 1785–1799. [Google Scholar] [CrossRef]
- Gereffi, G.; Lee, J. Economic and social upgrading in global value chains and industrial clusters: Why governance matters. J. Bus. Ethics 2016, 133, 25–38. [Google Scholar] [CrossRef]
- Chen, W.; Huang, X.; Liu, Y. The Impact of High-Tech Industry Agglomeration on Green Economy Efficiency—Evidence from the Yangtze River Economic Belt. Sustainability. 2019, 11, 5189. [Google Scholar] [CrossRef]
- Higgins, B. Regional Development Theories and Their Application, 1st ed.; Routledge: London, UK, 2017. [Google Scholar]
- Li, H.D.; Wang, S.; Liu, Y. Evaluation method and empirical research of regional synergetic development degree based on grey relational theory and distance collaborative model. J. Syst. Sci. Syst. Eng. 2014, 34, 1749–1755. (In Chinese) [Google Scholar]
- Li, G.R.; Ma, M.N.; Ding, Y.Y. Analysis of evolution and comparison about the regional economic development in China. Stat. Sci. 2010, 316–320. [Google Scholar]
- Ke, J. Study on coordinated development of regional resource- environment -economy system—A case study of Anhui province. ADAS 2008, 1785–1790. [Google Scholar]
- Shao, S.; Tian, Z.; Yang, L. High speed rail and urban service industry agglomeration: Evidence from China’s Yangtze River Delta region. J. Transp. Geogr. 2017, 64, 174–183. [Google Scholar] [CrossRef]
- Derudder, B.; Taylor, P.J. Central flow theory: Comparative connectivities in the world-city network. J. Reg. Stud. 2018, 52, 1029–1040. [Google Scholar] [CrossRef]
- Wang, L.; Yang, W.; Yuan, Y. Interurban Consumption Flows of Urban Agglomeration in the Middle Reaches of the Yangtze River: A Network Approach. Sustainability 2019, 11, 268. [Google Scholar] [CrossRef]
- Sigler, T.J.; Martinus, K. Extending beyond ‘world cities’ in World City Network (WCN) research: Urban positionality and economic linkages through the Australia-based corporate network. Environ. Plan A 2017, 49, 2916–2937. [Google Scholar] [CrossRef]
- Pan, F.; Bi, W.; Lenzer, J. Mapping urban networks through inter-firm service relationships: The case of China. J. Urban. Plan. D-Asce 2017, 54, 3639–3654. [Google Scholar] [CrossRef]
- Pan, F.; He, Z.; Sigler, T. How Chinese financial centers integrate into global financial center networks: An empirical study based on overseas expansion of Chinese financial service firms. Chin. Geogr. Sci. 2018, 28, 217–230. [Google Scholar] [CrossRef]
- Taylor, P.J. Is the UK big enough for both London and England? Editorial comment. Environ. Plan. A 1997, 29, 766–770. [Google Scholar]
- Zhao, B.X.; Zhang, J.H. Introduction to Industrial Network Theory; Economic Science Press: Beijing, China, 2013. (In Chinese) [Google Scholar]
- China Securities Regulatory Commission. Guidelines for the Classification of Listed Companies. Available online: http://www.csrc.gov.cn/pub/newsite/scb/ssgshyfljg/ (accessed on 19 August 2019).
- Pan, F.H.; Liu, Z.L.; Xia, Y.B. Location and agglomeration of headquarters of public listed firms within China’s urban system. Geogr. Sci. Res. 2013, 32, 1721–1736. (In Chinese) [Google Scholar]
- National Bureau of Statistics. Input output table of China. Available online: http://data.stats.gov.cn/ifnormal.htm?u=/files/html/quickSearch/trcc/trcc01.html&h=740 (accessed on 6 August 2019).
- Guotai An Data Service Center. Data of A-share listed companies in China. Available online: http://www.gtarsc.com/ (accessed on 19 August 2019).
- Pain, K.; Van Hamme, G.; Vinciguerra, S. Global networks, cities and economic performance: Observations from an analysis of cities in Europe and the USA. Urban Stud. 2016, 53, 1137–1161. [Google Scholar] [CrossRef]
- TerWal, A.L.; Boschma, R.A. Applying social network analysis in economic geography: Framing some key analytic issues. Ann. Reg. Sci. 2009, 43, 739–756. [Google Scholar] [CrossRef]
- Eisingerich, A.B.; Bell, S.J.; Tracey, P. How can clusters sustain performance? The role of network strength, network openness, and environmental uncertainty. Res. Policy 2010, 39, 239–253. [Google Scholar] [CrossRef]
- Strumsky, D.; Thill, J.C. Profiling US metropolitan regions by their social research networks and regional economic performance. J. Reg. Sci. 2013, 53, 813–833. [Google Scholar] [CrossRef]


© 2020 by the authors. Licensee MDPI, Basel, Switzerland. This article is an open access article distributed under the terms and conditions of the Creative Commons Attribution (CC BY) license (http://creativecommons.org/licenses/by/4.0/).