Article

An Evaluation of Restocking Practice and Demographic Stock Assessment Methods for Cryptic Juvenile European Eel in Upland Rivers

1
Laboratory of Fish Demography and Hydroecology, Biology of Behaviour Unit, Freshwater and Oceanic science Unit of Research-FOCUS, University of Liège, 22 Quai E. Van Beneden, B-4020 Liège, Belgium
2
DGO3-DNF-Fisheries Service, Public Service of Wallonia, 5100 Jambes, Belgium
*
Author to whom correspondence should be addressed.
Sustainability 2020, 12(3), 1124; https://doi.org/10.3390/su12031124
Submission received: 26 November 2019 / Revised: 29 January 2020 / Accepted: 2 February 2020 / Published: 5 February 2020
(This article belongs to the Section Environmental Sustainability and Applications)

Abstract

:
Restocking of the critically endangered European eel Anguilla anguilla is widespread, but it is rarely scientifically evaluated. Methods used to assess its associated performance by estimating the survival rate and implement restocking for maximum recruitment in rivers have not yet been investigated. Based on two glass eel restocking events using a single release site/point and multiple sites per river performed in upland rivers (>340 km from the North Sea), the recruitment success of stocked eels was scientifically evaluated during a 3-year study using multiple capture-mark-recapture methods and mobile telemetry. We compared the observed data with the data estimated from the Telemetry, De Lury and Jolly-Seber stock assessment methods. For recruitment data, Telemetry was very close to Jolly-Seber, an appropriate stock assessment method for open populations. Using the best model of Jolly-Seber, survival probability was higher (>95%) in both restocking practices, but recruitment yields were higher and densities of stocked eels were lower in multiple sites compared to a single site. Our results suggest that Telemetry can help to rapidly assess cryptic juvenile eel stocks with good accuracy under a limited number of capture-mark-recapture sessions. Artificial dispersal of glass eels on several productive habitats/sites per river appears to be the better-suited practice for restocking.

1. Introduction

The European eel (Anguilla anguilla L.) is a critically endangered fish species because of human activities and climate change in continental and oceanic ecosystems [1,2]. Habitat loss, fragmentation by barriers along the freshwater systems, turbine mortality, overfishing, parasite dissemination, pollution and changes in oceanic currents caused the decline of the eel population. This species is a panmictic and semelparous species, and it spawns and dies in the Sargasso Sea [3,4,5,6]. After emergence, the eel leptocephali larvae migrate along with the Gulf Stream, the North Atlantic Current and the Azores Current towards the coasts of Europe and northwest Africa [7]. They metamorphose into the post-larval transparent glass eels upon reaching the continental shelf [8]. Some individuals remain in brackish and marine waters without ever entering freshwaters [9], while others enter inland waters and colonise, as pigmented elvers, a wide range of upstream habitats (depending mainly on eel density and water temperature) [10,11,12,13]. Elvers become yellow eels, the highly sedentary period of the life cycle [14]. Yellow eels remain in freshwaters for 3–15 years, until they are ready to migrate out of rivers and estuaries as silver eels, a pre-pubertal stage [2,15]. Silver eels achieve sexual maturation as they swim actively to the Sargasso Sea spawning grounds where they reproduce and die [3,16,17,18,19].
Since the 1970s, the eel stocks have steadily declined throughout their distribution ranges and appear to have reached a historical minimum level in recent years [13,20,21]. For more than half a century, the decline in the abundance of eel stocks and fishing yields worldwide has been estimated to be approximately 5% per year, which is less than 10% of their historical levels [21]. From 1980 to 2010, recruitment of glass eels from the ocean towards the continent has continuously decreased by approximately 15% per year, which is 1% to 10% of its previous levels [20,21]. In inland water of the Meuse River in Belgium, more than 320 km upstream from the North Sea, the estimated yellow eel stocks have dropped by about 4.9% per year from 1993 to 2013. In 2013, the level was 1.6% of the stock recorded in 1993 [22,23]. Similarly, the number of new yellow eels that enter the Belgian Meuse River basin from the North Sea via the Dutch Meuse River has drastically declined by about 3.7% per year from 1992 to 2019. In 2019, the level was 1.2% of the historical number recorded in 1992 [20]. These declines of eels in the Belgian Meuse River have been accompanied with an increase in body size and a loss of upstream colonisation behaviour linked to a density dependence mechanism, and thus the reason for these declines is clearly the riverine recruitment failure from the North Sea [2,13,24]. In this context, the upper habitats of inland waters in the Belgian Meuse River are continually emptying themselves of their eels because of the progressive departure of the oldest individuals at the silver eel stage and the shutdown of the natural immigration of wild eels from the North Sea.
These critical eel stock levels led to the application of conservation measures for stock recovery and management plans for eel fisheries [25]. Among the conservation measures for inland waters that are distant from the sea, restocking is the only solution that enhances the local stocks and is probably the best long-term plan to meet the silver eel escapement target in the Eel Recovery Plan of the European Union [2,26,27]. As the success of artificial reproduction in captivity has not yet been achieved, restocking is totally dependent on wild-caught glass eels and elvers that were translocated from estuarine environments to riverine habitats with low or no natural immigration [2,28]. In their new freshwater environments, the stocked young eels are surviving, dispersing, growing and maturing into silver eels that are displaying similar seaward migration behaviour to the naturally recruited wild eels. Therefore, they are probably able to successfully contribute to the spawning stocks [2,27,29,30,31,32,33,34,35,36,37]. Such encouraging outcomes are signs of significant progress in the knowledge restocking practice; thus, there is a great hope for inland waters where the eel stocks are declining [38]. Restocking of eels is widespread, but it is rarely scientifically monitored. Few studies have focused on survival, growth, dispersal and movement of the stocked eels in lowland rivers [39,40], marshes and lagoons [31,41] and lakes [27,29,34]. Indeed, little is known about which procedure is best for implementing restocking with maximum survival in opened inland riverine ecosystems and how to accurately assess the level of restocking success in absence of multiple mark and recapture sessions for early developmental stages of species exhibiting cryptic behaviour that are unnaturally present in upland riverine ecosystems [2,28,39,40]. The poor understanding of the restocking practice and the lack of knowledge in appropriate stock assessment methods to precisely measure the real level of restocking success for producing higher catch yields are limiting the implementation of the effective conservation-restocking programme [41,42].
To bridge this knowledge gap, we examined the survival of the stocked glass eels at two reference sites located in upland Belgian rivers, stocked using the single and multiple release site strategies. During a 3-year study, at each reference site, the same river stretch was monitored and the level of restocking success assessed using four different stock assessment methods. The Observation, Telemetry and De Lury stock assessment methods that shared the advantage of being able to assess stock at each electrofishing session [2,43,44,45]. The Observation and De Lury methods are based on the catch success, while the Telemetry method is based on the catchability of the tagged eels detected during a tracking session that precedes an electrofishing session performed on the same day. The Jolly-Seber method is based on multiple time-spaced electrofishing sessions before providing a stock history associated with each electrofishing session [46,47,48]. The present study aimed to determine the most appropriate stock assessment method in terms of abundance, yield in abundance and density of stocked eels given the lack of multiple capture-mark-recapture sessions, as well as the best restocking practice of glass eels in rivers (single or multiple sites).

2. Materials and Methods
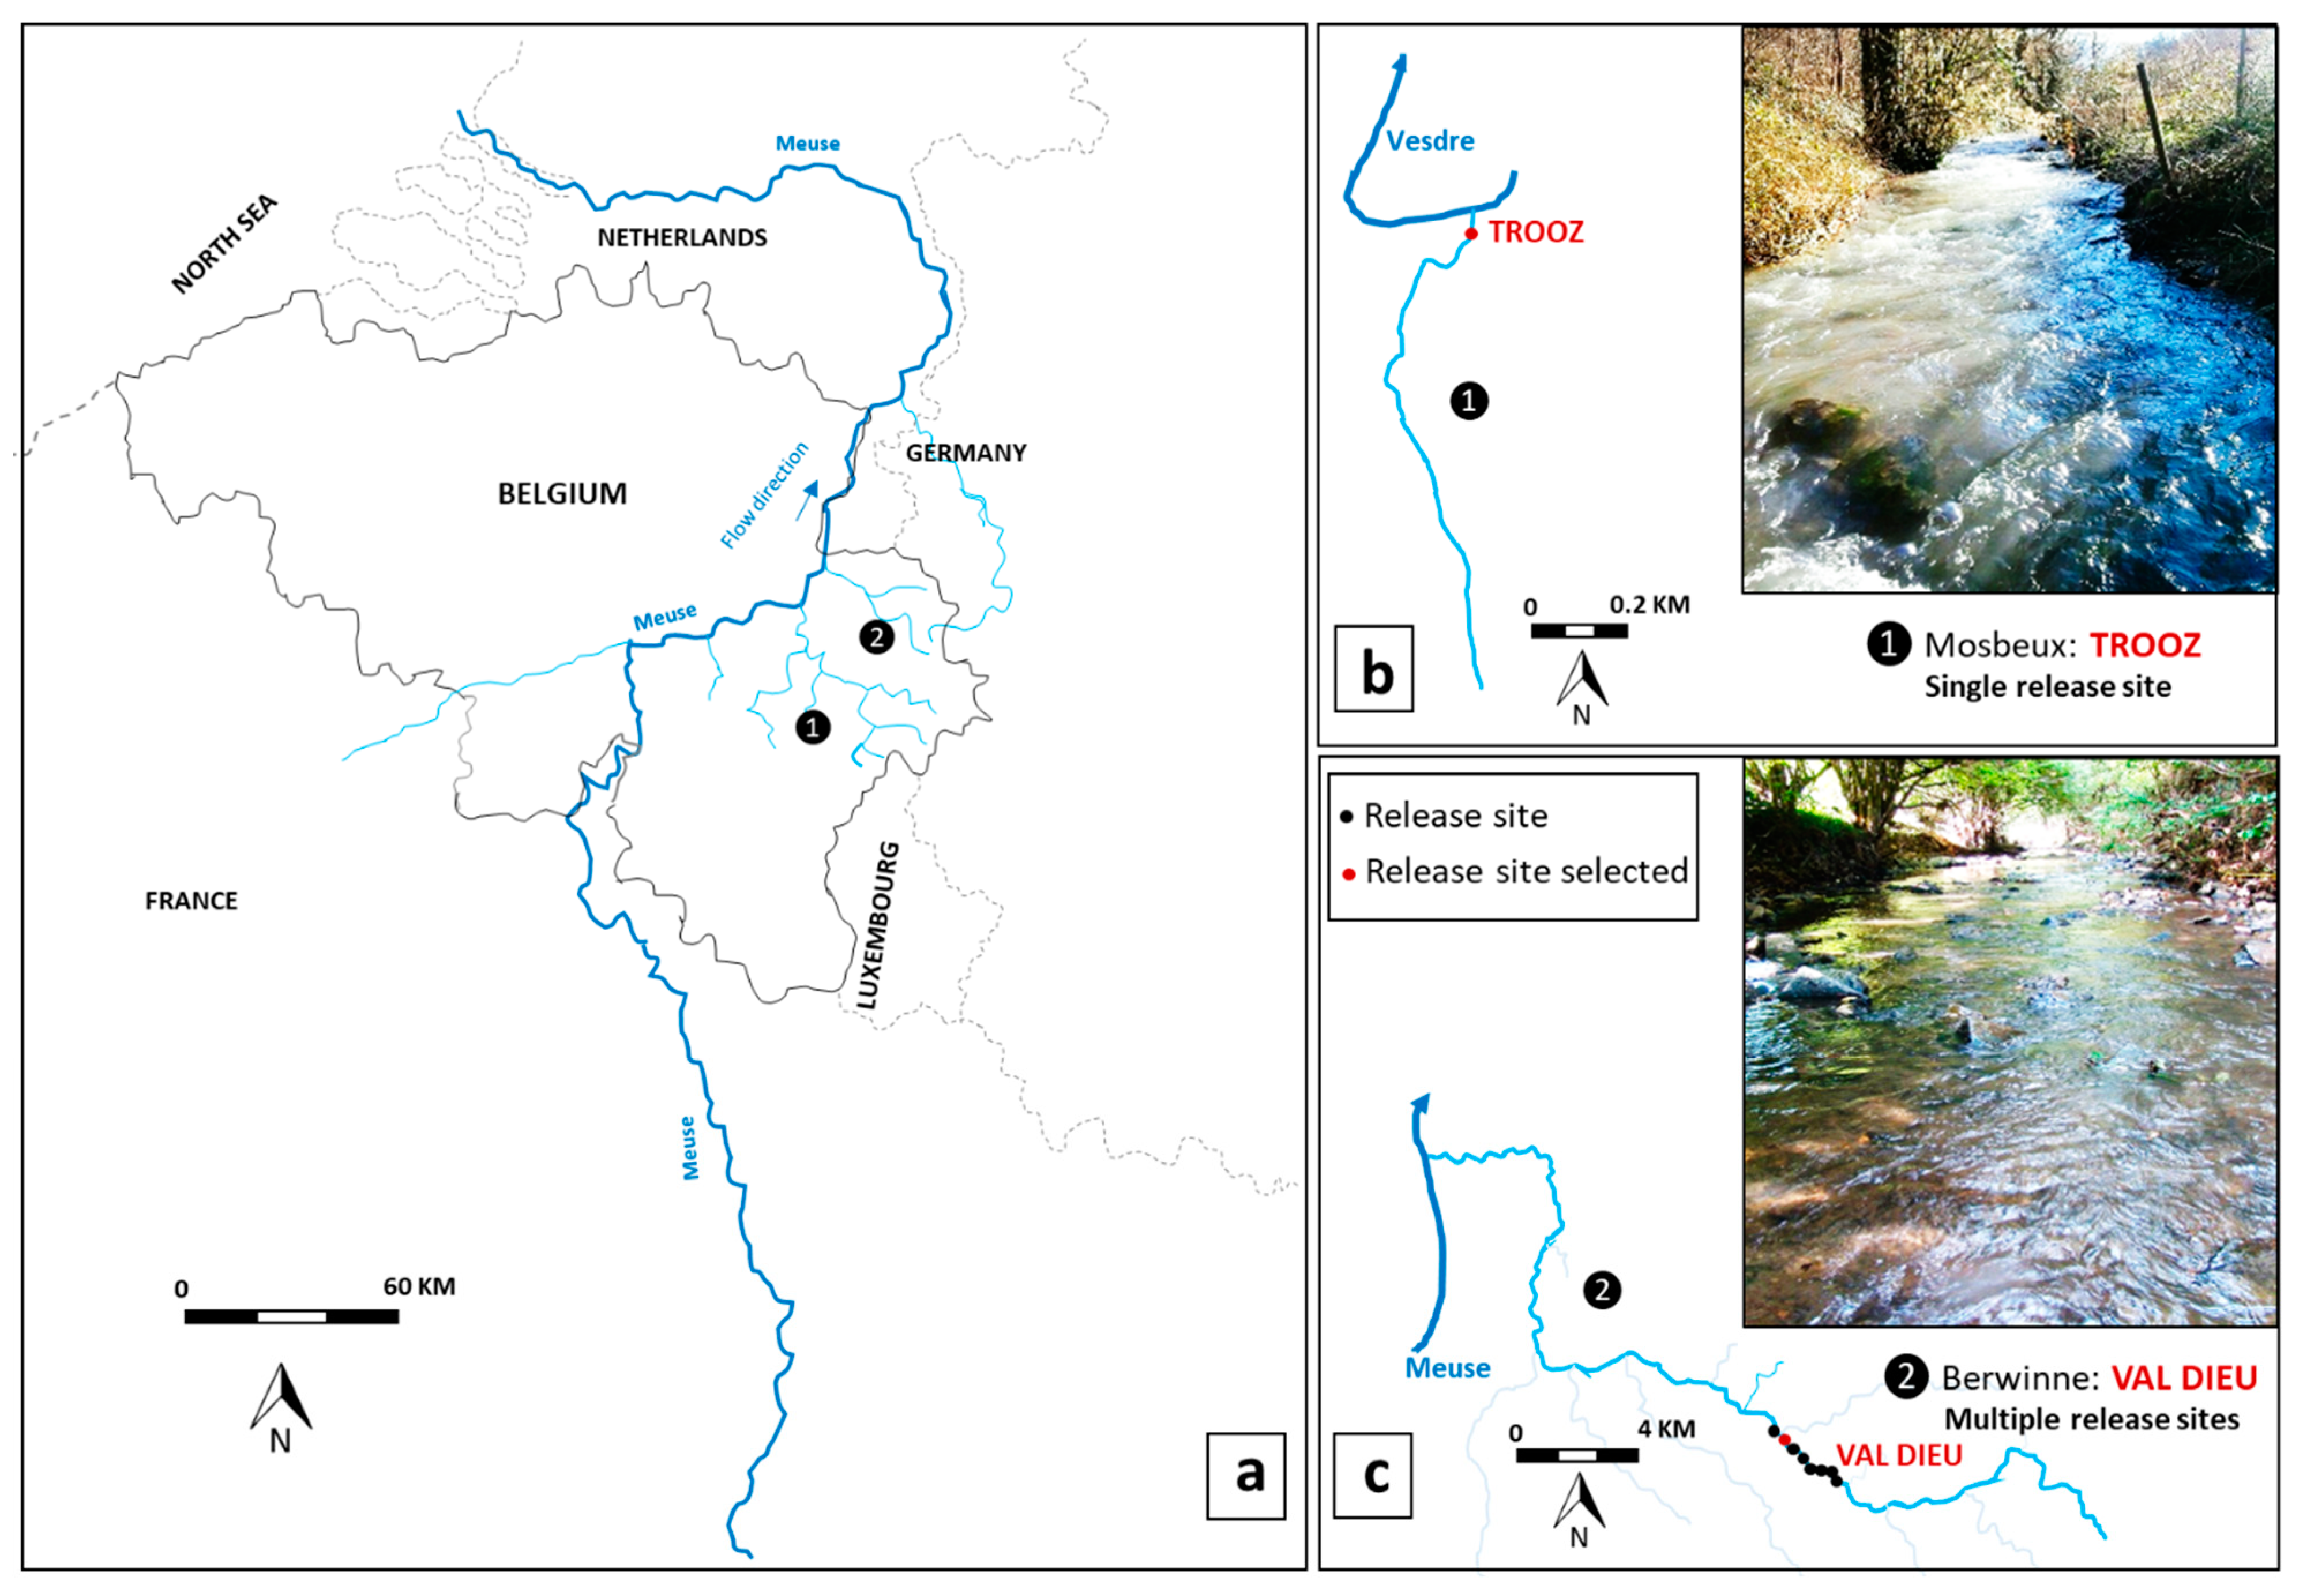
2.1. Study Site

The study was conducted in two upland rivers (Mosbeux and Berwinne) that belong to the Belgian Meuse River basin in Southern Belgium, located > 340 km from the North Sea (Table 1 and Figure 1). These rivers are typical of the brown trout Salmon trutta fish zone [49], with large stones and blocks as predominant substrata. The Mosbeux River has a catchment area of 19.16 km2 and is 6.36 km in length, with a mean width and depth of 2.70 m and 15.20 cm, respectively. It flows directly into the Vesdre, a tributary of the Ourthe, which drains into the Meuse. The Berwinne River runs directly into the Meuse, with a catchment area of 118.0 km2, and is 32.0 km in length, while the mean width and depth are 5.8 m and 20.0 cm, respectively.
These study sites were selected because they were subjected to restocking with imported glass eels and presented the highest level of eel recruitment. The reference site of Trooz in the Mosbeux River was the best site selected among three sites that belong to three rivers stocked on 22 May 2013 with a single release site/point per river using n = 4155 glass eels caught in the UK freshwater environment and imported through a commercial eel trade company (UK Glass Eels Ltd., Gloucester, UK) [2,28]. The reference site of Val Dieu, located in the Berwinne River, was the best site selected among 43 sites from six rivers stocked on 21 March 2017, with multiple release sites per river using glass eels (density 2.4 kg/ha) caught on France’s Atlantic coast and imported through a commercial eel trade company (SAS Gurruchaga Marée, France). The Berwinne River had eight release sites spaced 250 m apart, and each site was stocked with n = 1586 glass eels. Pigment stages of imported glass eels were identified according to description made by Elie et al. [50].
During the study period (2013 to 2019), at each reference site, the water temperature was continuously recorded using TidbiT v2 data loggers (Onset Computer Corporation, Bourne, Massachusetts). The physicochemical parameters were measured monthly and revealed a physicochemical proximity of the two rivers that are within the normal tolerance range of eel with regard to its vital requirements [2,51,52]. The fish community at the reference sites was analysed by using electrofishing surveys. The Mosbeux River community was found to contain 11 species, with the most abundant species being the bullhead Cottus rhenanus and the brown trout, and the Berwinne River had nine species, with the most abundant species being the bullhead and the stone loach Barbatula barbatula. The number of old resident eels (total length > 55 cm) was very low in both study areas (density: Mosbeux = 0.003 eels m−1; Berwinne = 0.005 eels m−1).

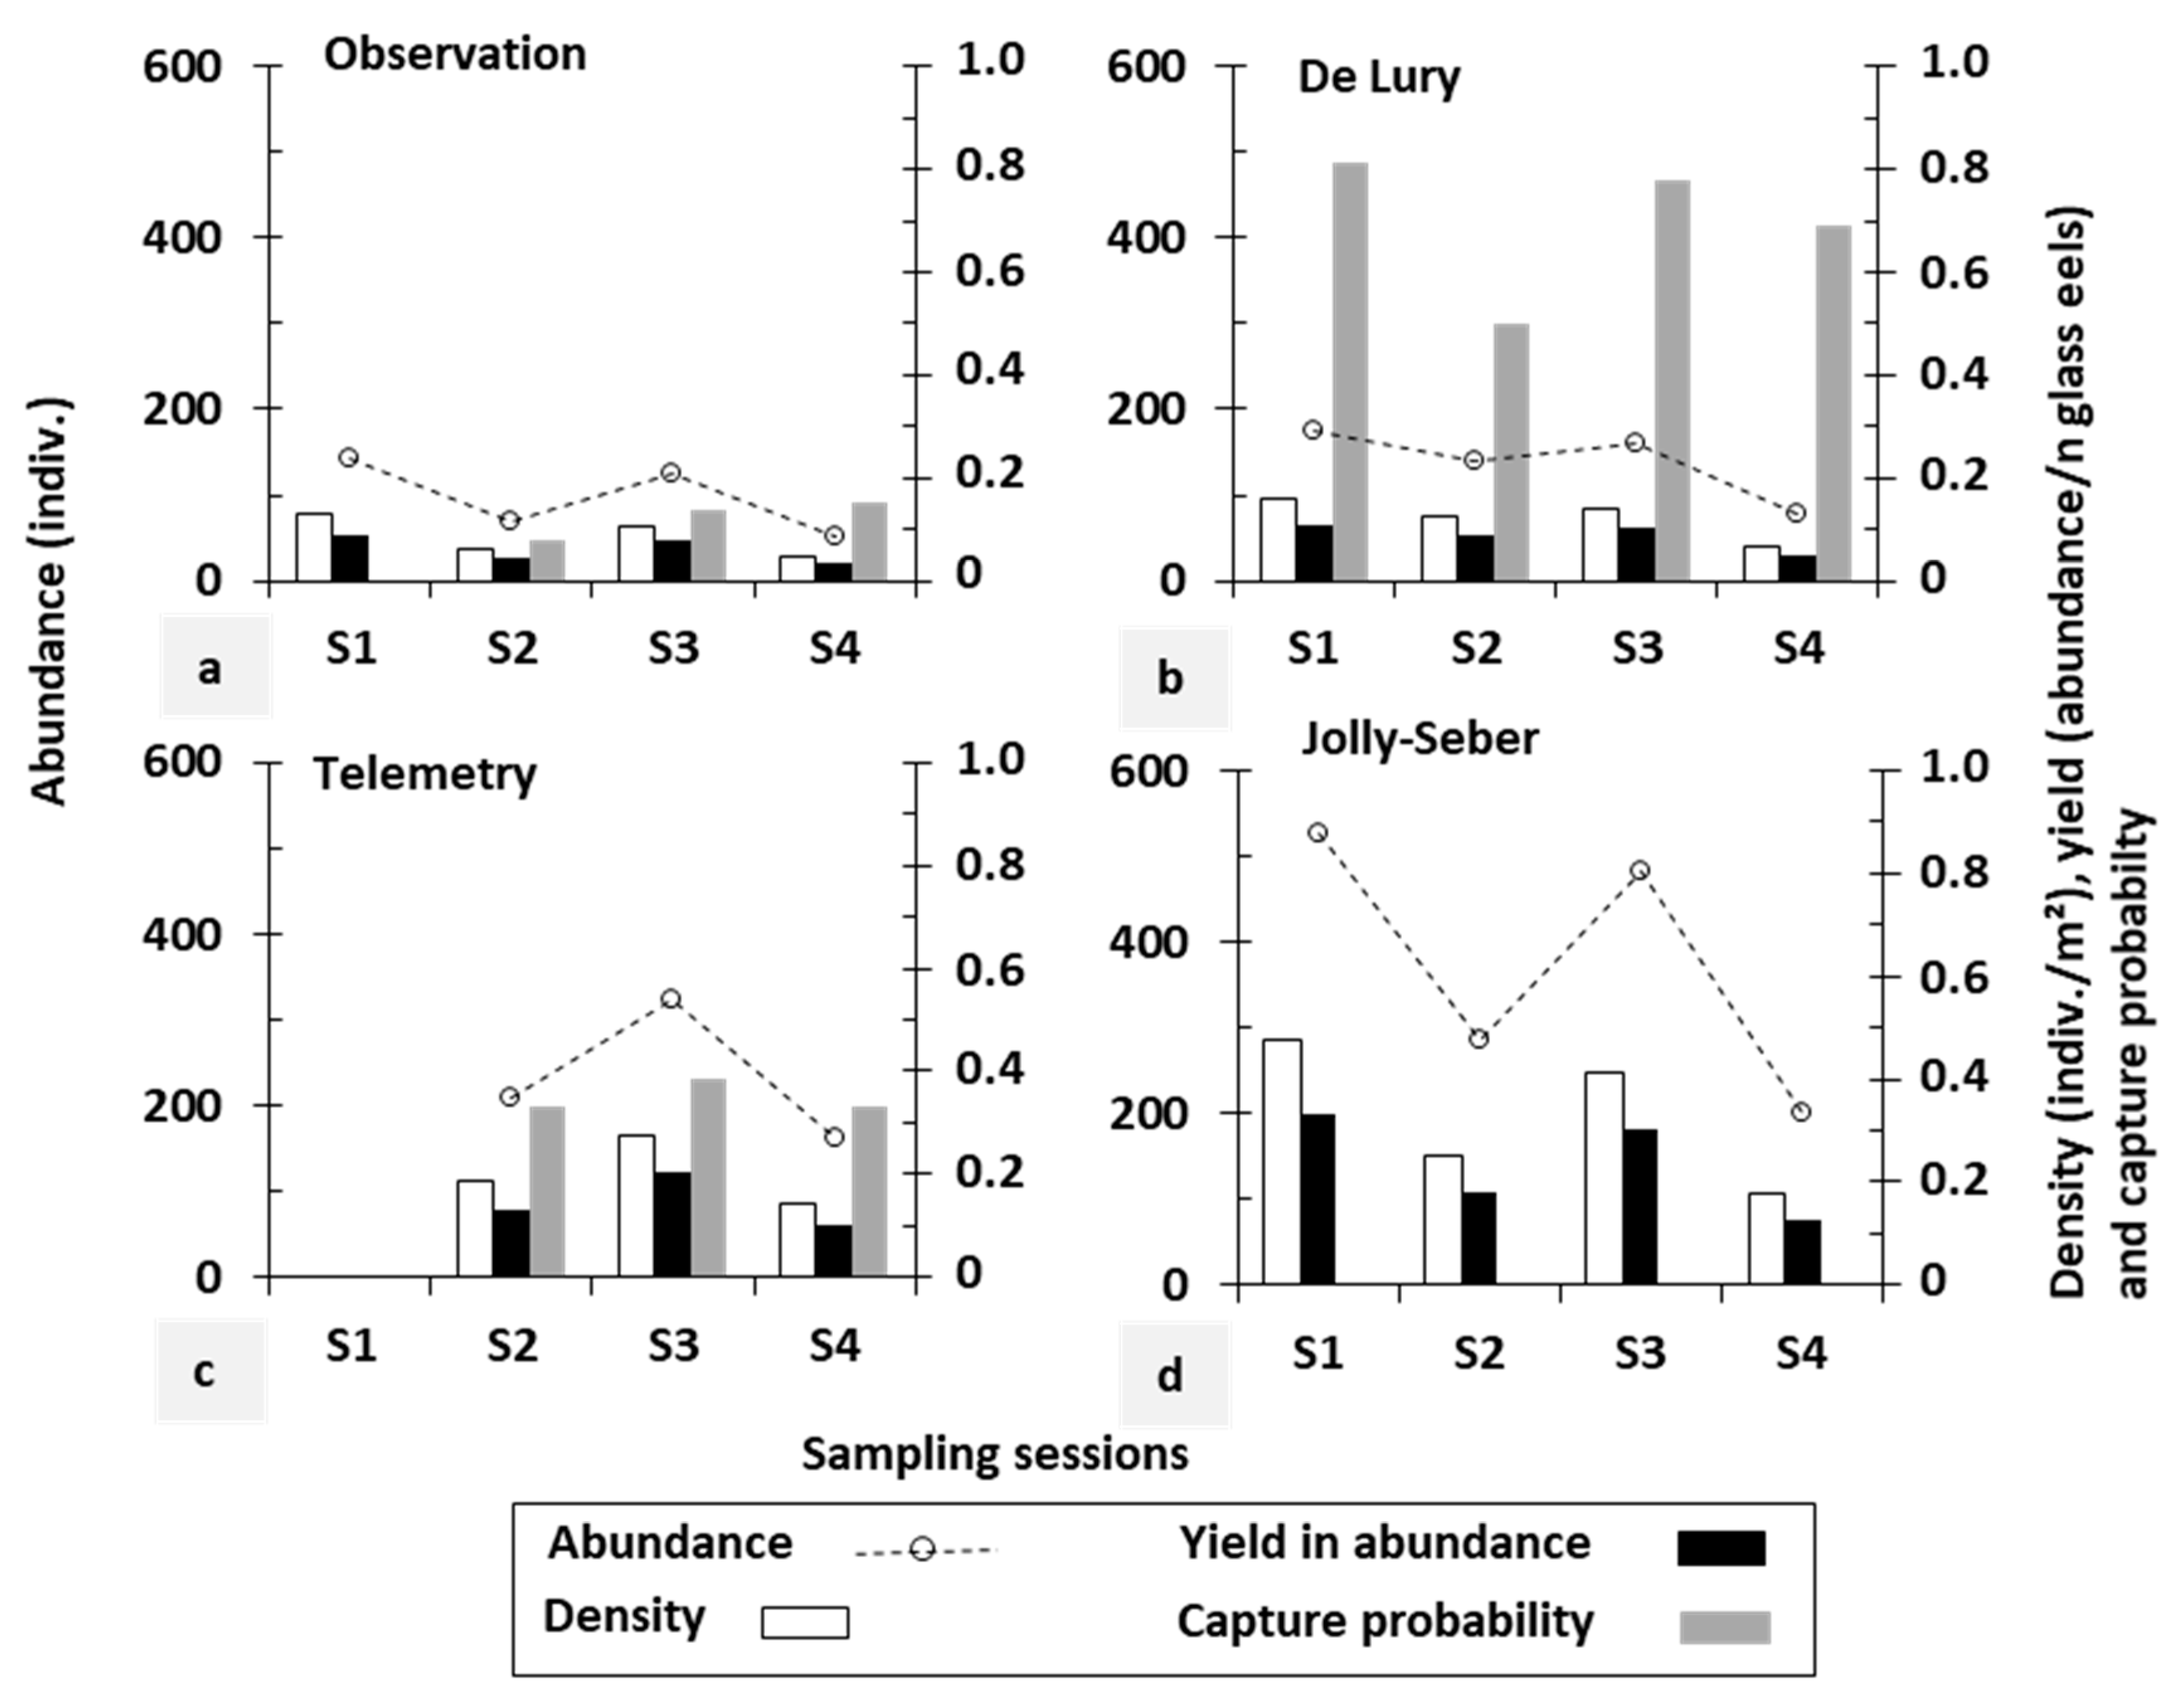
2.2. Demographic Assessment Methods

At each reference site, the same river stretch was electrofished throughout the study period from 0+ to 2+ age of eels after restocking. Ten electrofishing sessions were performed, including six sessions (S1–S6) in the Mosbeux River over a 160-m long river stretch and four sessions (S1–S4) in the Berwinne River over a 200-m long river stretch (Table 2). An electrofishing session was performed in two passages using exactly the same protocol and fishing effort. DC electrofishing (EFKO, 3.0 kVA FEG 5000, 150–300/300–600 volt DC, in accordance with VDE 0686, IEC 60335-2-86, Leutkrich im Allgäu), using hand nets with a 40 × 40 cm diameter and 2 × 2 mm mesh, was used to capture the stocked eels according to the technique described by Ovidio et al. [28]. The captured eels were anaesthetised with a 1:10 ratio of eugenol to alcohol (0.5 mL L−1), measured (total length [TL] ± 1 mm), weighed (± 0.01 g) and scanned to identify the eels already tagged in preceding sampling sessions. The untagged eels were equipped with small biocompatible radio frequency identification (RFID) tags (half duplex, 134.2 kHz, size/weight in air: 12 × 2 mm/0.095 g; Texas Instruments Inc., Dallas). Tagging took place in the field during the electrofishing sessions. Tags were inserted into a 2-mm-long incision made in the eel visceral cavity using a scalpel in the pre-anal position [2]. Tagged eels that fully recovering from the anaesthetic were released into the river at their capture point, and no mortality due to tagging was observed.
We compared the observed data from electrofishing (the Observation assessment method) with the data estimated using the Telemetry, De Lury and Jolly-Seber stock assessment methods. The Observation, Telemetry and De Lury methods all shared the advantage of being able to assess stock at each electrofishing session, while Jolly-Seber requested multiple time-spaced electrofishing sessions before providing a stock history associated with each electrofishing session.
The Observation method reported data of the eels caught during an electrofishing session through the addition of the individual eels captured during the two passages. The population size and capture probability for this method were calculated using the following formulae [28]: NOB = n1 + n2 and EOB = (nr)/(nm), respectively, where NOB is the population size, EOB is the capture probability, nm is the number of eels tagged released at session i and nr is the number of eels from nm that was recaptured at the next session i + 1.
The De Lury method comprised adjusting the observed data by estimating the most likely stock in the reference site from the catch data observed at the first and the second passage during an electrofishing session [43,44]. For this method, the following formulae were used to calculate population size and capture probability [44]: NDL = n12/(n1 – n2), and EDL = (n1 + n2)/ NDL, respectively, where NDL is the population size, EDL is the capture probability and n1 and n2 are the number of eels caught at the first and the second passage during an electrofishing session, respectively.
The Telemetry method involved, on the same day, a tracking session conducted prior to an electrofishing session. It used a mobile RFID detection system to assess the number of tagged eels present in the reference site. During a tracking session, a submerged antenna (OREGON, mobile RFID reader with antenna of 48.0 × 58.6 cm in diameter, Portland) connected to a backpack electronic recorder and a handy reader by Blueterm software was moved near the river bottom to detect the tagged eels [2,45]. The Telemetry method used the following formulae to calculate population size and capture probability: NTL = NOB/ETL, and ETL = Ndr/(nd + nur), respectively, where NTL is population size estimated according to the Telemetry method, NOB is population size observed according to the Observation method, ETL is the capture probability, Ndr is the number of tagged eels detected and recaptured, nd is the number of tagged eels detected and nur is the number of tagged eels undetected and recaptured.
The Jolly-Seber method used multiple capture-mark-recapture sessions to estimate effective demographic parameters of eels at each reference site using the Program MARK 8.0 POPAN module [46,47,48]. Each capture-mark-recapture session occurred during an electrofishing session. The POPAN module allows estimation of capture probability (p i), survival probability (ϕ i), arrival probability (pent i), abundance (N-hat i), net immigration (B-hat i) and net emigration (B*-hat i) at time or session i and a single parameter for both overall population (N) and superpopulation (N*-hat). The overall population was all eel individuals that occupied the reference site during the entire study period. The superpopulation included all eel individuals who occasionally used the reference site. They were present on the site between the sampling sessions and left it before they were counted [53]. In total, four models were fitted, and the most parsimonious model was selected using the quasi-likelihood Akaike information criterion (QAICc) (Table 3) [47,53]. The selected model was {p(.}, ϕ{.}, pent{t}, N(.)} showing capture probability and survival being constant over time and arrival probability varying with time/sampling sessions. Similarly, this model better corresponded to the biology of the species through dynamics of its earlier developmental stages (0+, 1+ and 2+) and the survey design (a same sampling site studied over a 3-year period). The time interval between sampling sessions used to estimate demographic parameters was presented in Table 2 for each of release practice. The outcomes from the two release practices of glass eels were also compared using this best-selected Jolly-Seber model, an appropriate stock assessment method for open populations.

2.3. Statistical Analyses

For each stock assessment method, the relationships between the demographic parameters of stocked eels, such as abundance, density, yield in abundance and capture probability, and the sampling time were tested using Pearson’s correlation (r) coefficient. Abundance was the population size observed or estimated at each sampling session, density was calculated by dividing the abundance by the area electrofished, while abundance yield was calculated by dividing the abundance by the number of glass eels released. To test whether abundance, density and yield in abundance, as well as capture probability, were independent of the stock assessment methods used, a non-parametric Kruskal-Wallis (χ2) test and a post-hoc Dunn’s test with Bonferroni correction were run for multiple pairwise comparisons of mean rank sums since assumptions of normality and homogeneity were not meet. To compare release practices of glass eels between the use of single site per river and the use of multiple sites per river, we performed the one-sided Wilcoxon (W) signed rank-test for paired samples with normal continuity correction on recruitment data of survival estimate, arrival estimate and yields in abundance, overall population and superpopulation of stocked eels. Overall population yield or superpopulation yield was the ratio calculated by dividing the overall population or superpopulation by the number of glass eels released. Statistical analyses were performed using the R statistical software version 3.3.2 packages Rcmdr 2.3-2 and dunn.test [54,55,56]. Results were considered significant when p values were less than 0.05.

3. Results

3.1. Comparison between Stock Assessment Methods

Using the restocking practice of multiple sites per river (the Berwinne River), demographic parameters of the abundance, density, yield in abundance and capture probability of stocked eels were not significantly correlated with time (Pearson correlations: range, r = −0.856 to 0.948; p = 0.1440–0.9592) for all stock assessment methods (Figure 2). The capture probability matched a mean value (± standard error) of 0.121 (± 0.03) for the Observation method. It was estimated at 0.349 (± 0.02) and 0.695 (± 0.10) for the Telemetry and De Lury methods, respectively. The capture probability p(.) was estimated at 0.250 (± 0.05) with 95% confidence interval limits of 0.173–0.350 for the Jolly-Seber method. The De Lury’s capture probability was significantly higher than that of the Observation method (Kruskal-Wallis test: range, χ2 = 9.182 with 3 df, p = 0.030 and Dunn’test: t = 2.961, p = 0.009). The Jolly-Seber estimates were closest to the Telemetry than those made by the two other methods. For 2017–2019, mean estimates (± standard error) of abundance were 231 (± 61) versus 373 (± 131) individuals, density was 0.201 (± 0.05) versus 0.329 (± 0.115) individuals per m2 and abundance yield was 0.146 (± 0.038) versus 0.235 (± 0.820) for the Telemetry and Jolly-Seber methods, respectively. However, estimates for these three demographic parameters were significantly higher in the Jolly-Seber than in the Observation method (Kruskal-Wallis test: range, χ2 = 10.685–10.892 with 3 df, p = 0.010 and Dunn’test: t = 3.004–3.007, p = 0.010).
With regards to multiple sites, some trends were similar to the Mosbeux River, with the single site restocking practice, for the assessment methods that had complete data (e.g., the Observation and Jolly-Seber methods; Figure 3). In these two methods, demographic parameters also were not significantly correlated with time (range, r = −0.691 to 0.608; p = 0.1286–0.5408). The capture probability matched a mean value (± standard error) of 0.115 (± 0.06) for Observation, and 0.244 (± 0.04) with 95% confidence interval limits of 0.181–0.319 for Jolly-Seber, which was close to estimates made for multiple sites. Two of six sampling sessions had missing data for the Telemetry and De Lury methods, and thus it was difficult to make an objective comparison among the four assessment methods in terms of demographic parameters. Data were missing for S3 and S6 for De Lury, because of the lower number of eels caught during first passage compared to the second passage (see Table 2), and S2 and S3 for Telemetry due to its late implementation.

3.2. Comparison between Restocking Practices

Using the best model of the Jolly-Seber method according to QAICc, the results showed that yields in abundance, overall population and superpopulation of stocked eels were lower with a single site compared to a multiple site restocking practice (Table 4, Figure 4). The survival probability ϕ(.) on weekly basis was estimated at 0.953 (standard error = 0.006, 95% confidence interval limits = 0.940–0.964) for the single site versus 0.974 (0.004, 0.965–0.980) for the multiple sites. This translates a lower annual survival rate for the single site (0.082) than for the multiple sites (0.254). On basis of the time interval length between sampling sessions used in the Jolly-Seber model, the survival rate was estimated at 0.333 (age 0+), 0.213–0.286 (1+) and 0.914–0.946 (2+, higher estimates due to shorter time intervals) for the single site and 0.382–0.608 (1+) and 0.418 (2+) for the multiple sites. In both restocking practices, the abundance of eels peaked in the S2 sampling session, which corresponded to 0+ and 1+ age for the single site and multiple sites, respectively (Figure 2 and Figure 3). Immigration and emigration at reference sites stopped during the third year post-restocking (Table 4). Conversely, the density of stocked eels was significantly higher in the single site compared to the multiple sites (Wilcoxon test: W = 0; p = 0.0339).

4. Discussion

In this study, we provided new scientific knowledge for implementing restocking practice using glass eels and assessed the evolution of their demographic trend in open upland waters. We applied an approach that combined two release practices of glass eels and four stock assessment methods that was, to our knowledge, never done before. The interest of this study is further strengthened by the cryptic and diadromous traits of the target species, which is rarely studied during its early life cycle in freshwaters farther from the sea.
With the weekly survival probabilities greater than 95% in both restocking practices during the 3-year study, the glass eels unmistakably survived in upland rivers farther from the sea. This fact clearly reflects the absence of any influence of the origin and characteristic of glass eels stocked and the experimental period, as well as the release practices on survival probability. The lack of influence of glass eel origin on survival observed in this study is explained by the fact that the European eel comprises a single panmictic population that is genetically unstructured in meta-populations throughout its entire range [4,5,6]. Thus, there is no genetic argument against translocation of eels within its distribution area or between river basins for restocking purposes. The data may also reflect the excellent quality of the glass eels stocked at an optimal time in spring with a good water temperature and availability of natural prey. These data demonstrate the great biological capacity of this life stage to survive in very diverse aquatic ecosystems where they are more less abundant and with physicochemical conditions very far from its natural ecosystems. The survival rates of stocked eels in this study (up to 94.6%) were higher than the survival range of 55%–75% assessed in an eutrophic lake in an 8-year study that used the mark-recapture method and adjusted Petersen estimate [29], and 5%–45% reported in small lakes in a 6-year study that performed mark-recapture experiment and estimated Bailey’s modification of the Lincoln-Petersen [34]. In a marsh environment of the River Rhône Delta in France, a lower survival (<30%) was reported in undifferentiated eels three years after their restocking using passive net traps and a multistate capture-recapture model [40]. This low survival was a consequence of a negative density-dependent effect of the restocking of glass eels performed each year [40,57]. Freshwater stream/river habitats increase eel survival because they are generally less risky in terms of predation [58] and offer a lower density of eels compared to marine/brackish ecosystems as a result of population diffusion processes [11,15]. Similarly, stream/river ecosystems have an increased availability of shelters that provide better burial for increased protection of the eels [2,28]. However, in freshwater environments, eels often deal with negative factors such as a higher parasite load, pollutant contamination, downstream migration delays, turbine mortality and reduced growth [59,60,61]. Higher survival rate in the multiple site practice than in the single site may be due to the presence of several glass eel release sites close to each other. From a total of eight sites on the same river, one site was studied, one was located downstream and six sites were upstream of the studied site. Some eels caught in the studied site may come from the other restocking sites.
On the other hand, mean recruitment values, in terms of abundance, density and yield in abundance, were closer between the Telemetry and Jolly-Seber methods. These data indicate that these methodologies provide better estimates of stocks that should be close to reality. Therefore, they should be regarded as valid assessment procedures for estimating stocks of cryptic juvenile eels after restocking in upland rivers. The good performance for the Telemetry method is likely due to its methodology, which is based on the catchability of the tagged eels being detected during a tracking session that precedes an electrofishing session performed on the same day [2,45] before providing stock estimates at the end of each fishing session. This tracking session offers the advantage of detection of the mobile individuals as well as the uncatchable immobile eels buried under shelters [2], which improved the stock estimation performance. Indeed, this estimation was close to that of the better-suited method for open populations, namely the Jolly-Seber. However, scanning of the river stretch increased the workload during the inventory of stocked eels. This factor could make the implementation of telemetry very difficult for long-term monitoring of stocks. The robustness of the Jolly-Seber method is based on the capture histories of the tagged individuals for modelling demographic parameters [48,62,63]. Notably, the Observation and De Lury stock assessment methods are only based on the catch success [43,44,64], which can vary greatly according to seasonal changes in river flow and water level at reference sites. Thus, great caution should be taken when interpreting their stock data, especially for the cryptic juvenile eels with low electrofishing recapture rates (this study, Observation method, mean value: single site = 0.121 and multiple sites = 0.115 in a 3-year study). The methods based only on the catch success like the Observation have the bias of underestimating demographic parameters explaining thereby the higher estimates for the Jolly-Seber method, which corrects this bias.
Between the two restocking practices, the single site showed low yields in abundance, overall population and superpopulation of stocked eels. This finding could reflect less efficient performance for this practice in recruitment success. The single site was an overdensity restocking practice that released glass eels at a single point. This practice favours natural dispersal of glass eels after their release at a single point in a watercourse [2]; this means it is easier to implement due to the reduced human resource requirement. In contrast, the multiple sites practice that produces significant low densities of stocked eels artificially disperses glass eels across several sites in a watercourse (1586 glass eels/site; 250 m distance between 2 sites; 8 sites in a river). With this practice, the major disadvantage of producing an overdensity of eels, observed in single site was eliminated, and the multiple sites are therefore a particularly interesting restocking practice for countries that are distant from the sea. This practice should also reduce the negative effect of high density on the sex ratio of the stocked eels and thus increase the probability that conservation goals of restocking will be achieved, which could be beneficial for the management of the species. Environmental factors, including eel density, natural recruitment levels and catchment characteristics [65,66,67], mainly determine sex in eels. Lower densities favour production of females, as generally found in rivers, whereas high densities produce higher proportions of males, as observed in estuaries, lagoons and other water bodies [40,68,69,70]. The stocked eels stay within the vicinity of the restocking location [2], and therefore artificial dispersal of glass eels across several sites in a watercourse makes them less exposed to negative density-dependent factors that decrease the population size [59,60,61]. Although the restocking practice that used a single site provided interesting results, the multiple sites practice was apparently the best release practice of glass eels during the restocking, but it required more human resources for its implementation.
With arrival probability and net immigration and emigration stopping during the third year after restocking in the two reference sites, the studied rivers displayed typical signs of the beginning of the sedentary lifestyle of stocked eels as well as the shutdown of the natural recruitment of wild eels from the North Sea. The immigration and emigration observed in this study were therefore unnatural because they depended exclusively on the stocked young eels exhibiting behaviours of both incoming and outgoing movements at reference sites. High immigration and emigration during the first two years that coincided with high densities could be explained by the fact that young eels, under density-dependent movements, are still searching for growing territories or habitats where they can live and feed. The higher densities produce dispersal behaviour, particularly for this highly migratory developmental stage of the eel lifecycle [71,72,73]. In contrast, from the third year onwards, juveniles begin to settle at reference sites and develop sedentary behaviour, while mobile individuals have already left the sites [13,24]. At 3 years old, these stocked juveniles are sexually undifferentiated and belong to stage I resident eels, according to protocol for determining stages of eels made by Durif et al. [74]. This finding is consistent with the fact that this study was done generally in the Western Europe, where the sexual maturity and associated metamorphosis of silver eels are reached at 6–10 years old [2,75], compared to 3–6 years old in the Mediterranean region [40,76].

5. Conclusions

Our results highlight that artificial dispersal of glass eels over several productive habitats/sites during a restocking practice in an upland freshwater may represent a beneficial management option. This practice may efficiently enhance the local stocks of eels in inland waters with no or low natural recruitment of wild eels, and in the long-term, ensure the sustainability of this species through a greater contribution of these waters to the production of stocked-origin silver eels. This phenomenon would boost the numbers or biomasses of potential spawners that escape to the sea. Restocking juveniles, a highly cryptic developmental stage of eels, in open running waters and using the Jolly-Seber assessment method, which requires multiple capture-mark-recapture sessions, is strongly recommended as the better-suited method to assess eel stocks and understand their population dynamics in a site farther from the sea. Given the lack of multiple capture-mark-recapture sessions, the Telemetry method can be used to rapidly assess stocks with good accuracy after fishing sessions, but it requires an original telemetry event before each fishing session. Further investigations over several years using capture-mark-recapture and tracking sessions, with a determination of the degree of silvering of eels called the silver index, the sex ratio, the concentration of lipids and pollutants and the parasite load, are needed to better understand and assess the quality and number of future genitors produced under these two restocking practices in inland waters.

Author Contributions

B.N.M. and M.O. designed the restocking experiments, participated in electrofishing sessions, analysed the results, performed the statistical analyses and wrote the manuscript; X.R. helped in the restocking experiments designing, data analysis and manuscript writing and revision; J.-P.B. participated in the capture of stocked eels during electrofishing sessions and helped in the revision of the manuscript; A.D. helped in the capture and tagging of stocked eels during electrofishing sessions. All authors have read and agreed to the published version of the manuscript.

Funding

This research was funded by the ‘Definition of the scientific and technical bases for an optimisation and evaluation of the efficiency of European glass eel (Anguilla anguilla) restocking practices’ project financially supported by the European Fisheries Fund and the Wallonia Public Service, grant number FEAMP No. 44-1604-008.

Acknowledgments

The authors sincerely thank the Editor in Chief, the Associate Editor Alexander Leng and anonymous reviewers, whose valuable comments helped us to improve the quality of this manuscript. They also express their gratitude to the Contrat de rivière Meuse Aval, the Contrat Rivière Vesdre and the DGO3 (Public Service of Wallonia) for their help during electrofishing sessions.

Conflicts of Interest

The authors declare no conflicts of interest.

References

  1. Jacoby, D.; Gollock, M. Anguilla anguilla. The IUCNRed List of Threatened Species. Version 2014.2. 2014. Available online: www.iucnredlist.org (accessed on 28 May 2013).
  2. Nzau Matondo, B.; Séleck, E.; Dierckx, A.; Benitez, J.-P.; Rollin, X.; Ovidio, M. What happens to glass eels after restocking in upland rivers? A long-term study on their dispersal and behavioural traits. Aquat. Conserv. Mar. Freshw. Ecosyst. 2019, 29, 374–388. [Google Scholar] [CrossRef]
  3. Tesch, F.W.; Thorpe, J.E. The Eel, 3rd ed.; Blackwell Science: Oxford, UK, 2003. [Google Scholar]
  4. van Ginneken, V.J.T.; Maes, G.E. The European eel (Anguilla anguilla, Linnaeus), its lifecycle, evolution and reproduction: A literature review. Rev. Fish Biol. Fish. 2005, 15, 367–398. [Google Scholar] [CrossRef]
  5. Palm, S.; Dannewitz, J.; Prestegaard, T.; Wickstrom, H. Panmixia in European eel revisited: No genetic difference between maturing adults from southern and northern Europe. Heredity 2009, 103, 82–89. [Google Scholar] [CrossRef] [PubMed]
  6. Als, T.D.; Hansen, M.M.; Maes, G.E.; Castonguay, M.; Riemann, L.; Aarestrup, K.; Munk, P.; Sparholt, H.; Hanel, R.; Bernatchez, L. All roads lead to home: Panmixia of European eel in the Sargasso Sea. Mol. Ecol. 2011, 20, 1333–1346. [Google Scholar] [CrossRef]
  7. Bonhommeau, S.; Castonguay, M.; Rivot, E.; Sabatié, R.; Le Pape, O. The duration of migration of Atlantic Anguilla anguilla larvae. Fish Fish. 2010, 11, 289–306. [Google Scholar] [CrossRef] [Green Version]
  8. Bevacqua, D.; Melià, P.; Gatto, M.; De Leo, G.A. A global viability assessment of the European eel. Glob. Chang. Biol. 2015, 21, 3323–3335. [Google Scholar] [CrossRef]
  9. Arai, T.; Kotake, A.; McCarthy, T.K. Habitat use by the European eel Anguilla anguilla in Irish waters. Estuar. Coast. Shelf Sci. 2006, 67, 569–578. [Google Scholar] [CrossRef]
  10. Ibbotson, A.; Smith, J.; Scarlett, P.; Aprahamian, M.W. Colonisation of freshwater habitats by the European eel Anguilla anguilla. Freshw. Biol. 2002, 47, 1696–1706. [Google Scholar] [CrossRef]
  11. Imbert, H.; Labonne, J.; Rigaud, C.; Lambert, P. Resident and migratory tactics in freshwater European eels are size-dependent. Freshw. Biol. 2010, 55, 1483–1493. [Google Scholar] [CrossRef]
  12. Nzau Matondo, B.; Ovidio, M. Dynamics of upstream movements of the European eel Anguilla anguilla in an inland area of the River Meuse over the last 20 years. Environ. Biol. Fish. 2016, 99, 223–235. [Google Scholar] [CrossRef] [Green Version]
  13. Ovidio, M.; Seredynski, A.; Philippart, J.C.; Nzau Matondo, B. A bit of quiet between the migrations: The resting life of the European eel during their freshwater growth phase in a small stream. Aquat. Ecol. 2013, 47, 291–301. [Google Scholar] [CrossRef] [Green Version]
  14. Daverat, F.; Limburg, K.E.; Thibault, I.; Shiao, J.-C.; Dodson, J.; Caron, F.; Tzeng, W.-N.; Iizuka, Y.; Wickström, H. Phenotypic plasticity of habitat use by three temperate eel species, Anguilla anguilla, A. japonica and A. rostrata. Mar. Ecol. Prog. Ser. 2006, 308, 231–241. [Google Scholar] [CrossRef]
  15. Van den Thillart, G.V.; Van Ginneken, F.; Körner, R.; Heijmans, R.; Van der Linden, R.; Gluvers, A. Endurance swimming of European eel. J. Fish Biol. 2004, 65, 312–318. [Google Scholar] [CrossRef]
  16. Daverat, F.; Tomas, J.; Lahaye, M.; Palmer, M.; Elie, P. Tracking continental habitat shifts of eels using otolith Sr/Ca ratios: Validation and application to the coastal, estuarine and riverine eels of the Gironde-Garonne-Dordogne watershed. Mar. Freshw. Res. 2005, 56, 619–627. [Google Scholar] [CrossRef]
  17. Panfili, J.; Darnaude, A.M.; Lin, Y.J.; Chevalley, M.; Iizuka, Y.; Tzeng, W.N.; Crivelli, A.J. Habitat residence during continental life of the European eel Anguilla anguilla investigated using linear discriminant analysis applied to otolith Sr:Ca ratios. Mar. Ecol. Prog. Ser. 2012, 15, 175–185. [Google Scholar] [CrossRef]
  18. MacNamara, R.; McCarthy, T.K.; Wickström, H.; Clevestam, P.D. Fecundity of silver-phase eels (Anguilla anguilla) from different habitat types and geographic locations. ICES J. Mar. Sci. 2016, 73, 135–141. [Google Scholar] [CrossRef] [Green Version]
  19. ICES. Joint EIFAAC/ICES/GFCM Working Group on Eels (WGEEL); ICES Scientific Reports: Copenhagen, Denmark, 2019; 177p. [Google Scholar]
  20. Dekker, W. The history of commercial fisheries for European commenced only a century ago. Fish. Manag. Ecol. 2019, 26, 6–19. [Google Scholar] [CrossRef]
  21. Baras, E.; Philippart, J.C.; Salmon, B. Estimation of migrant yellow eels stock in large rivers through the survey of fish passes: A preliminary in the River Meuse (Belgium). In Stock Assessment in Inland Fisheries; Cowx, I.G., Ed.; Oxford Fishing News Books (Blackweel): London, UK, 1996; pp. 314–325. [Google Scholar]
  22. Nzau Matondo, B.; Benitez, J.P.; Dierckx, A.; Philippart, J.C.; Ovidio, M. Assessment of the entering stock, migration dynamics and fish pass fidelity of European eel in the Belgian Meuse River. River Res. Appl. 2017, 33, 292–301. [Google Scholar] [CrossRef]
  23. Nzau Matondo, B.; Ovidio, M. Decreased stock entering the Belgian Meuse is associated with the loss of colonisation behaviour in yellow-phase European eels. Aquat. Living Resour. 2018, 31, 7. [Google Scholar] [CrossRef]
  24. Aschonitis, V.; Castaldelli, G.; Lanzoni, M.; Rossi, R.; Kennedy, C.; Fano, E.A. Long-term records (1781–2013) of European eel (Anguilla anguilla L.) production un the Comacchio Lagoon (Italy): Evaluation of local and global factors as causes of the population collapse. Aquat. Conserv. Mar. Freshw. Ecosyst. 2017, 27, 502–520. [Google Scholar] [CrossRef]
  25. Council of the European Communities. Council regulation (EC) no 1100/207 of 18 September 2007 establishing measures for the recovery of the stock of European eel. Off. J. Eur. Union 2007, 248, 17–23. [Google Scholar]
  26. Simon, J.; Dörner, H.; Scott, R.D.; Schreckenbach, K.; Knösche, R. Comparison of growth and condition of European eels stocked as glass and farm sourced eels in lakes in the first four years after stocking. J. Appl. Ichthyol. 2013, 29, 323–330. [Google Scholar] [CrossRef]
  27. Ovidio, M.; Tarrago-Bès, F.; Nzau Matondo, B. Short-term responses of glass eels transported from UK to small Belgian streams. Ann. Limnol. Int. J. Limnol. 2015, 51, 219–226. [Google Scholar] [CrossRef] [Green Version]
  28. Pedersen, M.I. Long-term survival and growth of stocked eel, Anguilla anguilla (L.), in a small eutrophic lake. Dana 2000, 12, 71–76. [Google Scholar]
  29. Shiao, J.C.; Lozys, L.; Iizuka, Y.; Tzeng, W.N. Migratory patterns and contribution of stocking to the population of European eel in Lithuanian waters as indicated by otolith Sr:Ca ratios. J. Fish Biol. 2006, 69, 749–769. [Google Scholar] [CrossRef]
  30. Lin, Y.J.; Lozys, L.; Shiao, J.C.; Iizuka, Y.; Tzeng, W.N. Growth differences between naturally recruited and stocked European eel Anguilla anguilla from different habitats in Lithuania. J. Fish Biol. 2007, 71, 1773–1787. [Google Scholar] [CrossRef]
  31. Sjöberg, N.B.; Wickström, H.; Petersson, E. Bidrar den Omflyttadeålen Till Lekbeståndet i Sargassohavet?—Blankålsmärkning Kan Gesvaret. Slutrapport Från Pilotprojekt Till Fonden för Fiskets Utveckling; (Does Restocked Eel Contribute to the Spawning Stock in the Sargasso Sea?—Silver Eel Tagging can Give the Answer); Unpublished Report; Stockholm, 2008; 43p. (In Swedish) [Google Scholar]
  32. Prigge, E.; Marohn, L.; Hanel, R. Tracking the migratory success of stocked European eels Anguilla anguilla in the Baltic Sea. J. Fish Biol. 2013, 82, 686–699. [Google Scholar] [CrossRef]
  33. Simon, J.; Dörner, H. Survival and growth of European eels stocked as glass- and farm-sourced eels in five lakes in the first years after stocking. Ecol. Freshw. Fish 2014, 23, 40–48. [Google Scholar] [CrossRef]
  34. Sjöberg, N.B.; Wickström, H.; Asp, A.; Petersson, E. Migration of eels tagged in the Baltic Sea and Lake Mälaren in the context of the stocking question. Ecol. Freshw. Fish 2017, 26, 517–532. [Google Scholar] [CrossRef]
  35. Kullmann, B.; Thiel, R. Bigger is better in eel stocking measures? Comparison of growth performance, body condition, and benefit-cost ratio of simultaneously stocked glass and farmed eels in a brackish fjord. Fish. Res. 2018, 205, 132–140. [Google Scholar] [CrossRef]
  36. Brämick, U.; Fladung, E.; Simon, J. Stocking is essential to meet the silver eel escapement target in a river system with currently low natural recruitment. ICES J. Mar. Sci. 2016, 73, 91–100. [Google Scholar] [CrossRef] [Green Version]
  37. Félix, P.M.; Costa, J.L.; Monteiro, R.; Castro, N.; Quintella, B.R.; Almeida, P.R.; Domingos, I. Can a restocking event with European (glass) eels cause early changes in local biological communities and its ecological status? Glob. Ecol. Conserv. 2020, 21, e00884. [Google Scholar] [CrossRef]
  38. Bisgaard, J.; Pedersen, M.I. Mortality and growth of wild and introduced cultured eels Anguilla anguilla (L.) in a Danish stream, with special reference to a new tagging technique. Dana 1991, 9, 57–69. [Google Scholar]
  39. Pedersen, M.I. Does Stocking of Danish lowland streams with Elvers increase European Eel Populations? Am. Fish. Soc. Symp. 2009, 58, 149–156. [Google Scholar]
  40. Desprez, M.; Crivelli, A.J.; Lebel, I.; Massez, G.; Gimenez, O. Demographic assessment of a stocking experiment in European Eels. Ecol. Freshw. Fish 2013, 22, 412–420. [Google Scholar] [CrossRef]
  41. Wickström, H.; Sjöberg, N.H. Traceability of stocked eels—The Swedish approach. Ecol. Freshw. Fish 2014, 23, 33–39. [Google Scholar] [CrossRef]
  42. Stacey, J.A.; Pratt, T.C.; Verreault, G.; Fox, M.G. A caution for conservation stocking as an approach for recovering Atlantic eels. Aquat. Conserv. Mar. Freshw. Ecosyst. 2015, 25, 569–580. [Google Scholar] [CrossRef]
  43. De Lury, D.B. On the estimation of biological populations. Biometrics 1947, 3, 145–167. [Google Scholar] [CrossRef]
  44. Laurent, M.; Lamarque, P. Utilisation de la méthode des captures successives (De Lury) pour l’évaluation des peuplements piscicoles. Bull. Fr. Pêche Piscic. 1975, 259, 66–77. [Google Scholar] [CrossRef] [Green Version]
  45. Arreguin-Sanchez, F. Catchability: A key parameter for fish stock assessment. Rev. Fish Biol. Fish. 1996, 6, 221–242. [Google Scholar] [CrossRef]
  46. Schwarz, C.J.; Arnason, A.N. A general methodology for the analysis of capture-recapture experiments in open populations. Biometrics 1996, 52, 860–873. [Google Scholar] [CrossRef]
  47. White, G.C.; Burnham, K.P. Program MARK: Survival estimation from populations of marked animals. Bird Study 1999, 46, 120–139. [Google Scholar] [CrossRef]
  48. Pledger, S.; Pollock, K.H.; Norris, J.L. Open Capture–Recapture Models with Heterogeneity: II. Jolly–Seber Model. Biometrics 2010, 66, 883–890. [Google Scholar] [CrossRef] [PubMed]
  49. Huet, M. Aperçu de la relation entre la pente et les populations piscicoles des eaux courantes. Schweiz. Z. Hydrol. 1949, 11, 332–351. [Google Scholar] [CrossRef]
  50. Elie, P.; Lecomte-Finiger, R.; Cantrelle, I.; Charlon, N. Définition des limites des différents stades pigmentaires durant la phase civelle d’Anguilla anguilla (L.). Vie Milieu 1982, 32, 149–157. [Google Scholar]
  51. Esteve, C.; Garay, E. Heterotrophic Bacterial Flora Associated with European Eel Anguilla anguilla Reared in Freshwater. Nippon Suisan Gakk 1991, 57, 1369–1375. [Google Scholar] [CrossRef] [Green Version]
  52. Angelidis, P.; Pournara, I.; Photis, G. Glass eels (Anguilla anguilla) growth in a recirculating system. Mediterr. Mar. Sci. 2005, 6, 99–106. [Google Scholar] [CrossRef] [Green Version]
  53. Burnham, K.P.; Anderson, D.R. Model Selection and Multimodel Inference: A Practical Information-Theoretic Approach, 2nd ed.; Springer-Verlag Science and Business Média: New York, NY, USA, 2002; 454p. [Google Scholar]
  54. R Development Core Team. R: A Language and Environment for Statistical Computing; R Foundation for Statistical Computing: Vienna, Austria, 2016. [Google Scholar]
  55. Fox, J. Using the R Commander: A Point-and-Click Interface for R; Chapman and CRC Press: Boca Raton, FL, USA, 2017; Available online: http://socserv.mcmaster.ca/jfox/Books/RCommander/ (accessed on 14 January 2020).
  56. Dinno, A. Dunn’s Test of Multiple Comparisons Using Rank Sums. 2017. Available online: https://cran.r-project.org/web/packages/dunn.test/dunn.test.pdf (accessed on 14 January 2020).
  57. Acou, A.; Rivot, E.; van Gils, J.A.; Legault, A.; Ysnel, F.; Feunteun, E. Habitat carrying capacity is reached for the European eel in a small coastal catchment: Evidence and implications for managing eel stocks. Freshw. Biol. 2011, 56, 952–968. [Google Scholar] [CrossRef]
  58. Jonsson, B.; Jonsson, N. Partial migration: Niche shift versus sexual maturation in fishes. Rev. Fish Biol. Fish. 1993, 3, 348–365. [Google Scholar] [CrossRef]
  59. Miller, M.J.; Feunteun, E.; Tsukamoto, K. Did a “perfect storm” of oceanic changes and continental anthropogenic impacts cause northern hemisphere anguillid recruitment reductions? ICES J. Mar. Sci. 2016, 73, 43–56. [Google Scholar] [CrossRef] [Green Version]
  60. Bonnineau, C.; Scaion, D.; Lemaire, B.; Belpaire, C.; Thomé, J.-P.; Thonon, M.; Leermaker, M.; Gao, Y.; Debier, C.; Silvestre, F.; et al. Accumulation of neurotoxic organochlorines and trace elements in brain of female European eel (Anguilla anguilla). Environ. Toxicol. Pharmacol. 2016, 45, 346–355. [Google Scholar] [CrossRef] [PubMed]
  61. Belpaire, C.; Geeraerts, C.; Evans, D.; Ciccotti, E.; Poole, R. The European eel quality database: Towards a pan-European monitoring of eel quality. Environ. Monit. Assess. 2011, 183, 273–284. [Google Scholar] [CrossRef] [PubMed] [Green Version]
  62. Naismith, I.A.; Knights, B. Studies of sampling methods and of techniques for estimating populations of eels, Anguilla anguilla L. Aquac. Res. 1990, 21, 357–368. [Google Scholar] [CrossRef]
  63. Lebreton, J.-D.; Burnham, K.P.; Clobert, J.; Anderson, D.R. Modelling survival and testing biological hypotheses using marked animals: A unified approach with case studies. Ecol. Monogr. 1992, 62, 67–118. [Google Scholar] [CrossRef] [Green Version]
  64. Ricker, W.E. Calcul et interprétation des statistiques biologiques des populations de poissons. Bull. Fish. Res. Board Can. 1980, 191, 409. [Google Scholar]
  65. Davey, A.J.H.; Jellyman, D.J. Sex determination in freshwater eels and management options for manipulation of sex. Rev. Fish Biol. Fish. 2005, 15, 37–52. [Google Scholar] [CrossRef]
  66. Bark, A.; Williams, B.; Knights, B. Current status and temporal trends in stocks of European eel in England and Wales. ICES J. Mar. Sci. 2007, 64, 1368–1378. [Google Scholar] [CrossRef] [Green Version]
  67. Poole, W.R.; Diseru, O.H.; Thorsta, E.B.; Durif, C.M.; Dolan, C.; Sandlund, O.T.; Bergesen, K.; Rogan, G.; Kelly, S.; Vøllestad, L.A. Long-term variation in numbers and biomass of silver eels being produced in two European river systems. ICES J. Mar. Sci. 2018, 75, 1627–1637. [Google Scholar] [CrossRef]
  68. Melia, P.; Bevacqua, D.; Crivelli, A.J.; De Leo, G.A.; Panfili, J.; Gatto, M. Sex differentiation of the European eel in brackish and freshwater environments: A comparative analysis. J. Fish Biol. 2006, 69, 1228–1235. [Google Scholar] [CrossRef]
  69. Walsh, C.T.; Pease, B.C.; Booth, D.J. Variation in the sex ratio, size and age of longfinned eels within and among coastal catchments of south-eastern Australia. J. Fish Biol. 2004, 64, 1297–1312. [Google Scholar] [CrossRef]
  70. Bevacqua, D.; Melià, P.; Schiavina, M.; Crivelli, A.J.; De Leo, G.A.; Gatto, M. A demographic model for the conservation and management of the European eel: An application to a Mediterranean coastal lagoon. ICES J. Mar. Sci. 2019, 76, 2164–2178. [Google Scholar] [CrossRef]
  71. Castonguay, M.; Dutil, J.D.; Audet, C.; Miller, R. Locomotor activity and concentration of thyroid hormones in migratory and sedentary juvenile American eels. Trans. Am. Fish. Soc. 1990, 119, 946–956. [Google Scholar] [CrossRef]
  72. Feunteun, E.; Laffaille, P.; Robinet, T.; Briand, C.; Baisez, A.; Olivier, J.M.; Acou, A. A review of upstream migration and movements in inland waters by Anguillid eels: Towards a general theory. In Eel Biology; Aida, K., Tsukamoto, K., Yamauchi, K., Eds.; Springer: Tokyo, Japan, 2003; pp. 181–190. [Google Scholar]
  73. Edeline, E.; Dufour, S.; Elie, P. Proximate and ultimate control of eel continental dispersal. In Spawning Migration of the European Eel; Springer: Dordrecht, The Netherlands, 2009; pp. 433–461. [Google Scholar]
  74. Durif, C.; Dufour, S.; Elie, P. The silvering process of Anguilla anguilla: A new classification from the yellow resident to the silver migrating stage. J. Fish Biol. 2005, 66, 1025–1043. [Google Scholar] [CrossRef]
  75. Cattrijsse, A.; Hampel, H. Life history and habitat use tables. In Subproject 1—‘Nursery Function Westerschelde’; Final Report; University of Gent, Department of Biology, Marine Biology Section: Ghent, Belgium, 2000. [Google Scholar]
  76. Acou, A.; Lefebvre, F.; Contournet, P.; Poizat, G.; Panfili, J.; Crivelli, A.J. Silvering of female eels (Anguilla anguilla) in two sub-populations of the Rhône delta. Bull. Fr. Pêche Piscic. 2003, 368, 55–68. [Google Scholar] [CrossRef]
Figure 1. Location of the two selected rivers in the Belgian Meuse River basin (a), the reference site of Trooz in the Mosbeux River for the restocking practice using a single release site/point of glass eels (b) and the reference site of Val Dieu in the Berwinne River for the multiple release sites (c).
Sustainability 12 01124 g001
Figure 2. Abundance, yield in abundance, density and capture probability of stocked eels according to stock assessment methods and sampling sessions for diadromous species individuals aged 0+ to 2+ from restocking using multiple release sites of glass eels per river (the Berwinne River).
Sustainability 12 01124 g002
Figure 3. Abundance, yield in abundance, density and capture probability of stocked eels according to stock assessment methods and sampling sessions for diadromous species individuals aged 0+ to 2+ from restocking using a single release site of glass eels per river (the Mosbeux River). Data are missing.
Sustainability 12 01124 g003
Figure 4. Comparison between the two restocking practices using the best model of the Jolly-Seber method for stocked eels aged 0+ to 2+. Arrival estimates (a), yield in abundance (b), density (c), yield in overall population (d) and yield in superpopulation (e). Values represent the mean ± standard error. * p < 0.05, Wilcoxon test.
Sustainability 12 01124 g004
Table 1. Characteristics of the two selected rivers and their reference sites. Physicochemical parameters are expressed in mean values of data assessed from restocking to age 2+. SE is Standard error.
ParameterMosbeuxBerwinne
Reference siteTroozVal Dieu
Longitude 5°41′E5°48′E
Latitude50°34′N50°41′N
Altitude (m)97161
Catchment area (km2)19.16118.0
Distance from the North Sea (km)359.3341.0
Year of restocking20132017
Origin of glass eelsUKFrance
Pigment stages VIA1 and VIA2VB, VIA0, VIA1 and VIA2
Length of glass eels (mean ± SE)7.0 ± 0.4 cm6.7 ± 0.4 cm
Weight of glass eels (mean ± SE)0.26 ± 0.07 g0.23 ± 0.04 g
Total number of release site18
Glass eels (number per site)41551586
Daily temperature (°C)9.89.1
Width in May (m)2.75.8
Depth in May (cm)15.220.0
Predominant substratumLarge stones and blocks (60%)Large stones and blocks (81%)
Conductivity (µs cm−1)473.5591.2
pH7.97.7
Ammonium (mg L−1)<0.05<0.05
Nitrate (mg L−1)2.02.0
Nitrite (mg L−1)0.100.11
Calcium carbonate (mg L−1)90100
Phosphates (mg L−1)0.190.22
Trophic statusEutrophicEutrophic
Fish community (species number)119
Predominant speciesBullhead, brown troutBullhead, loach
Resident eels > 55 cm (number m−1)0.0030.005
Table 2. Detailed information about the electrofishing sessions. Date, time interval between sampling session i and i+1, time after restocking and age, number of stocked eels captured at the first and the second passage and their body length. SE indicates standard error.
Sampling SessionDateTime Interval (Weeks)Time after Restocking (Weeks) No. of Eels per PassageTotal Length (cm)
AgeFirstSecondMean ± SE
Mosbeux: Single site
S129 Oct. 2013022.70+73148.9 ± 1.0
S27 Apr. 201422.945.60+871210.0 ± 1.6
S318 Nov. 201432.177.71+182212.6 ± 2.1
S419 May 201526.0103.71+272213.1 ± 2.3
S527 May 20151.1104.92+392114.0 ± 2.8
S69 Jun. 20151.9106.72+242713.2 ± 2.7
Berwinne: Multiple sites
S18 Sep. 2017024.40+994312.1 ± 1.7
S216 May 201836.661.01+412914.1 ± 1.7
S325 Sep. 201818.979.91+854021.2 ± 4.0
S415 May 201933.1113.02+341922.1 ± 3.3
Table 3. Model selection. QAICc is Quasi-likelihood Akaike information criterion, ∆QAICc differences with the best model, number of parameters, deviance values and N overall population for each of the tested models in release practice of glass eels. * The model we selected as most appropriate based on survey design and biological data. p probability of capture, ϕ survival, pent arrival probability, N overall population, (t) parameter varies with sampling session, (.) parameter is held constant over time and SE is standard error.
Model descriptionQAICc∆QAICcAICc WeightsModel LikelihoodNo. of ParametersDeviance−2Log(L)N ± SE
Mosbeux: Single site
{ p(.), ϕ(t), pent(t), N(.)}386.560.000.591.0011−1046.14363.86930 ± 135
{ p(.), ϕ(.), pent(t), N(.)}* 388.101.530.270.477−1036.19373.80926 ± 113
{ p(t), ϕ(.), pent(t), N(.)}390.523.960.080.1411−1042.18367.811043 ± 173
{ p(t), ϕ(t), pent(t), N(.)}391.074.510.060.1114−1048.05361.941378 ± 910
Berwinne: Multiple sites
{ p(.), ϕ(.), pent(t), N(.)}*346.410.000.831.005−798.51334.68924 ± 132
{ p(.), ϕ(t), pent(t), N(.)}351.074.650.080.108−800.09334.68857 ± 128
{ p(t), ϕ(.), pent(t), N(.)}351.505.080.070.048−799.65335.11641 ± 083
{ p(t), ϕ(t), pent(t), N(.)}353.166.740.030.0310−802.21332.55693 ± 125
Table 4. The selected model of {p(.}, ϕ{.}, pent{t}, N(.)}. Parameters of overall population (N), Superpopulation (N*-hat), arrival probability (pent), net immigration (B-hat) and emigration (B*-hat) estimated. B-hat, B*-hat and pent are calculated between sessions i and i + 1. 95% CI is the lower and upper 95% confidence interval limits. SE is standard error.
River and Release PracticeSessionTime Interval (Weeks)AgeOverall Population (N)Superpopulation (N*-hat)Arrival Probability (Pent)Net Immigration(B-hat)Net Emigration(B*-hat)
Estimate ± SE95% CIEstimate ± SE95% CIEstimate ± SE95% CIEstimate ± SE95% CIEstimate ± SE95% CI
Mosbeux Single site 926 ± 113742–11911301 ± 1611022–1656
29 Oct. 201300+ ------
07 Apr. 201422.90+ 0.314 ± 0.0390.244–0.395291 ± 52205–411478 ± 87336–681
18 Nov. 201432.11+ 0.097 ± 0.0290.052–0.17189 ± 2849–163174 ± 6091–337
19 May 201526.01+ 0.146 ± 0.0300.097–0.214135 ± 3187–210236 ± 55151–369
27 May 20151.12+ 0.058 ± 0.0310.020–0.15754 ± 2821–14055 ± 2921–144
9 Jun. 20151.92+ 0.417×10⁻⁶ ± 0.206×10⁻³<0.001–1.000.389×10−4 ± 0.190<0.001–0.3840.404×10−3 ± 0.199<0.001–0.402
Berwinne Multiple sites 924 ± 132716–12441058 ± 139820–1366
8 Sep. 201700+ ------
16 May 201836.61+ 0.094 ± 0.0430.037–0.21987 ± 3738–195136 ± 6257–320
25 Sep. 201818.91+ 0.336 ± 0.0370.268–0.412311 ± 51226–428395 ± 65288–543
15 May 201933.12+ 0.769×10⁻⁶ ± 0.513×10⁻³<0.001–1.0000.711×10−3 ± 0.475<0.001–0.8350.001 ± 0.714<0.001–1

