Article

Operational Performance and Degradation Influenced Life Cycle Environmental–Economic Metrics of mc-Si, a-Si and HIT Photovoltaic Arrays in Hot Semi-arid Climates

1
Department of Physics, Indian Institute of Technology Jodhpur, NH-65 Nagaur Road, Karwar, Jodhpur 342037, Rajasthan, India
2
School of Electrical and Computer Engineering, National Technical University of Athens, 15780 Athens, Greece
3
School of Energy and Environment, City University of Hong Kong, Kowloon, Hong Kong 999077, China
4
National Institute of Solar Energy, Ministry of New and Renewable Energy, New Delhi 110003, India
5
Department of Automobile Engineering, SRM Institute of Science and Technology, Kattankulathur 603203, Tamil Nadu, India
6
Sustainable Solutionz, T Nagar, Chennai-600017, Tamil Nadu, India
*
Authors to whom correspondence should be addressed.
Sustainability 2020, 12(3), 1075; https://doi.org/10.3390/su12031075
Submission received: 4 December 2019 / Revised: 27 January 2020 / Accepted: 30 January 2020 / Published: 3 February 2020

Abstract

:
Life cycle metrics evolution specific to the climate zone of photovoltaic (PV) operation would give detailed insights on the environmental and economic performance. At present, vast literature is available on the PV life cycle metrics where only the output energies ignoring the degradation rate (DR) influence. In this study, the environ-economic analysis of three PV technologies, namely, multi-crystalline silicon (mc-Si), amorphous silicon (a-Si) and hetero-junction with an intrinsic thin layer (HIT) have been carried out in identical environmental conditions. The energy performance parameters and the DR rate of three PV technologies are evaluated based on the monitored real time data from the installation site in hot semi-arid climates. The assessment demonstrates that the HIT PV module technology exhibits more suitable results compared to mc-Si and a-Si PV systems in hot semi-arid climatic conditions of India. Moreover, energy metrices which includes energy payback time (EPBT), energy production factor (EPF) and life cycle conversion efficiency (LCCE) of the HIT technologies are found to be 1.0, 24.93 and 0.15 years, respectively. HIT PV system has higher potential to mitigate the CO2 and carbon credit earned compared to mc-Si and a-Si PV system under hot semi-arid climate. However, the annualized uniform cost (UAC) for mc-Si (3.60 Rs/kWh) and a-Si (3.40 Rs/kWh) are more admissible in relation to the HIT (6.63 Rs/kWh) PV module type. We conclude that the approach of considering DR influenced life cycle metrics over the traditional approach can support to identify suitable locations for specific PV technology.

1. Background

The world is moving towards carbon emission reduction from the environment. After the Paris agreement in 2015, it was decided to maintain an earth environment average temperature increase below 2 °C above pre-industrial levels and undertake rapid global emission reductions [1]. Now, global warming is one of the biggest challenging problems for the earth’s environment. Energy sector is the one that greatly effects the earth’s environment and has a considerable share of global carbon emission. In recent years, energy sector had come up with green and sustainable pathways for energy generation. Among them, the use of renewable fuels for energy generation are given utmost priority. Out of all the renewables, photovoltaic (PV) is in the forefront and has gained global attention. PV is one of the promising technologies that can generate clean energy without releasing harmful gases into the environment. In the 21st Century, the demand for PV system installations is increasing worldwide. The total installed capacity of different PV systems has increased up to 415 GW till August 2018 [2]. Similarly, India has increased its installed capacity for grid-connected and off-grid-connected PV systems up to 24,582.23 MW and 843.11 MW, respectively, as of 30 March 2017 [3,4]. Although, the PV installations have seen a tremendous progress in India, but many worried about their practical performance. It is observed that, the PV plants operates with low performance ratio (PR) than the actual PR. Weather parameters are the primary reasons for lower PR. In addition, the weather parameters are responsible for the performance degradation in PV modules. Nowadays, degradation of different technologies’ PV modules is one of the major issues to increase their lifetime. The degradation rate (DR) of power in a multi-crystalline silicon (mc-Si) PV module is found to be 1.45–3.41%/year after 3 years of outdoor exposure in Morocco. It generally happens due to a decrease in open circuit voltage (Voc) and fill factor (FF). Perhaps, it also decreases due to a hot spot; meanwhile, the shunt resistance increases [5]. The DR in amorphous silicon (a-Si) PV module is found to be 1%/years cause of annealing effect due to change in the seasonal spectra [6]. Overall, it is understood that electricity produced from the PV plants is not constant and on long run there will be decline in a produced electricity.
In this context, while evaluating the performance of PV plant, it is important to consider the effective electrical energy outputs. It is also important to consider the amount of energy that is spent in the life cycle process of the PV plant while evaluating its performance. PV module manufacturing required many components, which are highly energy intensive. The magnitude of energy consumed by all processes involved in the manufacturing of system components is known as embodied energy. It includes all the energy consumed by the components during micro and macro level processes [7]. The manufacturing of different PV components contributes to huge energy consumptions and emissions [8]. Hence, in this study, we aim to evaluate the environ-economic feasibilities of the three different PV technologies based on the degradation influenced life cycle metrics. Experimental results are presented based on the real time monitored data from the actual field condition.
The focus of the present study is the following:
  • To perform the energy performance and possible degradation in energy for mc-Si, a-Si and HIT PV module technologies.
  • To perform the life cycle assessment of the mc-Si, a-Si and HIT PV module technologies considering their energy performance with degradation rate under hot semi-arid climate of India.
  • To identify the suitability of three different PV technologies operating under the same environmental conditions.
In this context, an experimental test facility of a-Si, HIT and mc-Si PV system has been set up under joint collaboration with the National Institute of Advanced Industrial Science and Technology (AIST), Japan, and the Ministry of New and Renewable Energy (MNRE), Government of India during 2012. The present research area has not been explored yet for different PV systems; therefore, the present study will not only provide the inputs for the decentralized power generation applications but also help in formulating a policy for the promotion of PV systems in the region. According to the mathematical and methodological guidelines presented in Section 4 and Section 5, the work is organized.

2. Literature Review

In the literature, many reported the life cycle metrics of commercial photovoltaic systems. For example, Pacca et al. [9] investigated two types of technologies, namely a-Si and mc-Si; and the results show the energy payback time (EPBT) and carbon dioxide (CO2) emission of the a-Si and mc-Si are 1.6, 5.7 years and 34.3 and 72.4g of CO2/kWh, respectively. Ito et al. [10] reported the results of sc-Si and mc-Si PV technologies in real operating field conditions. The EPBT and CO2 emission of sc-Si and mc-Si are found to be 1.5 years, 15.5 years and 9.4 g-C/kWh, 91 g-C/kWh, respectively [11]. The CO2 emission from the PV module is one fourth in comparison to the fossil fuels [12]. Battisti and Corrado [13] suggested that the environmentally friendly products help to mitigate the CO2 emission at the time of the PV module component manufacturing process. A 100 MW crystalline silicon (c-Si) PV system has been used in the Gobi Desert. Further, CO2 emission and EPBT were found to be 12 g C/kWh and 1.7 years, respectively [14]. Akinyele et al. [15] compared the results of 1.5 kW PV systems among the six different climatic conditions. The global warming potential and EPBT for the system was found to be 1907 kg CO2 and 0.83 years, respectively, based on the Nigerian country’s northeast zone. Moreover, the life cycle conversion efficiency (LCCE) analysis of 2.32 kW PV systems for climatic conditions of India has been done after 20 years of field exposure. For the system, unit price of the electricity is 61.91 Rs/kWh, EPBT is 18.93 years and net CO2 mitigation is 25.80 tCO2e [16].
The a-Si PV module requires less embodied energy compared to other PV technologies, but efficiency is low. Nevertheless, the EPBT of a-Si has a lower value of 2.5–3.2 years [17]. EPBT for mono crystalline silicon PV module using different degradation rate has been calculated by Rajput et al. [18] in hot semi-arid climatic conditions. They revealed that EPBT are 8.80 and 9.29 years for degradation rate of 0.3%/year and 0.9%/year, respectively. Similarly, performance of various PV technologies that include a-si, micromorph silicon, single crystalline silicon (sc-Si), mc-Si, copper indium gallium selenide (CIGS), and cadmium telluride (CdTe) has been compared and CdTe technology found to be best in terms of EPBT [19]. The EPBT of PV systems varies from 3.6–4.9 years and greenhouse gas emission ranges from 35–58 g CO2e/KWh. Initially, EPBT of PV module was reported 40 years by [20] in actual outdoor conditions. Further, the EPBT for rooftop and the ground-mounted PV system was found to be 2.5–3 years and 3–4 years, respectively. The CO2 emission occurs in production of a rooftop PV system about 50–60 g/kWh and it may decrease up to 20–30 g/kWh [21]. Different PV systems have been compared and analyzed worldwide by Rodrigues et al. [22].
Further, two case studies based on 1 kW and 5 kW PV systems have been carried out and concluded that Germany and India are the most suitable countries to install a 1 kW PV system while Italy is the most suitable for a 5 kW PV system. Mason et al. [23] have explored the performance of mc-Si of 3.5 MW at Tuscon city. They found that the greenhouse gas emission throughout the life and EPBT are 29 kg CO2 eq./m2 and 0.21 years, respectively. An environ-economic analysis and energy matrix of PVT air collector have been studied by Agrawal and Tiwari [24]. They have concluded that EPBT for system is 1.8 and 7.8 years, in terms of thermal energy and exergy, respectively. Moreover, the annualized uniform cost on the basis of exergy and energy was found to be 15.7 Rs/kWh and 3.6 Rs/kWh, respectively. Bouaichi et al. [25] have taken 76 PV modules which are copper indium gallium selenide (CIS), micromorph, mono crystalline (m-Si), and poly crystalline (p-Si) for degradation analysis and found higher degradation rate compared to that given by manufacturers.
Few studies explored the life cycle analysis of various technologies related to renewable energy such as solar thermal, PV, and biomass [24,26,27,28,29,30,31]. Considering the PV studies. shown in [9,10,11,12,13,14,15,16,18,19,20,21,22,23,24,25], many have investigated the life cycle metrics such as EPBT, CO2 emission, and cost details for various PV technologies where the influence of degradation, which is an essential performance indicator in energy assessment of PV, is not considered. In PV technologies, the degradation is possible which affects the overall energy generation process. Studies reveal that degradation in PV could vary based on the climate and PV technology, and the severity of occurred vulnerability (either internal or external) [17,18,25,32]. Rajput el al. (2019) explored the failure mechanism of PV modules and their impact on degradation [32]. On the other side, Kumar et al. (2019) investigated the degradation which influenced revenues from the PV systems and it is suggested that the degradation will reduce the financial gains in the long run [33].
Even after realizing the effects of degradation over the PV performance, the consideration of this key parameter while evaluating life cycle metrics is given less priority. Hence, in this study, energy performance with degradation rate evaluation is given a priority before the life cycle metrics evaluation. An environ-economic assessment of the three different technologies has been carried out based on the degradation influenced life cycle metrics. The methodological guidelines based on international standards are used and these guidelines can be found in [31,34].

3. Description of the mc-Si, HIT and a-Si PV Systems

The three different technologies of PV systems: a-Si, HIT, and mc-Si have been installed during 2012 on mild steel fixed structures facing south with an inclination of 28° at the National Institute of Solar Energy (NISE), Gurgaon (Latitude 28°37 N, Longitude 77°04 E) (see in Figure 1).
The site is having monthly ambient air temperature varying from 11 to 35 °C and monthly global irradiation on horizontal plane varying from 2.6 to 6.1 kW h/m2 a day [35]. The total installed capacity of mc-Si PV system, a-Si and HIT PV system are 1.6 kWp, 1.2 kWp and 1.68 kWp, respectively. The rated capacity of a-Si PV module is 75 Wp each and all 16 a-Si PV modules connected in 4 parallel strings of 4 modules in series. The rated capacity of the HIT PV module is 210 Wp each, total 8 PV modules of HIT connected in 2 parallel strings having 4 modules in series. Similarly, the rated capacity of mc-Si PV module is 160 Wp and all 10 PV modules are connected in 2 parallel strings with 5 PV modules in series.
Figure 2 shows the schematic layout of the data recorded facility for three PV systems. The data logger stored the I-V characteristic curves with maximum power of each technology after 10-min interval. The meteorological data recording instruments are established at roof of the control room as shown in Figure 3. The accuracy of the measuring instruments used in data monitoring from the filed deployed PV systems is shown in Table 1. These instruments recorded the data for every 10-min interval by the Campbell Scientific Data logger CR-1000. The recorded data includes current in Amps, voltage in Volts, solar irradiance in kWh/m2, ambient and module temperatures in °C, wind speed in m/s, and wind direction.

4. Operational Performance and Life Cycle Metrics

This section presents the life cycle indicators used in the present study to perform the comparison of three PV module technologies as per environmental and economic aspects. The energy performance evaluation majorly includes the energy outputs, performance ratio (PR), and degradation rate (DR). The life cycle evaluation majorly includes calculation of LCCE, EPBT, and EPF. Further, the CO2 emission and mitigation along with carbon credit are used to analyze environmental aspects. The end-of-year UAC is used to investigate on economic viability of the system. It is important to note the payback and environmental mitigation indicators depend on the operating conditions of the PV technologies.

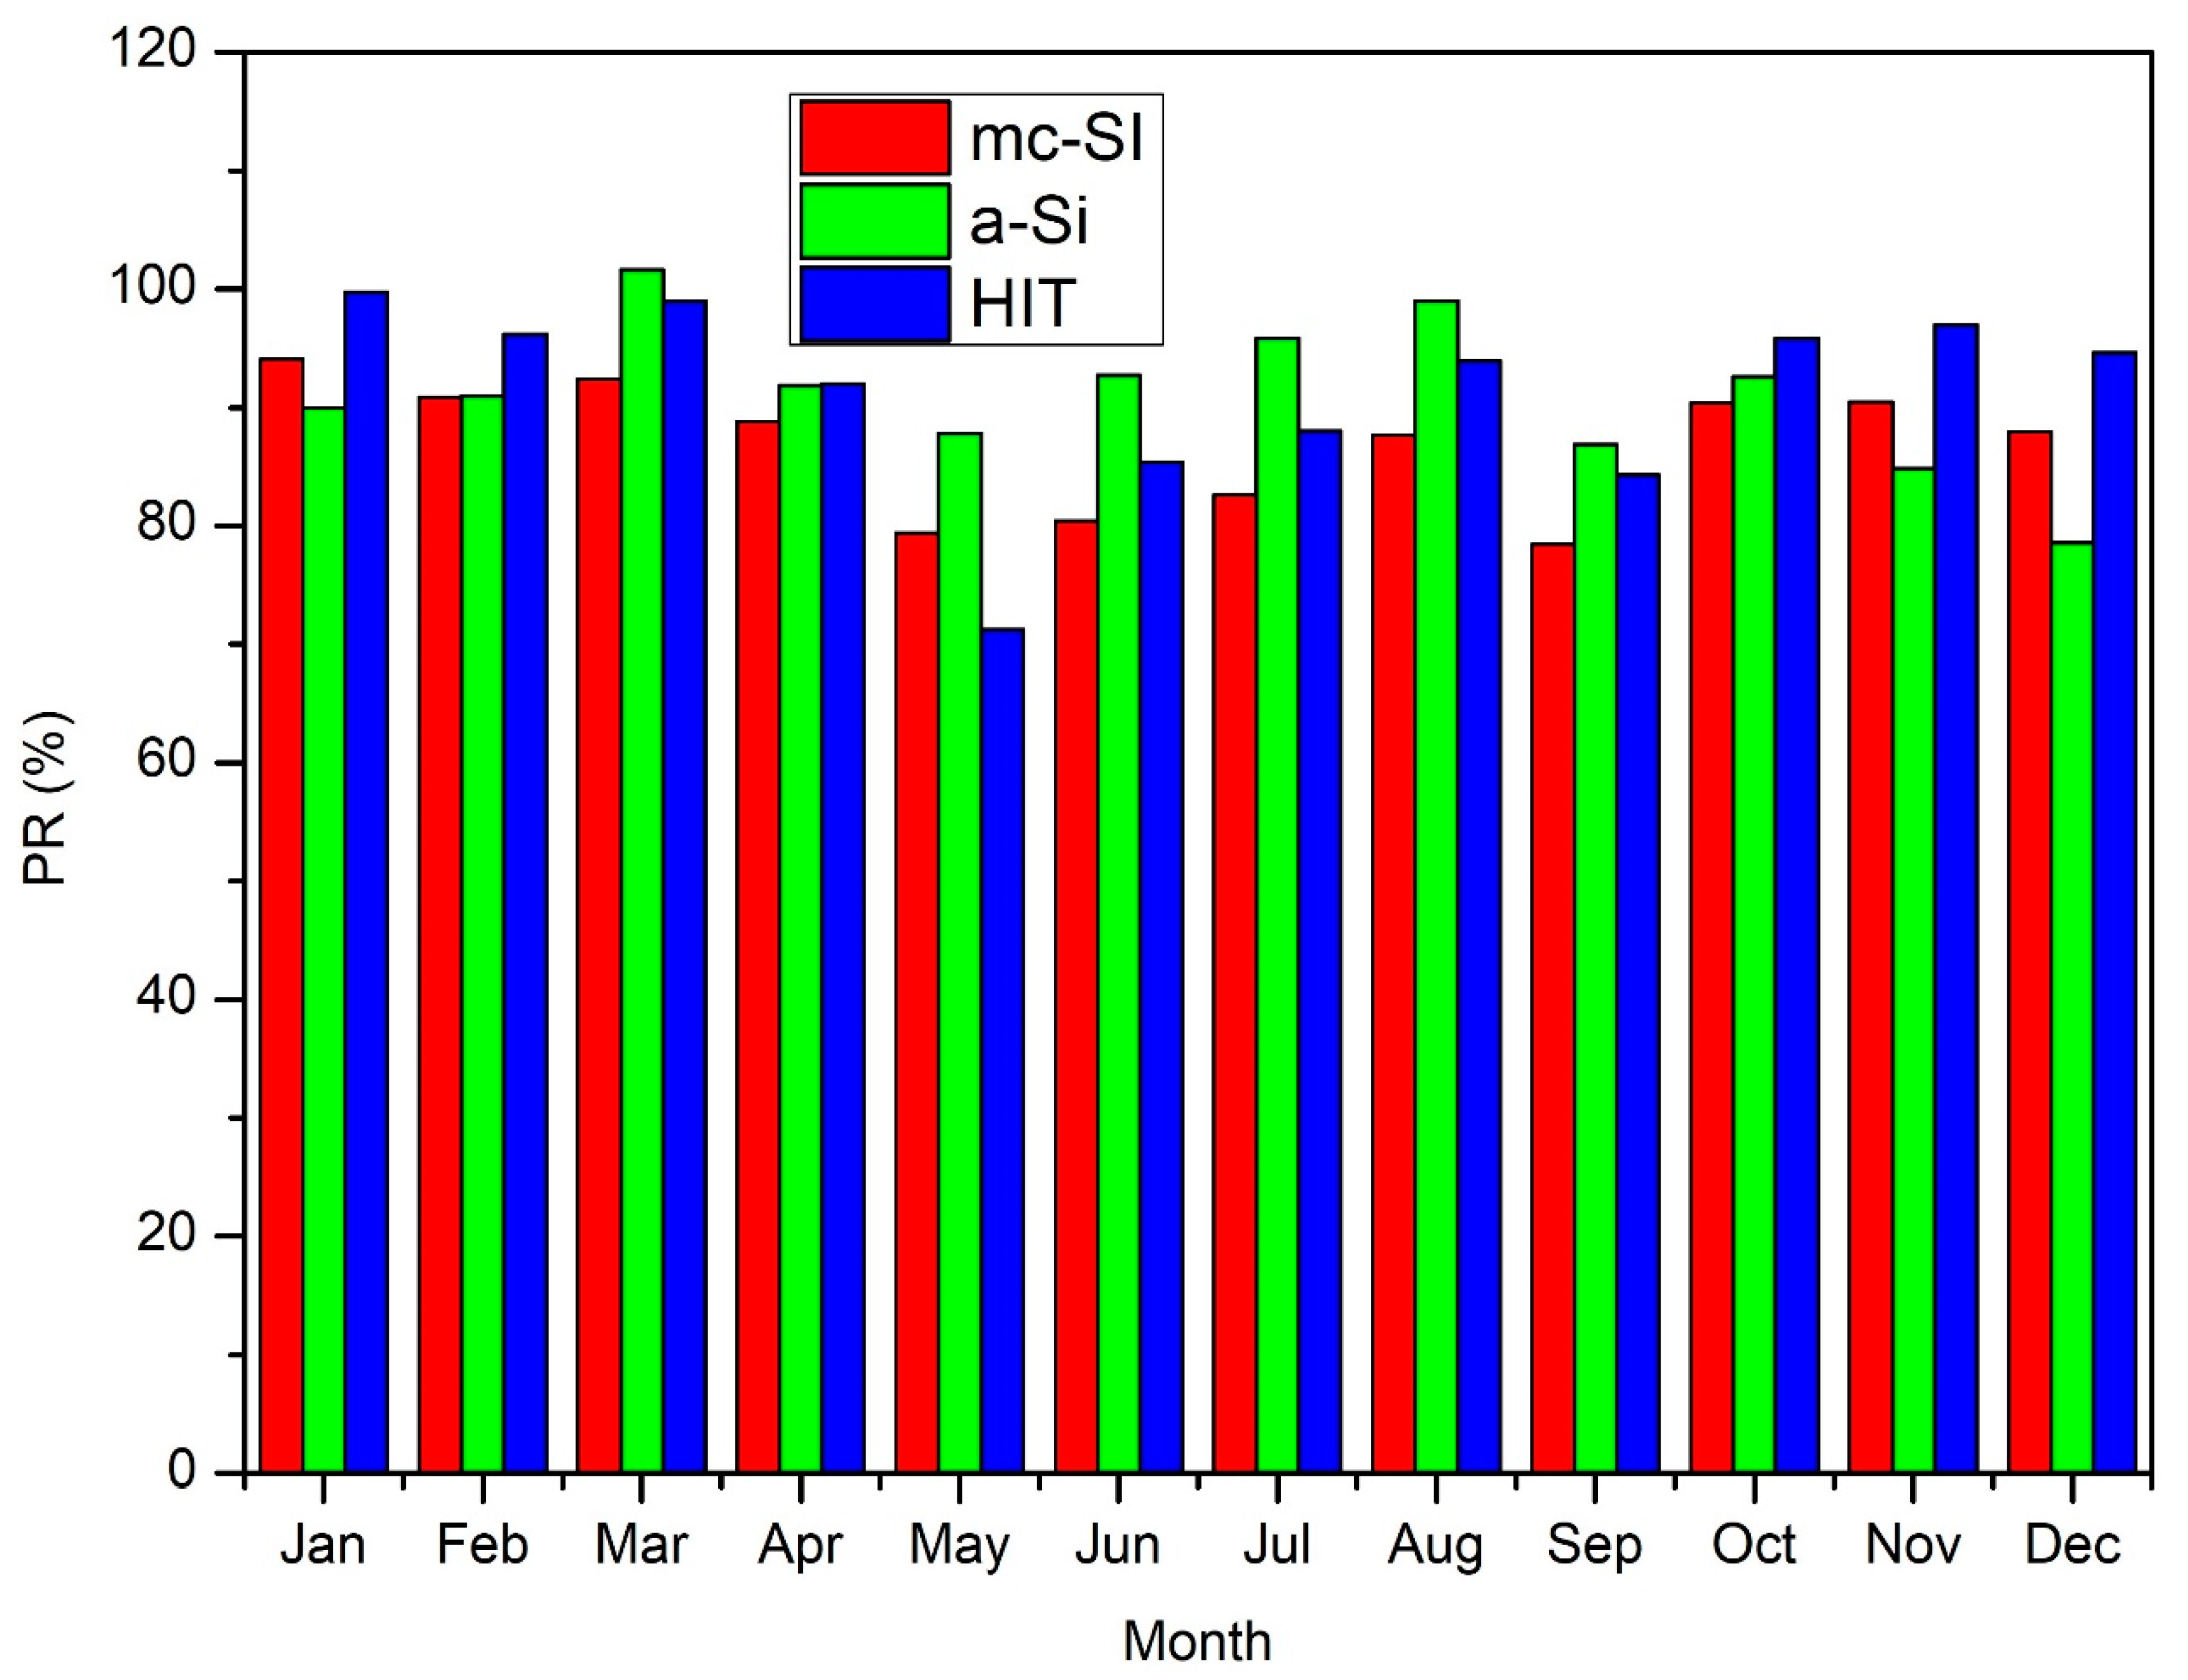
4.1. Performance Ratio (PR) and Degradation Rate (DR)

The yearly electricity generation from the PV system is influenced by many factors such as temperature, wind speed, fault condition, shading and others. Performance ratio (PR) is an indicator that is widely accepted and used for assessing the quality of PV system operation. PR generally takes into account every external and internal vulnerability that affects the PV performance. Mathematically, it is expressed as follows [36,37,38]:
PR = ( E o u t , y P r a t e d ) ( G p o a , y G o )
where, the ( E o u t , y P r a t e d ) represents the final yield that is amount of electricity produced from the PV plant ( E o u t , y ) to its rated peak capacity ( P r a t e d ); the ratio, ( G p o a , y G o ) represents the reference yield that is the amount of daily irradiance available on the plane of array ( G p o a , y ) to the reference irradiance ( G o ).
For evaluating the degradation rate of any PV technology, there exist few methods in literature. These methods generally consider the time series performance ratio data [36,37,38]. Methods such as Linear Regression (LR), Classical Seasonal Decomposition (CSD), Auto Regressive Integrated Moving Average (ARIMA), and Locally Weighted Scatterplot Smoothing (LOESS) widely followed [39,40,41]. In this study, degradation rate of three PV technologies is evaluated based on the regression analysis. The DR of any PV technology considering the time series data of performance ratio is given as follows [42,43]:
DR = m × 12 c
where, m and c represent the regression coefficients. To make it more specific, m is slope and c is y -intercept of the performance ratio to the time; and y = m x + c .

4.2. Energy Payback Time

The EPBT indicates the time required to generate energy by the PV system annually to the energy used to produce the system itself [34]. The EPBT is given by:
E P B T = E i n p u t E o u t , y   [ years ]
where, E out , y is the yearly electricity generation from the PV system (MJ/m2); E input is the embodied energy (primary energy demand) (MJ/m2). Embodied energy includes energy required in manufacturing processes involved in making the product, construction process, use and end-of-life stage, defined as:
E input = E mat + E manuf + E trans + E inst + E EOL   [ MJ / m 2 ]
where, E mat is the primary energy demand for the producing materials; E manuf is the energy required in manufacturing of PV system; E trans is energy required in transporting the materials; E inst is energy required in installation of PV system and E EOL is energy required for its management at the end-of-life.
Therefore, any system will be useful if the energy generation during the whole life is higher than the energy applied in the manufacturing process [21].

4.3. Energy Production Factor (EPF)

EPF, also noted as Energy Return on Investment (EROI), is the ratio between the electricity generation over the lifetime and the energy quantity invested for the chain of manufacturing processes, defined as [44]:
EPF = E out E input = E o u t , y * T E input
where, T = life of the PV system (year). EPF > 1 means the electricity from the PV system is more than the energy required for the manufacturing processes of equipment. If EPF is more than 1 then only the system is feasible, otherwise it is not worth it from an energy point of view. The EPF is inversely proportional to the EPBT, but unlike by the EPBT, it takes into account the performance of the PV system over the lifetime.

4.4. Life Cycle Conversion Efficiency (LCCE)

LCCE is the ratio of net energy generation of PV system with respect to the solar radiation over the lifetime of PV system [34] given by
L C C E = E o u t E i n p u t E s o l * T
where, E s o l = yearly solar irradiation [MJ/m2]. The value of LCCE should be less than but close to 1 for efficient power plant.

4.5. CO2 Emission, Mitigation and Carbon Credit

It is noted that PV system is found to be environment friendly in comparison to other sources of electrical energy. The environmental impact can be evaluated by the CO2 emission over the lifetime [34], as follows:
C O 2   e m i s s i o n = E i n p u t * 1 1 L a * 1 1 L t d * 0.98 kg   [ kgCO 2 ]
where, L a and L t d are the losses during the transmission and distribution, respectively. Practically, 0.98 kgCO2/kWh is the average CO2 emission for electricity generation from coal [16]. Therefore, the net CO2 mitigation over the life of the system can be calculated as:
Net   CO 2 mitigation   = ( E out E input ) * 1 1 L a * 1 1 L td * 0.98 kg   [ kgCO 2 ]
The carbon credit represents the permitted amount of carbon emissions to a country and can be exchanged by credits. The CO2 emission is traded at € 21/tCO2e (European Climate Exchange), so the carbon credit earned by the PV system is obtained as:
Carbon   credit   = ( E out E input ) * 1 1 L a * 1 1 L td * 0.98 * 10 3 t * 21 tCO 2 e   [ ]

4.6. Uniform End-of-Year Annual Cost

An economic evaluation has been performed using the net present value of the PV system. The UAC gives the information about the cost per unit electricity in kWh over the lifetime of a PV system. It can be calculated as [45]:
U A C = uncost E out [ / kWh ]
where, the annual uniform cost (uncost) is given by:
uncost = N P V * F CR , I , n   [ ]
The Net Present Value (NPV) is the present value of system that can be computed as:
NPV = P + O & M * F C R , i , n + R * F SF , i , n S * F SF , i , n   [ ]
with P as the capital cost of the total costs of the investment to implement the system; O&M is the annual cost for the operation and maintenance; R is the annual cost to replace components; S is the cost for the decommissioning system; i and n are the rate of interest and life of the PV system, respectively.
A capital recovery factor F C R , I , n converts a present value into a stream of equal annual payments over a specified time at a specific discount rate (interest). The sinking fund factor F S F , I , n provides the payment for each year at a given rate of interest to get a specified sum at some given future time period [46].
F C R , i , n = i ( i + 1 ) n ( 1 + i ) n 1 F S R , i , n = i ( 1 + i ) n 1
where, F C R , i , n is change present cost into UAC and F S R , i , n is convert future cost into UAC [47].

5. Methodology

The life cycle metrics for three technologies have been calculated by using the actual energy yield in kWh of each installed technology. The irradiation data has been collected during the operation condition of PV plants in the years 2016–2017. To evaluate the embodied energy referred to three different PV technologies, the data per kWp module has been considered, as given in Table 2, Table 3 and Table 4. Furthermore, the annual primary energy demands for operation and maintenance have been considered the same for all PV panels, so it is neglected in the comparison. Performance ratio and degradation rate of three PV technologies are evaluated using Equations (1) and (2).
In order to investigate the life cycle parameters, the present analysis considers the end of life as 30 years and a linear degradation rate of the PV module of 0.5%/year. The EPBT, FPF, LCCE have been evaluated by Equations (3), (5) and (6). In order to determinate CO2 emission, mitigation and carbon credit with the help of Equations (7)–(9), it has been assumed 1 € can be converted in rupees by multiplying the current euro rupee conversion factor 1 € = 78 Rs (March, 2019). The cost break-up of installed a-Si, HIT and mc-Si PV systems is given as Rs 54800, 148400 and 73200 without taking the cost of area in which PV systems are installed, which can be seen Table 5. For LCCE calculation, the annual repair cost and salvage value have been taken as 10% and 5% of the capital cost, respectively. The replacement cost was considered null. The Indian government used to promote the renewable energy installations, so low interest rate loans are available through banks which can be considered as 5% [16].
The life cycle cost evaluation is also carried out by the help of expected PV generation data. The expected PV energy output over the lifetime E out , ex can be calculated as [44]:
E o u t , e x = E sol * η PV * PR * T   [ MJ ]
where, E sol is average solar irradiation over system’s lifetime (MJ/m2); η PV is PV module energy harvesting efficiency [%]; PR is performance ratio [%]; T is expected life of the PV system (year).
Further, a sensitivity analysis has also been carried out through varying the degradation rate of the PV module between 0.5–1.5%/year, as well as the interest rate in the range of 5–15%.
The flow chart diagram given in Figure 4 summarizes the approach adopted to perform the comparison study for three PV module technologies.

6. Results and Discussion

The experimental output from mc-Si (1.6 kWp), a-Si (1.2 kWp) and HIT (1.68 kWp) PV systems is analyzed during 2016–2017 from January to December. The yearly solar irradiance is found to be 1734.13 kWh/m2. On-field, the annual electrical output of the mc-Si, a-Si and HIT PV systems is measured as 2408.41 kWh, 1904.81kWh and 2648.3kWh.
The monthly average energy output and irradiance are shown in Figure 5. Here, the final energy yield is considered to compare three PV systems. It can be seen that the energy output from three PV plants is different under the same solar irradiation. Such differences could be due to faults of various components of PV systems during the operating conditions.
The performance ratio is depicted in Figure 6. The a-Si PV system shows high performance from May to September. During the winter season, the best performance is provided by the HIT PV system. On annual basis, the PR is found of 86.95%, 91.05% and 91.42% for the mc-Si, a-Si and HIT PV systems, respectively. The low-light performance and temperature dependency are the major reasons for PR variation with respect to PV modules that are exposed to similar weather conditions. Among the three PV modules, the PR of the HIT PV is very high due to the positive temperature characteristics of heterojunction solar cells. The temperature co-efficient of the HIT PV module is −0.258%/°C which significantly have less effect on the overall performance degradation. In the case of mc-Si, the temperature co-efficient is around −0.5%/°C, which indicates the effect of temperature is very high on the performance degradation [48].
The total embodied energy for the PV systems is found to be 21,641.18 kWh, 11,313.23 kWh and 2654.92 kWh, respectively (Table 2, Table 3 and Table 4). The embodied energy of the HIT PV system is definitely lower in comparison to a-Si and mc-Si PV systems.
Table 6 shows the main results of the life cycle parameters for mc-Si, a-Si and HIT technologies, by using the actual field performance data for each technology computed over the lifetime. The EPBT for mc-Si, a-Si and HIT technologies calculated as 8.98 years, 5.93 years and 1.0 years respectively. Equation (5) is used to obtain the EPF as 3.34 (mc-Si), 5.05 (a-Si) and 29.93 (HIT). The LCCE for all three PV systems is found to be 0.04, 0.03 and 0.16. It is evident that the short EPBT and high EPF and LCCE demonstrate that HIT PV system represents the best agreement between the returned and invested energy with respect to mc-Si and a-Si PV systems.
CO2 emission over the lifetime of the PV system is evaluated by using Equation (7) and found to be 44.1, 23.1 and 5.4 for mc-Si, a-Si and HIT PV systems respectively. Further, the net CO2 mitigation for mc-Si, a-Si and HIT PV systems calculated as 103, 93 and 157 tCO2, respectively. Carbon credit earned is found to be Rs 169,118, Rs 153,145 and Rs 256,609 for all three PV technologies. They were directly affected by the embodied energy of each system.
The life cycle cost analysis is carried out for PV systems for a lifetime of 25 years and 5% interest rate in order to estimate the cost per unit electricity, generated by PV systems in terms of Rs/kWh. The component cost of the installed mc-Si, a-Si and HIT is given in Table 5 and based on the cost data, the NPV, uncost and UAC which are obtained by using Equations (10)–(12). Results for the cost analysis for mc-Si, a-Si and HIT PV systems have been shown in Table 7. The cost per unit electricity in kWh over the lifetime is found to be 5.67 RS/kWh, 5.37 RS/kWh and 10.46 RS/kWh for mc-Si, a-Si and HIT PV systems, respectively.
Previous works were collected as shown in Table 8. A comparative analysis of EPBT and CO2 mitigation of different PV technologies installed in various locations demonstrates longer EPBT and higher CO2 mitigation for the mc-Si than a-Si and HIT (see Figure 7). The technologies of the present study show EPBT and CO2 mitigation according with results coming from the previous study.
The PV energy generation influences the whole life cycle cost assessment. Here, the actual energy yield in kWh is used to evaluate the life cycle indicators as summarized in Table 6, as well as the cost analysis results in Table 7. Then, the expected PV energy output is computed over the 30 year lifetime according to the Equation (12) and found to be 159,265 kWh, 95,723 kWh and 75,070 kWh, by considering a solar irradiation of 1700 kWh/m2/year with actual PR.
As depicted in Figure 8, the expected energy yield of the mc-Si is much higher than the actual performance. This leads to a significant impact on the life cycle metrics. The comparison of EPBT, EPF, LCCE, Net CO2 emission and carbon credit earned by using the actual and expected PV generation for mc-Si, a-Si and HIT PV systems is shown in Figure 9.
When the expected PV energy output is used in the evaluation, the EPBT decreases from 8.98–1.3 years for mc-Si, from 5.93–2.43 years for a-Si, and no change for HIT, considering that the actual and expected PV power output are quite similar. However, EPF, as well as LCCE, increased up to 55% and 40% for mc-Si and a-Si technologies, respectively.
In terms of net CO2 emission and carbon credit, the mc-Si PV system is less environmentally friendly if the expected PV generation is taken into account in the assessment. It is found that the net CO2 emission can be reduced from 129.64 tCO2 to 74.05 tCO2 when the actual data are used. However, the a-Si PV system can contribute to a reduction up to 80% of net CO2 emission using the expected PV energy in the assessment. A sensitivity analysis about the effect of degradation on the life cycle indicators is carried out. A varying of the degradation rate between 0% and 1.5%/year until the end of life (30 years) is considered and the corresponding results are plotted in Figure 10.
When the energy losses over the long term increase up to 1.5%, EPF, LLCE and net CO2 emission can be decreased up to 22%. Particularly, at 1.5% degradation rate over time, leads the equal drop in EPF of 19% for the three technologies. The LCCE and net CO2 emission are reduced by 21%, 22% and 20% for mc-Si, a-Si and HIT technologies, respectively.
Therefore, the degradation should be minimized to get maximum benefits from the system’s environmental point of view. It is noted that the degradation rate does not impact on EPBT because the latter considers the yearly energy output and not the electricity generation over the lifetime from the PV system.
The varying the interest rate on the UAC is also investigated. As shown in Figure 11 the increasing from 5% to 15% of interest causes the rise of the cost per unit electricity in kWh over the life time of three PV systems up to 83% resulting 36.57 RS/kWh, 34.61 RS/kWh and 67.42 RS/kWh for mc-Si, a-Si and HIT PV systems respectively.

7. Conclusions

The performance of the different PV technologies does not remain the same during its field exposure due to the fact of change in behavior of environmental parameters as well as the material used to construct the PV module. Consequently, the energy payback time, CO2 mitigation and unit cost should change. The environ-economic study has been performed for mc-Si (1.6 kW), a-Si (1.2 kW) and HIT (1.68 kW) photovoltaic systems under the same hot semi-arid climatic conditions of India by actual performance of the PV systems. Based on the present study, the following conclusions have been drawn:
  • The HIT PV module technology is a new emerging technology with short EPBT (1.0 years) in comparison to mc-Si (8.98 years) and a-Si (5.93 years) PV systems. Similarly, the HIT PV system performs better than mc-Si and a-Si technologies in term of EPF and LCCE.
  • CO2 emission is found to be 78.68 tCO2, 74.05 tCO2 and 129.64 tCO2 for mc-Si, a-Si and HIT, respectively, considering the life of PV systems as 25 years. Therefore, the HIT PV system can provide higher CO2 mitigation and carbon credit earned than mc-Si and a-Si PV systems.
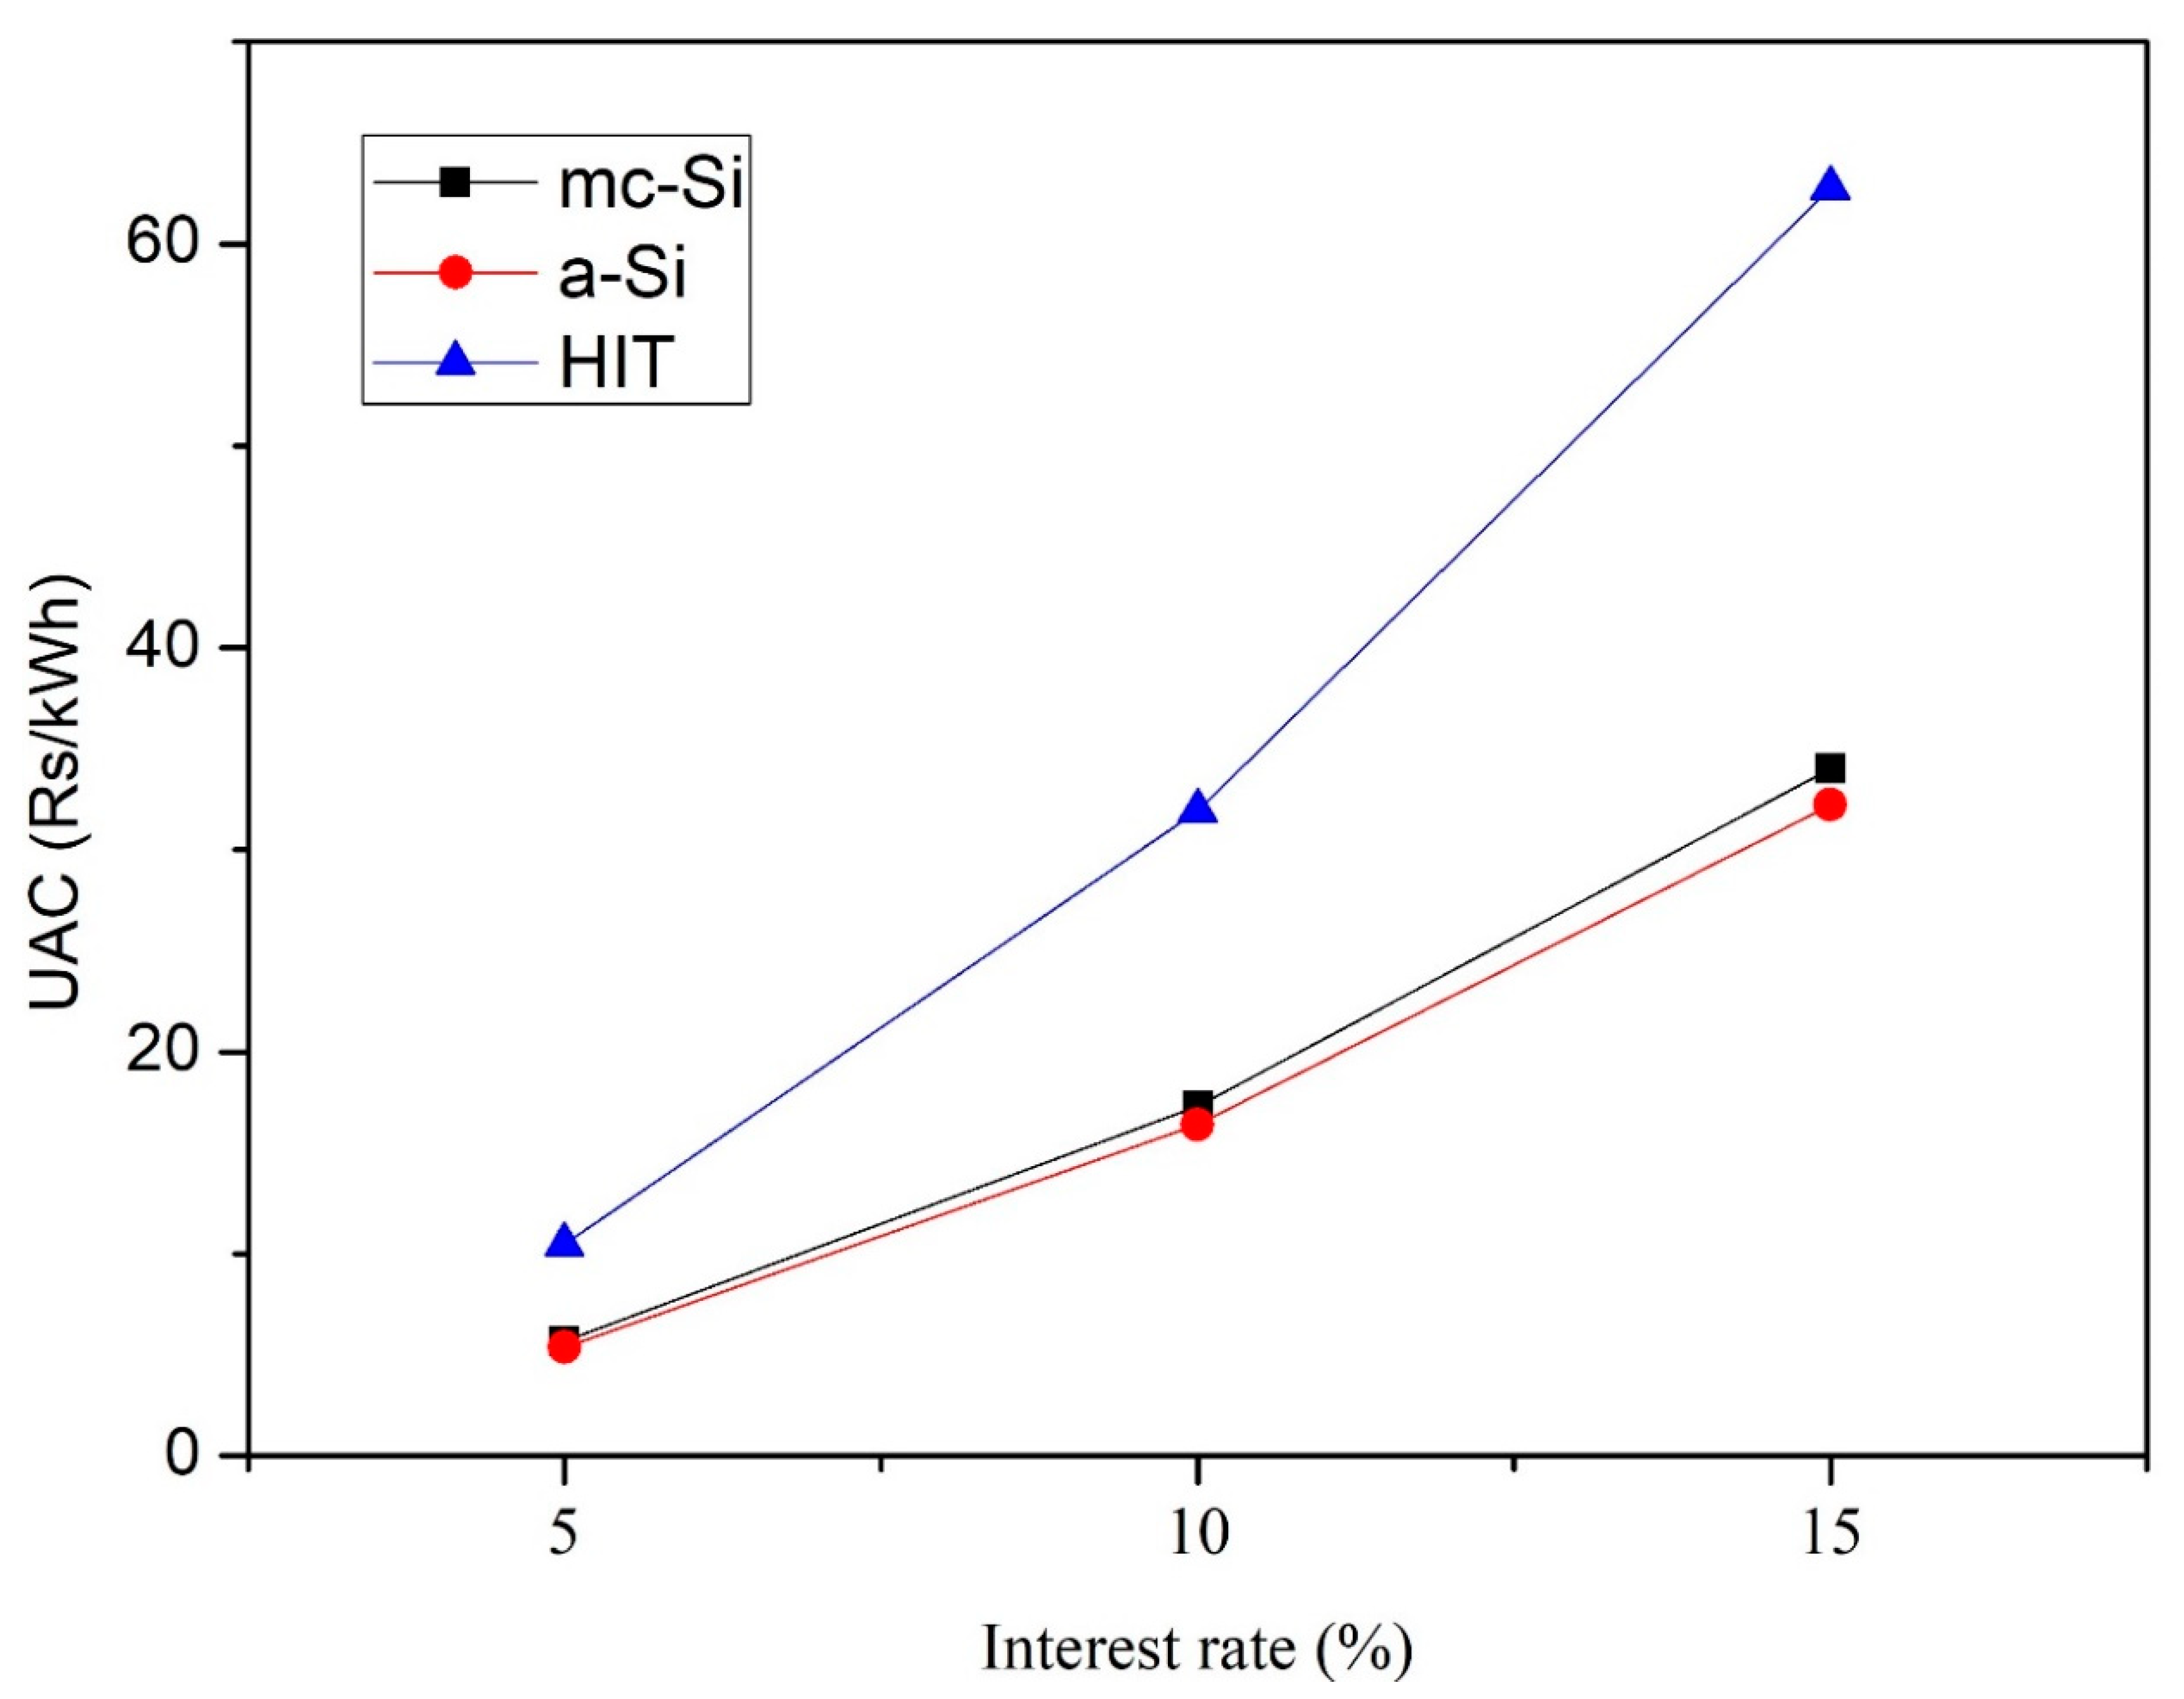
  • The uniform end-of-year annual cost is higher for HIT technologies (6.63 RS/kWh) than mc-Si and a-Si.
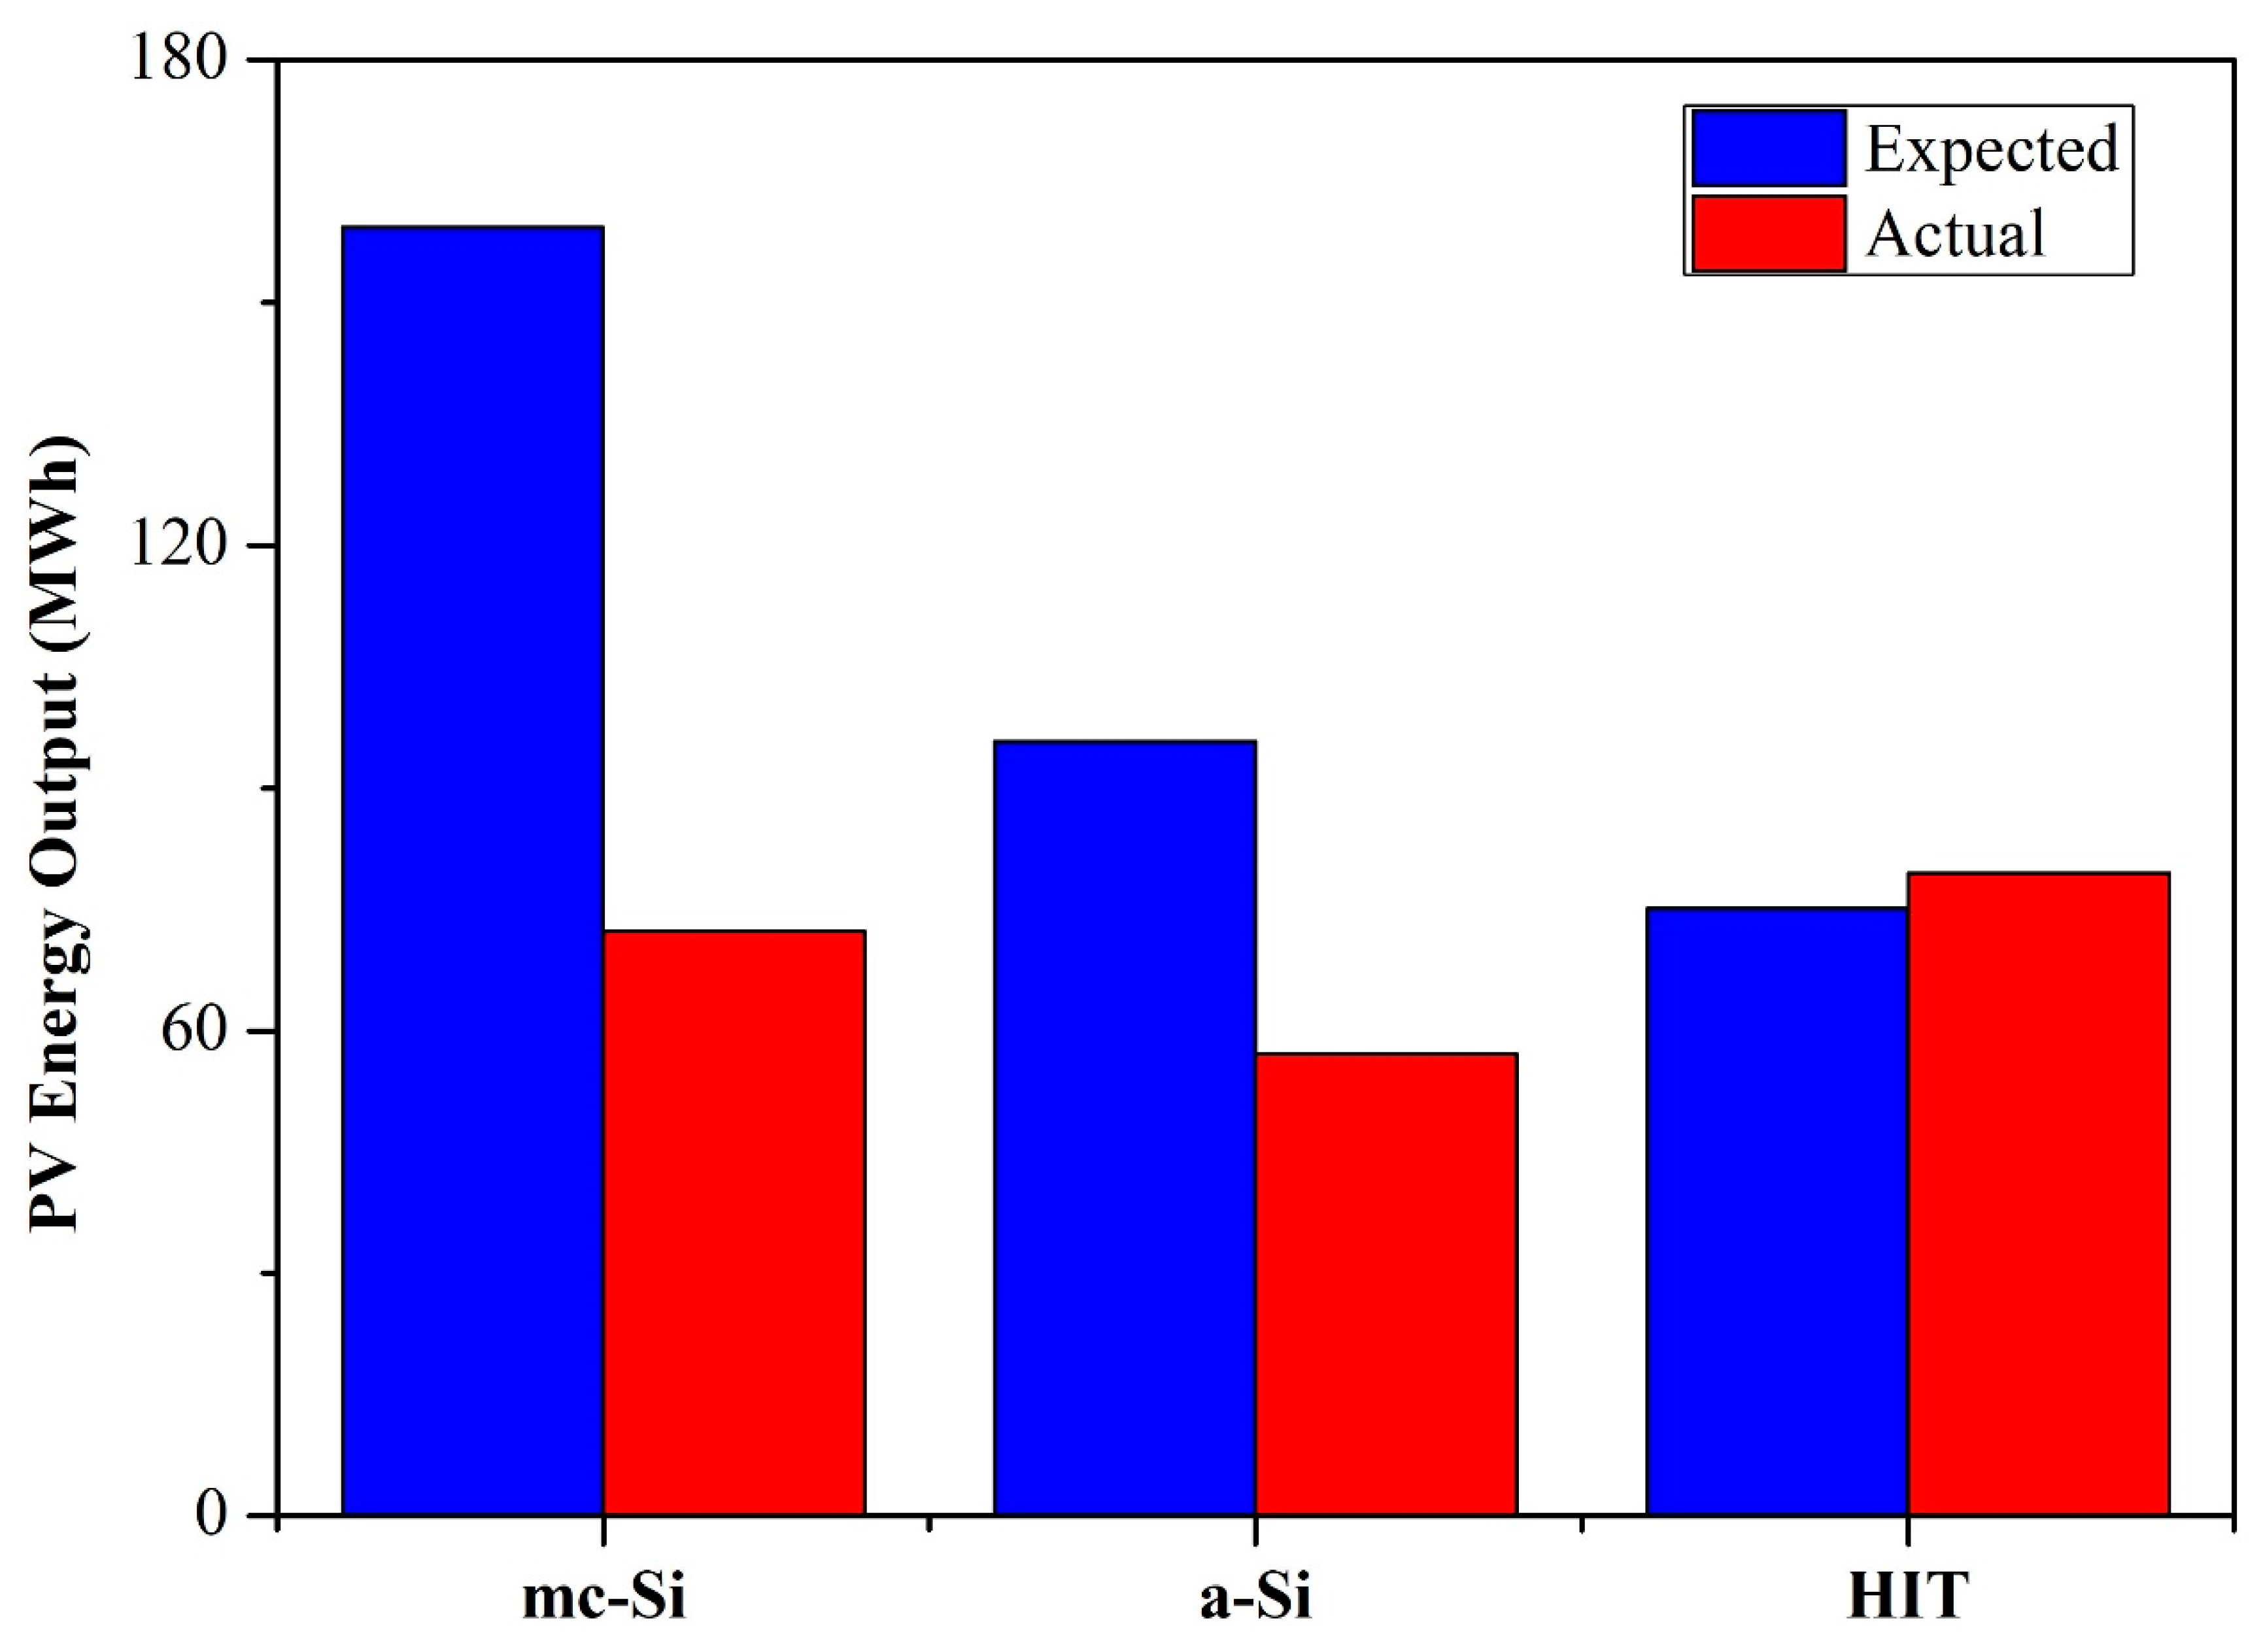
  • Life cycle cost analysis has been carried out by using the actual performance of installed PV technology. In fact, significant impacts on the life cycle metrics have been quantified using the expected PV energy data in the formulation of the life cycle metrics. This can lead to a corrected environ-economic assessment finalized to identify the more suitable PV module technology in a given climatic condition.
  • A sensitivity analysis has also been carried out by varying the degradation rate and interest rate. When the degradation rate rises up to 1.5%/year over the lifetime, a decreasing of the EPF up to 19% can be found for mc-Si, a-Si and HIT technologies. Further, the LCCE and net CO2 emission can decrease up to 21% on average for three technologies.
Finally, the HIT PV module technology shows to be a suitable technology in a semi-arid climate. Therefore, the present study will support to perform the investment return estimation for new installations in India. It will also provide support in formulating a policy for the promotion of renewable energy-based PV systems in the Indian region, as well as be helpful in mitigating the emission of carbon during the manufacturing process of the PV module components.

Author Contributions

Conceptualization, P.R., M.M., N.M.K., and O.S.S.; Data curation, P.R., and M.M.; Formal analysis, P.R., M.M., and N.M.K.; Methodology, P.R., M.M., N.M.K.; Resources, O.S.S., N.M.K., and A.J., Visualization, M.M., and N.M.K.; Writing—original draft, P.R., M.M., and N.M.K.; Writing—review & editing, P.R., M.M., N.M.K., and A.J. All authors have read and agreed to the published version of the manuscript.

Funding

This research activity received no external funding.

Acknowledgments

The authors are thankful for support from the Advanced Industrial, Science and Technology (AIST), Japan, for test bed facilities and useful discussions and thanks to the National Institute of Solar Energy, Gurugram for providing the useful information. The research work of the National Technical University of Athens, Greece, received funding from the European Union’s Horizon 2020 Research and Innovation Programme under the Marie Skłodowska-Curie grant agreement No. 799835.

Conflicts of Interest

The authors declare no conflict of interest.

Abbreviations

The following abbreviations are used in this manuscript:
a-SiAmorphous silicon
CdTeCadmium telluride
CIGSCopper indium gallium selenide
CO2Carbon dioxide
c-SiCrystalline silicon
DRDegradation rate
EEOLPrimary energy demand for end-of-life management
EinputEmbodied energy
EinstPrimary energy demand to install the system
EmanufPrimary energy demand to manufacture PV system
EmatPrimary energy demand to produce materials comprising PV system
EoutPV energy output over the lifetime
Eout,yYearly PV energy output
EPBTEnergy payback time
EPFEnergy production factor
EsolAnnual solar irradiation
EtransPrimary energy demand to transport materials used during the life cycle
FCR,i,nCapital recovery factor
FSR,i,nSinking fund factor
HITHetero-junction intrinsic thin layer
LaDomestic appliance losses
LCCELife cycle conversion efficiency
LtTransmission losses
mc-SiMulti-crystalline silicon
NPVNet Present Value
O&MAnnual cost for the operation and maintenance
PCapital cost
PRPerformance ratio
RAnnual cost to replace of components
SCosts for the decommissioning system
sc-Si Mono-crystalline silicon
Tlifetime of the PV system
UACUniform end-of-year annual cost
uncostAnnual uniform cost
ηPVPV module energy efficiency

References

  1. Paris Agreement. Available online: http://ec.europa.eu/clima/policies/international/negotiations/paris/index_en.htm (accessed on 15 December 2019).
  2. Burger, B.; Kiefer, K. Photovoltaics Report. 2019. Available online: https://www.ise.fraunhofer.de/content/dam/ise/de/documents/publications/studies/Photovoltaics-Report.pdf (accessed on 30 November 2019).
  3. Ministry of New and Renewable Energy, MNRE Repot 2018. Available online: https://mnre.gov.in/annual-report (accessed on 25 May 2019).
  4. Cumulative Achievement (Grid Interactive Solar Power) up to 31-12-018. Available online: http://www.mnre.gov.in/mission-and-vision-2/achievements/ (accessed on 31 December 2018).
  5. Hewig, G.H.; Höbner, H.-P. Analysis of hot-spot-effects in encapsulated photovoltaic generators by laser scan and partial shadowing. In Fourth EC Photovoltaic Solar Energy Conference; Springer: Dordrecht, The Netherlands, 1982; pp. 291–295. [Google Scholar]
  6. Jordan, D.C.; Kurtz, S.R. Photovoltaic Degradation Rates—An Analytical Review. Available online: https://www.nrel.gov/docs/fy12osti/51664.pdf (accessed on 30 November 2019).
  7. Nishimura, K.; Hondo, H.; Uchiyama, Y. Derivation of energy-embodiment functions to estimate the embodied energy from the material content. Energy 1996, 21, 1247–1256. [Google Scholar] [CrossRef]
  8. Schaefer, H.; Hagedorn, G. Hidden energy and correlated environmental characteristics of P.V. power generation. Renew. Energy 1992, 2, 159–166. [Google Scholar] [CrossRef]
  9. Pacca, S.; Sivaraman, D.; Keoleian, G.A. Parameters affecting the life cycle performance of PV technologies and systems. Energy Policy 2007, 35, 3316–3326. [Google Scholar] [CrossRef]
  10. Ito, M.; Kato, K.; Komoto, K.; Kichimi, T.; Kurokawa, K. A comparative study on cost and life cycle analysis for 100 MW very large scale PV (VLS-PV) systems in deserts using m-Si, a-Si, CdTe and CIS modules. Prog. Photovolt. 2008, 15, 17–30. [Google Scholar] [CrossRef]
  11. Kato, K.; Murata, A.; Sakuta, K. An evaluation on the life cycle of photovoltaic energy system considering production energy of off-grade silicon. Sol. Energy Mater. Sol. Cells 1997, 47, 95–100. [Google Scholar] [CrossRef]
  12. Kannan, R.; Leong, K.C.; Osman, R.; Ho, H.K.; Tso, C.P. Life cycle assessment study of solar PV systems: An example of a 2.7 kW distributed solar PV system in Singapore. Sol. Energy 2006, 80, 555–563. [Google Scholar] [CrossRef]
  13. Battisti, R.; Corrado, A. Evaluation of technical improvements of photovoltaic systems through life cycle assessment methodology. Energy 2005, 30, 952–967. [Google Scholar] [CrossRef]
  14. Ito, M.; Kato, K.; Sugihara, H.; Kichimi, T.; Song, J.; Kurokawa, K. A preliminary study on potential for very large-scale photovoltaic power generation (VLS-PV) system in the Gobi desert from economic and environmental viewpoints. Sol. Energy Mater. Sol. Cells 2003, 75, 507–517. [Google Scholar] [CrossRef]
  15. Akinyele, D.; Rayudu, R.; Nair, N. Life cycle impact assessment of photovoltaic power generation from crystalline silicon-based solar modules in Nigeria. Renew. Energy 2017, 101, 537–549. [Google Scholar] [CrossRef]
  16. Sharma, R.; Tiwari, G. Life cycle assessment of stand-alone photovoltaic (SAPV) system under on-field conditions of New Delhi, India. Energy Policy 2013, 63, 272–282. [Google Scholar] [CrossRef]
  17. Sherwani, A.; Usmani, J. Varun Life cycle assessment of solar PV based electricity generation systems: A review. Renew. Sustain. Energy Rev. 2010, 14, 540–544. [Google Scholar] [CrossRef]
  18. Rajput, P.; Tiwari, G.; Sastry, O. Thermal modelling with experimental validation and economic analysis of mono crystalline silicon photovoltaic module on the basis of degradation study. Energy 2017, 120, 731–739. [Google Scholar] [CrossRef]
  19. De Wild-Scholten, M. (Mariska) Energy payback time and carbon footprint of commercial photovoltaic systems. Sol. Energy Mater. Sol. Cells 2013, 119, 296–305. [Google Scholar] [CrossRef]
  20. Slesser, M.; Hounam, I. Solar energy breeders. Nature 1976, 262, 244–245. [Google Scholar] [CrossRef]
  21. Alsema, E.A. Energy pay-back time and CO2 emissions of PV systems. Prog. Photovolt. Res. Appl. 2000, 8, 17–25. [Google Scholar] [CrossRef]
  22. Rodrigues, S.; Torabikalaki, R.; Faria, F.; Cafôfo, N.; Chen, X.; Ivaki, A.R.; Mata-Lima, H.; Morgado-Dias, F. Economic feasibility analysis of small scale PV systems in different countries. Sol. Energy 2016, 131, 81–95. [Google Scholar] [CrossRef]
  23. Mason, J.E.; Fthenakis, V.M.; Hansen, T.; Kim, H.C. Energy payback and life-cycle CO2 emissions of the BOS in an optimized 3·5 MW PV installation. Prog. Photovolt. Res. Appl. 2006, 14, 179–190. [Google Scholar] [CrossRef]
  24. Agrawal, S.; Tiwari, G. Performance analysis in terms of carbon credit earned on annualized uniform cost of glazed hybrid photovoltaic thermal air collector. Sol. Energy 2015, 115, 329–340. [Google Scholar] [CrossRef]
  25. Bouaichi, A.; Merrouni, A.A.; Hajjaj, C.; Messaoudi, C.; Ghennioui, A.; Benlarabi, A.; Ikken, B.; El Amrani, A.; Zitouni, H. In-situ evaluation of the early PV module degradation of various technologies under harsh climatic conditions: The case of Morocco. Renew. Energy 2019, 143, 1500–1518. [Google Scholar] [CrossRef]
  26. Louwen, A.; Van Sark, W.G.J.H.M.; Schropp, R.E.I.; Turkenburg, W.C.; Faaij, A.P.C. Life-cycle greenhouse gas emissions and energy payback time of current and prospective silicon heterojunction solar cell designs. Prog. Photovolt. Res. Appl. 2015, 23, 1406–1428. [Google Scholar] [CrossRef] [Green Version]
  27. Singh, D.; Tiwari, G. Effect of energy matrices on life cycle cost analysis of partially covered photovoltaic compound parabolic concentrator collector active solar distillation system. Desalination 2016, 397, 75–91. [Google Scholar] [CrossRef]
  28. Kamthania, D.; Tiwari, G. Energy metrics analysis of semi-transparent hybrid PVT double pass facade considering various silicon and non-silicon based PV module Hyphen is accepted. Sol. Energy 2014, 100, 124–140. [Google Scholar] [CrossRef]
  29. Kalogirou, S. Economic analysis of solar energy systems using spreadsheets. Renew. Energy 1996, 9, 1303–1307. [Google Scholar] [CrossRef]
  30. Watt, M.E.; Johnson, A.J.; Ellis, M.; Outhred, H.R. Life-cycle air emissions from PV power systems. Prog. Photovolt. Res. Appl. 1998, 6, 127–136. [Google Scholar] [CrossRef]
  31. Fthenakis, V.; Frischknecht, R.; Raugei, R.; Kim, H.C.; Alsema, E.; Held, M.; de Wild-Scholten, M. Methodology Guidelines on Life Cycle Assessment of Photovoltaic Electricity. Available online: http://www.iea-pvps.org/fileadmin/dam/public/report/technical/rep12_11.pdf (accessed on 25 December 2018).
  32. Rajput, P.; Malvoni, M.; Kumar, N.M.; Sastry, O.; Tiwari, G. Risk priority number for understanding the severity of photovoltaic failure modes and their impacts on performance degradation. Case Stud. Therm. Eng. 2019, 16, 100563. [Google Scholar] [CrossRef]
  33. Kumar, N.M.; Prabaharan, N.; Jerin, R.A. and Jayakumar, A. Impact of performance degradation and capital subsidy on the revenue of rooftop PV system. Int. J. Renew. Energy Res. 2019, 9, 128–136. [Google Scholar]
  34. Raugei, M.; Frischknecht, R.; Olson, C.; Sinha, P.; Heath, G. Methodological Guidelines on Net Energy Analysis of Photovoltaic Electricity. Available online: https://nachhaltigwirtschaften.at/resources/iea_pdf/reports/iea_pvps_task12_methodological_guidelines_on_net_energy_analysis_of_photovoltaic_electricity.pdf (accessed on 16 December 2018).
  35. Rajput, P.; Tiwari, G.; Sastry, O.; Bora, B.; Sharma, V. Degradation of mono-crystalline photovoltaic modules after 22 years of outdoor exposure in the composite climate of India. Sol. Energy 2016, 135, 786–795. [Google Scholar] [CrossRef]
  36. Kumar, N.M.; Gupta, R.P.; Mathew, M.; Jayakumar, A.; Singh, N.K. Performance, energy loss, and degradation prediction of roof-integrated crystalline solar PV system installed in Northern India. Case Stud. Therm. Eng. 2019, 13, 100409. [Google Scholar] [CrossRef]
  37. Malvoni, M.; Leggieri, A.; Maggiotto, G.; Congedo, P.M.; De Giorgi, M.G. Long term performance, losses and efficiency analysis of a 960 kWP photovoltaic system in the Mediterranean climate. Energy Convers. Manag. 2017, 145, 169–181. [Google Scholar] [CrossRef]
  38. Kumar, N.M.; Subathra, M. Three years ahead solar irradiance forecasting to quantify degradation influenced energy potentials from thin film (a-Si) photovoltaic system. Results Phys. 2019, 12, 701–703. [Google Scholar] [CrossRef]
  39. Jordan, D.; Kurtz, S. Analytical improvements in PV degradation rate determination. In Proceedings of the 2010 35th IEEE Photovoltaic Specialists Conference, Honolulu, HI, USA, 20–25 June 2010; pp. 002688–002693. [Google Scholar]
  40. Phinikarides, A.; Makrides, G.; Georghiou, G.E. Comparison of Analysis Methods for the Calculation of Degradation Rates of Different Photovoltaic Technologies. 2013. Available online: http://www.eupvsec-proceedings.com/proceedings?paper=25035 (accessed on 26 August 2019).
  41. Kumar, N.M.; Malvoni, M. A preliminary study of the degradation of large-scale c-Si photovoltaic system under four years of operation in semi-arid climates. Results Phys. 2019, 12, 1395–1397. [Google Scholar] [CrossRef]
  42. Makrides, G.; Zinsser, B.; Georghiou, G.E.; Schubert, M.; Werner, J.H. Degradation of Different Photovoltaic Technologies under Field Conditions. In Proceedings of the 2010 35th IEEE Photovoltaic Specialists Conference; Institute of Electrical and Electronics Engineers (IEEE), Honolulu, HI, USA, 20–25 June 2010; pp. 002332–002337. [Google Scholar]
  43. Bouaichi, A.; El Amrani, A.; Ouhadou, M.; Lfakir, A.; Messaoudi, C. In-situ performance and degradation of three different photovoltaic module technologies installed in arid climate of Morocco. Energy 2020, 190, 116368. [Google Scholar] [CrossRef]
  44. Tiwari, G.N. Solar Energy: Fundamentals, Design, Modelling and Applications; CRC Press: Boca Raton, FL, USA, 2002. [Google Scholar]
  45. Tiwari, G.N.; Ghosal, M.K. Renewable Energy Resources: Basic Principles and Applications; Narosa Publishing House: New Delhi, India, 2005. [Google Scholar]
  46. Nawaz, I.; Tiwari, G.N. Embodied energy analysis of photovoltaic (PV) system based macro and micro level. Energy Policy 2006, 34, 3144–3152. [Google Scholar] [CrossRef]
  47. Elzen Den, M.G.J.; Hof, A.D.; Beltran, A.M.; Grassi, G.; Roelfsema, M.; Van Ruijven, B.; Van Vliet, J.; Van Vuuren, D.P. The Copenhagen accord: Abatement costs and carbon prices resulting from the submissions. Environ. Sci. Policy 2011, 14, 28–39. [Google Scholar] [CrossRef] [Green Version]
  48. Panasonic HIT® Solar Module Achieved World’s Highest Output Temperature Coefficient1 at −0.258%/°C. Available online: https://news.panasonic.com/global/press/data/2017/05/en170524-2/en170524-2.html (accessed on 1 November 2019).
Figure 1. Experimental photovoltaic test facility at NISE, Gurgaon, India: (a). 1.2 kW Amorphous Si PV system; (b). 1.68 kW HIT PV system; (c). 1.6 kW Multi-crystalline silicon PV system.
Sustainability 12 01075 g001
Figure 2. Schematic photovoltaic test facility at NISE, Gurgaon, India.
Sustainability 12 01075 g002
Figure 3. PV measurement system and meteorological data recording facilities.
Sustainability 12 01075 g003
Figure 4. Methodology for life cycle environmental – economic analysis.
Sustainability 12 01075 g004
Figure 5. Energy final yield VS Solar Irradiance for mc-Si, a-Si and HIT PV systems.
Sustainability 12 01075 g005
Figure 6. The performance ratio for mc-Si, a-Si and HIT PV systems.
Sustainability 12 01075 g006
Figure 7. EPBT and CO2 emission from previous study.
Sustainability 12 01075 g007
Figure 8. Actual VS Expected PV energy generation.
Sustainability 12 01075 g008
Figure 9. EPBT, EPF, LCCE, net CO2 emission and Carbon credit in the case of Actual and Expected PV energy generation for mc-Si, a-Si and HIT PV system.
Sustainability 12 01075 g009
Figure 10. Degradation effects on EPF, LCCE and net CO2 emission for mc-Si, a-Si and HIT PV system.
Sustainability 12 01075 g010
Figure 11. UAC sensitivity analysis with different interest rate.
Sustainability 12 01075 g011
Table 1. Accuracy of parameter measuring instruments/equipment.
CharacterizationInstrumentAccuracy
I-V CharacteristicsCampbell Scientific data logger CR-1000 Voltage < ±1%,
Current < ±1%
Irradiance ±3%
Temperature ±5%
MS-802-CPyranometerSensitivity–7 μV/W/m2
Impedance–650 Ohm
Linearity–±0.5% from 0 to 2800 W/m2
Table 2. Embodied energy of different components used in mc-Si PV system [16,28,46].
ComponentsItemsQuantityTotal WeightEmbodied Energy Density (MJ/Kg)Total Embodied Energy
MJ/kWh
PV module (Silicon purification,
Processing Cell fabrication and Module assembly)
mc-Si10.0022.77 m220,720.70 20,720.70
PV module supported standMild steel1.0080.0034.202736.00760.00
Nuts/bolts/screws54.001.5031.0646.59912.94
Paints2.001.00 L90.4090.4025.11
CableCopper wire 4.00110.19440.76122.43
Total embodied energy in kWh 21,641.18
Table 3. Embodied energy of different components used in a-Si PV system [16,28,46].
ComponentsItemsQuantityTotal WeightEmbodied Energy Density (MJ/Kg)Total Embodied Energy
MJ/kWh
PV module (Silicon purification,
Processing Cell fabrication and Module assembly)
a-Si16.0026.98 m2378.00 10,198.44
PV module supported standMild steel1.00100.0034.203420.00950.00
Nuts/bolts/screws64.002.031.0662.1217.25
Paints2.001L90.4090.425.11
CableCopper wire 4.00110.19440.76122.43
Total embodied energy in kWh 11,313.23
Table 4. Embodied energy of different components used in HIT PV system [16,28,46].
ComponentsItemsQuantityTotal WeightEmbodied Energy Density (MJ/Kg)Total Embodied Energy
MJ/kWh
PV module (Silicon purification,
Processing Cell fabrication and Module assembly)
HIT8.009.36 m21862.24 1862.24
PV module supported standMild steel1.0070.0034.202394.00665.00
Nuts/bolts/screws36.001.2031.0637.2710.35
Paints2.001.00 L90.4090.4025.11
CableCopper wire 3.00110.19330.5791.82
Total embodied energy in kWh 2654.92
Table 5. Cost of different components for mc-Si, a-Si and HIT PV systems.
Cost Component (Rs) mc-Sia-SiHIT
PV modules67,20048,000142,800
Standing320040002800
Cable280028002800
Total cost 73,20054,800148,400
Table 6. Life cycle indicators for mc-Si, a-Si and HIT PV systems.
Life Cycle IndicatorsUnitsmc-Sia-SiHIT
Total surface modulesm222.7726.989.36
Nominal powerkWp1.601.201.68
Module efficiency %15.87.617.3
Actual annual energy outputkWh2408.411904.812648.30
PR%86.891.590.9
Energy output over the lifetimekWh722525714479449
Embody energy kWh21,641.1811,313.232654.92
EPBT year8.985.931.0
EPF -3.345.0529.93
LCCE -0.040.030.16
CO2 emission Kg44.123.15.4
net CO2 mitigationtCO210393157
Carbon credit 216819633290
RS169,118.0153,145.0256,609.0
Table 7. Cost analysis for mc-Si, a-Si and HIT PV systems.
Cost ParametersUnitsmc-Sia-SiHIT
Capital cost Rs73,20054,800148,400
Maintenance costRS7320548014,840
Replacement cost RS---
Decommissioning costRS366027407420
NVPRS102,48076,720207,760
UncostRS409,920306,880831,040
UACRS/kWh5.675.3710.46
Table 8. EPBT and CO2 mitigation comparison of different PV module technologies.
TechnologyLocationTotal Capacity of Installed PV Module (kW)Lifetime (Years)Energy Payback Time (Years)CO2 Mitigation (tCO2)Ref.
a-SiUS33 203.234.3[9]
a-SiChina100 × 103302.215.6[10]
mc-SiJapan3 2015.591[11]
mc-SiSingapore10.6 254.47165 [12]
mc-SiUK14.4 30844[26]
mc-SiUS33 205.772.4[9]
mc-SiChina100 × 103301.59.4[10]
mc-SiItaly1 203.326.4[13]
mc-SiGreece3 202.9104[14]
mc-SiChina100 × 103301.712[15]
mc-SiIndia1.6 302.914.3Present study
a-SiIndia1.2 304.216.2
HITIndia1.68 301.910.4

