1. Introduction
Energy efficiency in buildings is a priority of European energy and climate change policies along with policies regarding the security of energy supply and the fight against energy poverty. In the European Union (EU), the energy consumption of buildings accounts for around 40% of the final energy consumption and is responsible for approximately 36% of all carbon dioxide emissions [
1]. Therefore, there is a significant potential to reduce these emissions through actions to increase the energy performance of buildings.
The Romanian housing fund consists of approximately 8.2 million homes, distributed in 5.1 million buildings. In urban areas, 72% of the dwellings are in city blocks, while in rural areas, 94.5% of the dwellings are single-family houses.
In domestic households, biomass and natural gas are the main fuels currently used not only for cooking, but also for heating and hot water. Over 90% of households in rural areas and 15% of those in urban areas use biomass (mainly wood) as their main source of heating. The energy efficiency of biomass use is low due to the conversion systems used (especially traditional stoves).
Currently, in the case of new buildings but also of rehabilitated ones, the most common solution to provide utilities for small consumers is a gas or a biomass boiler and electricity from the public network.
Generally, the use of renewable energy technologies in residential buildings is not yet a common practice due to higher investment costs compared to conventional sources. Increasing the share of energy supplied from renewable energy sources is a priority for the EU. Different support schemes to stimulate the production of renewable energy sources are used by EU countries, especially for electricity. The support schemes can be divided into investment support (capital grants, exemptions, or reductions in purchases of goods) and operating support (price subsidies, green certificates, auction schemes, and tax exemptions or deductions) [
2,
3].
The benefits of medium and large combined heat and power (CHP) plants have been widely recognized throughout the world. In recent years, there has been an increase in the number of research and development projects worldwide regarding the use of micro-CHP for small residential and commercial applications.
Currently, there is a great diversity of micro-cogeneration technologies available on the market (e.g., Stirling engine, fuel cells, microturbines, internal combustion engines, Rankine Organic Cycle) that can harness primary energy resources, both conventional and renewable [
4,
5,
6,
7,
8,
9]. There is also a tendency for more than one primary energy source available to be used on a single site [
10,
11,
12].
In accordance with Directive 2012/27/EU, “micro-cogeneration unit” means a cogeneration unit with a maximum capacity below 50 kWe, and “small scale cogeneration” means cogeneration units with an installed capacity below 1 MWe [
13].
Compared to other fossil fuels, the use of natural gas has a much lower impact on the environment in terms of carbon dioxide emissions. Thus, the further use of natural gas seems to be one of the energy transition solutions to a carbon-free energy generation and should be made with the help of the most energy-efficient technologies [
14,
15,
16,
17]. However, the energy import dependence due to the utilization of natural gas is not negligible in the case of several EU countries, and the vulnerability of a certain country depends on the diversity of its energy sources.
Biomass is a “local fuel”. There is now a great diversity of biomass in agriculture and forestry activities that produce large quantities of solid waste and residues. Significant quantities of wood waste come from timber factories and wood processing factories, such as bark, sawdust, wood chips, boards, and parts. Many of these wastes can be used for consumption in small installations in the form of wood pellets or briquettes. Support for the heating sector is highly diverse with price subsidies, tax exemptions, or investment grants [
18]. Local biomass resources can be used with a higher energy efficiency in CHP applications [
19].
Organic Rankine Cycle (ORC) is increasingly used in medium- and low-power cogeneration applications [
20,
21]. ORC technology is similar to the classic Rankine cycle but uses an organic liquid instead of water. This technology allows efficient use of heat sources with low thermal potential, such as biomass, geothermal energy, and solar energy [
22,
23,
24]. In this case, the heat input to the system can be delivered by several renewable energy sources available locally, e.g., solar energy and biomass [
25,
26].
The cost of the cogeneration units (the specific investment in EURO/kWe) has a tendency of considerable reduction compared to the values of the past years [
27,
28,
29].
Active energy consumers, often called “prosumers” (because they both consume and produce electricity) introduce new challenges at the level of the public electricity network. Prosumers are a relatively new concept in the distribution grid, and they are a consequence of increasing the share of renewable energy from decentralized systems (distributed generation). In many countries, there is a simplified procedure for connecting to the public network of low power generation systems. Thus, new business models are appearing that have begun to be exploited on the trading platforms for electricity [
30,
31,
32].
The energy balancing problem is the main challenge for the effective application of micro-CHP in a residential context. The addition of a heat storage system will increase the flexibility of a micro-cogeneration system [
33,
34,
35]. The energy demand of residential buildings (heating, cooling, and electricity for lighting and appliances) has great importance in the sizing of cogeneration units [
36,
37,
38].
The specific cost is considerably higher compared to conventional technologies for separate heat production (biomass boiler or natural gas boiler), which is a great current disadvantage of micro-cogeneration units. The main objective of this paper is the economic assessment of micro-cogeneration units from renewable energy sources under current market conditions. The methodology used is in accordance with the recommendations set out in [
39,
40]. The case of reference is an individual household with a gas boiler and electricity from the public network.
The paper is organized as follows:
Section 2 presents a brief description of micro-cogeneration systems, while
Section 3 presents the used methodology. The technical and economic viability of small cogeneration systems is discussed in
Section 4 and
Section 5, comparing to the separate production of electricity and heat. Two micro-cogeneration systems are compared to the reference case: A gas boiler and electricity from the public network. Finally, the conclusions of this paper are summarized in
Section 6.
2. Description of Different Micro-Cogeneration Systems
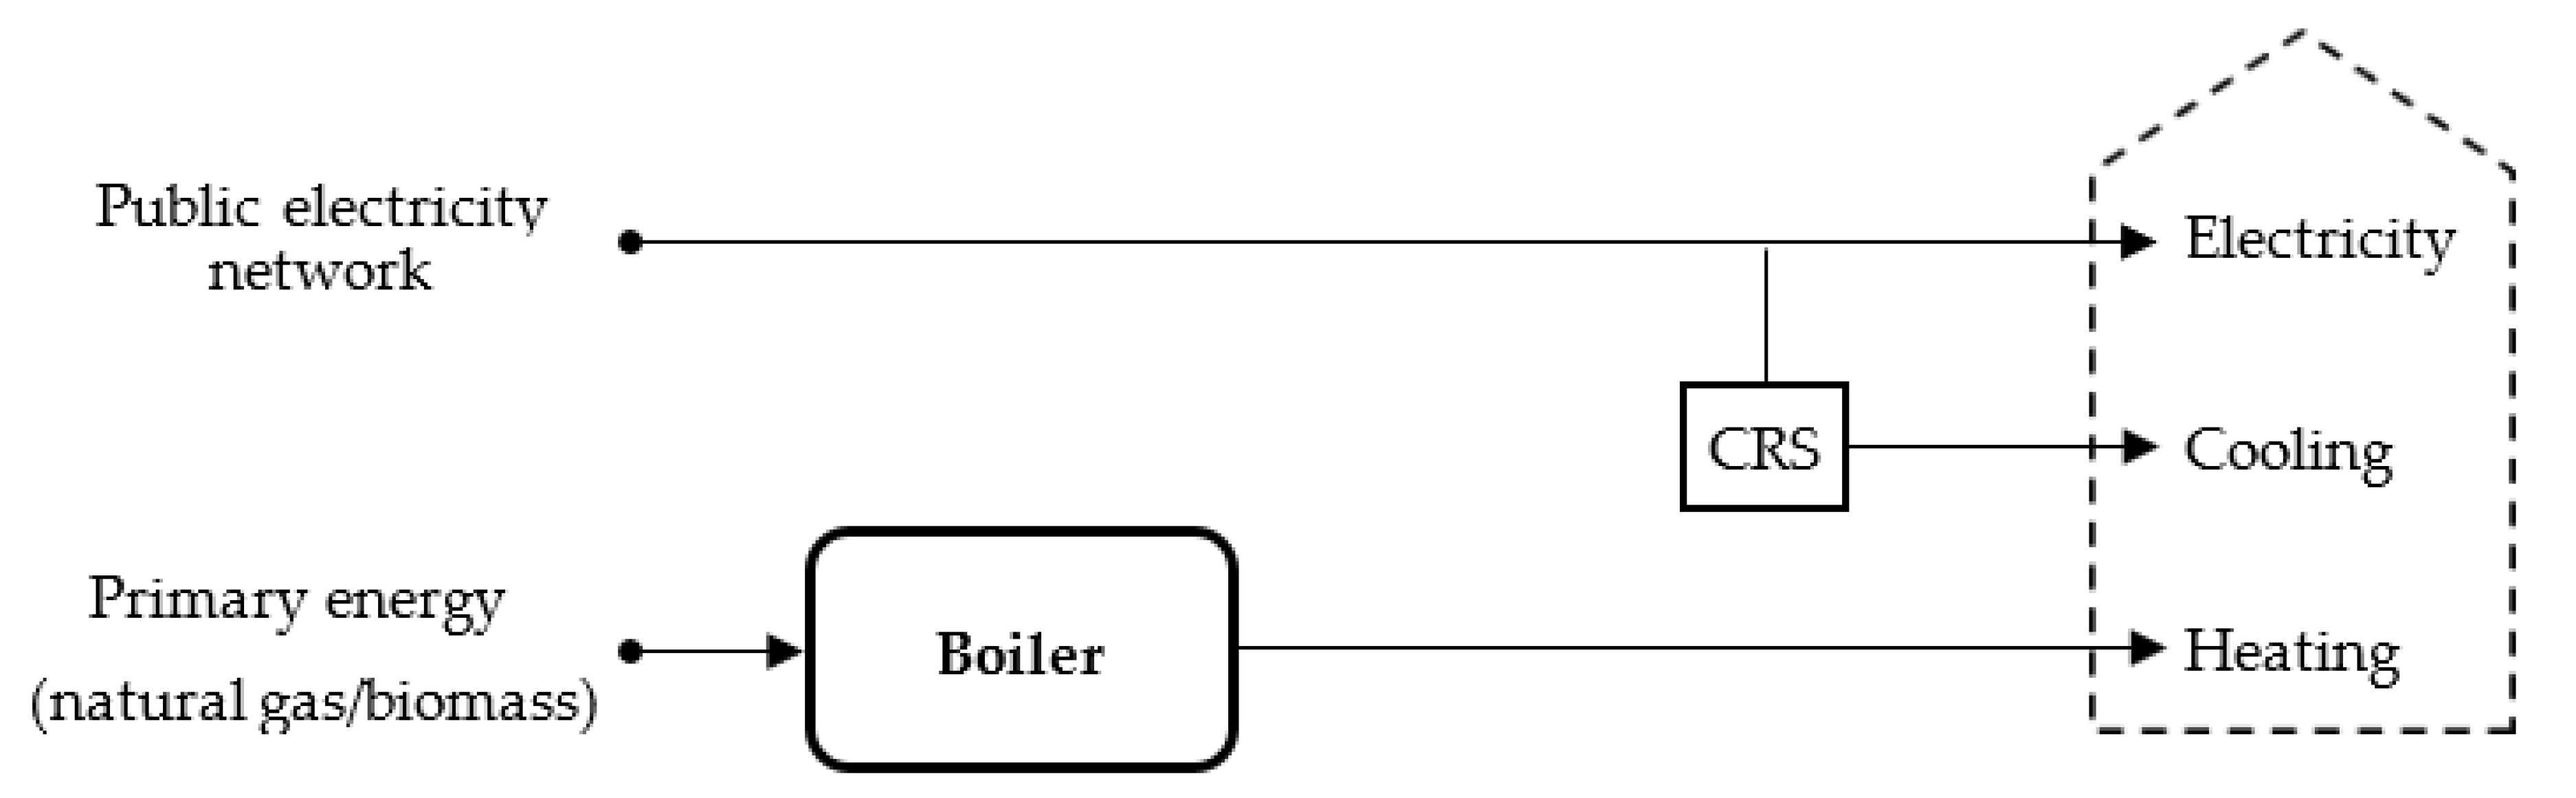
In Romania currently, in the case of new domestic households but also of rehabilitated ones, the most common solution to provide utilities is the gas or the biomass boiler and electricity from a public network (
Figure 1).
In the residential sector, micro-cogeneration can be applied using a variety of prime mover technologies such as microturbines, internal combustion engines, fuel cells, Stirling engines, or Rankine Organic Cycle (ORC). The available local renewable energy sources and the conventional sources can be converted together by Stirling engines and Rankine Organic Cycle. Silicon oil is the organic working fluid. Thus, in the operation of the micro-cogeneration system, the sharing of the use of renewable energy sources can be increased and the sharing of conventional sources can be reduced. Some examples of micro-cogeneration units are presented in
Table 1 [
7,
29].
Stirling engines use an external heat source to produce power. The mechanical energy is generated due to two different temperature zones in the Stirling engine, in which encased process gas is heated and cooled. The Stirling engine has a very special construction, which is free from bearings, joints, and shafts. Longer operational lifetimes are possible with this technology in comparison to traditional internal combustion engines [
41,
42].
The ORC operation principle is the same as the conventional Rankine cycle, but in this case, the working fluid is an organic compound of low boiling point instead of water, thus decreasing the temperature needed for evaporation. Its main applications are the generation of electricity from renewable heat sources (geothermal, biomass, and solar) and the heat recovery from industrial processes.
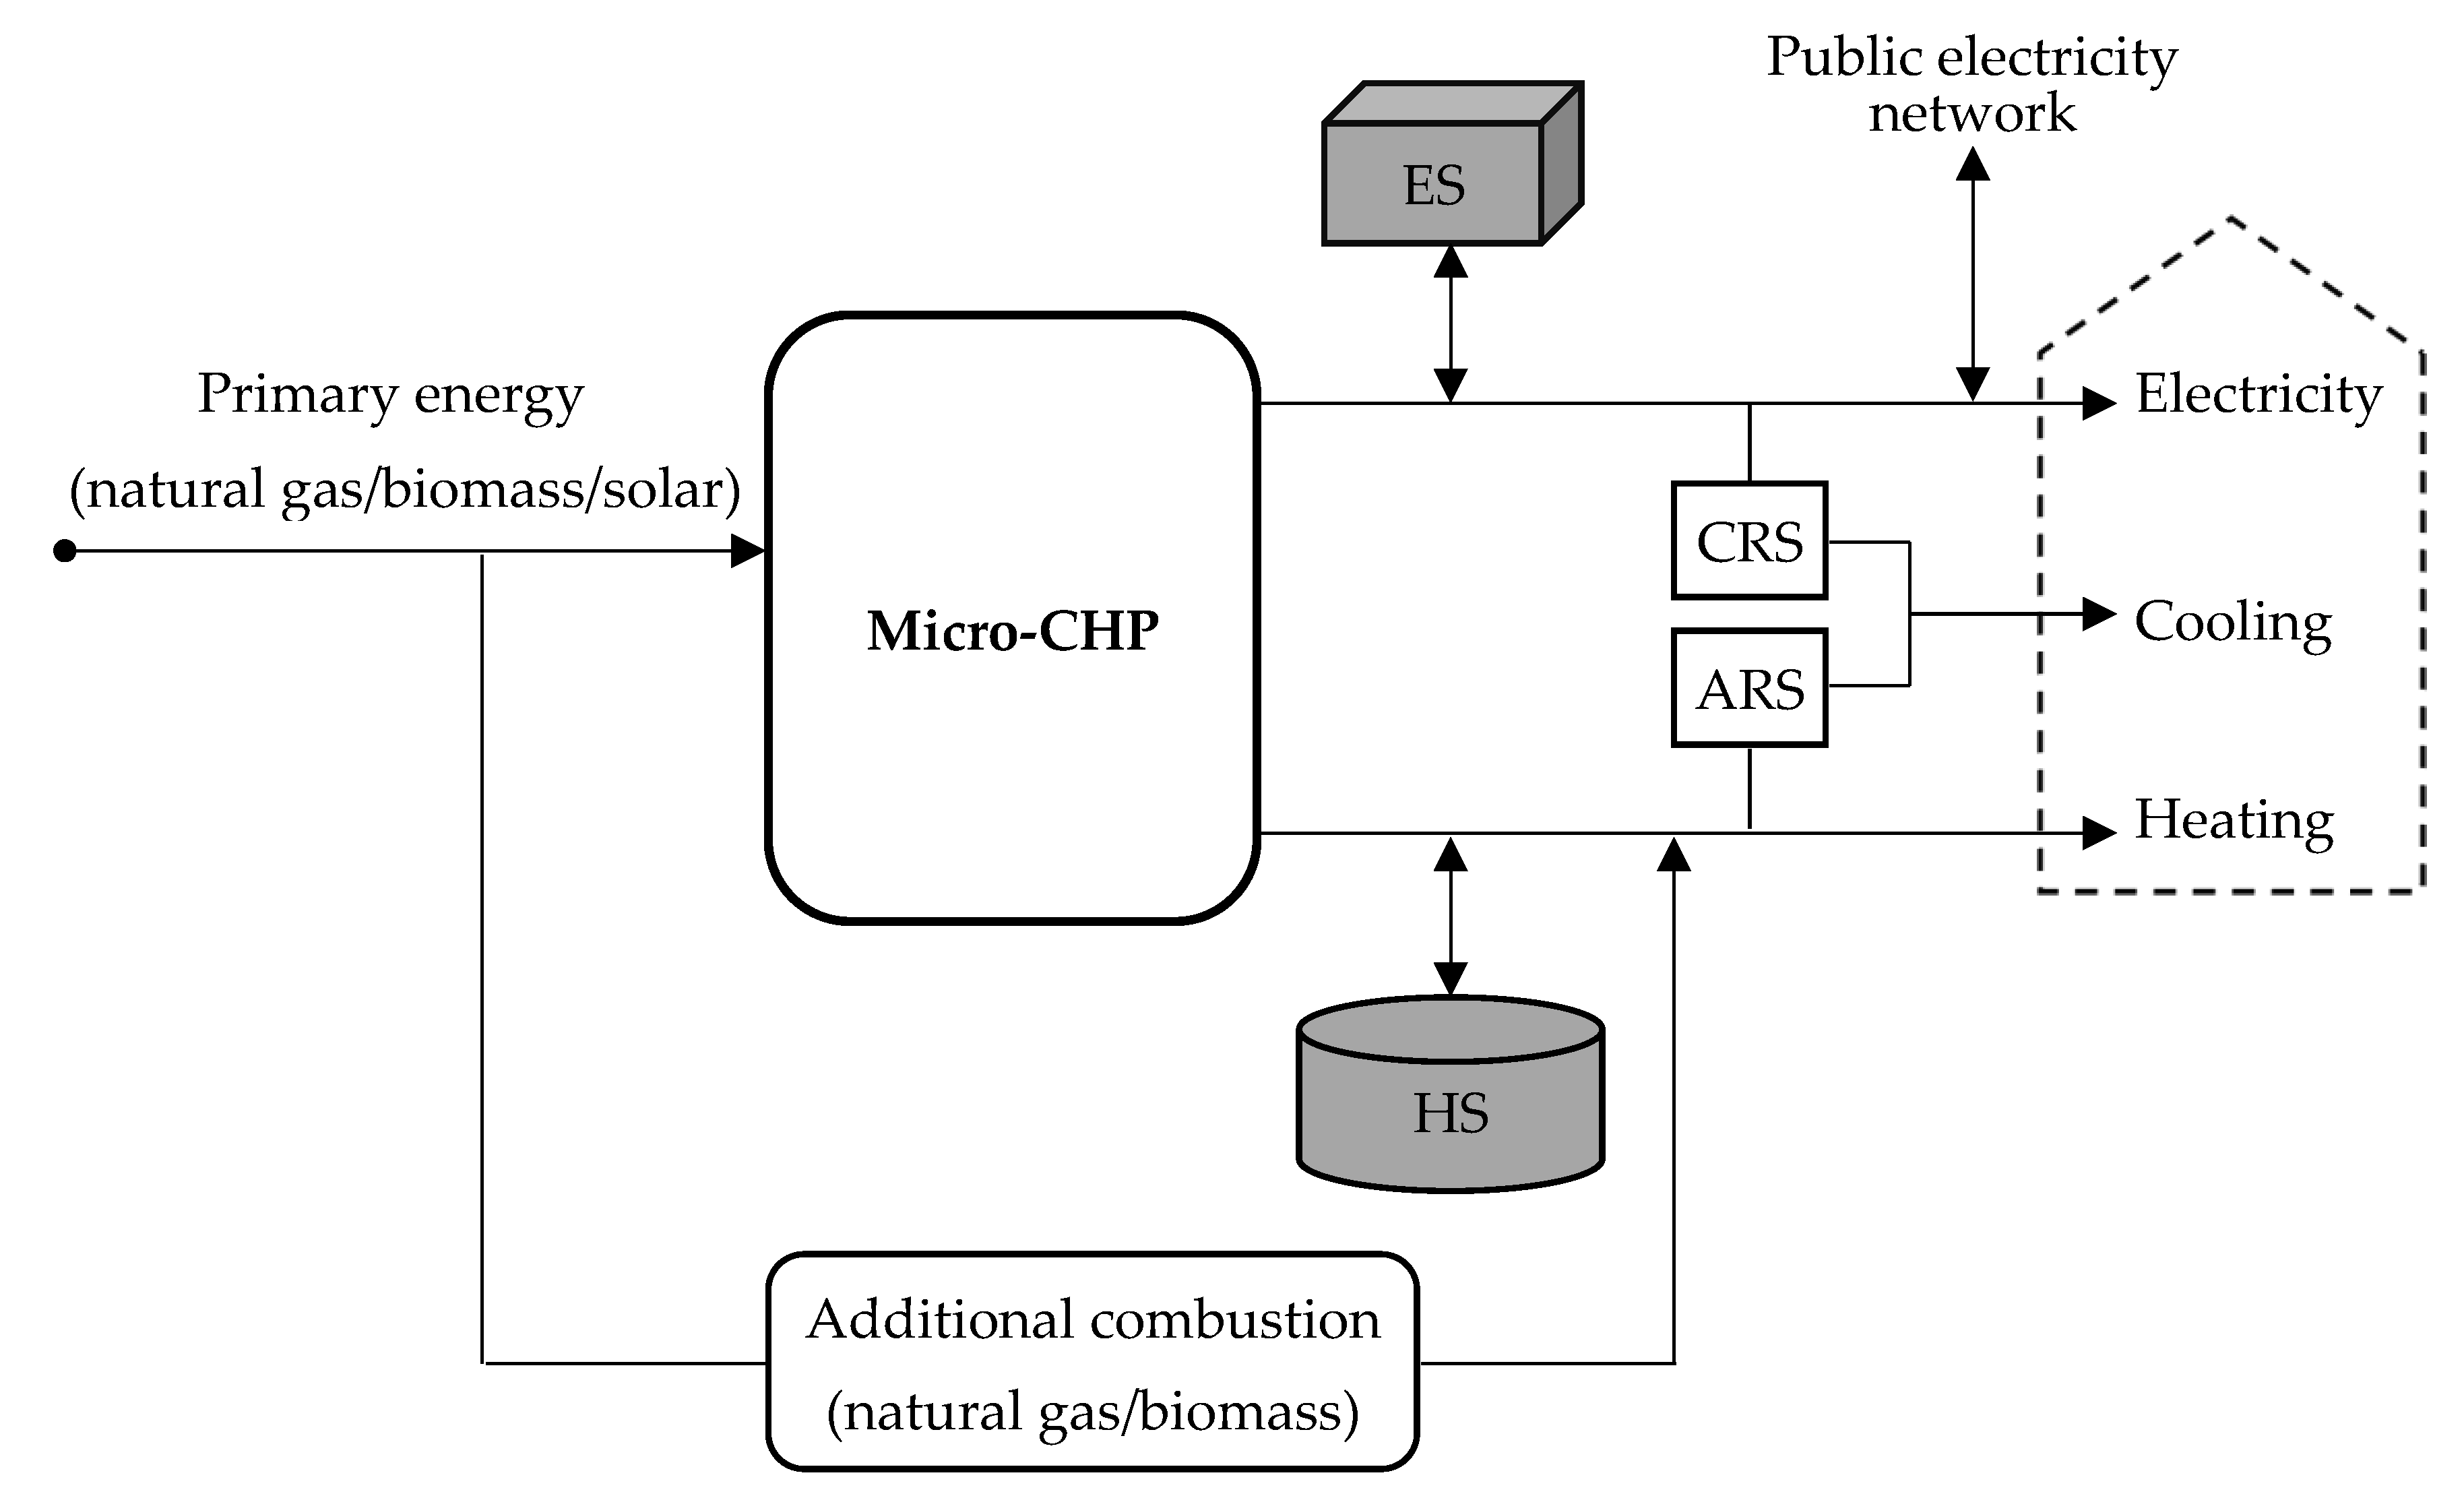
Both technologies are considered with “external combustion”. Due to the modular construction, they can use a variety of primary energy sources such as natural gas, heating oil, biomass, solar, geothermal, and waste heat. The combined heat and power generation is shown in
Figure 2.
Demand for electricity will be ensured by the micro-CHP unit and the public electricity network. The electricity differences between local consumption and production are compensated without technical difficulty from the public electricity network. There is also the possibility of storing the electricity generated in cogeneration to be used according to needs. The heat storage system will be used to compensate for the load variations and for increasing the flexibility of the micro-CHP unit. Cooling requirements will be ensured from the absorption refrigeration system or compression refrigeration system depending on the heat available from the micro-CHP unit.
3. Methodology
Identifying the optimal size of micro-CHP systems and the most appropriate operation strategy to be adopted are essential requirements to maximize the benefits of using this technology. Overestimating the size of a micro-CHP unit decreases its feasibility, while underestimating its size reduces the benefits. Consequently, the energy demand profiles of the residential building are necessary.
3.1. Determination of Energy Consumption Related to the Building’s Utilities
3.1.1. Energy Consumption for Heating
The calculation method is based on non-stationary heat transfer through the opaque and transparent construction elements of the building envelope. It takes into account the effect of the contributions due to human activity and solar radiation on the resulting indoor temperature imposed by the thermal comfort norms.
The heat losses of the building envelope, the need to heat infiltration air, and the heating of ventilation supply air in the room from supply air temperature to indoor temperature are considered. The heat demand of a building during the heating season [
43]:
where:
C is the correction coefficient for the variation in time of indoor and outdoor temperatures (C = 0.905);
SE is the total area of the building envelope (m2);
R’m is the average corrected thermal resistance of the building envelope (m2 °C/W);
na is the ventilation rate (h−1);
V is the heated volume of the building (m3);
B1S is the correction coefficient of the thermodynamic potential characteristic of the fresh air needed to ensure physiological comfort (B1S = 1.104);
NGZC is the number of heating degree days (HDDs).
The average corrected thermal resistance of the building envelope:
where
is the corrected thermal transmittance of area
Aj (walls, top floor, lower floor, windows, and doors).
The duration of the heating season
DZ (the beginning and end of the heating season) is determined from the verification of the equality condition between the reduced indoor temperature in the heated space
and the external reference temperature characteristic of the heated space
:
The number of heating degree days of a building is determined according to the normal duration of the heating season
DZ and the climatic conditions characteristic of the area in which the building is located:
The external climatic parameters are used in the form of the monthly averages of the external temperatures and the intensity of the solar radiation. In the thermal balance of the occupied spaces, the heat contributions due to solar radiation and human activity are considered.
3.1.2. Energy Consumption for Cooling
The calculation method is based on the thermal balance of the building. The heat flows through transmission, ventilation, the contribution of the internal heat sources, and the solar radiation are considered. The cooling demand of the building in summer [
43]:
where:
is the indoor temperature of comfort (°C);
is the outside temperature (°C);
is the outside reference temperature of the envelope’s elements (°C);
DCj is the cooling time of the building (h);
as are the releases of heat (W/m2);
Sloc is the total area of the building’s envelope (m2);
is the air density ( = 1.2047 kg/m3 at 20 °C);
cpa is the air specific heat ( = 0.281 Wh/kg°C at 20 °C).
The duration of the cooling process is determined as a result of the analysis of the variation of the indoor air temperature
in the absence of equipped cooling systems in occupied spaces. The operating time of the cooling system results from the equation:
The solar heat contributions are according to the solar radiation level of the locality in which the building is located, the orientation of the receiving surfaces, their coefficients of transmission, absorption and reflection of the solar radiation, as well as the transfer characteristics of these surfaces.
3.1.3. Energy Consumption for Domestic Hot Water
The energy demand to prepare domestic hot water corresponds to the energy needed to heat the hot water required by the consumer at the desired temperature [
43]:
where:
is the water density ( = 985.6 kg/m3 at 55 °C);
cw is the water specific heat ( = 1.161 Wh/kg°C at 55 °C).
V is the required volume of hot water for the period considered (m3);
is the temperature of hot water (°C);
is the temperature of cold water (°C);
In the total energy consumption for hot water, the heat losses on the distribution pipes also are considered.
3.2. Primary Energy Savings
The comparison between combined production and separate production of heat and electricity is based on the principle of comparing the same types of fuel [
39]. Primary Energy Saving (PES) is calculated by the equation:
where:
ηhCHP is the heat efficiency of the cogeneration production;
ηeCHP is the electrical efficiency of the cogeneration production;
ηhRef is the efficiency reference value for separate production of heat;
ηeRef is the efficiency reference value for separate production of electricity;
ploss is the correction factor for avoided grid losses.
3.3. Carbon Dioxide Emissions
The carbon dioxide emissions are determined based on the primary energy source by using an appropriate conversion factor (
Table 2):
where:
Qf,i is the energy consumption (kWh/year);
fCO2,i is the carbon dioxide emission factor (kgCO2/kWh).
3.4. The Cost Benefit Analysis
The cost benefit analysis (CBA) contains a set of analytical tools used to assess the financial and economic viability of a proposed investment. The most often used tools are the cash flow, the simple payback period (SPBP), the discounted payback period (DPBP), the net present value (NPV), and the internal rate of return (IRR). The NPV, the IRR, the SPBP, and the DPBP indices are defined by the following expressions [
44,
45,
46]:
where:
C0 is the initial investment cost (Euro);
N is the lifetime of the investment;
i is the discount rate;
Ct is the yearly revenue (Euro/year).
4. Case Study
For the analysis, a single-family residential building with the following characteristics was considered: the heated surface 263 m
2; the heated volume 684 m
3; the thermal resistance of the outer walls 2.21 m
2 °C/W; the thermal resistance of the upper floor 5.11 m
2 °C/W; the thermal resistance of the lower floor 4.67 m
2 °C/W; the thermal resistance of the windows and doors 0.77 m
2 °C/W. The building was located in the Suceava region (47.642353, 26.229929), Romania, climate zone IV. The annual energy consumption and type of primary source used for each utility are shown in
Table 3.
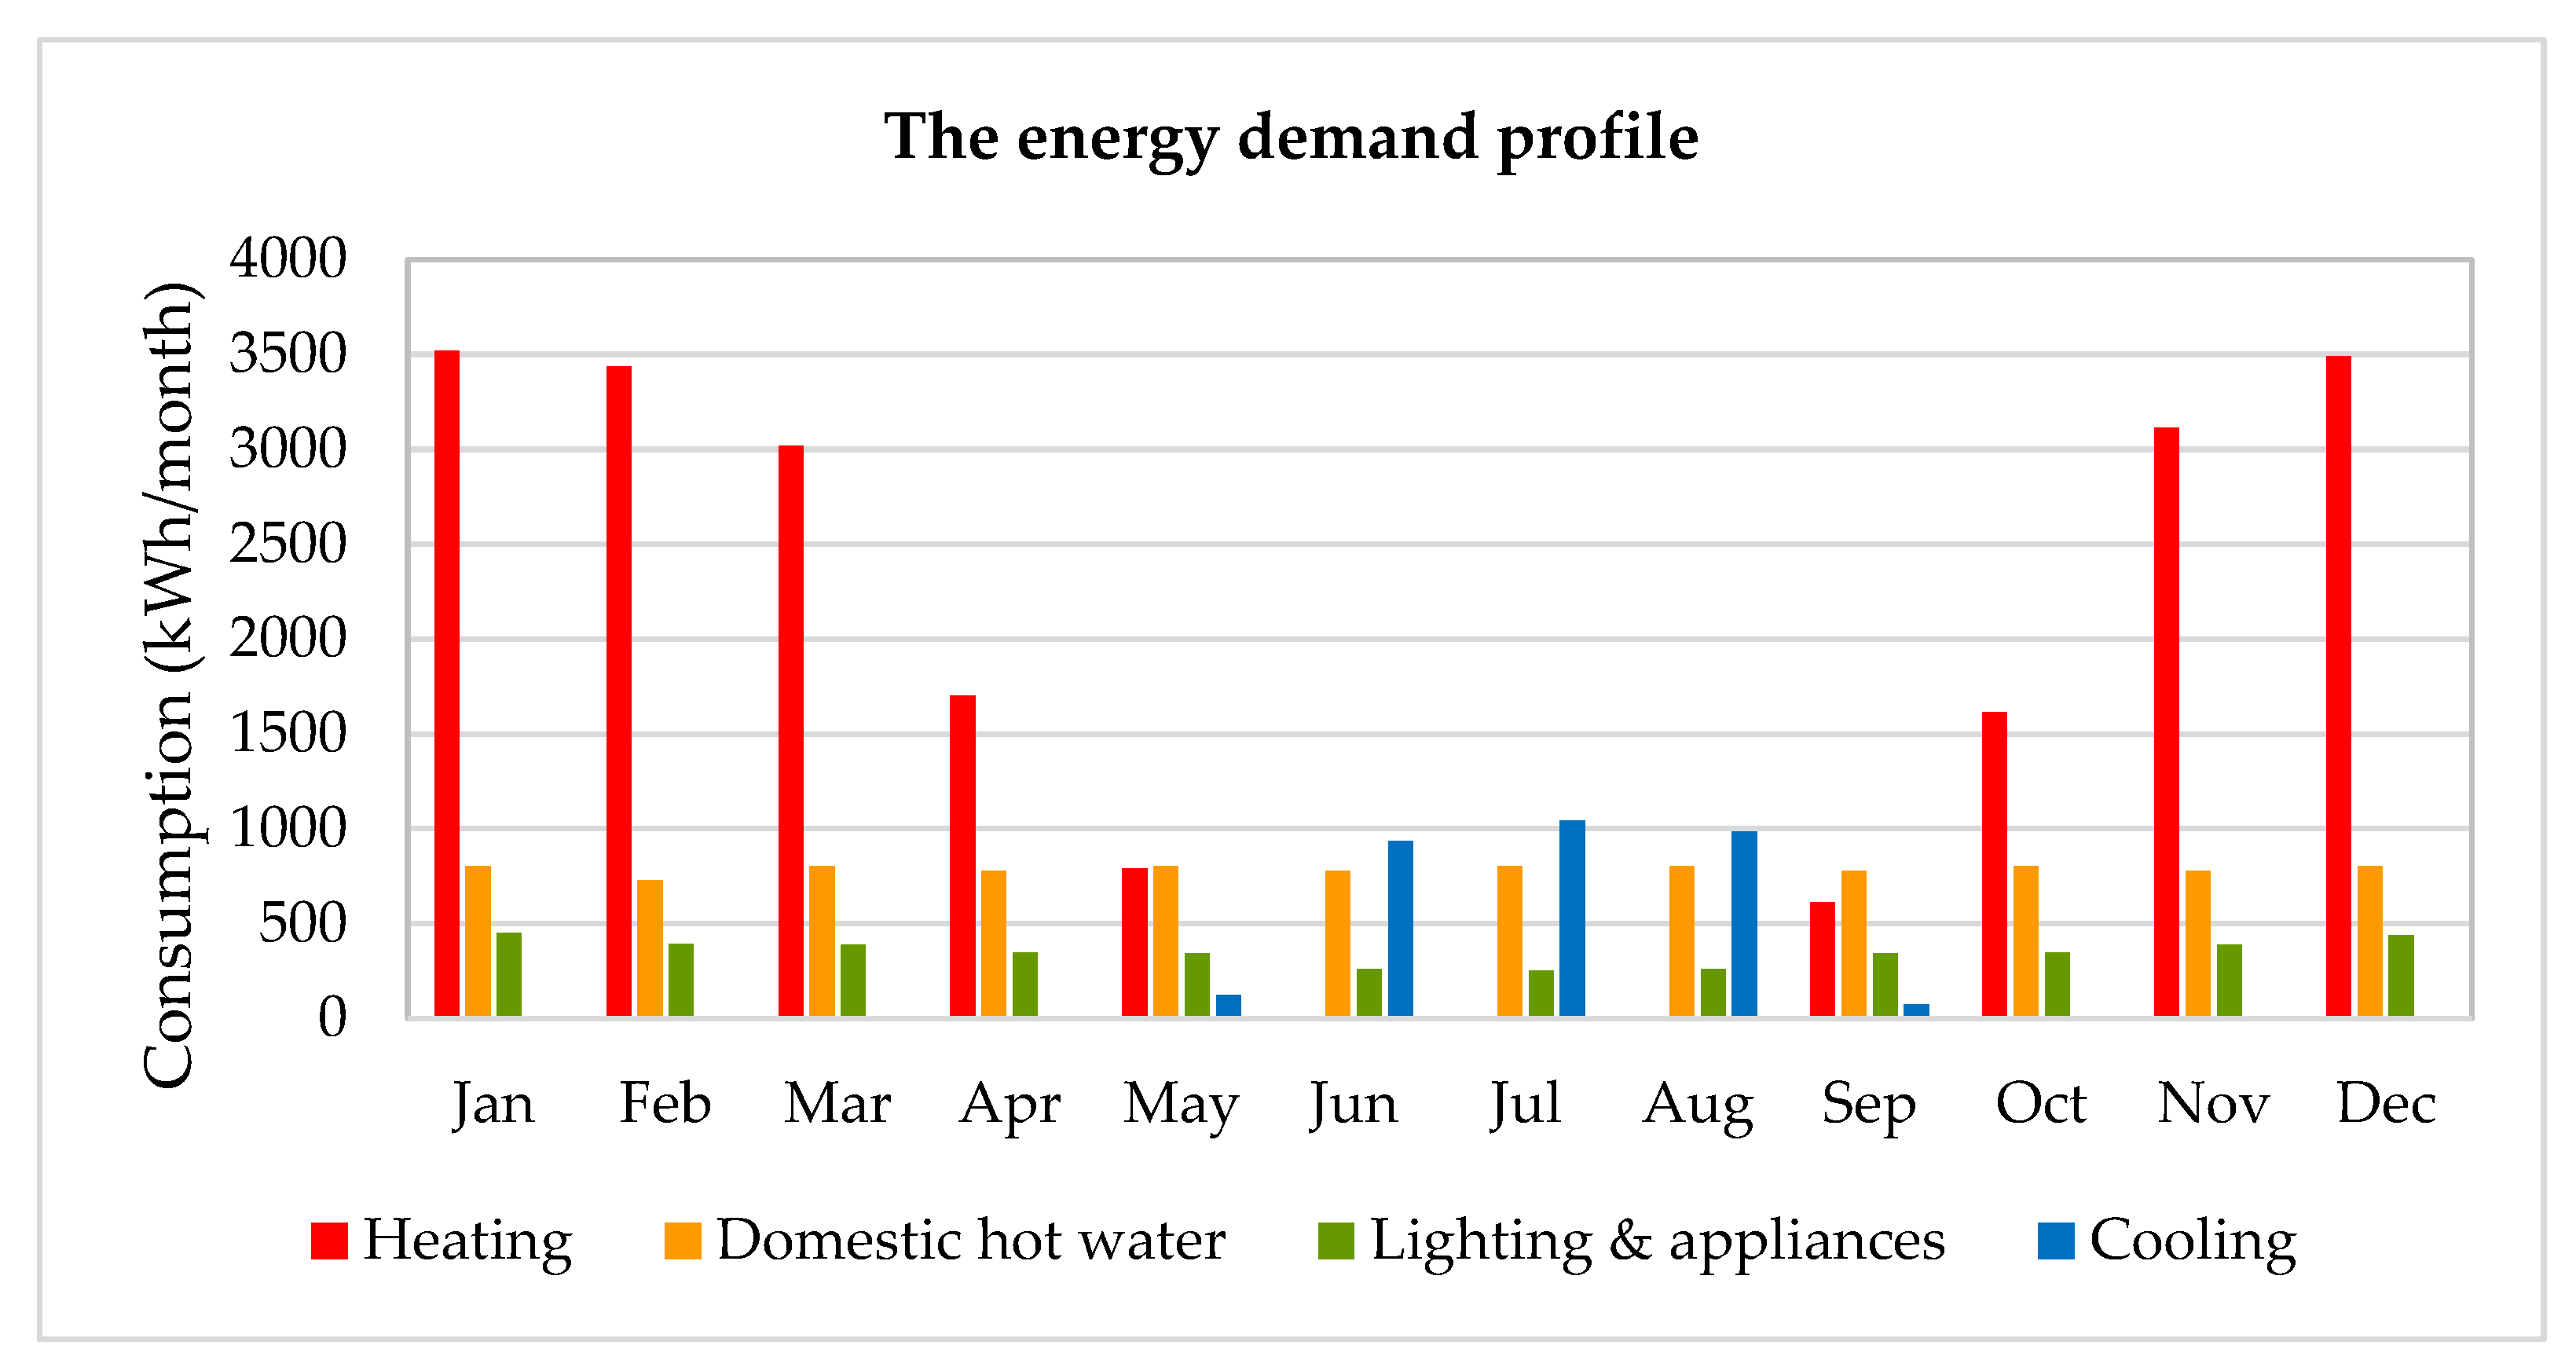
The variation of the monthly consumption of the building’s utilities is shown in
Figure 3. Because the structure of the on-site energy demand may vary in different moments of the day and seasons of the year, energy storage is required for the optimal operation of micro-cogeneration systems.
To ensure the energy demand in the building, two cogeneration plants are compared to the reference case: A gas boiler and electricity from the public network. The tariffs for energy consumed from public networks (taxes included) are shown in
Table 4 [
47]. The reference values for the separate generation of electricity and heat are presented in
Table 5 [
48].
Table 6 shows the nominal technical characteristics of the two cogeneration plants considered in the case study.
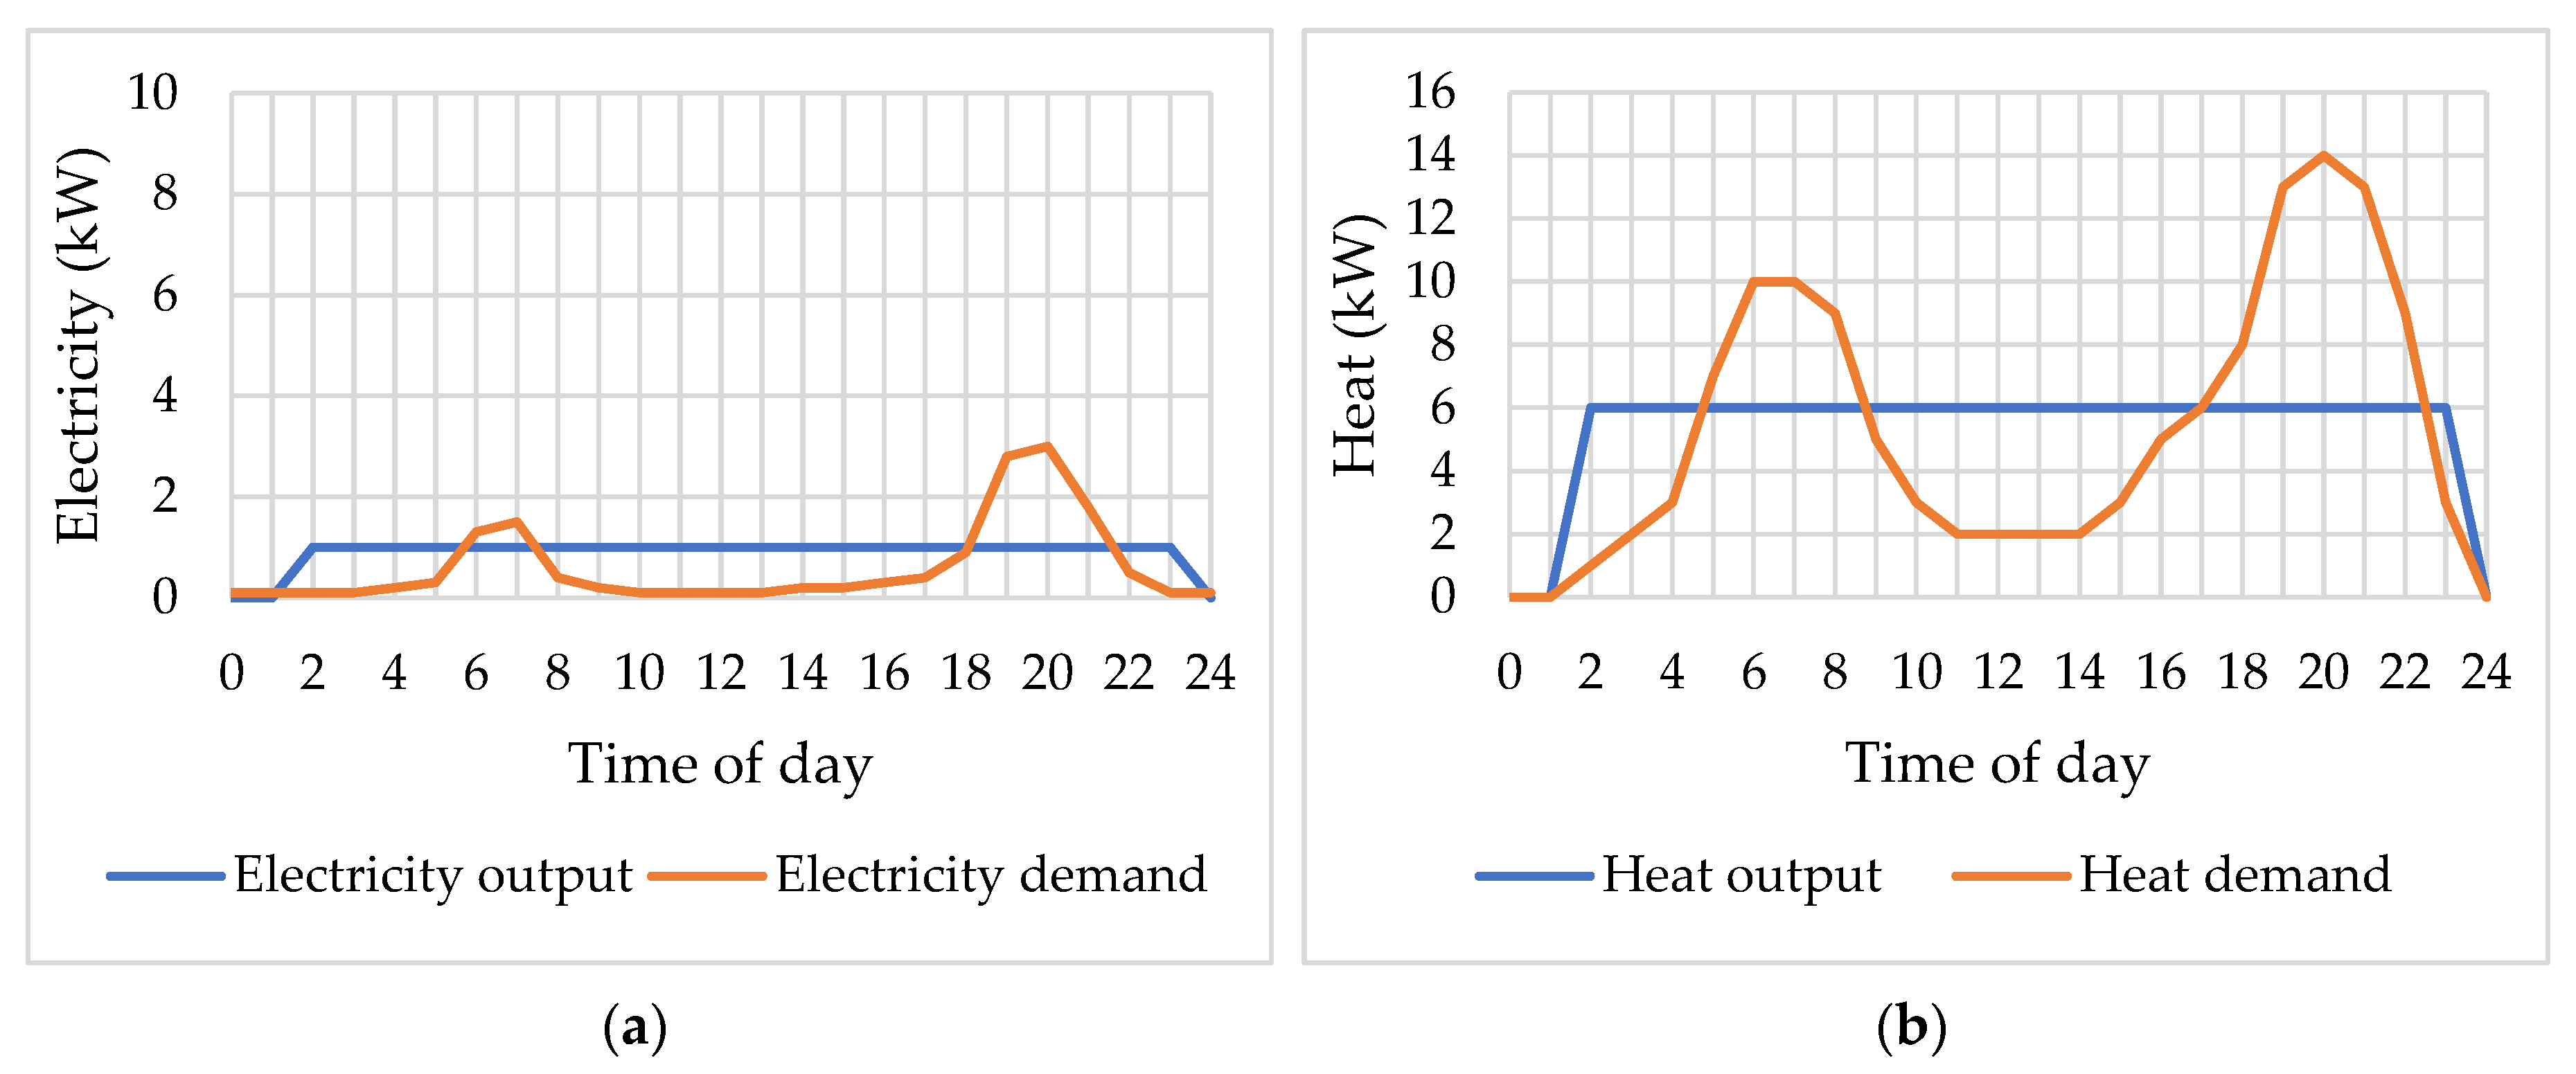
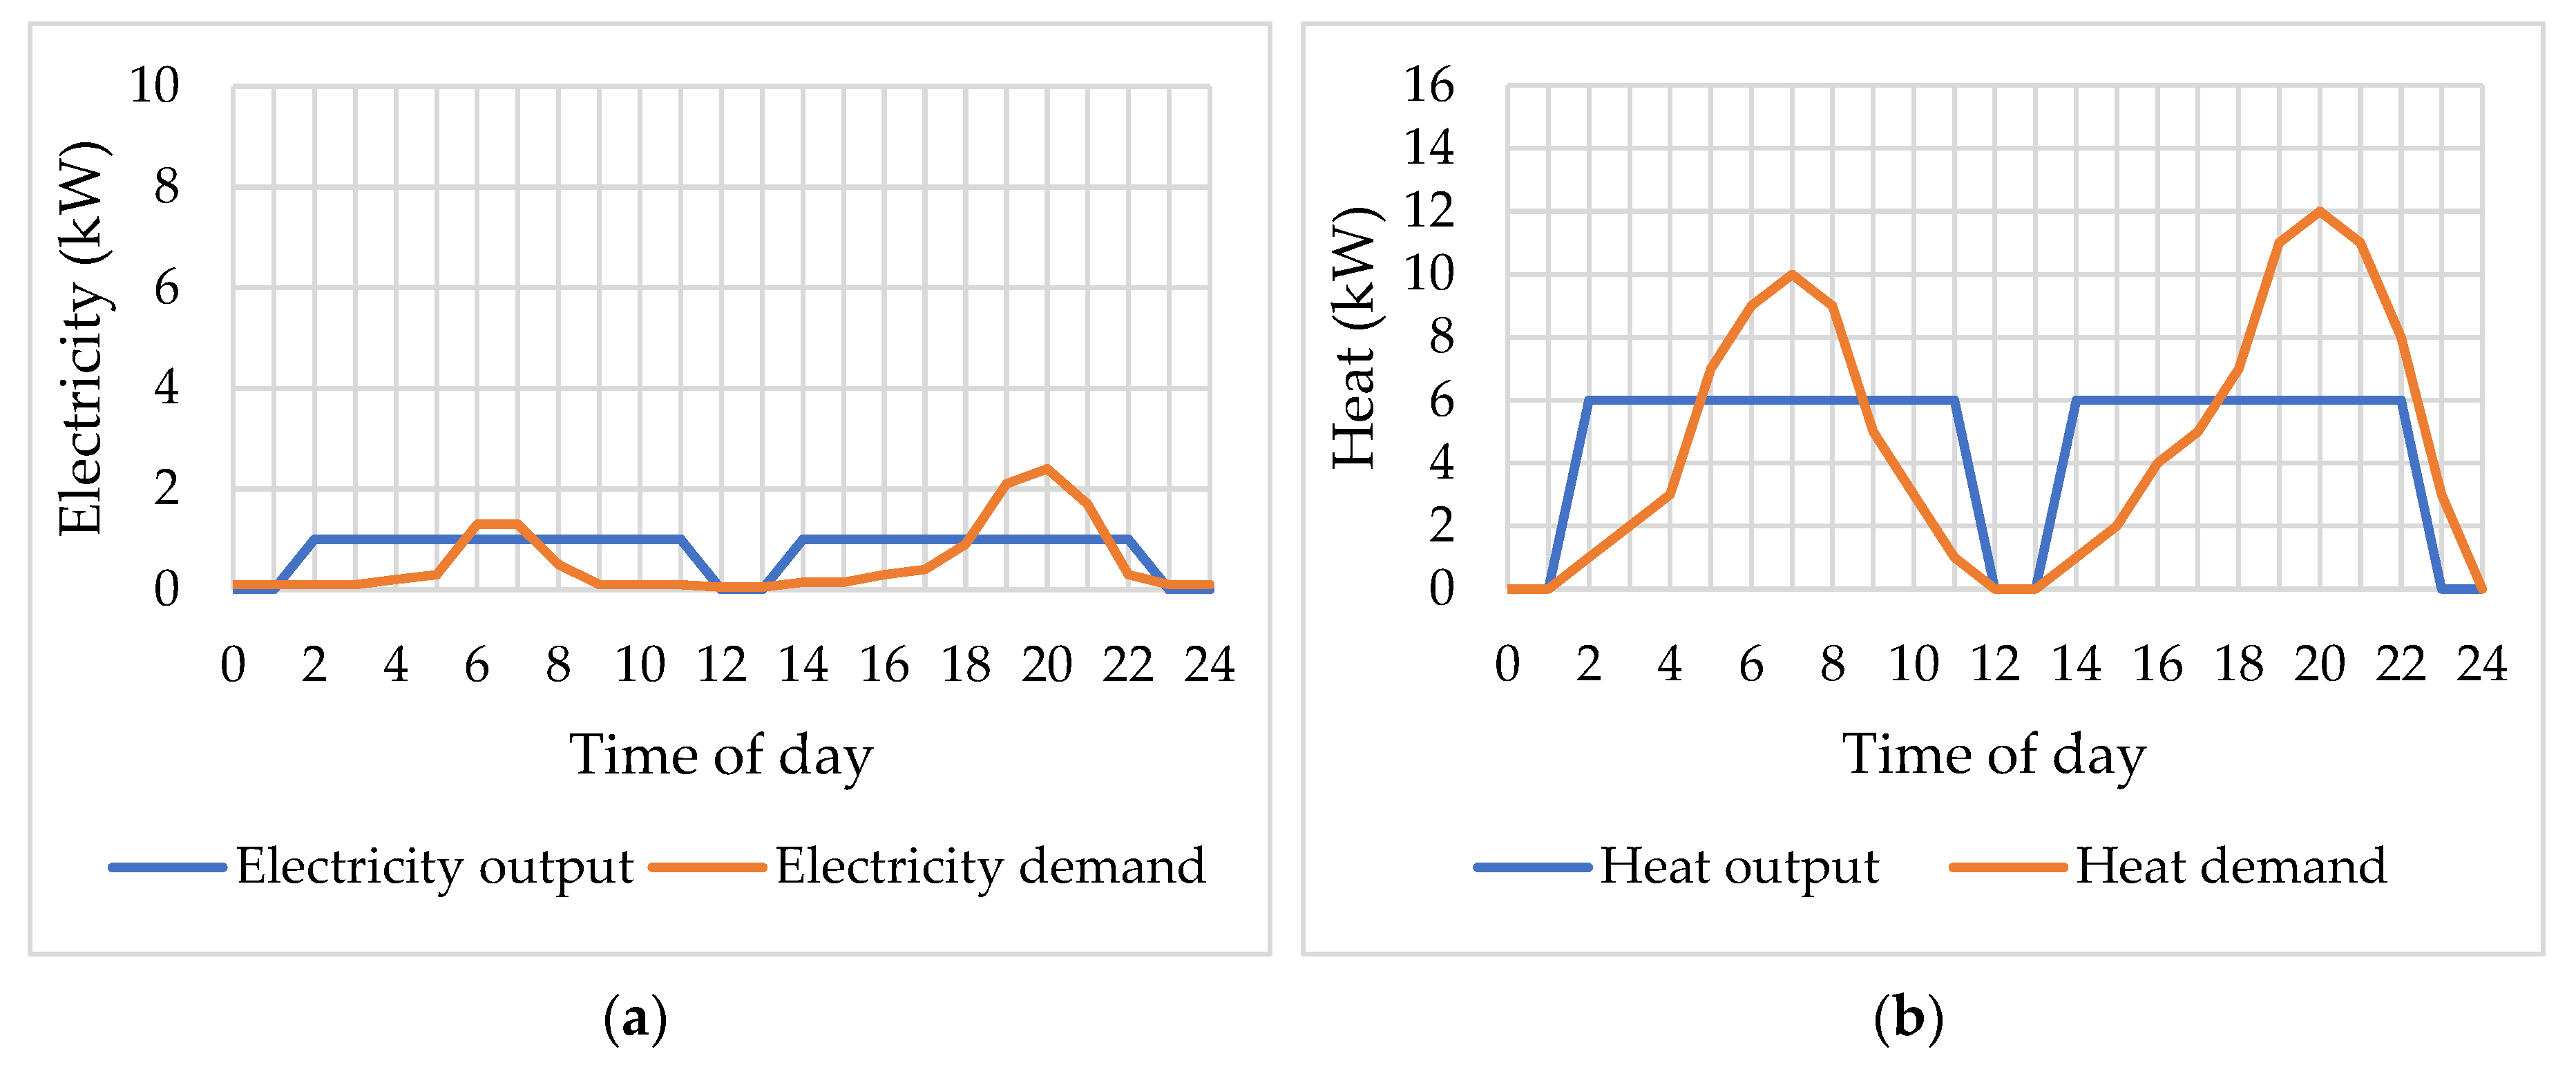
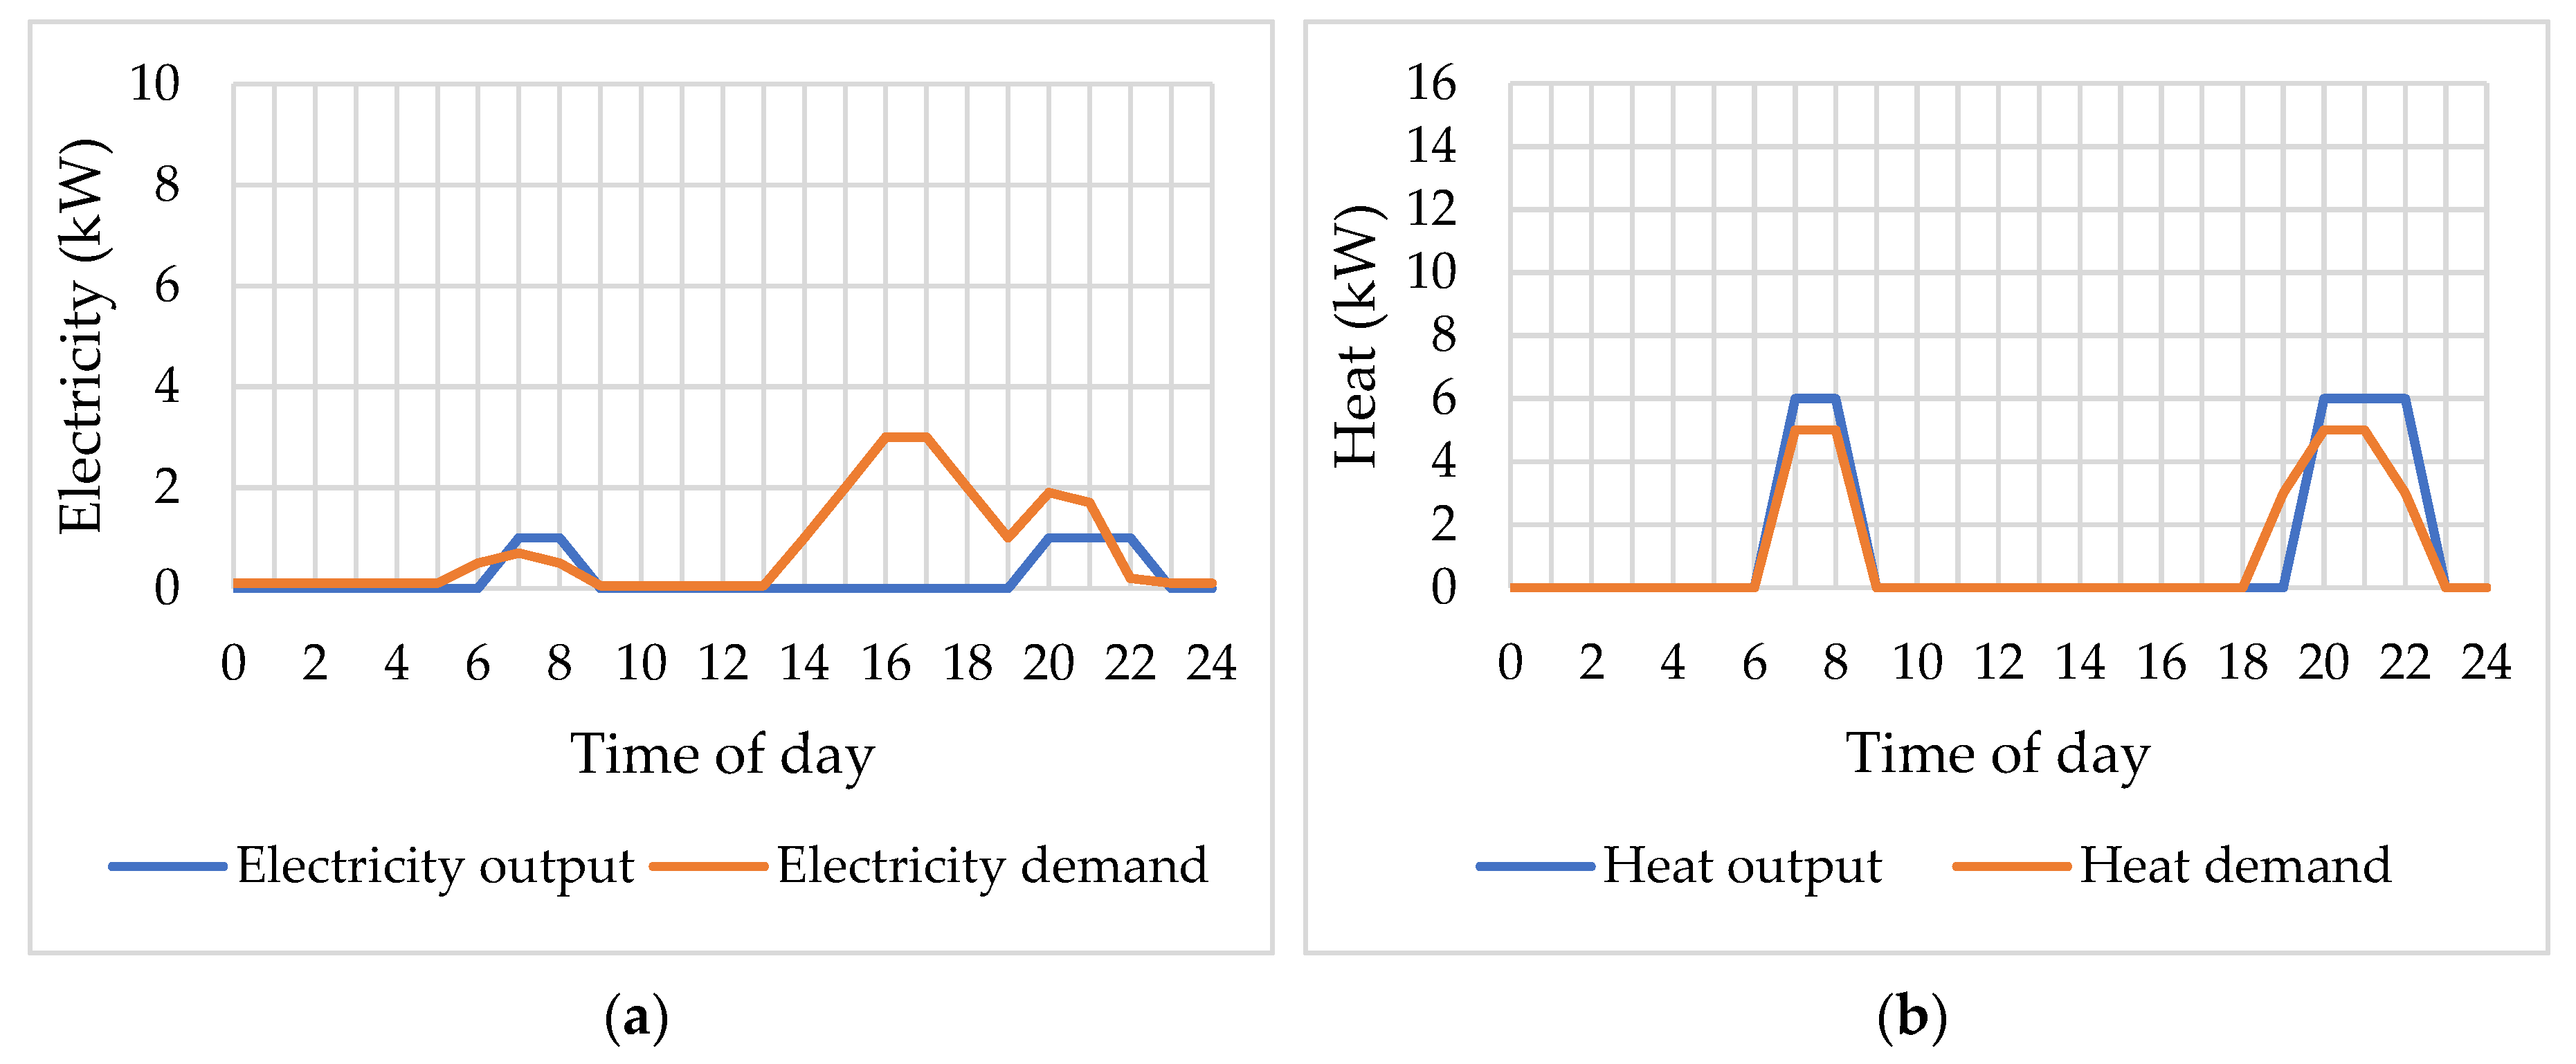
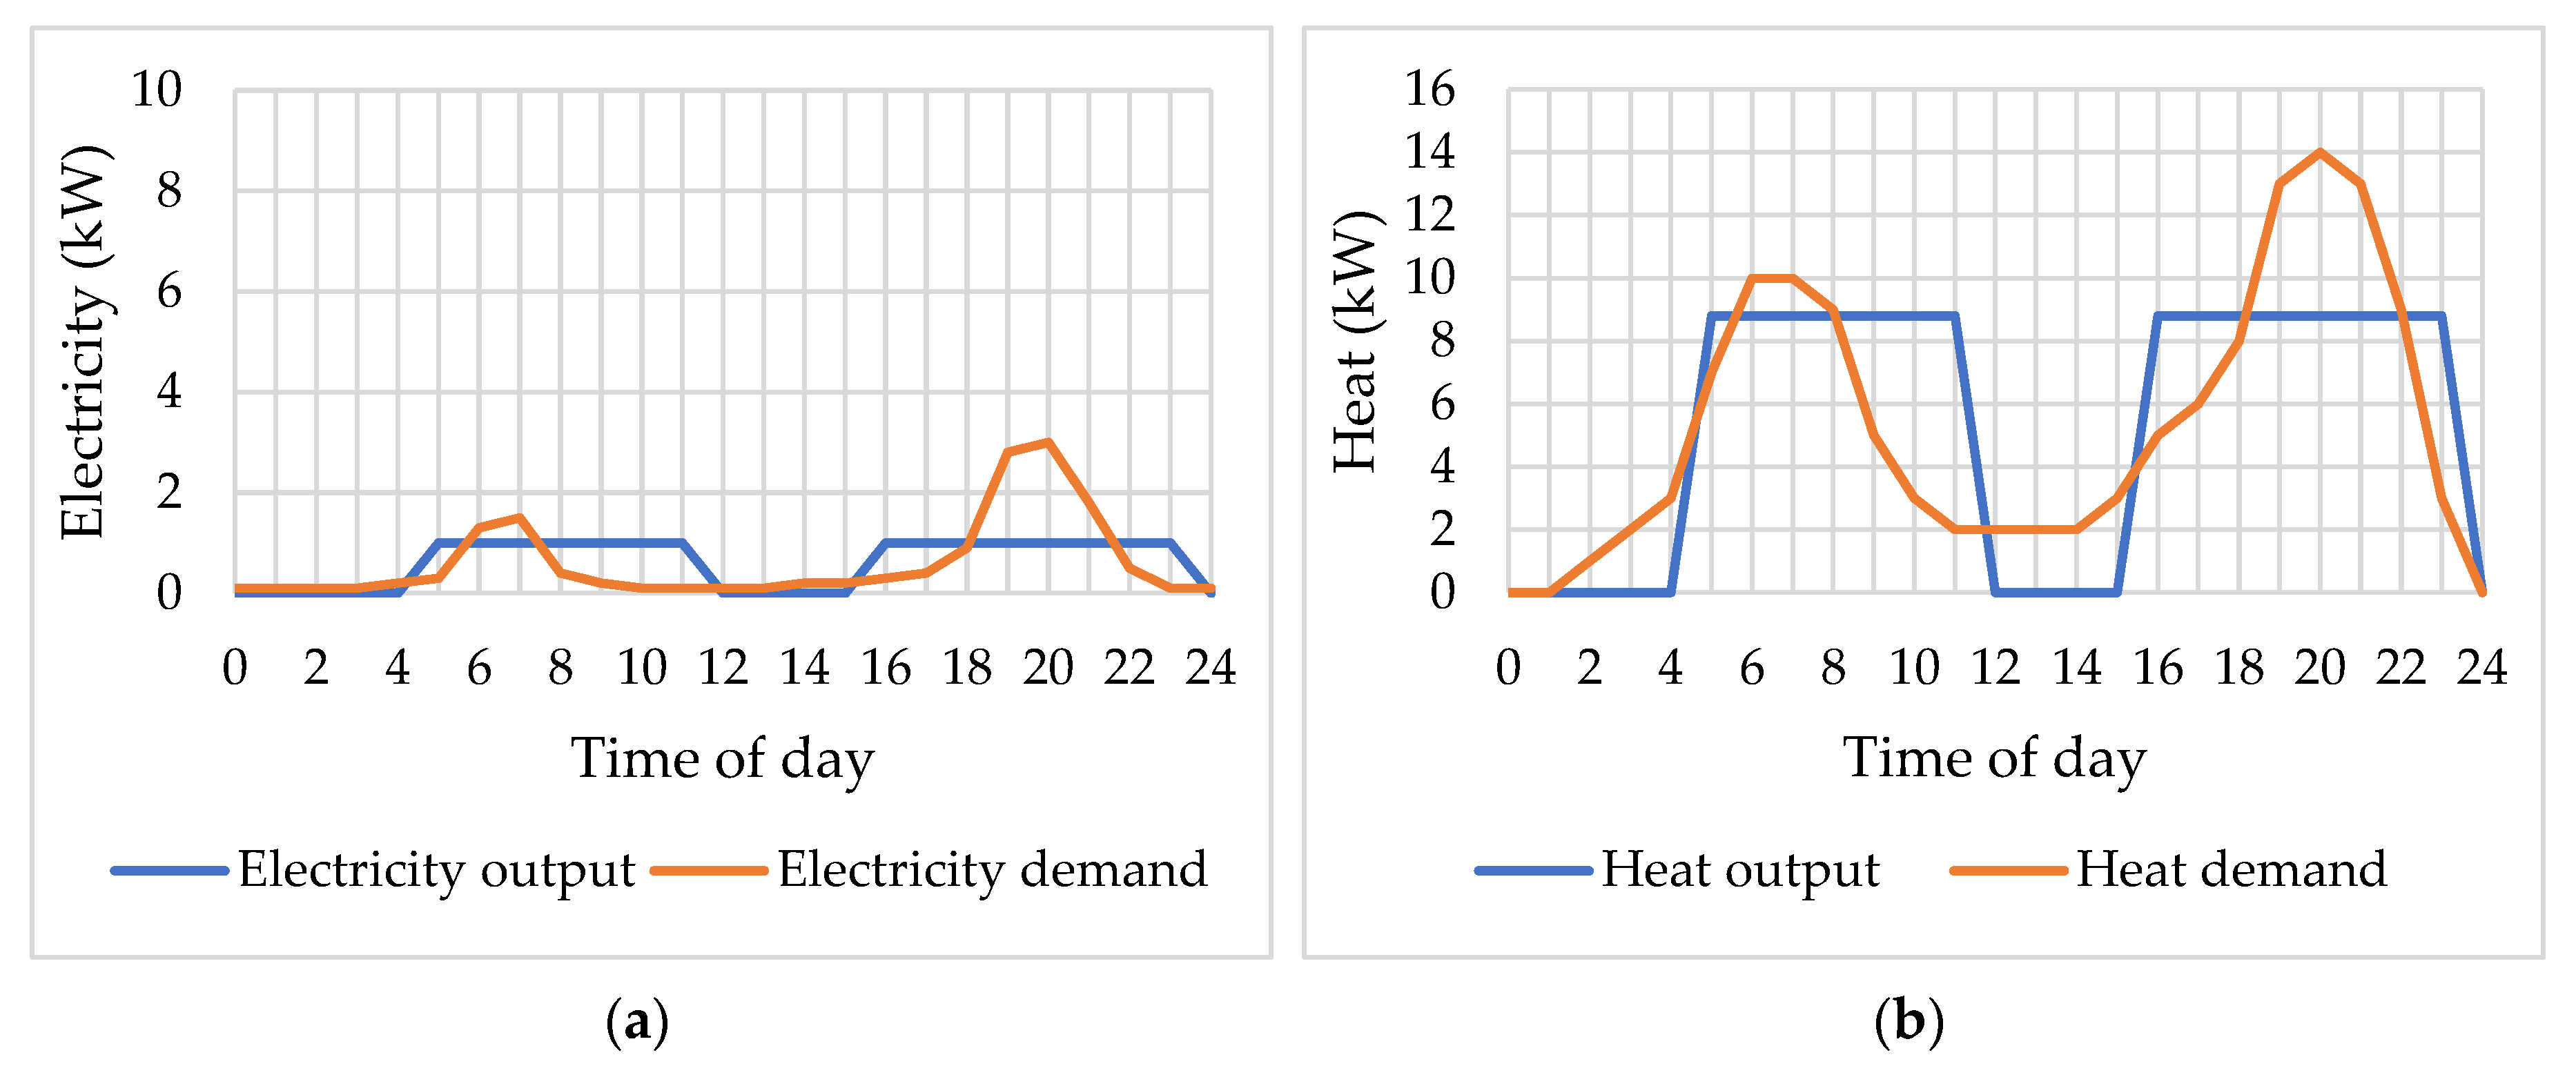
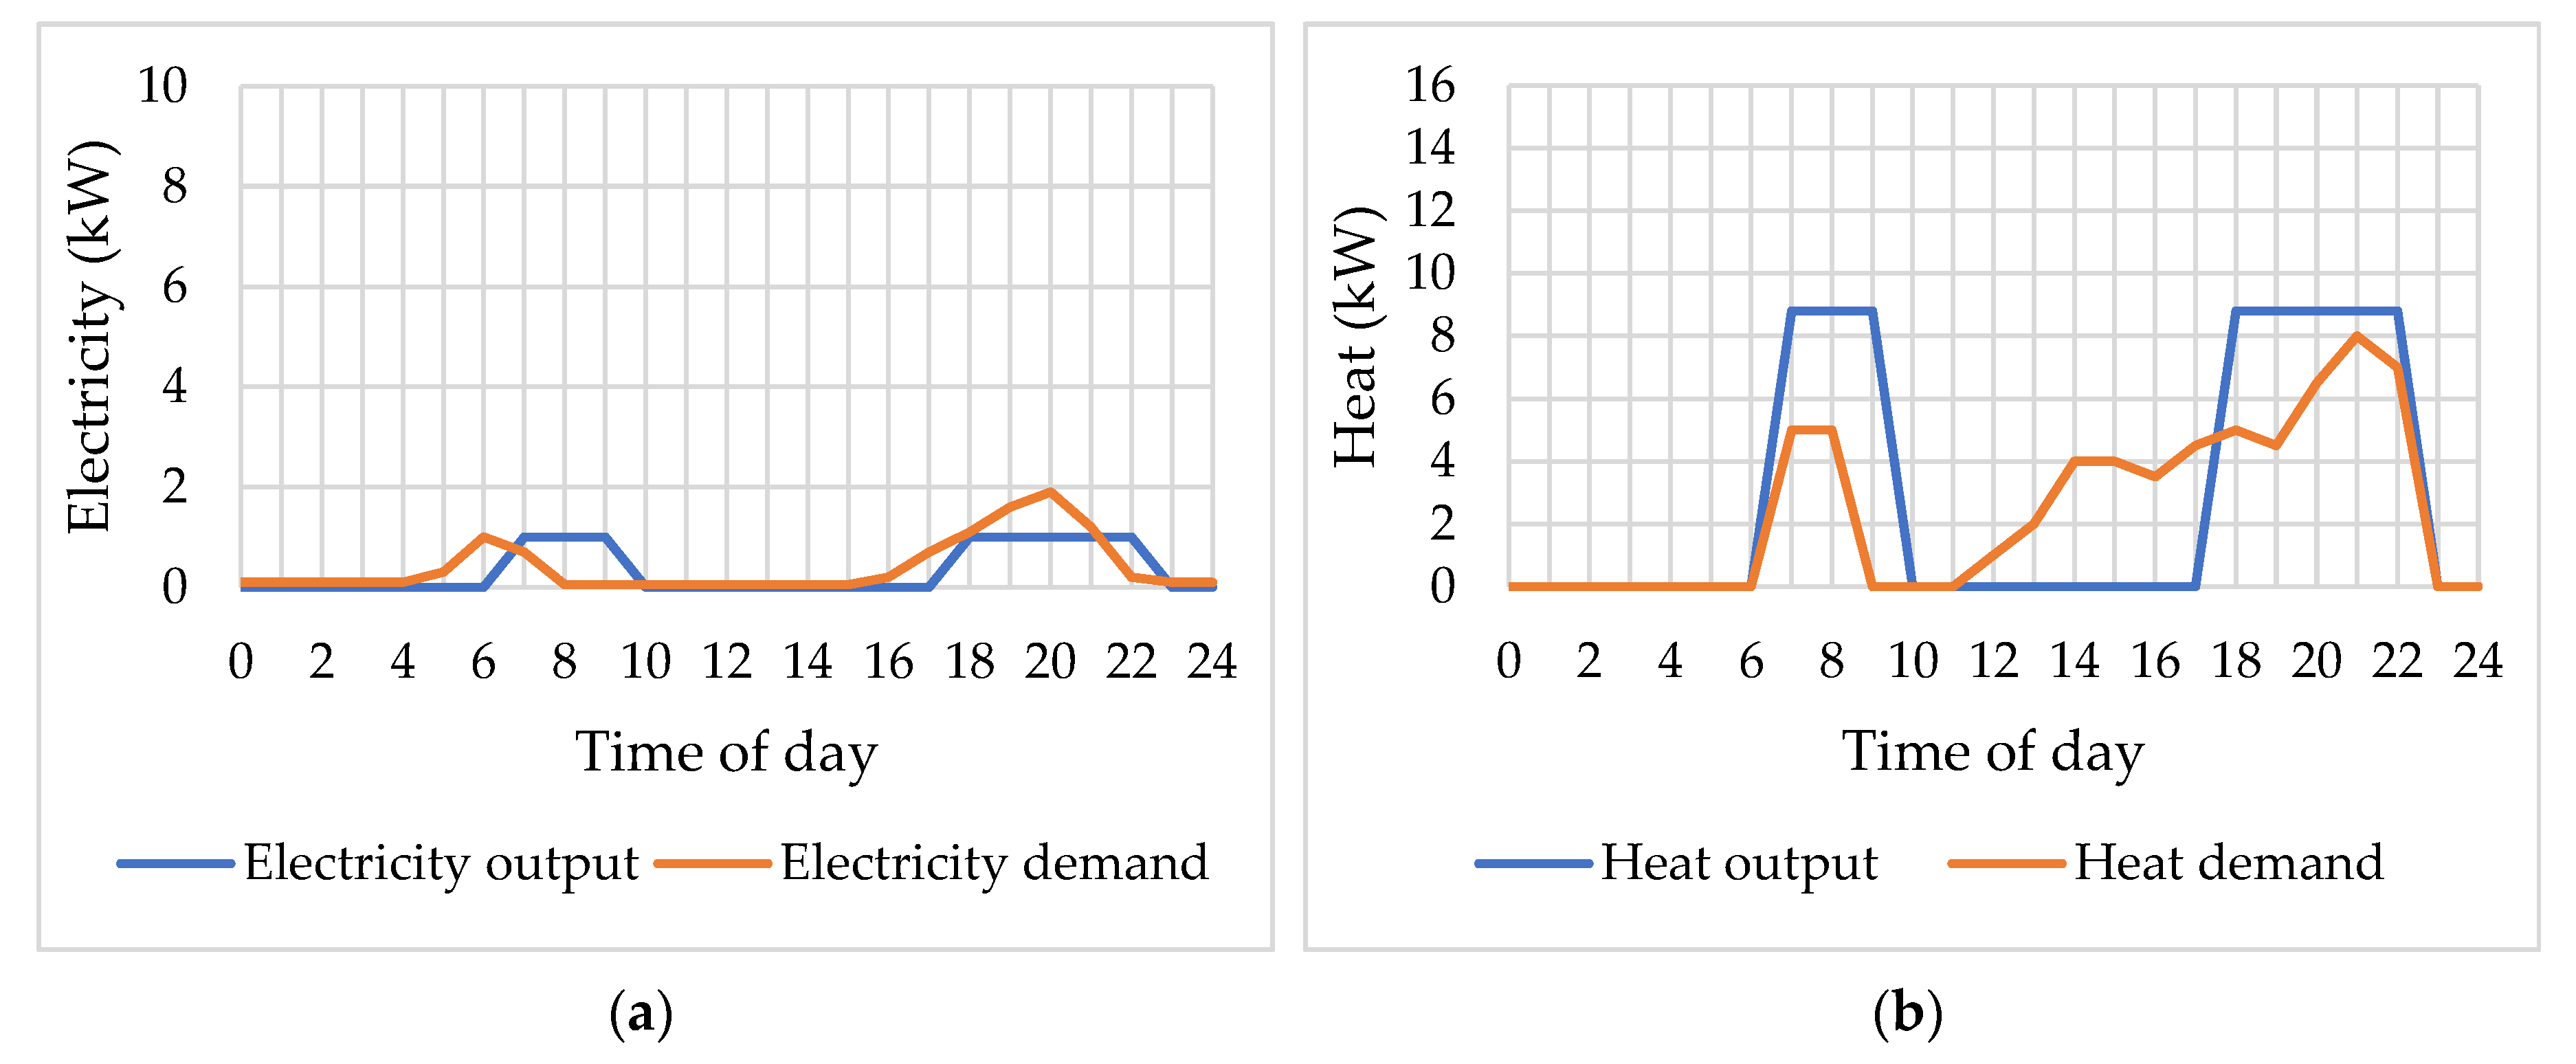
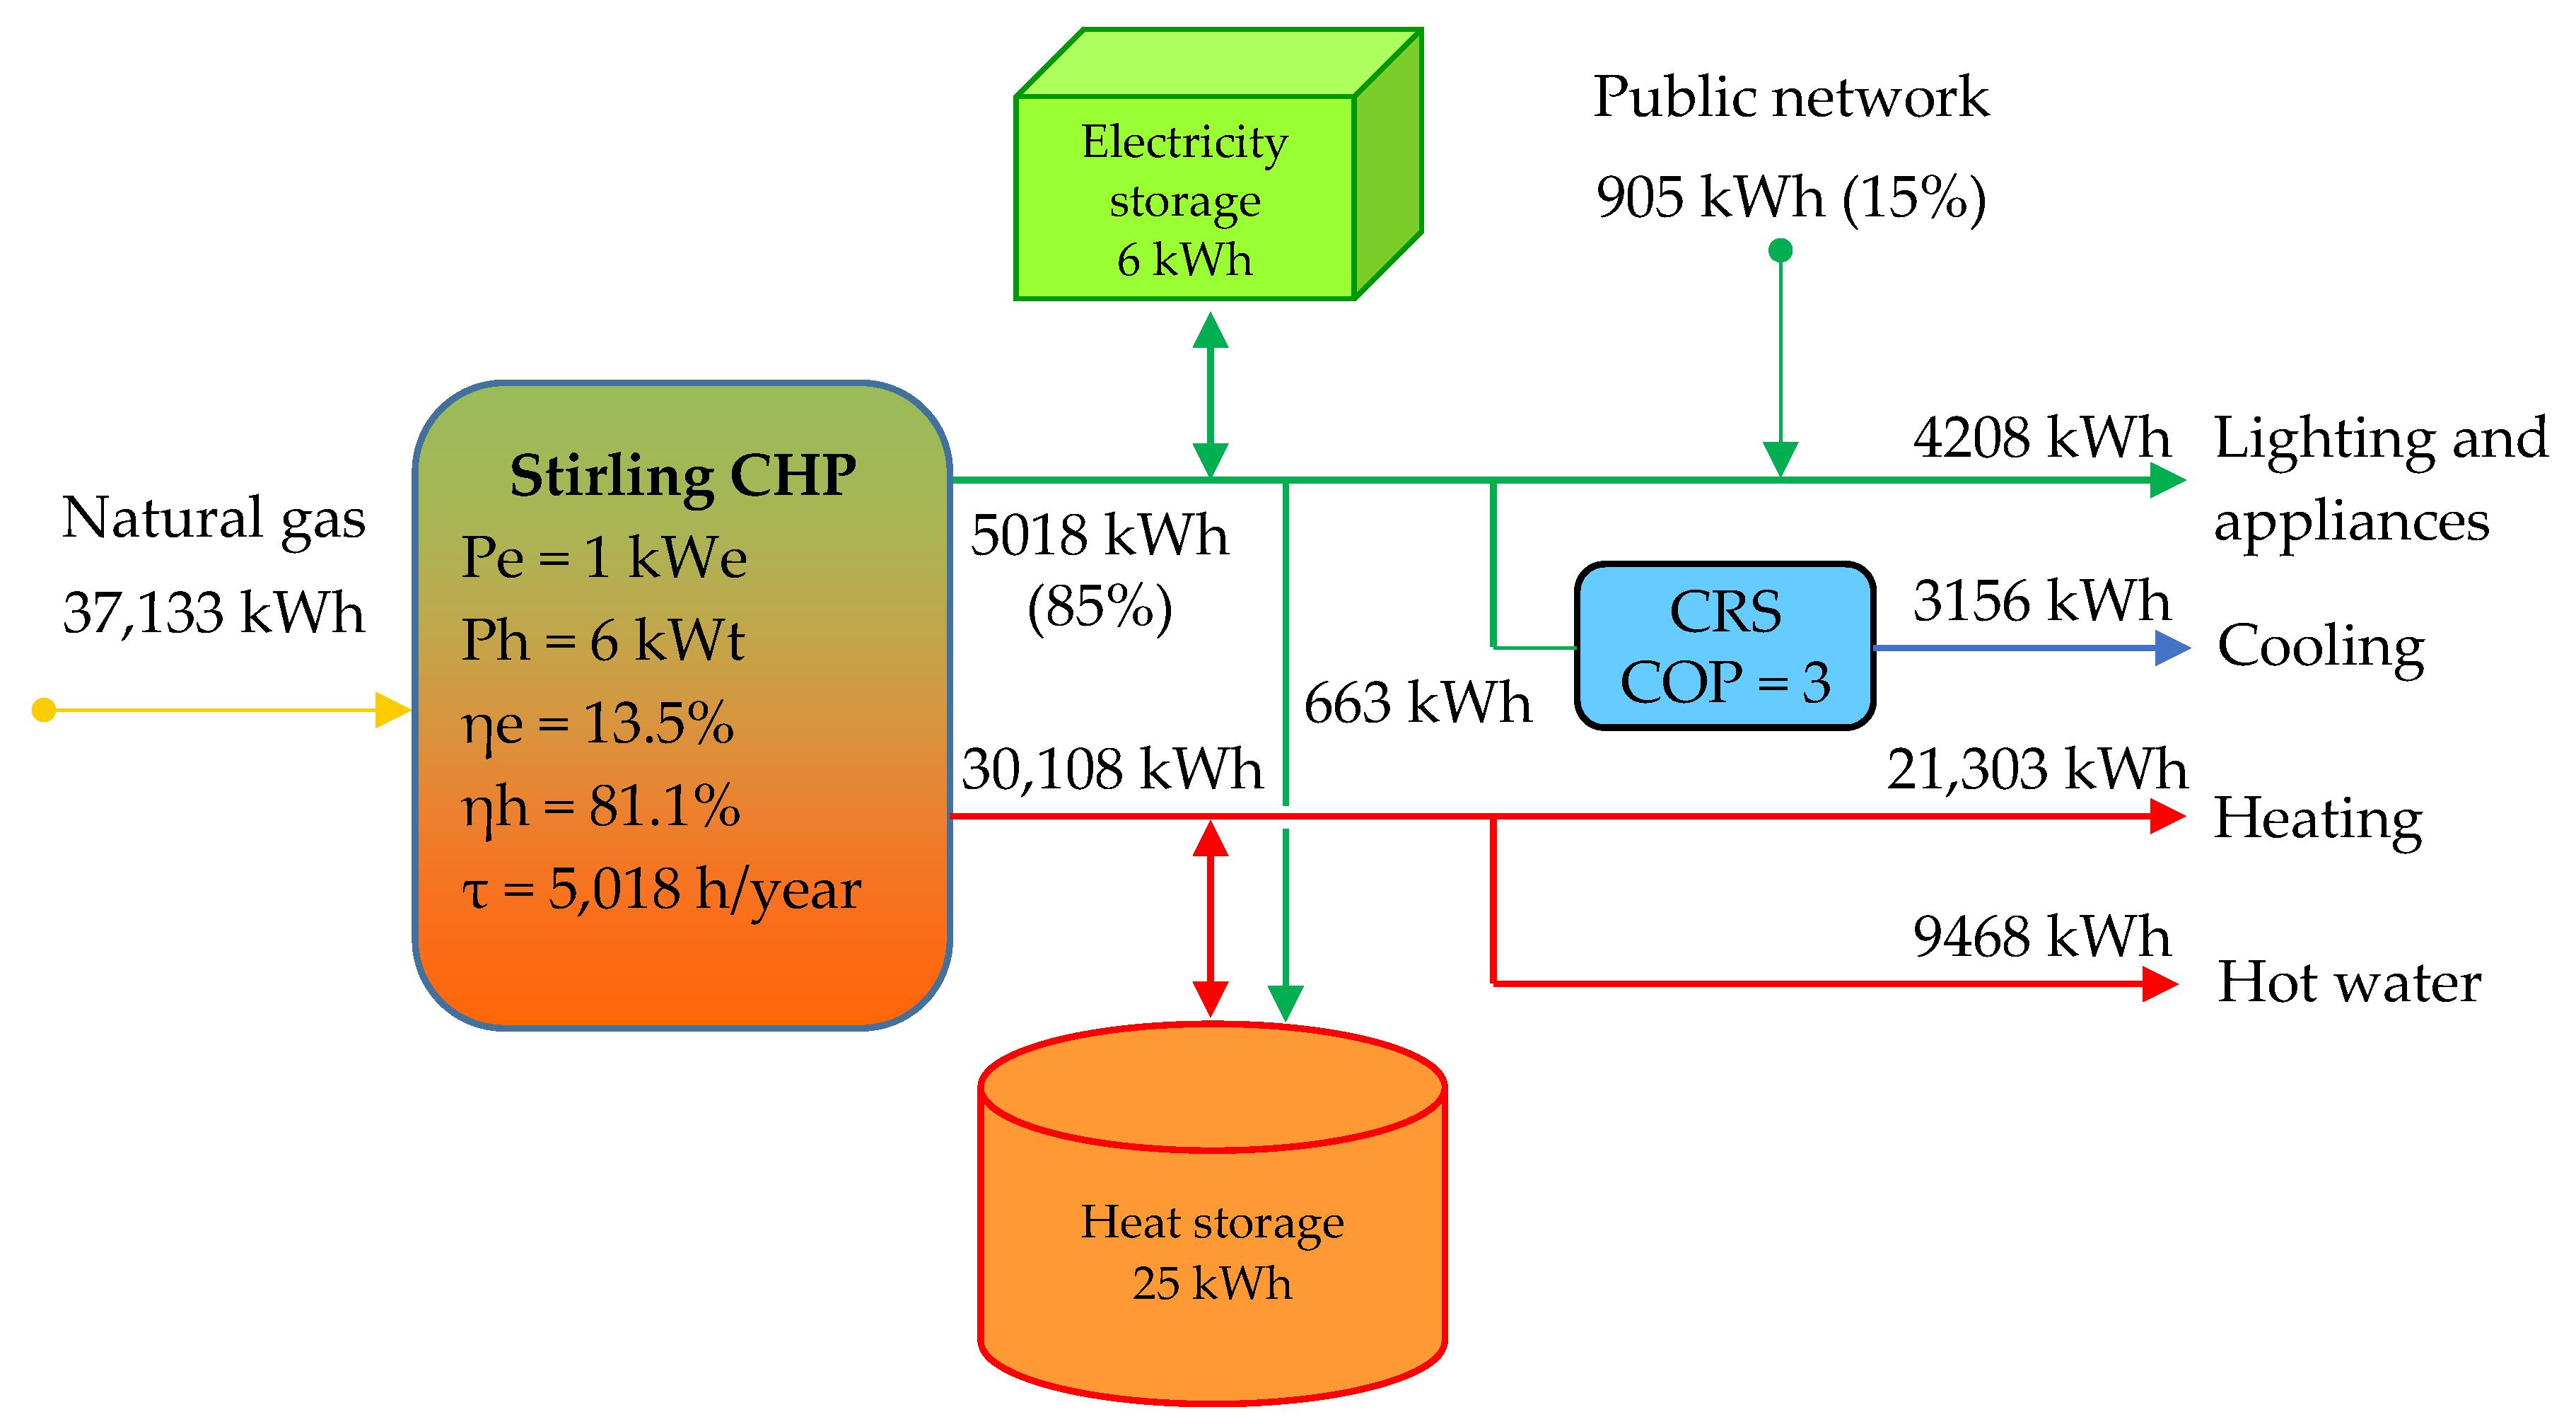
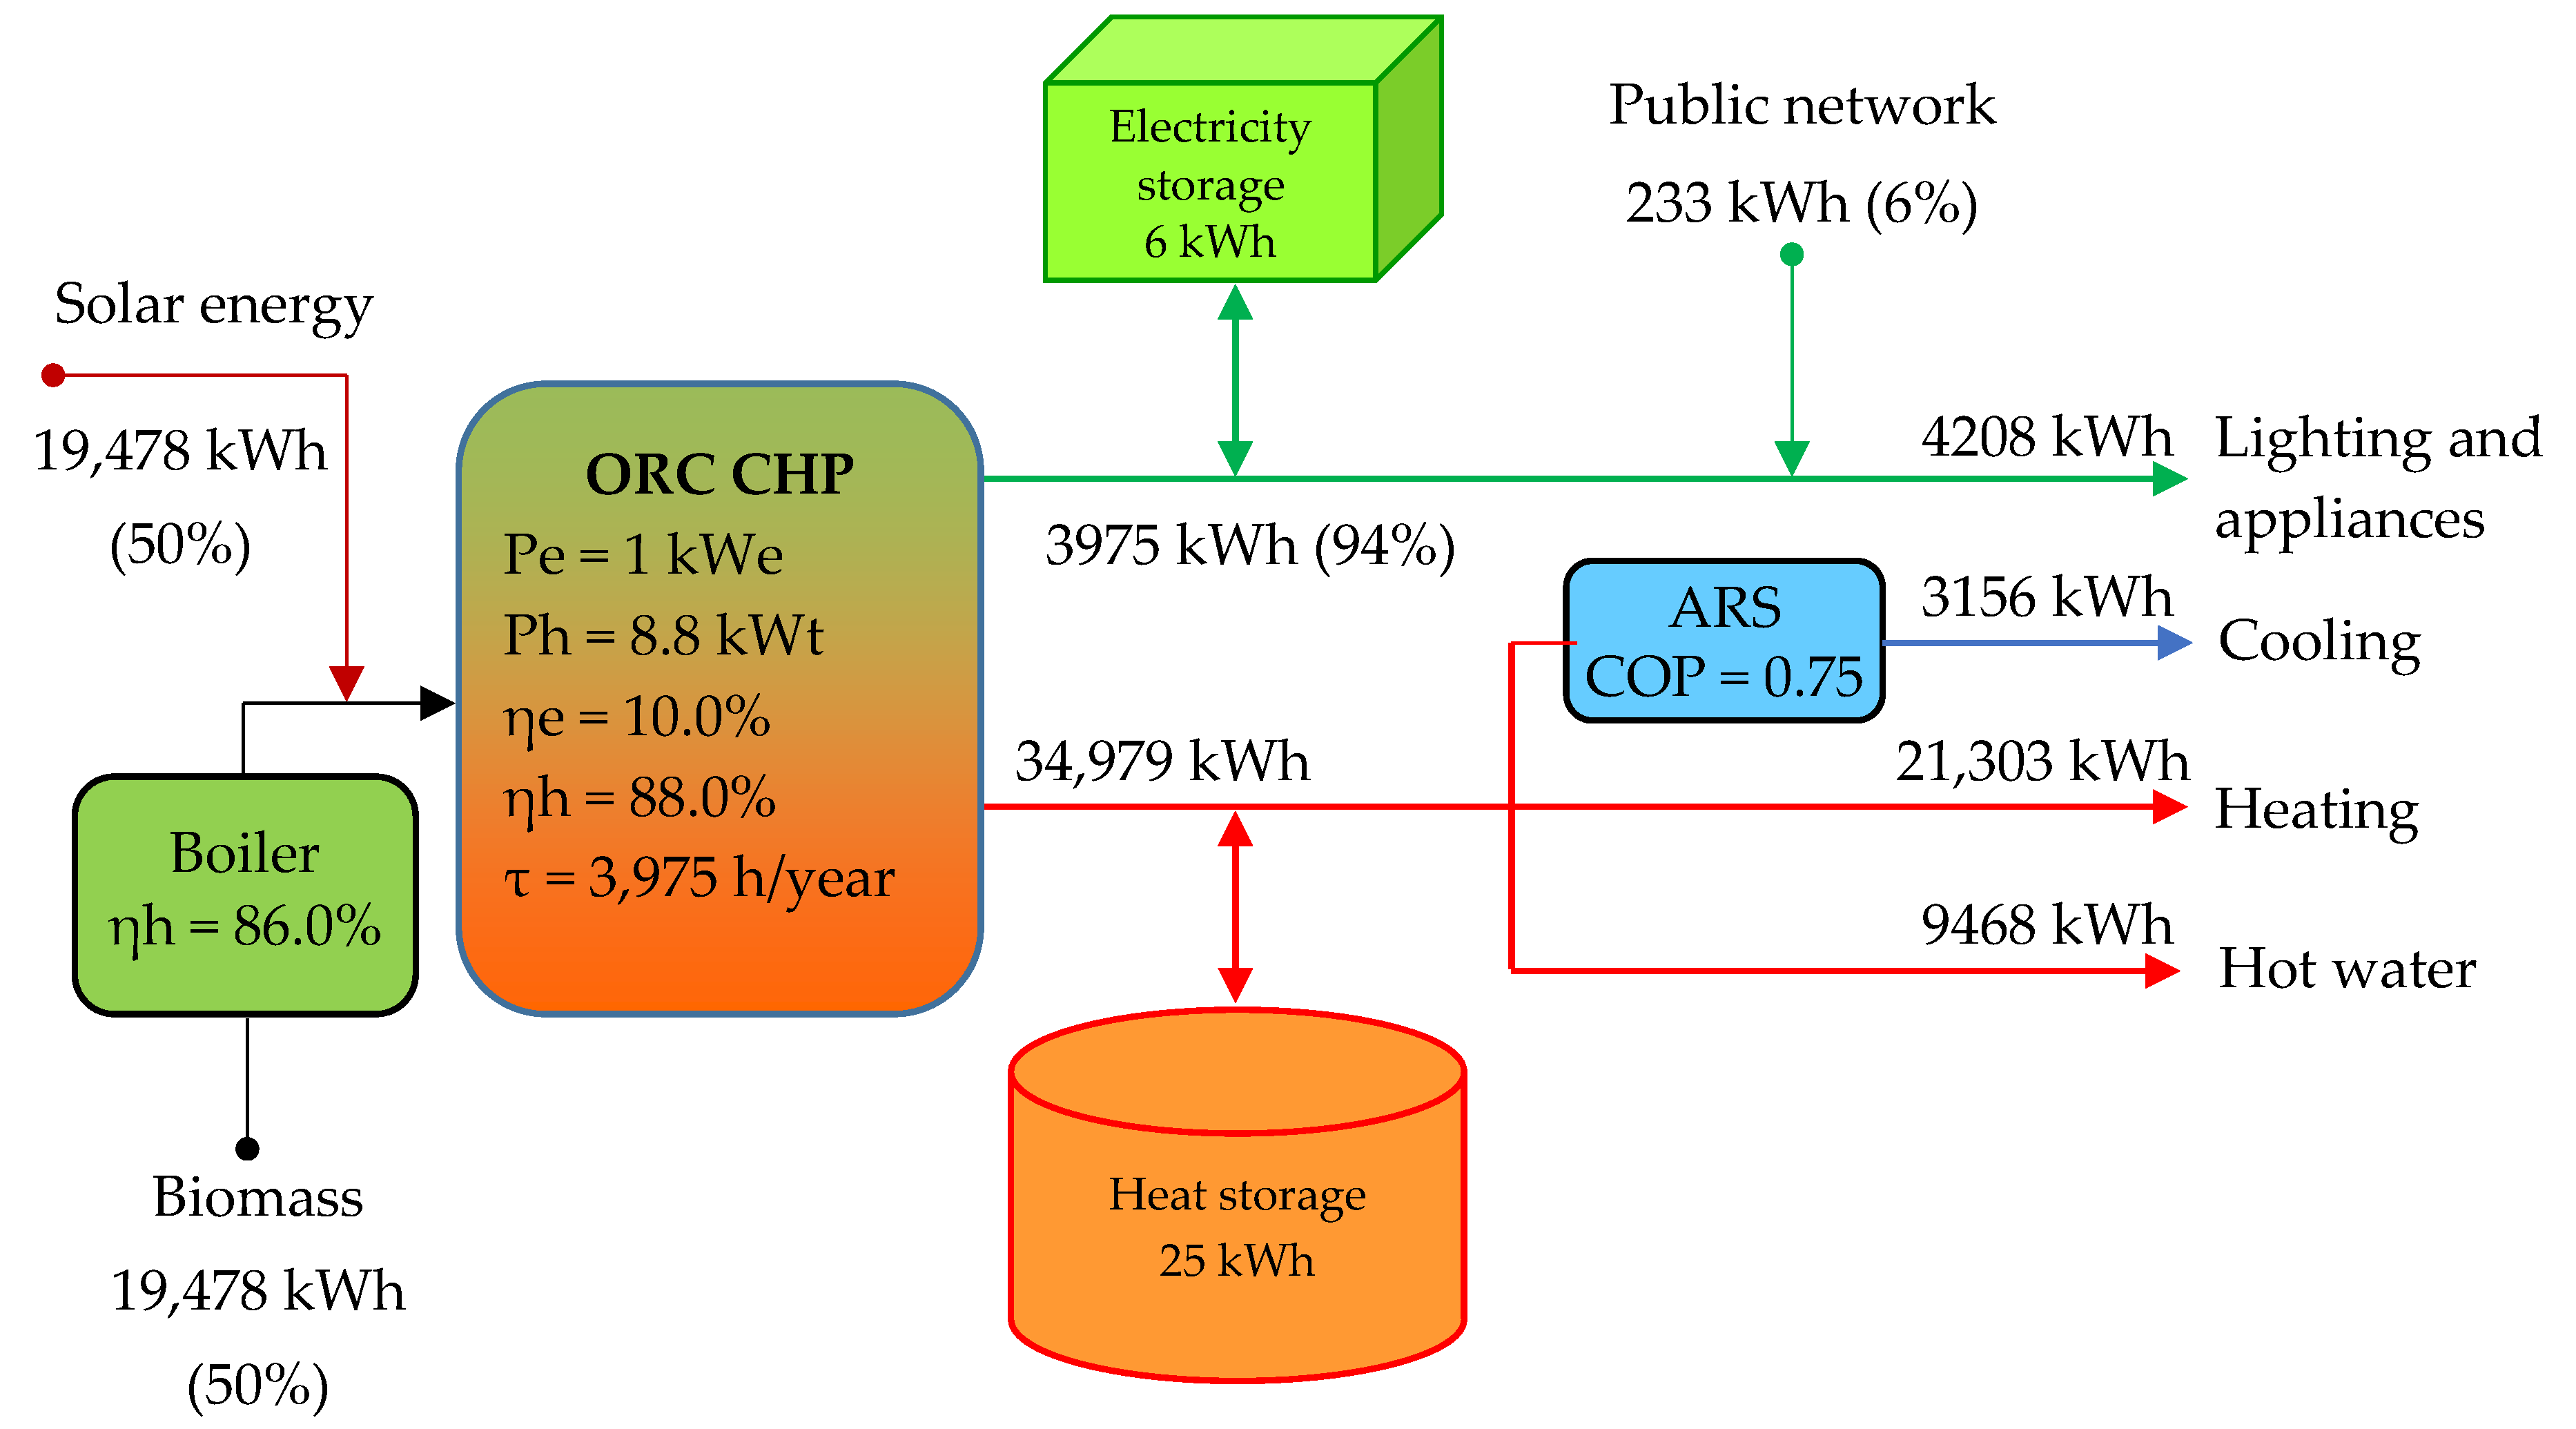
It is observed that the operating mode of the two cogeneration systems is different and depends on the power-to-heat ratio. There is a need for flexibility in the use of the available heat or electricity generated by the micro-CHP unit at a given time. Thus, in winter, excess electricity can be stored in the form of heat and used for heating or domestic hot water. In the summer, excess heat can also be stored and used for cooling.
Figure 10 and
Figure 11 show how the requirements of utilities in the building were correlated with the cogeneration production of heat and electricity for one year.
The primary sources used may also cover peak thermal demands when the load provided by the cogeneration system is insufficient. In most cases, because the demands for building utilities (heating, cooling, domestic hot water, and electricity) are not at the same time, energy storage is required. The heat storage system represents a key component for the micro-CHP systems since it permits to store the unused heat during electricity production for a later use. The micro-CHP system can primarily track heat demand by supplying electricity as a byproduct or can track electricity demand to generate electricity and use heat as a byproduct. The heat storage will allow the system to capture heat when not in use and then deliver it when the process requires more heat than the cogeneration unit can offer. Electricity storage is used for the same reasons. Depending on the particulars of household consumptions, the storage systems have been dimensioned according to the maximum duration loads to ensure at least three to four hours thermal load and at least two hours electrical load. Oversize of the storage systems can reduce the profitability of the micro-CHP system.
5. Results and Discussion
In order to analyze the feasibility, the difference of investment costs for a micro-CHP system compared to the reference scenario is taken into account. Due to the low power of the micro-CHP system, there is no major difference in operating costs compared to the reference case. Therefore, in this study, the operating and maintenance costs (O&M) are equivalent to a domestic gas boiler [
49]. Also, there are no additional costs to staff for the use of biomass. Material handling is done by the owner of the individual household.
Table 7 shows the cost range based on the type of prime mover that drives the CHP system [
29,
50,
51,
52,
53,
54]. The results of the technical and economic calculation are presented in
Table 8. The cost of the ORC CHP system also includes the cost of solar panels. Pellets and briquettes are the type of biomass considered in the calculation and the price is 0.025 EUR/kWh.
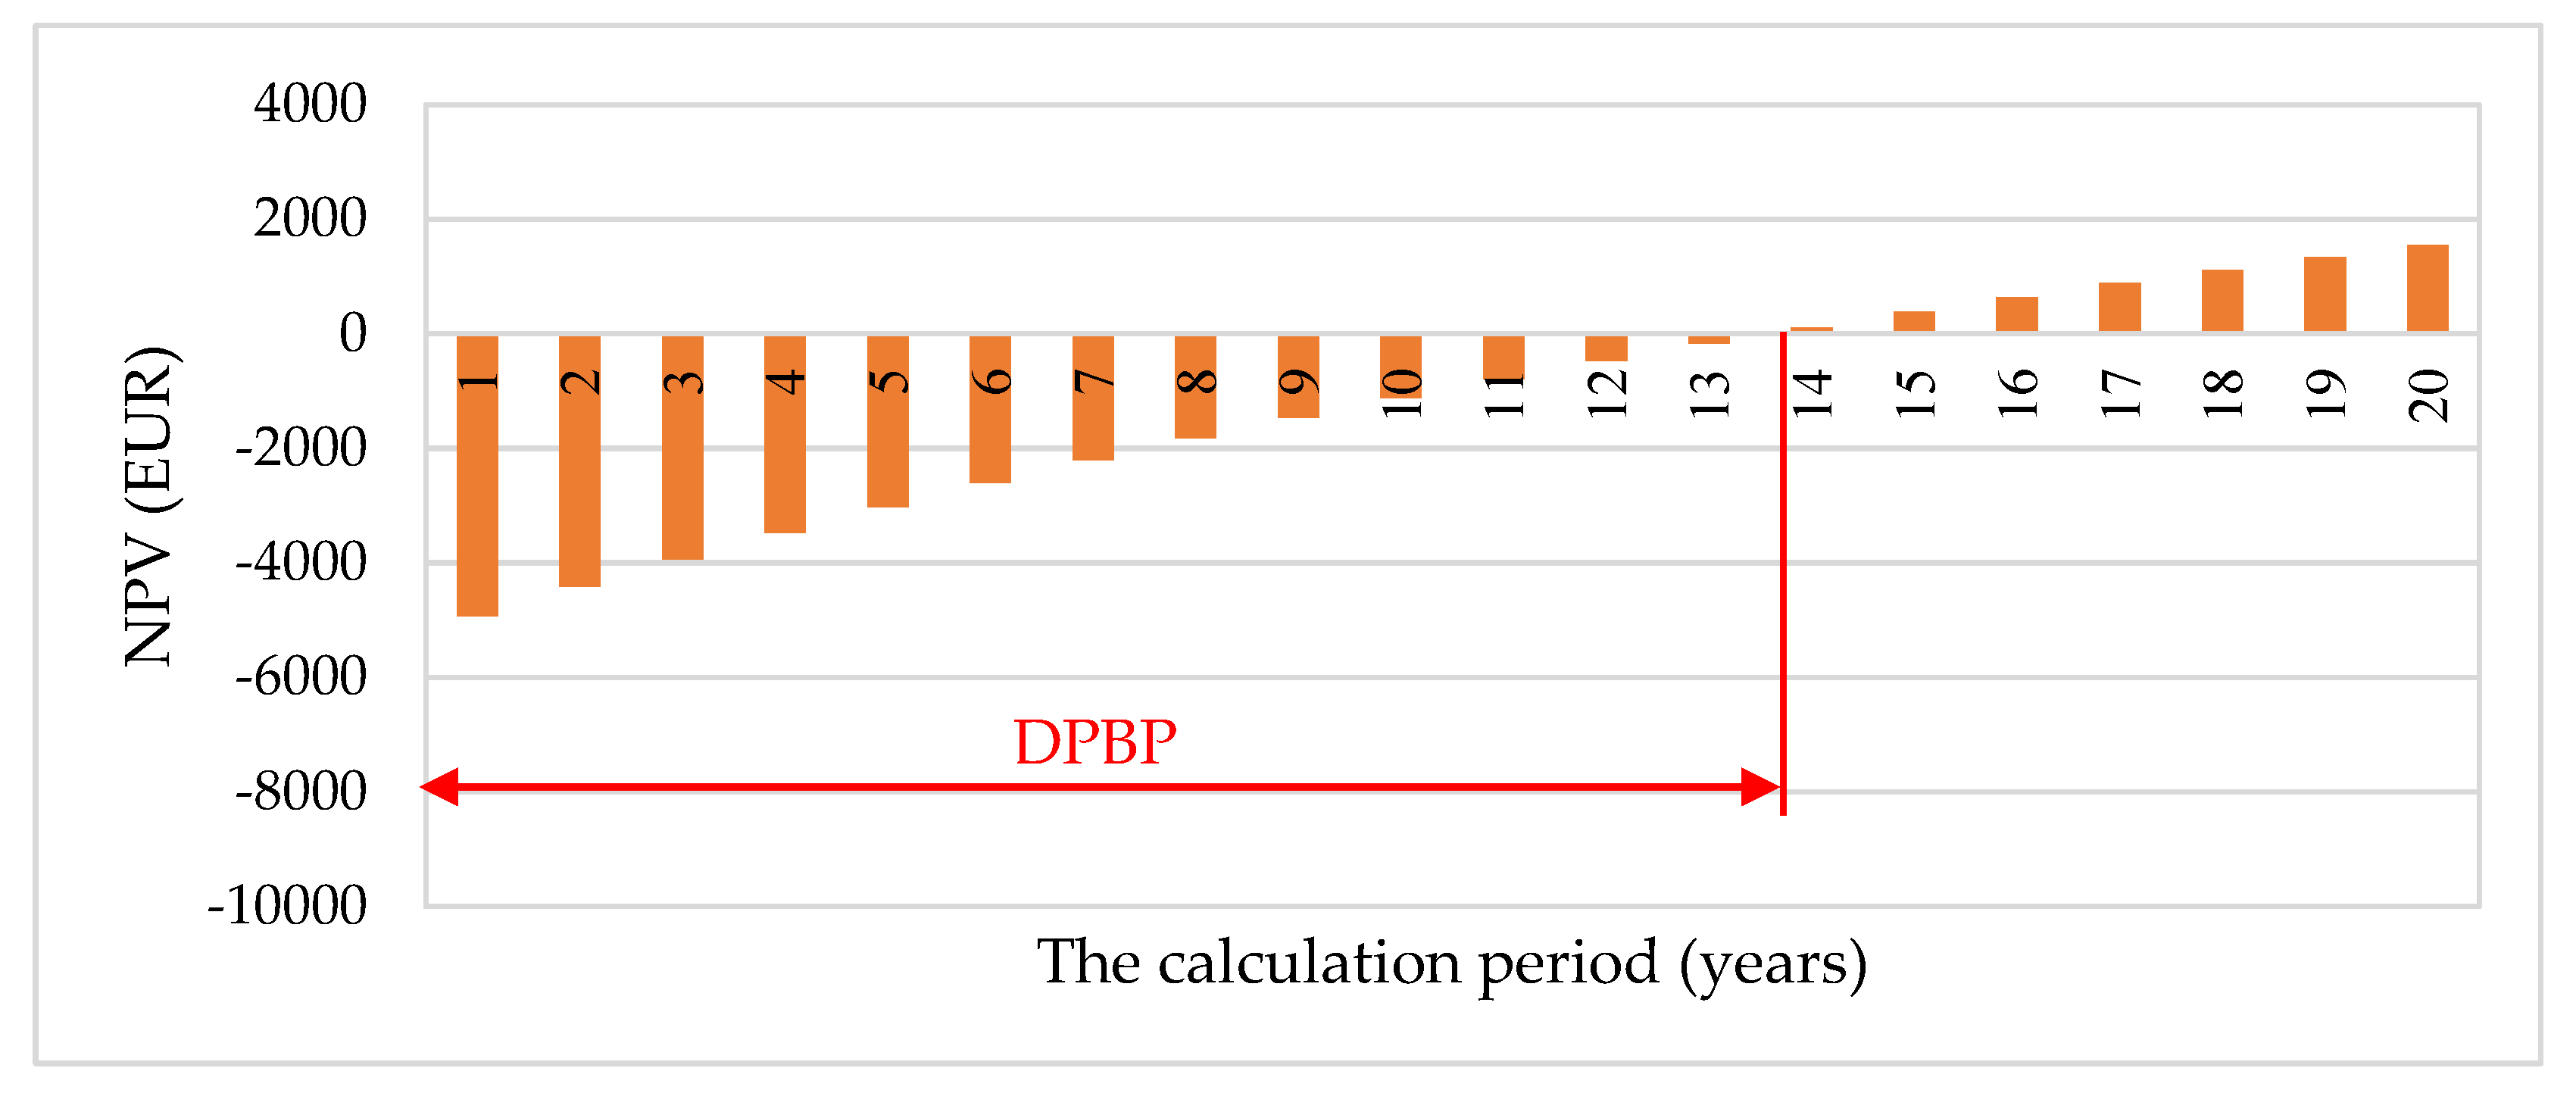
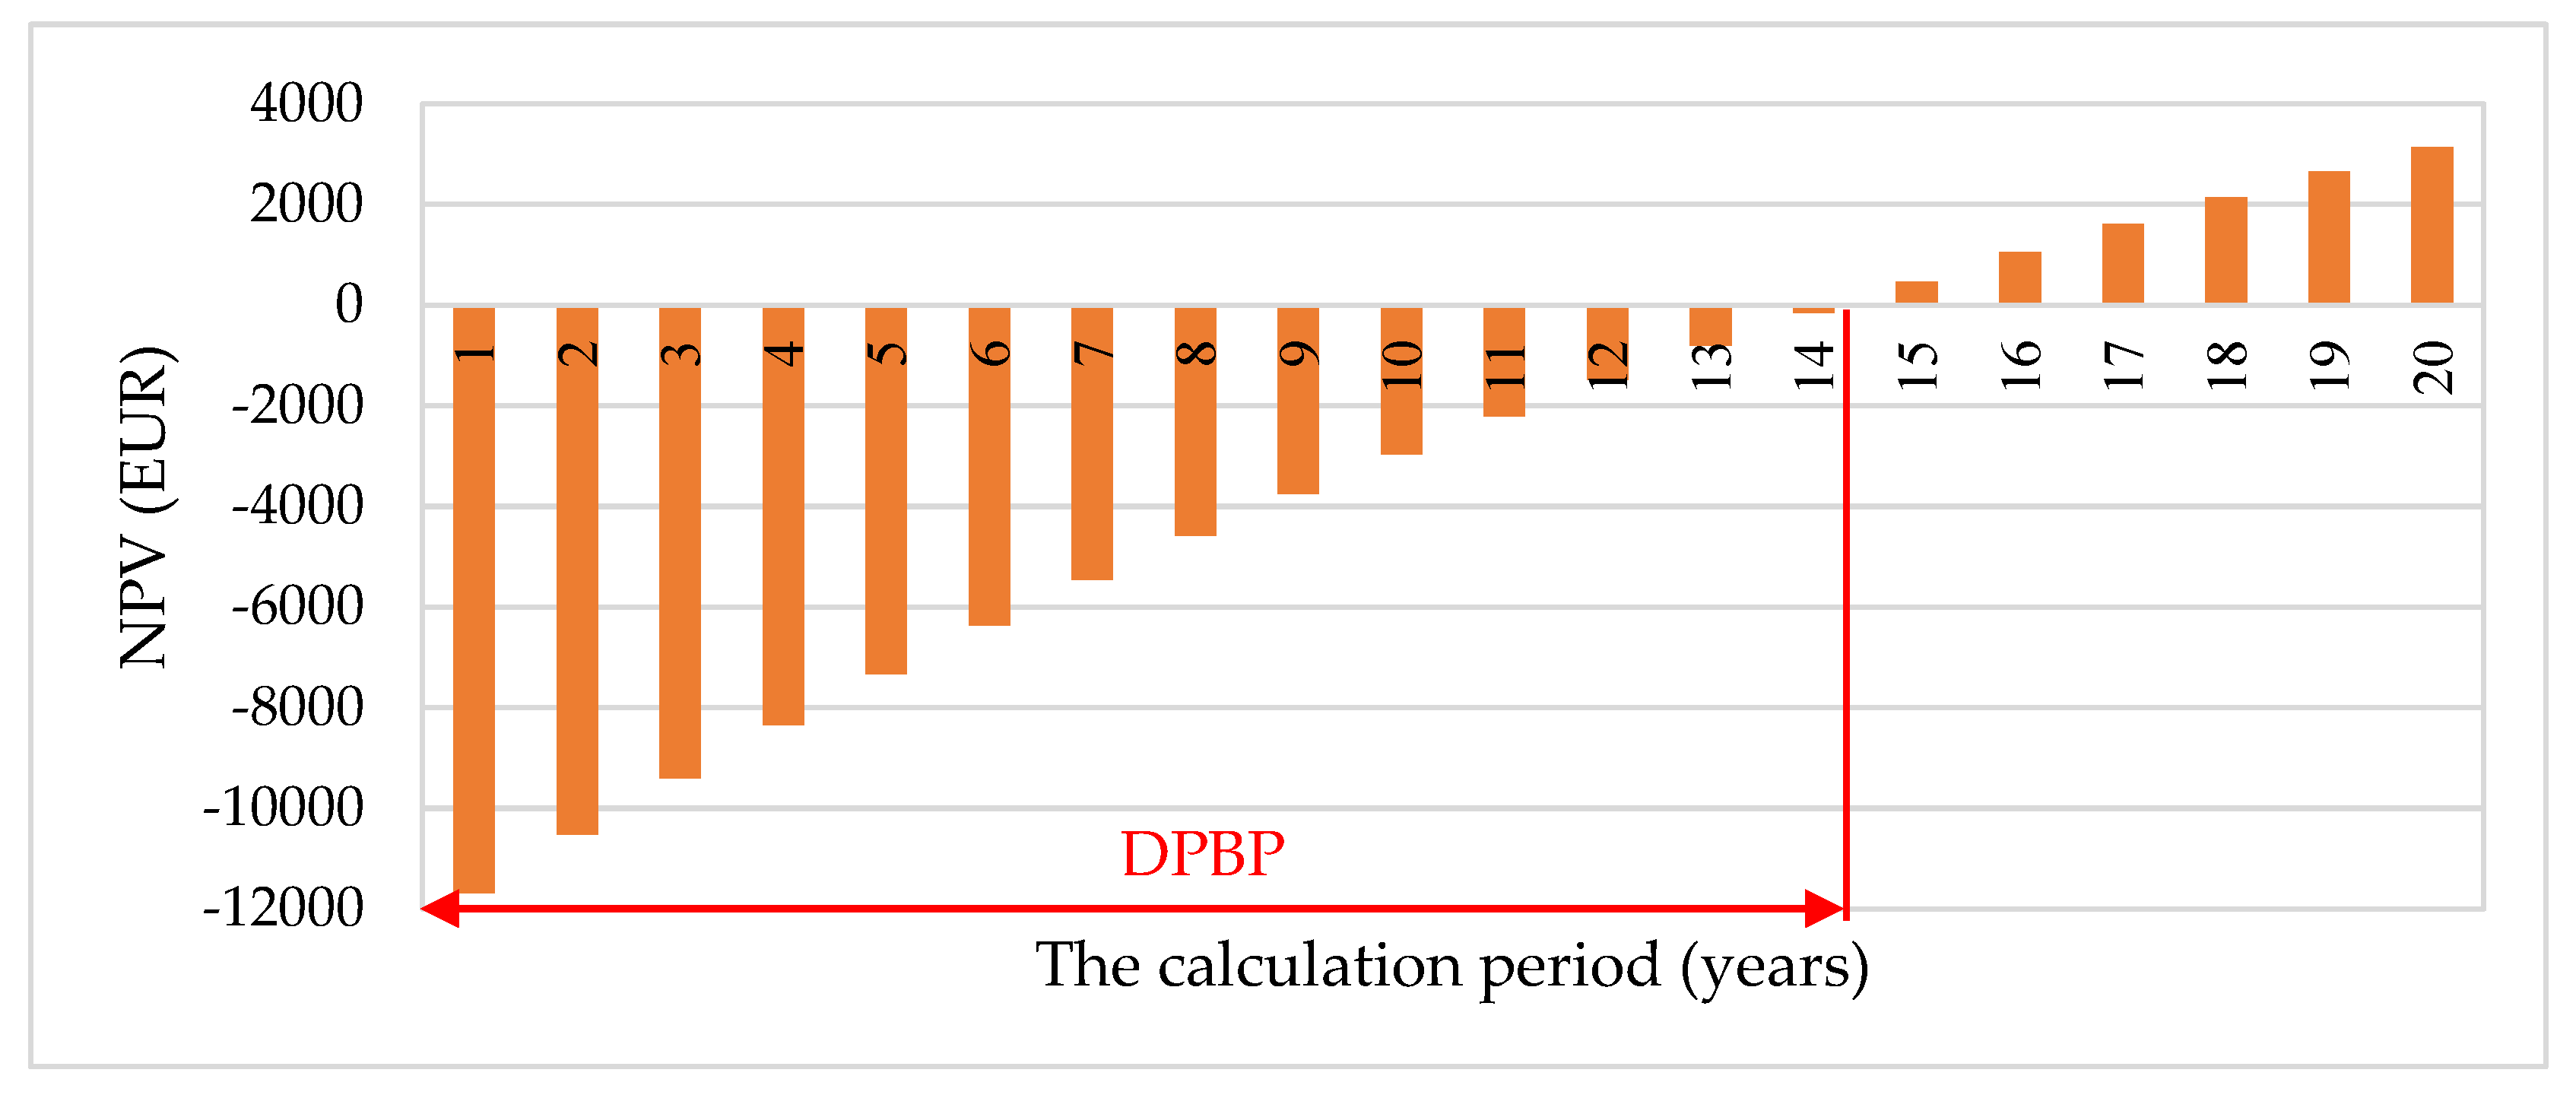
Figure 12 and
Figure 13 show the Net Present Value (NPV) in both cases.
The discounted payback period (DPBP) is more reliable than the simple payback period (SPBP) as it accounts for time value of money. The DPBP shows the operating period, at the end of which, through the updated cash flow generated, the investment is fully recovered and there is still the possibility of obtaining a cash flow that corresponds to the discount rate. Mathematically, the DPBP is the operating period after which NPV is null. In this case study, the DPBP is 13.62 years in the Stirling CHP case (
Figure 12) and 14.25 years in the ORC CHP case (
Figure 13).
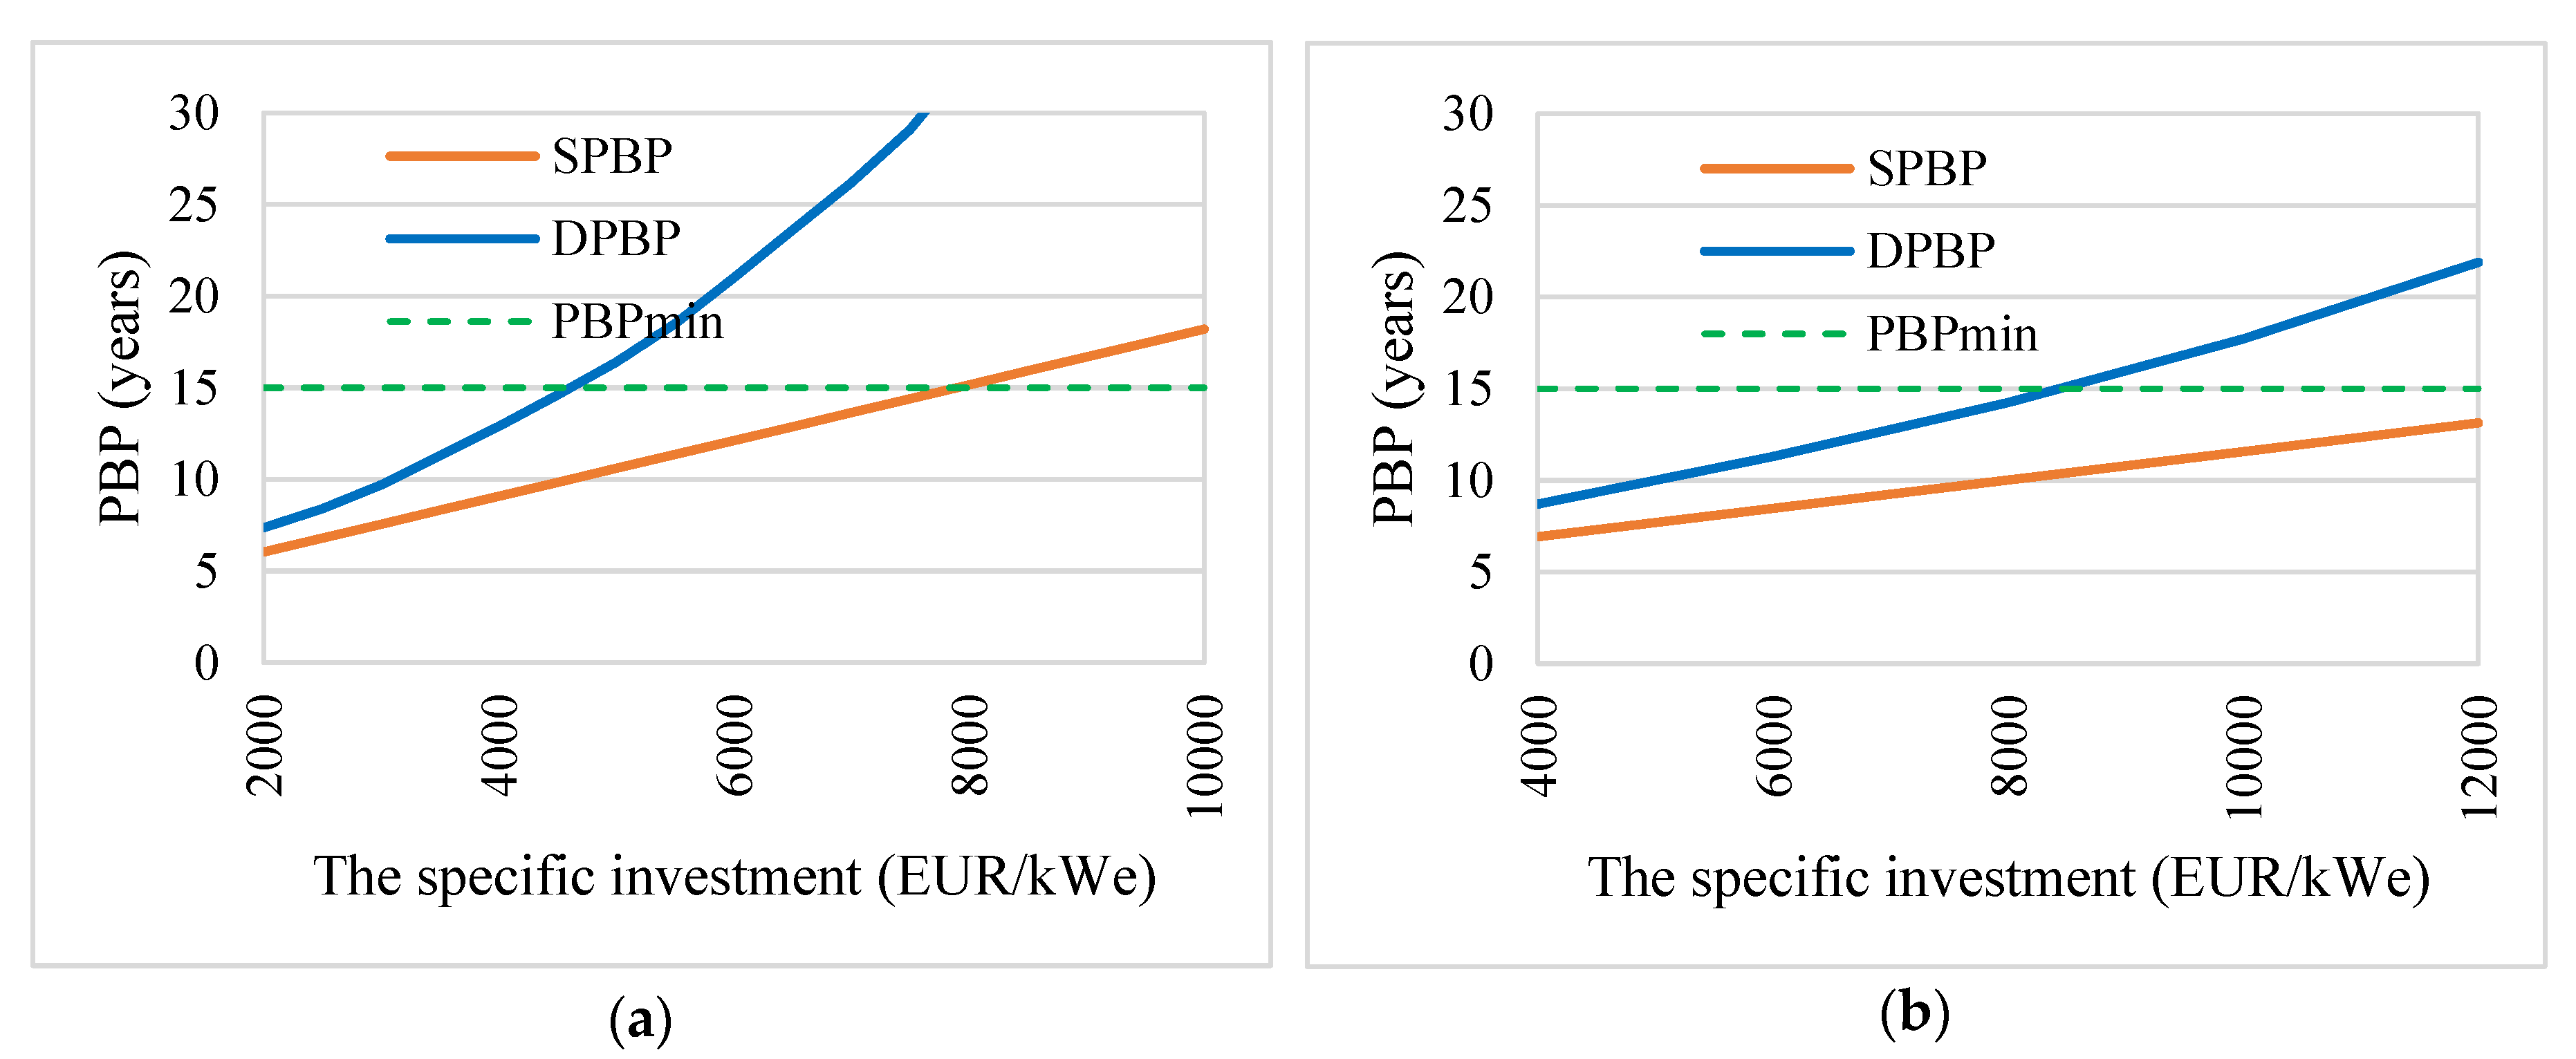
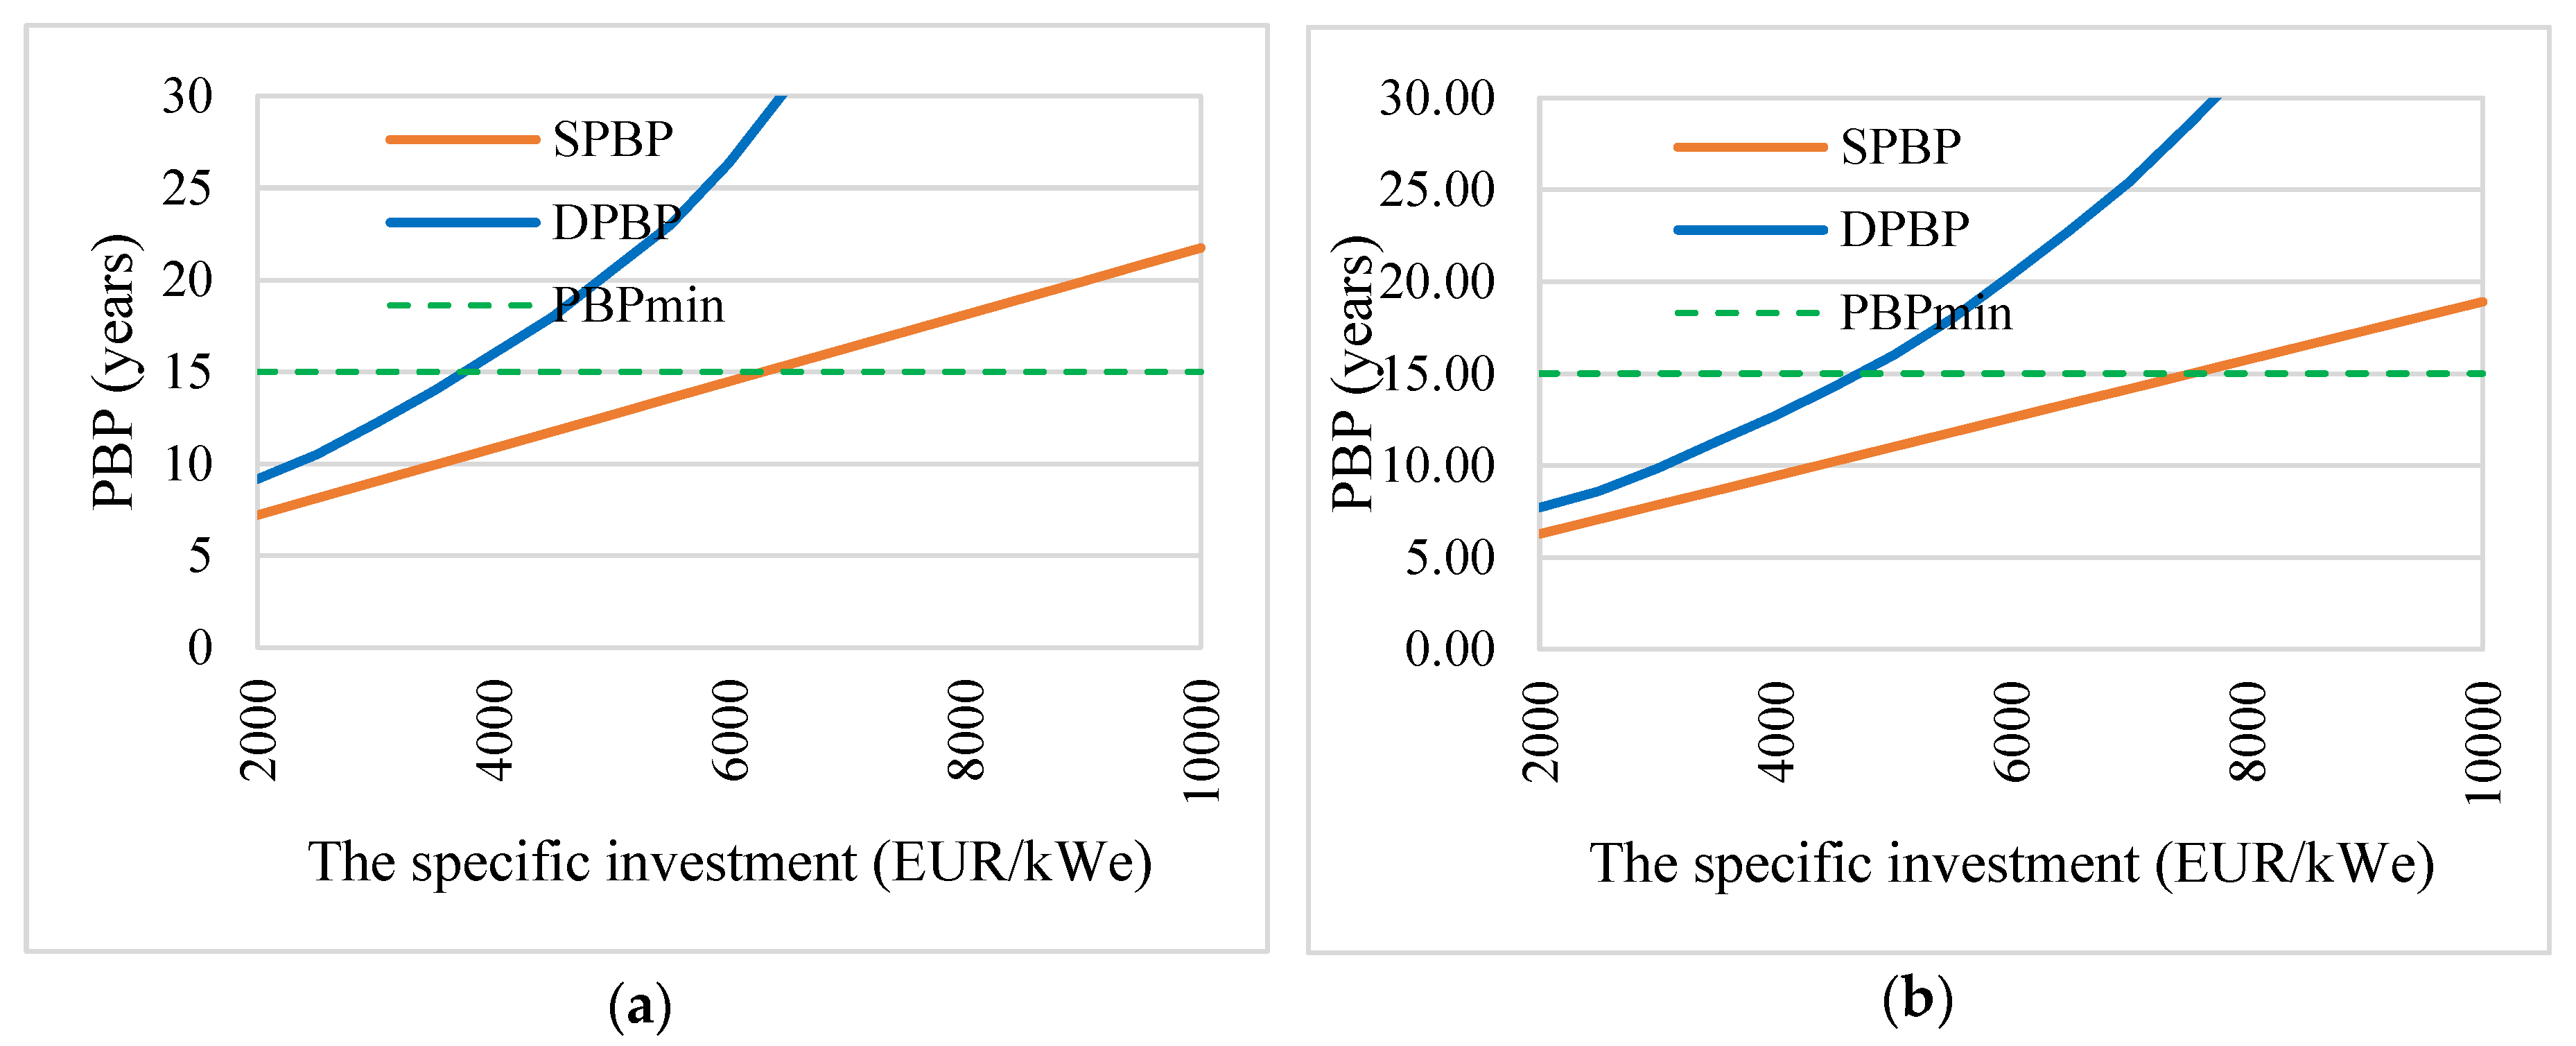
Figure 14 shows the influence of the specific cost of cogeneration technologies on the SPBP and the DPBP.
Figure 15 shows how the price increase of natural gas and electricity affects the DPBP. Increasing the price of natural gas as a result of import dependence has the effect of reducing the profitability of the investment, while increasing the price of electricity has the opposite effect. The profitability of the investment is even greater as the difference between the price of electricity from public network and the price of the fuel used in the micro-CHP plant increases as in the case of biomass.
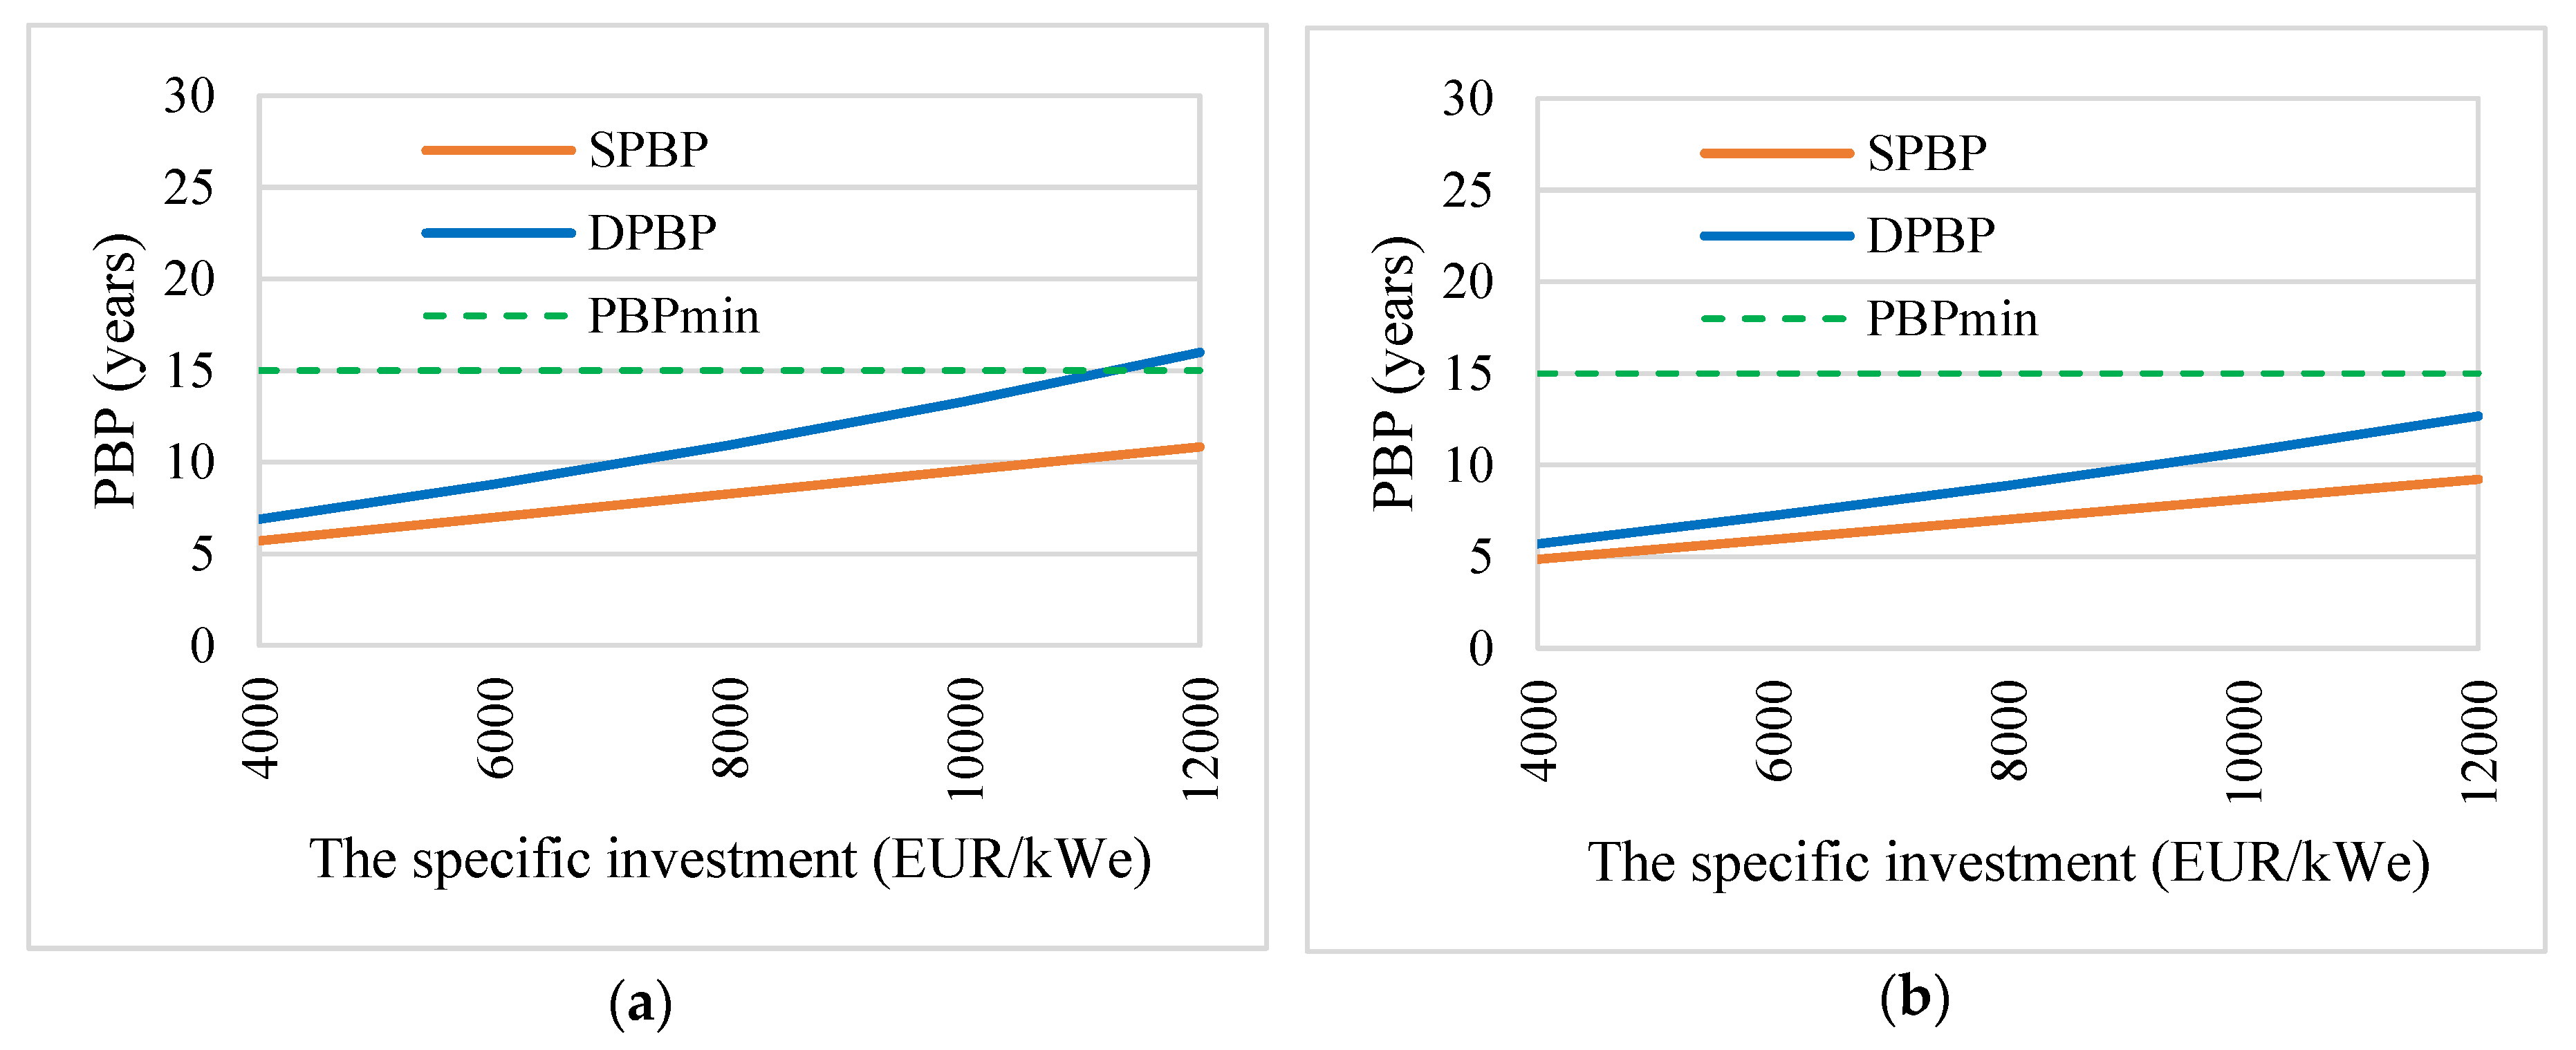
Figure 16 shows the influence of the solar energy share on the payback period in the ORC CHP case. Thus, even under the conditions of a higher specific investment cost, it is possible that the payback period for the micro-CHP will fall below the accepted average value (<15 years) [
43,
46].
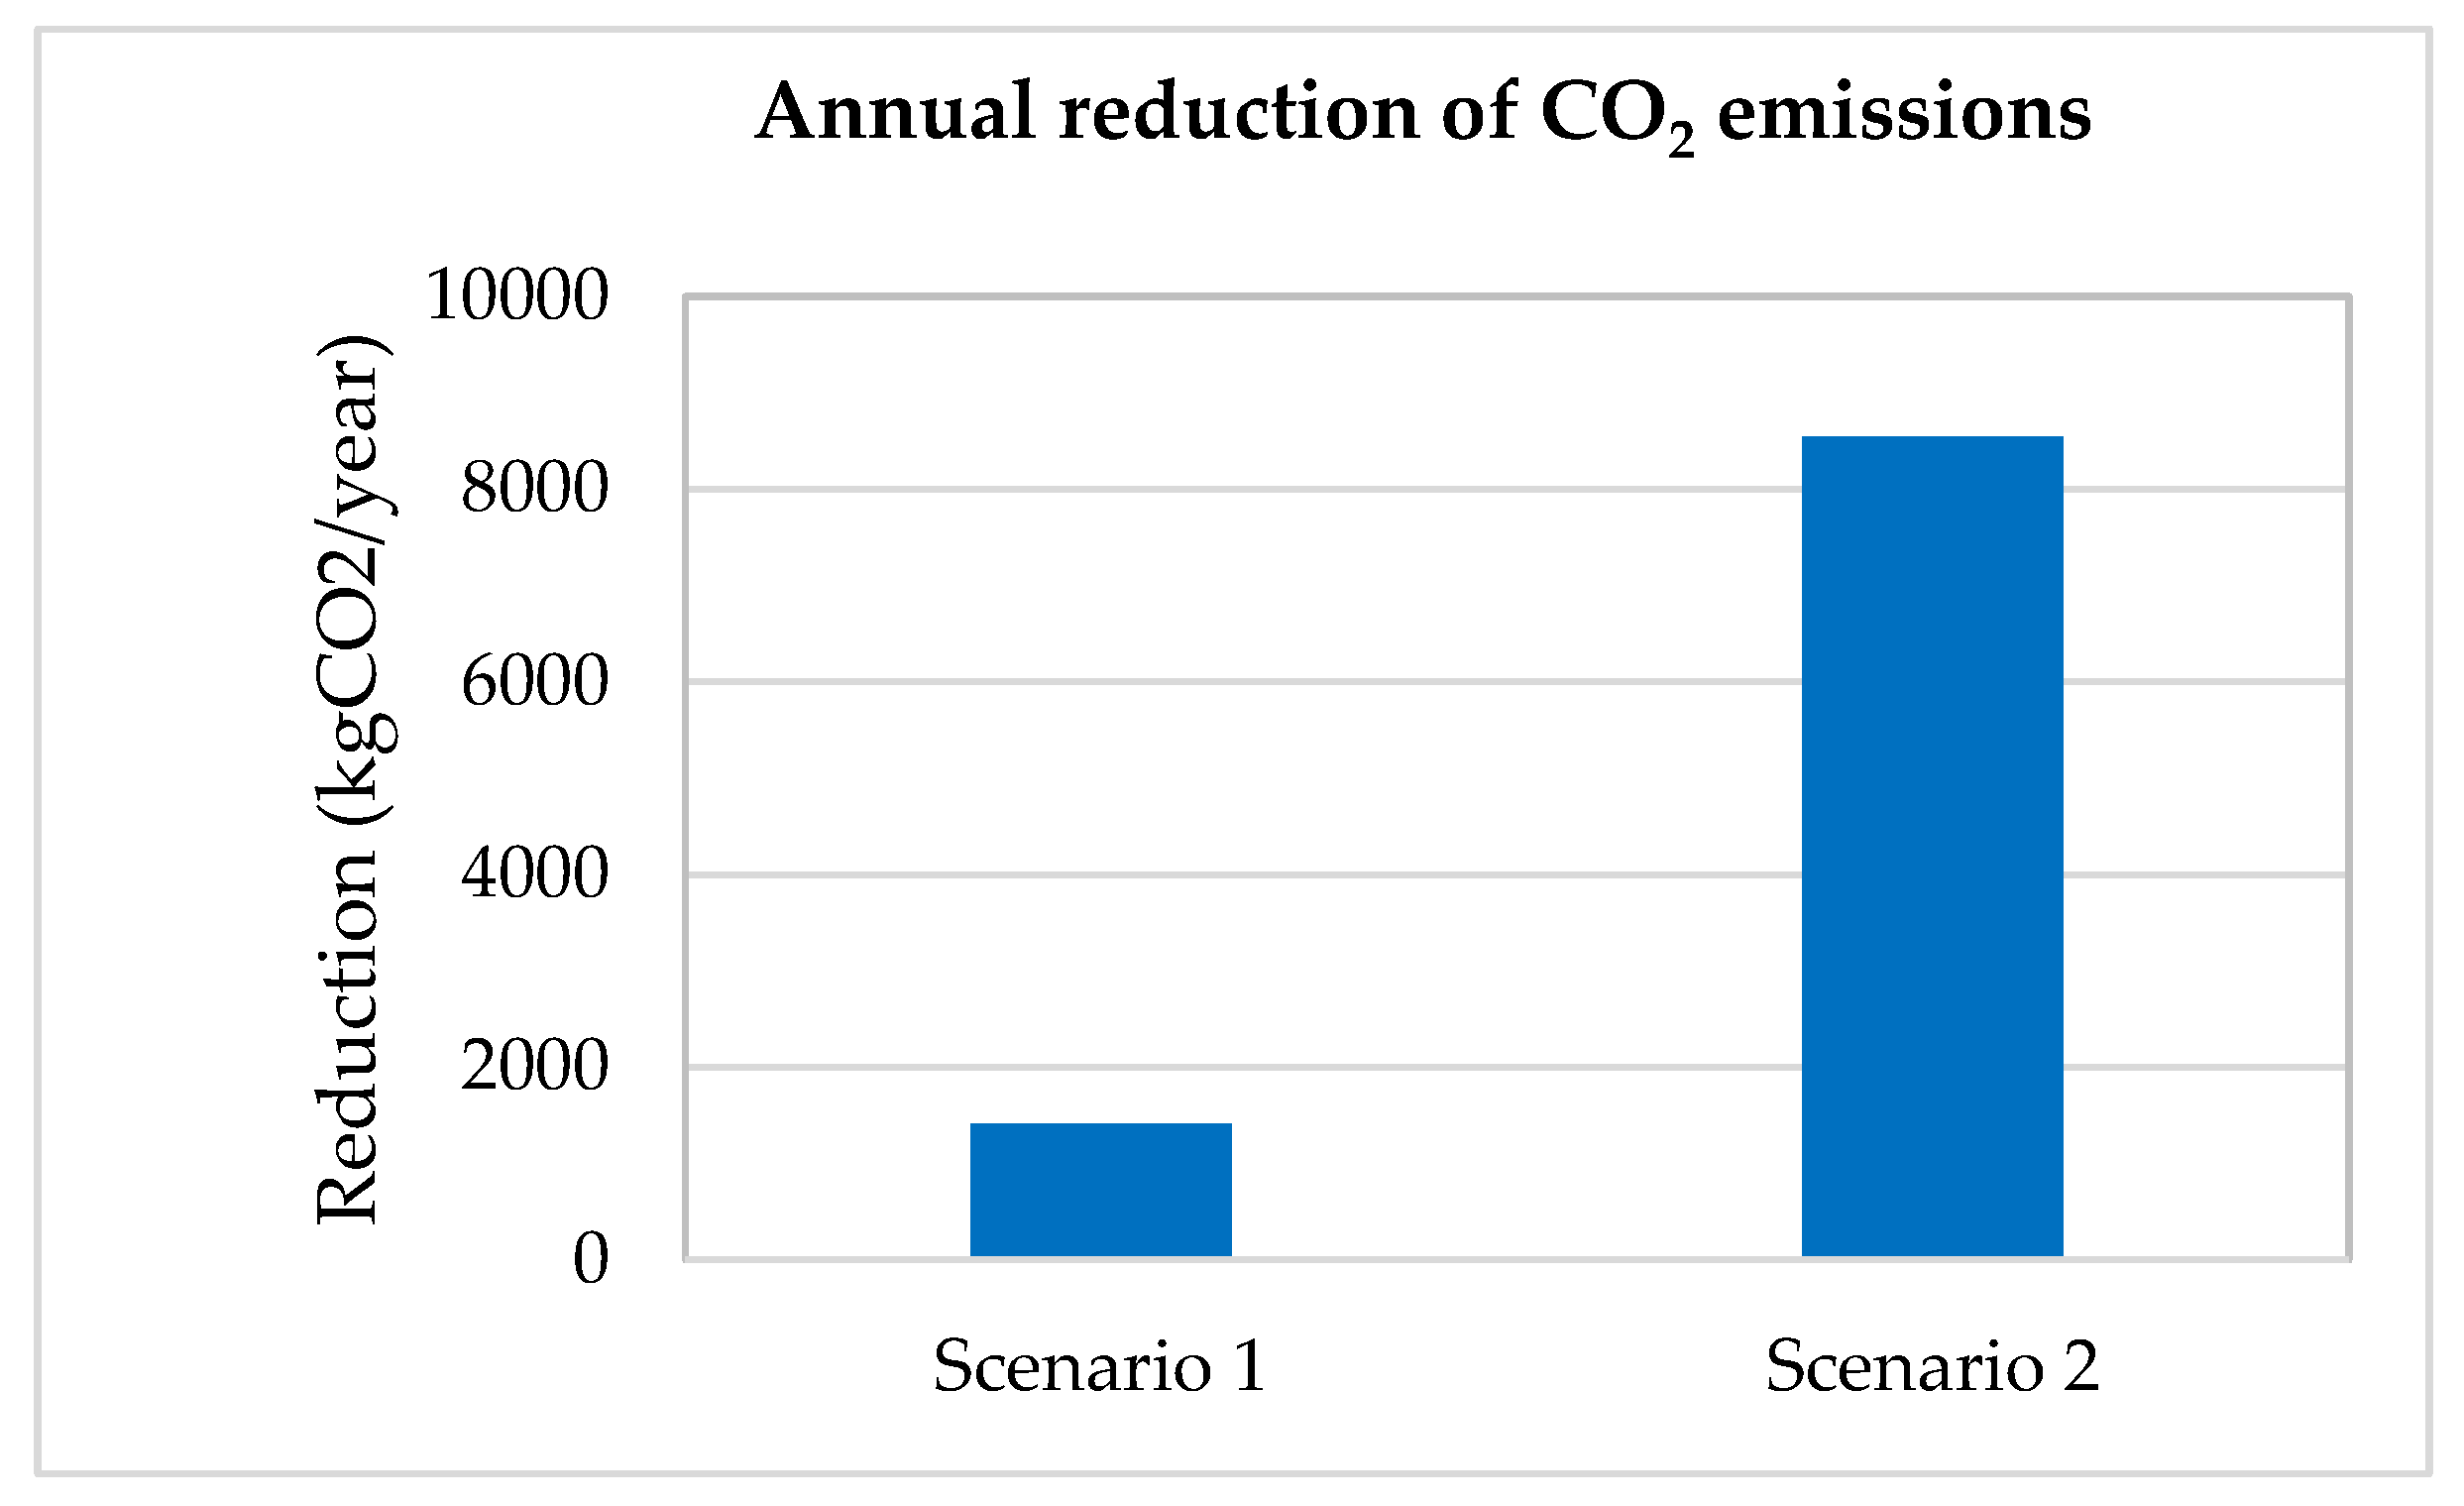
Figure 17 shows the reduction of annual carbon dioxide emissions in both scenarios. Compared to the reference scenario, the annual reduction of CO
2 emissions is 1377 kgCO
2 in Scenario 1 and 8544 kgCO
2 in Scenario 2. Obviously, a higher production of renewable energy sources in Scenario 2 will lead to a greater reduction of CO
2 emissions.
Although it is expected that the sharing of renewable energy will increase in the coming decades, the fossil fuels (especially natural gas) and other alternative fuels (biomass, biofuels, LPG, etc.) will continue to play a major role in the transition to new and renewable energy sources. Therefore, it is desirable to make efficient use of these fuels with the most energy efficient technologies and with the least environmental impact.
The compact dimensions and the combination with established technology allow the generation of heat and electricity in the modernization of the households. The storage tank volume is a key parameter to optimize the system performance. However, this volume could be limited because it can slightly affect the economic performance of the system. Therefore, it is necessary to optimize the operation in hybrid mode of the cogeneration system in order to maximize the renewable energy sources used.
The investment return is maximum if the volumes of electricity and heat generated will be consumed almost entirely within the perimeter of the location where the micro-CHP unit is located. The success of implementing a micro-cogeneration system will be based on how well the system economically meets the thermal and electric loads and priorities of the residential building.
The benefits of the cogeneration of large power systems are well proven. In the case of micro-CHP, the still large specific investment represents a barrier to its expansion. The main objective of this paper was the economic assessment of the micro-CHP units under the current market conditions. The correct choice of the micro-CHP system and its matching with the consumption demands of the building shows the profitability of the micro-CHP without support schemes.
6. Conclusions
In this case study, two micro-cogeneration systems were compared to the reference case: the first case (Scenario 1) with the Stirling engine CHP, and the second case (Scenario 2) with the ORC CHP. The case of reference was an individual household with a gas boiler and electricity from the public network.
The results of this study show that the investment in a micro-cogeneration system can be attractive and economic performances can be obtained without subsidies (without government or local support schemes). The profitability of the micro-cogeneration system is even higher as the power and heat ratio provided better matches the daily profiles of electric, thermal, and cooling loads.
The conditions (limitations) of obtaining the results and future directions of the research were highlighted. The results were obtained when the electricity generated by the CHP unit is consumed almost entirely inside the household. Also, the average monthly temperatures were used for estimating energy consumption for heating and air conditioning. The analysis of the dynamic factors that can influence the energy consumption in the building represents future directions of study.
If environmental benefits are considered, support from government and local authorities can increase the attractiveness for such systems and the primary sources of energy near the place of consumption are more efficiently used.
Therefore, the micro-cogeneration from renewable sources can be one way of achieving the objectives regarding the competitiveness, security, and sustainability of the energy supply of the individual residential consumers.
In addition, a further criterion for sustainable energy is that any biomass harvested to make household fuels should be done so on a renewable basis to ease pressure on forests and other natural ecosystems.
From this point of view, micro-cogeneration offers optimal solutions for both fossil and renewable fuels. Thus, in the case of small households, the share of primary energy from classical sources can be gradually reduced and the share of primary energy from renewable energy sources can be increased to ensure utilities in the building. The implementation of a micro-cogeneration project in residential applications must consider all of the aspects related to the location and the operating strategies to ensure the profitability of such an investment.


