Article

How to Coordinate Economic, Logistics and Ecological Environment? Evidences from 30 Provinces and Cities in China

1
School of Public Administration, Central China Normal University, 152 Luoyu Road, Wuhan 430019, China
2
School of Public Administration, Inner Mongolia University, 235 University West Street, Saihan District, Hohhot 010021, China
*
Author to whom correspondence should be addressed.
Sustainability 2020, 12(3), 1058; https://doi.org/10.3390/su12031058
Submission received: 2 January 2020 / Revised: 29 January 2020 / Accepted: 31 January 2020 / Published: 2 February 2020
(This article belongs to the Special Issue Intelligent Transportation and Green Logistics with Big Data)

Abstract

:
With the rapid development of economy, the scale of the logistics industry is also expanding rapidly, which brings great convenience to economy and trade, and becomes one of the pillar industries of national economy. However, with the development of economy and logistics, the problem of ecological environment is becoming more and more prominent. Through the design of economic development, logistics development, and the ecological environment index system, the economic development, logistics development and eco-environment development level of 30 provinces and cities in China from 2008 to 2017 are analyzed by using the entropy method and coupling coordination degree model, and the spatial characteristics of regional economic development, logistics development, and ecological environment are analyzed by using ArcGIS software. The results show that the coupling coordination of economic development, logistics development and ecological environment in most provinces and cities in China is at the mediate coupling level, and only Shanghai, Anhui, and Fujian in the Eastern region have reached the high-quality coupling level; there are significant temporal and spatial differences in the coupling and coordinated development between economic development, logistics development and ecological environment. The level of coupling coordination in the western region has always been at a low level, while the level of coupling coordination in most of the central and eastern regions is relatively high. There are situations where the level of coupling coordination is not high; the coordinated growth of economic development, logistics development, and ecological environment is mainly driven by economic development and logistics development. However, the level of ecological environment has been lagging behind the level of economic and logistics development. In the future development, it is necessary to give full play to the role of the logistics industry in economic development, weigh the relationship between the development of the logistics industry and ecological environmental protection, actively develop green logistics, and the level of coordinated development among economic development, logistics development and ecological environment.

1. Introduction

China’s GDP reached 82.08 trillion Yuan in 2017, accounting for about 15% of the world economy, ranking second in the world. In 2018, the proportion of added value of the primary, secondary and tertiary industries to GDP was 7.2%, 40.7%, and 52.2% respectively. With the rapid development of China’s economy and the improvement of the economic structure, the logistics industry has also been rapidly developed, which is mainly reflected in the increase of investment in infrastructure construction of logistics industry. The mileage of the newly rebuilt highways in China in 2017 was 6796 kilometers, the mileage of the newly built high-speed railways was 2182 kilometers, and the length of the new optical cable lines was 7.05 million kilometers, building the world’s largest highway network, high-speed rail operation network and mobile broadband network. It can be seen that the development scale of China’s logistics industry has been rapidly expanding. In addition, the total amount of social logistics in China in 2016 was 283.1 trillion Yuan, an increase of 6.4 percent over the same period last year, and the total cost of social logistics was about 13.3 trillion Yuan, an increase of 9.8 percent over the same period last year. Accordingly, as a comprehensive industry, the development of logistics industry integrates many basic industries, such as information industry, warehousing, transportation and so on. Therefore, the development of logistics industry also plays an important role in promoting economic development. For example, the development of the logistics industry provides a large number of employment opportunities. According to the National Bureau of Statistics of China, 6.12 million people were employed in railway, highway, and water transportation industries, and 910,000 were employed in the postal industry. This shows that the logistics industry has become one of the pillar industries of the national economy [1].
Although the logistics industry in China is developing well, however, there are still some problems in the process of its development, mainly reflected in the pollution of ecological environment [2,3,4,5]. Kim and Han [6] and Murphy and Poist [7] argued that greenhouse gas emissions such as carbon dioxide and energy consumption such as fossils in the world are largely caused by the development of logistics system. According to a study of the World Health Organization and the International Energy Agency, Khan, Sharif, Golpîra et al. [8] pointed out that the development of the global logistics industry is heavily dependent on energy, especially fossil fuels, thus causing serious ecological problems. For example, the logistics industry may generate carbon dioxide and other pollutants during transportation, packaging and storage [9]. Zhang, Wang, and Zheng [10] pointed out that the fossil energy consumption and carbon dioxide emissions have a significant impact on the realization of economic sustainable development and energy conservation and emission reduction targets, while China’s carbon dioxide emissions and fossil energy consumption are very large. Song, Wang, Yu et al. [11] and other studies found that the economic loss caused by environmental pollution is about 2% to 3% of GDP every year. According to the Ministry of Environmental Protection in 2016, logistics packaging waste accounts for 40% of urban domestic waste. The “China Express Packaging Waste Production Characteristics and Management Status Research Report” shows that the consumption of various express packaging materials in China increased from 20,600 tons to 94.123 million tons between 2000 and 2018, the amount of carbon emissions generated by express packaging increased from 61.15 million tons to 13.03 million tons between 2010 and 2018. The “China Urban Construction Statistical Yearbook” showed that the amount of incineration of courier package in 2018 was 82.77 million tons, and the processing cost was 415 million Yuan.
The above research shows that the development of logistics industry is negatively related to the sustainable development of economy and environment. Since the reform and opening up these decades, China’s economy has developed rapidly, and environmental problems have become increasingly prominent. Especially in the last 20 years, the logistics industry, which bears the development of China’s economy and industry, has developed rapidly. In 2013, China’s logistics market surpassed the United States for the first time, becoming the world’s first. The total cost of social logistics in China in 2017 was 12.1 trillion Yuan, accounting for 14.6 percent of the gross national product, well above the level of 8–9 percent in developed countries. As of 2017, China’s railway operation mileage, road operation mileage and express delivery are ranked first in the world. China has become a logistics power. Therefore, compared with other countries and regions, the problems between China’s economic development, logistics development and ecological environment are more significant, and the synergy between the three is more important. Therefore, how to promote the development of logistics industry without harming the sustainable development of economy and environment has become a key problem. Compared with traditional logistics, green logistics pays more attention to the protection of ecological environment. Wu and Dunn [12] argued that green logistics is a logistics system responsible for the environment. Previous studies have shown that the relationship between green logistics and ecological environment performance is positively correlated, and the use of renewable energy and green practice can control the environmental pollution caused by logistics operation [13]. According to Ni, Lin, Li et al. [14], the development of green logistics is of great practical significance for the realization of green economic development and for solving the deterioration of ecological environment in the process of economic development in China.
Previous studies have mainly focused on the relationship between economic development and ecological environment, the most famous of which is Environmental Kuznets Curve (EKC). In addition, a considerable number of scholars paid attention to the relationship between economic development and logistics development, as well as between logistics development and ecological environment [15]. However, there are few researches on the relationship among economic development, logistics development and ecological environment from the perspective of coupling coordination. This paper analyzes the relationship among economic development, logistics development, and ecological environment. In order to improve the coupling and coordination level among China’s regional economic development, logistics development and ecological environment, this paper seek ways to ensure the quality of ecological environment while developing economy and logistics. Taking 30 provinces and cities in the four major economic regions of China as samples, the regional economic system, regional logistics system and regional ecological environment system are constructed by collecting the basic data of economic development, logistics development and ecological environment of each province and city. The coupling model between them is established by entropy method, and then the coupling coordination degree is calculated. In addition, this paper mainly focuses on the coupling coordination relationship among economic development, logistics development and ecological environment. In the process of economic development and logistics development, it will have a certain negative impact on the ecological environment, thus restricting the coupling and coordinated development between the three. At the same time, it is precisely because of the improvement of the level of economic development and the level of logistics development, through certain policies and norms we can strengthen the governance of the ecological environment and improve the level of the ecological environment. Therefore, this paper attaches great importance to the ecological environment, which plays an important role in promoting economic development, logistics development and ecological environment. Finally, on the basis of analyzing the coordinated development degree among the three, the corresponding countermeasures and suggestions are put forward.
The content of the second part is a literature review, which is mainly the research and analysis of the relationship among economic development, logistics development and ecological civilization. The content of the third part introduces the research method used in this paper, that is, the coupling coordination measurement model. The fourth part uses the model to measure the comprehensive development index of economic development, logistics development and ecological environment in 30 provinces and cities in China, and analyzes and discusses the coupling coordination level among the three and the coupling coordination development difference between regions. The last part of this paper puts forward the research conclusions and suggestions, and illustrates the shortcomings of this study and the future development direction.

2. Literature Review

2.1. Relationship between Economic Development and Ecological Environment

There are many previous studies on the relationship between economic development and the ecological environment. The EKC curve was proposed in 1950s to analyze the relationship between economic development and environmental pollution. EKC assumed that there is an inverted u-shaped relationship between economic development and ecological environment, that is, in the early stage of economic growth, the environment deteriorates with economic growth; in the later stages of economic growth, reduce environmental degradation with economic development [16]. Regarding the relationship between economic development and the ecological environment, many scholars have verified it and proved that there is an inverted u-shaped curve relationship between economic development and the ecological environment [17,18]. In addition to the EKC curve, many scholars believe that the coupled coordination model has a great advantage in studying the relationship between economic development and ecological environment, and use this model for research and analysis. Liu-Yan Gai-He and Yong-Zhong [19] and others use the coupling coordination model to study the relationship between economic development and ecological environment. Zhao, Wang, and Zhou [20] and others use the coupling coordination model confirms that with the improvement of economic development level, urbanization has a synergistic effect on the ecological environment, and the ecological environment has a restrictive effect on urbanization. Based on CCD model and standard, Zhang, Wang and Wu et al. [21] evaluated the coupling development of ecosystem and economic system in Loessplateau and other large-scale regions, and put forward corresponding countermeasures and suggestions to promote the coordinated development of counties.

2.2. Relationship between Logistics Development and Economic Development

With the development of the logistics industry contributing more and more to the economic growth, the rapid development of economy has also greatly promoted the development of the logistics industry. As the economic development model and growth model have their own characteristics in each stage of development, the previous research results have also changed the view of infrastructure as an engine of economic growth [1]. Yamaguchi [22] proved the mutually reinforcing relationship between logistics infrastructure and economic development. For example, some studies show that the more developed the transportation network and the more complete the infrastructure, the higher the level of logistics industry development in the region, and the more competitive the development of the logistics industry, which can improve the efficiency of economic operations, reduce logistics costs, and increase economic benefits [23]. On the other hand, the rapid economic development also promotes the development of logistics to meet the needs of society for logistics services [24]. In addition, after research, the development of green logistics is closely related to the healthy development of the economy. In the process of the supply chain, green management activities help promoting the healthy development of the economy as a whole [13]. All of the above studies prove that the relationship between infrastructure investment and economic growth is interactive.

2.3. Relationship between Logistics Development and Ecological Environment

From the point of view of research, scholars have not done much research on the relationship between logistics and the ecological environment, there are many research on the relationship between industry and manufacturing and the ecological environment, and comparisons on the relationship between economic development and the ecological environment [25]. However, with the rapid development of the logistics industry, people’s demand for logistics services has rapidly increased. Therefore, the logistics industry involves more and more aspects. All aspects of modern logistics activities will have a positive or negative impact on the ecological environment [26]. In view of this, some scholars have carried out research on the relationship between logistics development and ecological environment. Lu, Xie, Chen et al. [27] combining existing studies between logistics and the environment, it is considered that the ELPI indicators can reflect the trade-off between logistics efficiency and environmental protection. They used sample data from 112 countries to construct an environmental logistics performance indicator (ELPI) to evaluate the overall performance of these sample areas in green transportation and logistics practice. The DEA model is also widely used [28,29], on the basis of the existing research, it is further adopted DEA-RAM model to calculate the relationship between environment and logistics performance. Liu, Yuan, Hafeez, and Yuan collected data on logistics performance and ecological environment in 42 Asian countries and analyzed it with a GMM regression model. The study shows that the carbon dioxide and the quality of logistics infrastructure in the process of logistics transportation cause adverse effects on the ecological environment. Evangelista [30] regards the Third-Party Logistics Service Company as the main body of research, in which it is considered that the growth of logistics service demand provides a development opportunity for the Third-Party Logistics Service Company. Third-Party Logistics Service Companies play a vital role in reducing carbon emissions and improving environmental performance in logistics activities. In the past, the research on the relationship between logistics development and ecological environment has produced many important conclusions, which is useful for future research.
By reviewing the above literature, we can see that most of the existing literature from the perspective of coupling coordination is the coordination mechanism between them, and there is less research and analysis on the coordination relationship among economic development, logistics development and ecological environment. However, these studies mainly focus on measuring the relationship between two of them separately, and the research that puts these three aspects together to analyze is scarce. In the research, Mačiulis, Vasiliauskas, and Jakubauskas [31] analyzed the impact of transportation service industry on economic development and ecological environment according to the evaluation index of transportation service level, and thought that the improvement of transportation system can promote economic development and improve the ecological environment level; Aljohani and Thompson [32] classified the impact of logistics development, and analyzed the development of logistics in several cities in Europe and the United States, and concluded that the expansion of logistics industry impacted on the urban environment and economic development. This shows that economic development, logistics development, and ecological environment are not isolated, so it is an important problem for our country to deal with the relationship between development and eco-environment and realize the sustainable development of economy and eco-environment. This paper uses the coupling coordination model to study and analyze the relationship among economic development, logistics development, and ecological environment, which plays an extended and supplementary role in the existing related research. At the same time, through the analysis of the coordination degree of the economic development, the logistics development and the ecological environment of the four economic regions in China, it is possible to find the possible causes of the insufficient coordination, and to promote the coordinated development among the three, thus promoting the high-quality development of the economy.

3. Design of Research Methods

3.1. Coordinate Coupling Measurement

The concept of coupling derives from physics and describes the interaction and degree of interaction between two or more related systems [33]. The coupled coordination model can be used for research in multiple fields. Tang [34] established the coupling coordination model between tourism industry and ecological environment in Heilongjiang province. The results show that economic benefit and ecological environment quality have important influence on coupling coordination system. Taking Wuhan as an example, Xing, Xue and Hu [35] established a coupling model between economic, resource and environmental subsystems, and evaluated the importance of its coordination level for sustainable urban development. He, Wang, Liu, et al. [36] use the coupled coordination model to analyze the relationship between urbanization development and ecological environment in China. It can be seen that the coupling model also has some advantages in analyzing the relationship between economic development, logistics development and ecological environment.
In order to reflect the development level and coordination effect of regional economic development, logistics development and ecological environment as a whole, and to effectively measure the level of coordinated development among economic development, logistics development and ecological environment. This paper collects the relevant data of economic development, logistics development and ecological environment in 30 provinces and cities in China. Then the coupling definition and coefficient model in physics are used to measure the economic development, logistics development and ecological environment coupling co-scheduling.
First of all, in order to reduce the differences caused by the different units of measurement of different indicators, the raw data is standardized. Because different index to the coupling coordination degree influence is different, the index can be divided into positive indicators y i j + and negative indicators y i j .
y i j + = x i j min { x 1 j , x 2 j , , x n j } max { x 1 j , x 2 j , , x n j } min { x 1 j , x 2 j , , x n j }
y i j = max { x 1 j , x 2 j , , x n j } x i j max { x 1 j , x 2 j , , x n j } min { x 1 j , x 2 j , , x n j }
Among them, x i j is represents the means of indicator j in region i. min ( x i j ) and max ( x i j ) represent the maximum and minimum values in the sample data respectively.
Secondly, the index weights w j are calculated by entropy method [37]. At the same time, to avoid meaninglessness, it is stipulated that:
p i j = ( 1 + y i j ) / i = 1 n ( 1 + y i j )
The entropy of the index is calculated as formula:
e j = [ 1 / ln ( n ) ] × i = 1 n p i j × l n p i j        
The redundancy of information entropy is further calculated by d j = 1 e k j , and then the weight of the index is calculated by w j = d j / j = 1 m d j .
Thirdly, the standardized data of each description index is multiplied by the corresponding weight value, and the comprehensive development level U of economic development, logistics development and ecological environment is calculated, as formula:
U = i = 1 , j = 1 n , m w i j × y i j + ( o r   y i j )
Because economic development, logistics development, and ecological environment involve three systems, it covers two types of coupling of binary system and ternary system. There have been studies on binary and Ternary coupling models [33,38], here’s how it works:
First, calculate the coupling correlation between the two systems:
C = ( U 1 × U 2 ) / [ ( U 1 + U 2 ) / 2 ] 2
where C represents the degree of coupling between the two systems in the region, then 0   C 1 , and U 1 and U 2 denote the overall index of system development. Further calculate the coupling coordination degree between the two systems by formula:
T = α U 1 + β U 2
D = C × T
Among them, T represents the comprehensive development level of each system, and D represents the degree of coupling and coordination between the two systems. α and β are weights of the two systems, and satisfy α + β = 1. In the process of coupling and coordinating economic development, logistics development, and ecological environment systems, this article considers them to be equally important, so we choose the equal weight, as: α = β = 0.5.
Second, the coupling coordination degree of the three systems is calculated as follows:
Step one,
c = 3 ( U 1 U 2 + U 1 U 3 + U 2 U 3 ) / ( U 1 + U 2 + U 3 ) 2
Step two,
t = δ U 1 + ε U 2 + ϑ U 3
d = c × t
In the formula, c indicates the degree of coupling and correlation among the three systems, t indicates the comprehensive development level of the three systems, and d indicates the degree of coupling coordination among the three systems, δ, ε, and ϑ are weights, indicating the importance of the three systems. In this article, they are all taken 1/3.
In order to clearly reflect the coordination state between UD, UL and UE, the coupling of these three systems is classified into the following levels as shown in Table 1.

3.2. Variable Selection and Research Scope Definition

Considering the systematicness, integrity, scientificity, and data availability of the index system, combined with the research results of related researchers [39], in this paper, an index system (as shown in Table 2) including economic development, logistics development and ecological environment is established. Lan, Yang and Huang [40] believe that economic development indicators include GDP, total retail sales of consumer goods, added value of the tertiary industry, investment in fixed assets, and per capita disposable income of urban and rural residents. According to Rennings and Wiggering [41], eco-environmental sustainability indicators include a renewable resource base, waste emissions and energy consumption. Wang, Ma and Zhao [42] evaluated the ecological environment system in four dimensions, including 15 basic indicators such as industrial discharge wastewater, sulfur dioxide discharge, municipal sewage treatment rate, industrial solid waste treatment rate, regional vegetation coverage, and total water resources. Lan, Yang and Huang [40] believe that logistics development indicators include the number of logistics practitioners, logistics industry fixed assets investment, total postal output, freight turnover, road mileage, freight line length and other six aspects. The evaluation index of logistics industry is divided into five aspects: fixed assets investment, road operation length, railway operation length, goods turnover, total output of transportation industry and warehousing industry [1]. According to the index evaluation system established by some scholars in the relevant fields, this paper revises the index evaluation system established by the existing research according to the actual situation of the research, so as to establish the index evaluation system of economic development, logistics development and ecological environment. In order to evaluate the comprehensive level of economic development, this paper constructs the index system of evaluating the comprehensive level of economic development from three aspects, which includes economic development scale, economic development structure and economic development efficiency, select 10 indicators. The comprehensive level of logistics development is measured and evaluated through three aspects: social benefit of logistics development, logistics development foundation and logistics operation ability, including eight indexes in total. The comprehensive evaluation index system of eco-environment includes three aspects: the generation of environmental pollution, the control of environmental pollution and the foundation of natural environment, select 10 indicators.
(1) Comprehensive evaluation index system for economic development
Economic development includes not only the expansion of economic scale, but also the structure and benefit of economic development. First is the scale of economic development, this article adopts GDP, industrial production, fixed assets investment and fiscal revenue to reflect the scale of economic development. In the process of economic development, GDP can reflect the overall level of economic development, and the increase of industrial gross product and fixed asset investment is conducive to promoting economic growth, the increase of financial revenue can increase the government’s support for economic development. Secondly, using three indicators, namely, the ratio of secondary sector of the economy value added to GDP, the ratio of tertiary sector of the economy value added to GDP, and the retail sales of consumer goods per capita, to reflect the structure of economic development and to raise the ratio of secondary sector of the economy value added and tertiary sector of the economy value added to GDP, to improve the structure of economic development. Compared with the primary industry and the secondary industry, the development of the tertiary industry has little adverse impact on the ecological environment. Therefore, in the process of promoting economic development and improving the structure of economic development, the development of the tertiary industry is particularly important. Third, to use per capita GDP, income gap, and urbanization rate to reflect economic development benefits, the per capita GDP reflects the quality of economic development, the reduction of income gap and the increase of urbanization rate, which can narrow the social gap and contribute to social stability, thus providing a stable development environment for economic development.
(2) Comprehensive evaluation index system for logistics development
Based on the availability of data, the index system includes three aspects. First, logistics development social benefits. The overall level of logistics industry development can be reflected by the total amount of social logistics and logistics practitioners. In practice, the economic benefit of logistics industry is mainly composed of the development of transportation, warehousing and postal industry, so the increase of added value of transportation, warehousing and postal industry is beneficial to the development of logistics industry. Second, logistics development foundation. The increase of fixed assets investment in transportation, warehousing and postal services can improve the infrastructure of logistics and promote the development of logistics. At the same time, the development of the logistics industry is greatly affected by the transport capacity. Therefore, highway transport density and railway transport density can reflect the infrastructure level of logistics industry to a certain extent. In addition, highway and railway traffic density also have potential impact on the ecological environment. Studies such as Khan, Dong, Wei, et al. [43] found that air pollutants emitted by road and rail transport can damage the ecological environment, so improving road and rail transport capacity can reduce transport emissions, it’s good for the ecological environment. Third, the development of logistics operation capacity. The volume of goods turnover and transport can directly reflect the operational capacity of logistics. The greater the volume of goods turnover, the faster the speed of logistics distribution, the more times the goods turnover, and the larger the cargo transportation volume, the stronger the logistics industry is.
(3) Comprehensive evaluation index system for ecological environment
The index system mainly includes three aspects. First, environmental pollution occurs. Combined with the practice of economic development and logistics development, environmental pollution is mainly reflected in the discharge of wastewater and sulfur dioxide, because the use of means of transportation in the logistics industry, will bring a large number of wastewater and sulfur dioxide emissions, damage the ecological environment. Second, environmental pollution control. For the treatment of environmental pollution, mainly led by the government, through the increase of financial support for the treatment of environmental pollution, to solve the problem of environmental pollution caused by the development of the economy and logistics industry. Among them, the government has invested heavily in forestry fixed assets, industrial waste gas treatment, industrial wastewater treatment and industrial solid waste treatment, it can reflect the government’s attention to environmental pollution control. Third, the foundation of the natural environment. Wetland areas, nature reserve areas, total groundwater resources, forest coverage, are the basic indicators to reflect the level of ecological environment. It is beneficial to improve the level of natural environment by increasing the area of wetland, nature reserve, forest coverage, and reducing the consumption of water resources by improving the utilization rate of water resources.
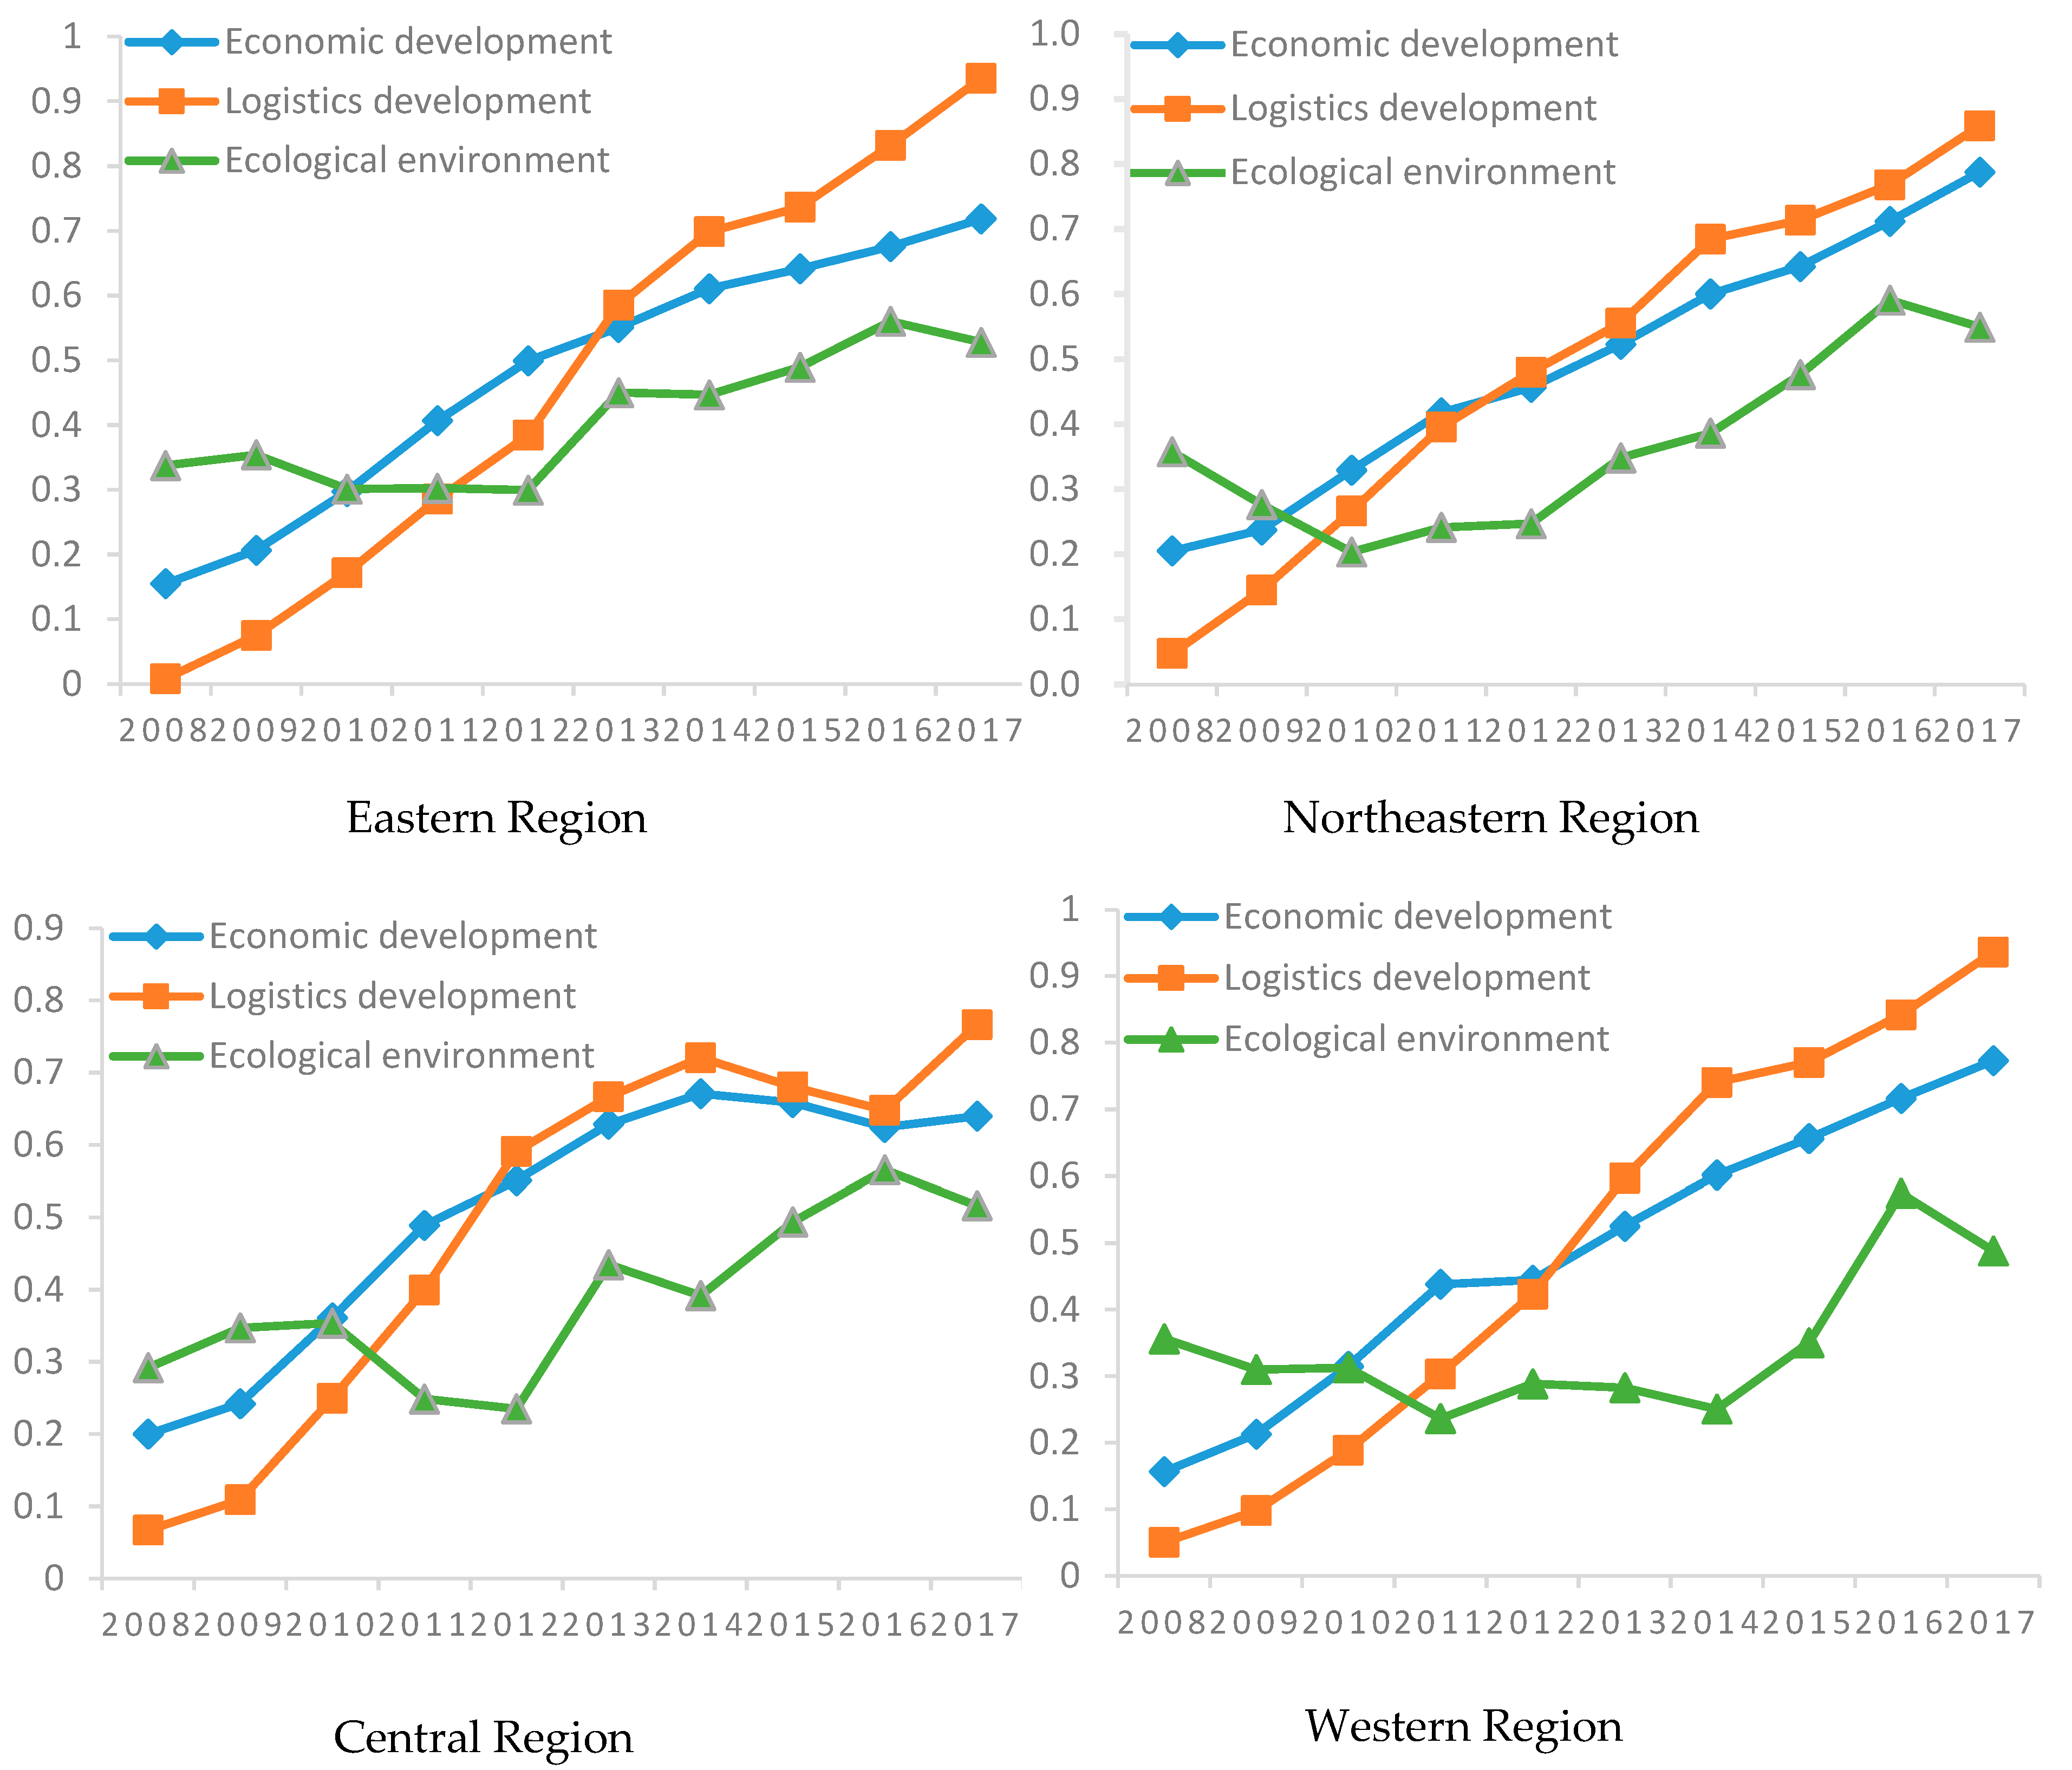
In order to reflect the social and economic development of different regions in China in a scientific way, according to the “Opinions of the Central Committee of the Communist Party of China and the State Council on Promoting the Rise of the Central Region” and “Implementation Opinions of the State Council on the Implementation of Certain Policies and Measures for the Development of the Western Region,” China divides economic regions into four regions: east, central, west, and northeast. The eastern region includes 10 provinces and cities including Beijing, Tianjin, Hebei, Shanghai, Jiangsu, Zhejiang, Fujian, Shandong, Guangdong, and Hainan. The central region includes six provinces and cities including Shanxi, Anhui, Jiangxi, Henan, Hubei and Hunan. The western region includes 11 provinces and cities including Inner Mongolia, Guangxi Zhuang Autonomous Region, Chongqing Municipality, Sichuan Province, Guizhou Province, Yunnan Province, Tibet province, Shaanxi Province, Gansu Province, Qinghai Province, Ningxia Hui Autonomous Region province, Xinjiang, etc. The northeast region includes Liaoning Province, Jilin Province, Heilongjiang, and three other provinces and cities, a total of 31 provinces and cities. Due to the lack of Tibet indicators, data are not available, so the sample for statistical analysis does not include Tibet. Therefore, this study includes panel data of 30 provinces and cities in China’s four major economic regions from 2008 to 2017. All the data are derived from China Statistical Yearbook 2008–2017, China Industrial Statistical Yearbook 2008–2017, China Environmental Statistical Yearbook 2008–2017, China Traffic Statistical Yearbook 2008–2017, China Logistics Statistical Yearbook 2008–2017 and the Statistical Bulletin of National Economic and social development in various regions. Among them, the data involved in the comprehensive economic development rating index system are mainly derived from the China Statistical Yearbook (2008–2017), the China Industrial Statistics Yearbook (2008–2017) and the statistical bulletin of national economic and social development in various regions. The data involved in the comprehensive evaluation index system of logistics development are mainly derived from the China Industrial Statistics Yearbook (2008–2017), the China Logistics Statistics Yearbook (2008–2017), the China Traffic Statistics Yearbook (2008–2017) and the regional national economic and social development statistics bulletin. The data involved in the comprehensive evaluation index system for the development of the ecological environment are mainly derived from the China Statistical Yearbook (2008–2017), the China Industrial Statistics Yearbook (2008–2017), the China Environmental Statistics Yearbook (2008–2017) and the national economic and social development statistics bulletin of various regions.

4. Overall Evaluation and Coupling Coordination Evaluation of Sample Areas

4.1. Regional Economic Development, Logistics Development, and Overall Evaluation of the Ecological Environment

This article uses the panel data of the economy, logistics and ecological environment of 30 provinces and cities in China from 2008 to 2017. According to formula (5), the total and development level of China’s economic development, logistics development and ecological environment can be calculated. For results see Table 3, Table 4 and Table 5.
From Table 3, Table 4 and Table 5 it can be found that the overall development level of economy, logistics, and ecological environment of 30 provinces and cities in China from 2008 to 2017 shows an obvious upward trend.
Through Formula (5), we calculate the comprehensive development level of regional economic development, logistics development and ecological environment in China in Table 3, Table 4 and Table 5. In addition, the calculated results are shown in Table 3, Table 4 and Table 5 and Figure 1. It can be more intuitively observed from Figure 1 that the development and change of economic development, logistics development, and ecological environment in different regions of the east, northeast, central, and west.
Figure 1 shows the trends of the four economic regions in eastern, northeast, central and western China during the decade respectively, which mainly include the trend of comprehensive development level in three aspects of economic development, logistics development and ecological environment. First of all, according to the time series, the indexes of economic development system, logistics development system and eco environment system in the four major economic regions from 2008 to 2017 are all rising in fluctuation. Among them, the fluctuation of economic development and logistics development is small, and the fluctuation of eco environment development level is obvious. This shows that with the development of economy and logistics, it will destroy the ecological environment. However, when the economic level develops to a certain extent, measures will be taken to control environmental pollution. Therefore, the comprehensive development level of ecological environment shows a fluctuating trend of first decreasing and then rising.
Second, from the perspective of regional differences, the fluctuation of eastern and western regions is relatively small and generally presents a relatively stable upward trend. The reason for this is that due to its superior geographical position, the economic development level of the Eastern Region is higher than that of the other three regions, and the industrial structure of the Eastern Region is better than that of the central and northeast regions. Therefore, in the process of economic and logistics development, first of all, the impact on the ecological environment is smaller, and second, there is a stronger economic strength to control environmental pollution. Then, the western region is mainly due to the overall level of economic development is not high, and its secondary sector of the economy development lags behind the central and northeastern regions, so the impact on the ecological environment development is less. However, in the central region and the northeast region, heavy industry is the main industry in the process of economic development, and there are a lot of waste gas pollutants in the industrial production, so the rapid economic development will bring about serious ecological environment destruction. With the introduction of the national 12th Five-Year Plan, especially after the implementation of the 12th Five-Year Plan after 2011, the emphasis has been placed on green development, a resource-saving and environmentally friendly society has been proposed, and the strategy of rejuvenating the country through science and education and strengthening the country through human resources has been implemented, after 2015, the comprehensive development level of ecological environment in central and northeastern China has been greatly improved.
Third, it is obvious from Figure 1 that China’s logistics industry is developing very fast. After 2012, the logistics development level of the eastern, northeastern and central regions is higher than the economic development level. The western region is relatively remote and the logistics industry is developing at a slower pace. However, it also surpassed the comprehensive economic development level after 2013. This shows that the economic development can provide perfect infrastructure services for the development of logistics industry and expand the market of logistics industry, and the rapid development of logistics industry can also drive economic growth. The results of the [44] group experiment also confirm the two-way link between socioeconomic factors and logistics development, which are mutually reinforcing.
Finally, from Figure 1, it can be found that the level and speed of development among China’s economic development, logistics development and ecological environment are quite different, and there is no good cooperative development model among the three. Although after 2010, economic development, logistics development, and ecological environment show a positive correlation among the three, began to enter the state of mutual promotion, coordinated development. However, with the development of economy and logistics, the ecological environment is still negative, and the comprehensive level of ecological environment development is lower than that of economy and logistics. Therefore, this article next analyzes the coupling and coordinated development among economic development, logistics development and ecological environment.

4.2. Coupling Coordination Evaluation of Sample Area

4.2.1. Overall Evaluation of Coupling Coordination in Sample Area

Based on the coupling coordination model and panel data of 30 provinces and cities in China from 2008 to 2017, the coupling coordination among the three systems of economic development, logistics development and ecosystem can be calculated according to the above formula, the results are shown in Table 6 and Figure 2.
From Figure 2 it can be seen that the coupling degree of economic development, logistics development, and eco-environmental system of 30 provinces and cities in China’s four major economic regions has been on the rise in the decade from 2008 to 2017. Among them, the average level of logistics development and economic development grows rapidly, and the speed is far higher than the average level of coupling coordination and ecological environment. In addition, it can be seen that the development of the logistics industry will have a great impact on the ecological environment. In 2014 and 2017, when the logistics industry is developing rapidly, the ecological environment level has declined to a certain extent. In 2014 and 2015, the economic development and the logistics development speed slowed down, then, in 2016 the ecology environment system’s average level suddenly increased the phenomenon. This trend shows that economic development and logistics development are mutually coordinated and promoted, but in the process of economic development and logistics development, they have a certain impact on the ecological environment, the average development level of the ecological environment is slow and fluctuates greatly, which is also related to the National Economic Development Policy.

4.2.2. The Temporal Trend of Coupling Coordination in the Sample Area

After the coupling coordination degree of the sample area is calculated by the coupling coordination model, the time change trend of the coupling coordination degree in the sample area is further analyzed. Combining the results of the coupling model, the coupling coordination degree can be divided into six grades. Table 7 shows the coupling coordination degree in 2008, 2011, 2014, and 2017, Figure 3 provides a more direct view of the trend of coupling coordination from 2008, 2011, 2014 to 2017.
According to Table 1, the level of coupling coordination is divided. First, from Figure 2 it can be seen that after 2013, the coupling degree of economic development, logistics development and eco-environmental system of China’s four major economic zones began to exceed 0.5, only the coupling state between the two systems can reach the primary coordinated V3 state. In 2008, the coupling coordination degree was below 0.2, which was in the state of highly maladjusted V6. The degree of coupling coordination between 2009 and 2011 is below 0.4, which belongs to the state of moderate imbalance (V5). After 2012, the coupling coordination degree was above 0.4, the coupling coordination degree has been between 0.6 and 0.8 since 2015, and most regions have entered the intermediate coordination stage (V2), and the coordination levels in Shanghai, Fujian, and Anhui have reached the level of high-quality association (V1). Therefore, the level of coupling and coordination between China’s economic development, logistics development and ecological environment is steadily increasing.

4.2.3. Spatial Characteristics of Coupling Coordination Degree in Sample Region

This paper uses ArcGIS software to draw the spatial distribution characteristics of the coupling coordination among China’s regional economic development, logistics development and ecological environment. This paper maps the distribution of coupling coordination in years of 2008, 2011, 2014, and 2017. The results are shown in Figure 4.
On the whole, the coupling coordination level among China’s inter-regional economic development, logistics development, and ecological environment is gradually increasing, but there are still some differences in the coordination level between regions. The main characteristics are as follows. First, the high-quality coordination (V1) region is mainly concentrated in the eastern region, and the coordination level in other regions is low. Shanghai, as a large city in China, has reached the quality coupling coordination level in 2107. Fujian and Anhui are also rich in economic development and logistics development resources because they are located in the east, and they also reach the high quality coupling coordination level in 2017. Second, the area of the intermediate coordination (V2) level is the largest, mainly concentrated in the central region and the western region. In 2017, most regions of the country have reached the level of intermediate coordination. Third, primary coordination (V3) regions are mainly distributed in provinces and cities with low levels of economic development in the central and western regions, such as Henan, Hunan, Shaanxi, and Shanxi. In addition, there has been a significant decrease in the overall primary coordination area. Fourth, intermediate incoordination (V5) and extreme incoordination (V6) mainly exist in the central and western regions at the initial stage. With the passage of time and economic development, they have developed into primary and intermediate coordination levels.

5. Conclusions and Discussion

This paper constructs the coupling coordination model of economic development, logistics development and ecological environment among the four major economic regions of China through coupling theory, and calculates the economic development index, logistics development index and ecological environment comprehensive index of 30 provinces and cities in China. The spatial and temporal distribution and changing trend of coupling co-scheduling are analyzed and studied. The results show that: first, from 2008 to 2017, China’s economic development, logistics development and the overall development level of the ecological environment show an increasing trend, there is a significant positive correlation between the development of the three. However, there are differences in the development among regions. The trend of development in the eastern region is relatively smooth, while the trend of development in the northeast region shows obvious fluctuation. Second, from 2008 to 2017, the coupling coordination degree among the economic development, logistics development and ecological environment of the four regions in China has been on the rise, by 2017, the coupling coordination levels of 30 provinces in the four regions had reached the intermediate coordination stage, the overall level of development between regions is small. The coupling coordination degree of Shanghai, Fujian, and Anhui has reached the level of high-quality coordination. However, the coupling coordination level of some eastern regions is even lower than that of the central and western regions, which indicates that economic development and logistics development have negative effects on the ecological environment. Third, the coupling and coordination relationship among economic development, logistics development and ecological environment is becoming more and more close, and the interaction relationship is gradually converging. Before 2011, the coordinated development of the three is mainly supported by the coordinated development of economy and ecological environment, and between 2011 and 2017, the coordinated development of the three is mainly supported by the coordinated development of economy and logistics. Compared with the previous coordination relationship between the two systems, the coordination relationship among economic development, logistics development and ecological environment is being strengthened. It can be seen from the article that the development trend of logistics industry and economic level is the same, both of them are upward trend. And the development trend of ecological environment level fluctuates greatly. This is because the development of logistics industry and economic development are coordinated and promoted. In addition, logistics development and economic development have a significant impact on the ecological environment. On the one hand, the development of logistics industry has a negative impact on the ecological environment and inhibits the sustainable development of the ecological environment. On the other hand, because the development of logistics has promoted economic development, the improvement of economic level has strengthened the ability of controlling environmental pollution in various regions, thus improving the quality of ecological environment. Therefore, the different levels of logistics development and economic development will have a great impact on the level of ecological environment development. It can also be seen from the article that the coupling coordination degree between economic development, logistics development and ecological environment in eastern China is good, and the overall coupling coordination level in central and western regions is low. The reason is mainly due to the implementation of the policy of reform and opening up in 1978 and the geographical advantages of the coastal areas, the economic development level of the coastal areas in eastern China is higher than that of the central and western regions. Because of the high level of economic development, the transportation infrastructure for the development of logistics industry in the eastern region is perfect, and the ability to control environmental pollution is also high, so the economic development, logistics development and ecological environment coupling coordination level in the eastern region are high. However, the Western Development Strategy began in 2000, and the Central Rising Strategy began in 2006. The infrastructure construction in the region is poor, and the negative impact of transportation facilities on the environment is large. In addition, relative to the eastern region, the geographical location and natural environment of the central and western regions are poor. Therefore, the level of economic development, logistics development and ecological environment in the central and western regions is generally lower than that in the eastern region, and there are obvious differences in the coupling and coordination level of economic development, logistics development, and ecological environment development in the eastern, central, and western regions. This study shows that government policy plays a very important role in promoting economic development and sustainable development of the ecological environment. The government can improve the level of coordinated development among the three systems of economic development, logistics development and ecological environment in China by formulating policies to promote economic development and logistics industry development while emphasizing the importance of sustainable development of ecological environment.
The main contributions of this paper are as follows: first, this paper calculates the comprehensive development level of the three systems of economic development, logistics development and ecological environment of 30 provinces and cities in four economic regions of China. Secondly, the paper analyzes the synergy among economic development, logistics development and ecological environment, which makes up the deficiency of the pairwise collaboration in the previous research. At the same time, based on the coupling coordination model and ArcGIS software, this paper objectively analyzes the internal causes of the development differences between different regions, which is helpful to put forward the solution strategy and promote the regional economic development.
In addition, with the rapid development of transportation and logistics industry, the economic and trade relations between countries are becoming more and more close. In recent years, there are more and more researches on logistics industry and economic development and ecological environment in academic circles. Beškovnik and Twrdy [45] studied green logistics policies in European countries, argued that they had a positive impact on economic development and the ecological environment, and tried to build appropriate models to formulate green logistics policies. Yildiz, Çankaya and Sezen [46] also discusses the impact of green supply chain on economy and ecological environment through eight dimensions, such as green procurement, green sales, green manufacturing environment management, etc. This paper analyzes the cooperative development relationship among economic development, logistics development, and ecological environment by establishing a coupling model, which has certain reference significance for developing international green logistics and promoting the sustainable development of green logistics trade, economy, and ecological environment in various countries. Based on the above conclusions, this paper puts forward the following policy suggestions for improving the coupling and coordinated development level of regional economic development, logistics development, and ecological environment in China. First of all, setting up the concept of ecological civilization and develop green coordinated economy is very important. In the process of economic development, attention should be paid to environmental protection. Setting up the concept of ecological civilization, protecting the ecological environment throughout the whole process of economic development, promoting the coordinated development of economy and ecology [47]. Second, governments can encourage green ideologies such as Kahn, Sharif, Golpîra et al. [8] by giving financial subsidies to businesses and tax incentives. Encouraging enterprises to fully consider the requirements of low-carbon economic development in the process of production and operation activities, thereby reducing the environmental pollution caused by production and operation activities.
Second, legislating and enacting environmental laws and regulations to strengthen environmental management. Logistics policies have a positive impact on the quality and efficiency of logistics services in enterprises by regulating and integrating all aspects of the development of the logistics industry [48]. Therefore, the government is required to formulate corresponding policies and regulations, regulate the non-green behaviors of enterprises in the process of operation, and guide enterprises to enhance their awareness of ecological protection while pursuing the best interests [49]. In addition, transportation plays an important role in the development of logistics industry. The empirical results show that the improvement of transportation conditions is beneficial to the development of economy. Therefore, it is very important for the development of the logistics industry to perfect the laws and regulations of China’s logistics industry and strengthen the regulation of transportation means and traffic flow [1].
Third, vigorously promote the modernization of the logistics industry and develop intelligent logistics. With the development of information technology, logistics industry has also emerged a wave of technological revolution, artificial intelligence, and big data as the representative of new technologies in the logistics field has been widely applied. By using the new technology, logistics information system integration tool can improve the inefficiency and unreasonable of port logistics process. Additionally, the logistics industry can be well developed, which can guarantee the sustainable development of economy [50].
Finally, developing green logistics to promote sustainable development of the economic environment. By implementing the concept of green development, nurturing a new modern green logistics industry, and implementing Green Supply Chain Management [51], logistics costs and environmental damage can be reduced [13], thus promoting the entire logistics industry chain and the formation of green industry. Therefore, the development of green logistics is beneficial to optimize the industrial structure and promote the healthy development of regional economy, which is of great significance to improve the coupling and coordination among economic development, logistics development and ecological environment [52].
This research mainly uses the coupling model to analyze the economic development, the logistics development and the ecological environment coupling coordination level and the regional difference of the four major economic regions in China. The research mainly analyzes the impact of economic development and logistics development on the ecological environment, and has little analysis and research on the differences between the cities in the region and the green logistics. future research will pay more attention to the development of green logistics, such as how green logistics promotes economic sustainable development and ecological environment sustainable development, specializing in the use of ArcGIS software for space autocorrelation research, in the international scope of comparative analysis to expand the scope of application of the study.

Author Contributions

Conceptualization, methodology, X.Z. & M.Z.; Writing-Review & Editing, W.Z. & W.L. All authors have read and agreed to the published version of the manuscript.

Funding

This paper is supported by the National Natural Science Foundation of China (#71804056,#71932004, #71904092,#71672111), Humanities and Social Sciences Research Project of the Ministry of Education of China(#18YJC630250, #18YJC630077), and China Postdoctoral Science Foundation (2018M642033).

Conflicts of Interest

The authors declare no conflict of interest.

References

  1. Hooi Lean, H.; Huang, W.; Hong, J. Logistics and economic development: Experience from China. Transp. Policy 2014, 32, 96–104. [Google Scholar] [CrossRef]
  2. Xu, X.; Hao, J.; Deng, Y.; Wang, Y. Design optimization of resource combination for collaborative logistics network under uncertainty. Appl. Soft Comput. 2017, 560, 684–691. [Google Scholar] [CrossRef]
  3. Xu, X.; Zhang, W.; Li, N.; Xu, H. A bi-level programming model of resource matching for collaborative logistics network in supply uncertainty environment. J. Frankl. Inst. 2015, 352, 3873–3884. [Google Scholar] [CrossRef]
  4. Xu, X.; Hao, J.; Yu, L.; Deng, Y. Fuzzy Optimal Allocation Model for Task-Resource Assignment Problem in Collaborative Logistics Network. IEEE Trans. Fuzzy Syst. 2019, 27, 1112–1125. [Google Scholar] [CrossRef]
  5. Xu, X.; Wei, Z.; Ji, Q.; Wang, C.; Gao, G. Global renewable energy development: influencing factors, trend predictions and countermeasures. Resour. Policy 2019, 63, 101470. [Google Scholar] [CrossRef]
  6. Kim, S.; Han, C. Measuring Environmental Logistics Practices. Asian J. Shipp. Logist. 2011, 27, 237–258. [Google Scholar] [CrossRef] [Green Version]
  7. Murphy, P.R.; Poist, R.F. Green perspectives and practices: A “comparative logistics” study. Supply Chain Manag. An Int. J. 2003, 8, 122–131. [Google Scholar] [CrossRef]
  8. Khan, S.A.R.; Sharif, A.; Golpîra, H.; Kumar, A. A green ideology in Asian emerging economies: From environmental policy and sustainable development. Sustain. Dev. 2019, 27, 1063–1075. [Google Scholar] [CrossRef]
  9. Lambrechts, W.; Son-Turan, S.; Reis, L.; Semeijn, J. Lean, Green and Clean? Sustainability Reporting in the Logistics Sector. Logistics 2019, 3, 3. [Google Scholar] [CrossRef] [Green Version]
  10. Zhang, S.; Wang, J.; Zheng, W. Decomposition Analysis of Energy-Related CO2 Emissions and Decoupling Status in China’s Logistics Industry. Sustainability-Basel 2018, 10, 1340. [Google Scholar] [CrossRef] [Green Version]
  11. Song, M.; Wang, S.; Yu, H.; Yang, L.; Wu, J. To reduce energy consumption and to maintain rapid economic growth: Analysis of the condition in China based on expended IPAT model. Renew. Sustain. Energy Rev. 2011, 15, 5129–5134. [Google Scholar] [CrossRef]
  12. Wu, H.J.; Dunn, S.C. Environmentally responsible logistics systems. Int. J. Phys. Distr. Log. 1995, 25, 20–38. [Google Scholar] [CrossRef]
  13. Zaman, K.; Shamsuddin, S. Green logistics and national scale economic indicators: Evidence from a panel of selected European countries. J. Clean. Prod. 2017, 143, 51–63. [Google Scholar] [CrossRef]
  14. Ni, S.; Lin, Y.; Li, Y.; Shao, H.; Wang, S. An evaluation method for green logistics system design of agricultural products: A case study in Shandong province, China. Adv. Mech. Eng. 2019, 11, 2072050775. [Google Scholar] [CrossRef] [Green Version]
  15. Abbasi, M.; Nilsson, F. Developing environmentally sustainable logistics. Transp. Res. Part D: Transp. Environ. 2016, 46, 273–283. [Google Scholar] [CrossRef]
  16. Stern, D.I.; Common, M.S.; Barbier, E.B. Economic growth and environmental degradation: The environmental Kuznets curve and sustainable development. World Dev. 1996, 24, 1151–1160. [Google Scholar] [CrossRef]
  17. Wang, Y.; Han, R.; Kubota, J. Is there an environmental Kuznets curve for SO2 emissions? A semi-parametric panel data analysis for China. Renew. Sustain. Energy Rev. 2016, 54, 1182–1188. [Google Scholar] [CrossRef]
  18. Li, T.; Wang, Y.; Zhao, D. Environmental Kuznets curve in China: new evidence from dynamic panel analysis. Energy Policy 2016, 91, 138–147. [Google Scholar] [CrossRef]
  19. Yuan, L.; Yang, G.; Feng, Y. Study on coupling development mode and judgment criterion of ecosystem and economic system in arid area: a case of Xinjiang. J. Northwest A&F Univ. (Nat. Sci. Ed.) 2007, 11. [Google Scholar]
  20. Zhao, Y.; Wang, S.; Zhou, C. Understanding the relation between urbanization and the eco-environment in China’s Yangtze River Delta using an improved EKC model and coupling analysis. Sci. Total Environ. 2016, 571, 862–875. [Google Scholar] [CrossRef]
  21. Zhang, Q.; Wang, L.; Wu, F.; Yuan, L.; Zhao, L. Quantitative Evaluation for Coupling Coordinated Development between Ecosystem and Economic System—Case Study of Chinese Loess Plateau. J. Urban Plan Dev. 2012, 138, 328–334. [Google Scholar] [CrossRef]
  22. Yamaguchi, K. Inter-regional air transport accessibility and macro-economic performance in Japan. Transp. Res. Part E: Logist. Transp. Rev. 2007, 43, 247–258. [Google Scholar] [CrossRef]
  23. Yang, C.; Lan, S.; Wang, L. Research on coordinated development between metropolitan economy and logistics using big data and Haken model. Int. J. Prod. Res. 2019, 57, 1176–1189. [Google Scholar] [CrossRef]
  24. Lan, S.L.; Zhong, R.Y. Coordinated development between metropolitan economy and logistics for sustainability. Resour. Conserv. Recycl. 2018, 128, 345–354. [Google Scholar] [CrossRef]
  25. Foster, S.T., Jr.; Sampson, S.E.; Dunn, S.C. The impact of customer contact on environmental initiatives for service firms. Int. J. Oper. Prod. Man. 2000, 20, 187–203. [Google Scholar] [CrossRef]
  26. Chunguang, Q.; Xiaojuan, C.; Kexi, W.; Pan, P. Research on Green Logistics and Sustainable Development. In Proceedings of the 2008 International Conference on Information Management, Innovation Management and Industrial Engineering; IEEE: Piscataway, NY, USA, 2008; pp. 162–165. [Google Scholar]
  27. Lu, M.; Xie, R.; Chen, P.; Zou, Y.; Tang, J. Green Transportation and Logistics Performance: An Improved Composite Index. Sustainability-Basel 2019, 11, 2976. [Google Scholar] [CrossRef] [Green Version]
  28. Sueyoshi, T.; Goto, M. DEA environmental assessment in time horizon: Radial approach for Malmquist index measurement on petroleum companies. Energy Econ. 2015, 51, 329–345. [Google Scholar] [CrossRef]
  29. Wang, K.; Lu, B.; Wei, Y. China’s regional energy and environmental efficiency: A range-adjusted measure based analysis. Appl. Energ. 2013, 112, 1403–1415. [Google Scholar] [CrossRef]
  30. Evangelista, P. Environmental sustainability practices in the transport and logistics service industry: An exploratory case study investigation. Res. Transp. Bus. Manag. 2014, 12, 63–72. [Google Scholar]
  31. Mačiulis, A.; Vasiliauskas, A.V.; Jakubauskas, G. The impact of transport on the competitiveness of national economy. Transp.-Vilnius 2009, 24, 93–99. [Google Scholar] [CrossRef]
  32. Aljohani, K.; Thompson, R.G. Impacts of logistics sprawl on the urban environment and logistics: Taxonomy and review of literature. J. Transp. Geogr. 2016, 57, 255–263. [Google Scholar] [CrossRef]
  33. Li, Y.; Li, Y.; Zhou, Y.; Shi, Y.; Zhu, X. Investigation of a coupling model of coordination between urbanization and the environment. J. Environ. Manag. 2012, 98, 127–133. [Google Scholar] [CrossRef] [PubMed]
  34. Tang, Z. An integrated approach to evaluating the coupling coordination between tourism and the environment. Tourism Manag. 2015, 46, 11–19. [Google Scholar] [CrossRef]
  35. Xing, L.; Xue, M.; Hu, M. Dynamic simulation and assessment of the coupling coordination degree of the economy–resource–environment system: Case of Wuhan City in China. J. Environ. Manag. 2019, 230, 474–487. [Google Scholar] [CrossRef]
  36. He, J.; Wang, S.; Liu, Y.; Ma, H.; Liu, Q. Examining the relationship between urbanization and the eco-environment using a coupling analysis: Case study of Shanghai, China. Ecol. Indic. 2017, 77, 185–193. [Google Scholar] [CrossRef]
  37. Wang, S.; Fang, C.; Wang, Y.; Huang, Y.; Ma, H. Quantifying the relationship between urban development intensity and carbon dioxide emissions using a panel data analysis. Ecol. Indic. 2015, 49, 121–131. [Google Scholar] [CrossRef]
  38. Liu, J.; Jin, X.; Xu, W.; Fan, Y.; Ren, J.; Zhang, X.; Zhou, Y. Spatial coupling differentiation and development zoning trade-off of land space utilization efficiency in Eastern China. Land Use Policy 2019, 85, 310–327. [Google Scholar] [CrossRef]
  39. Kijima, M.; Nishide, K.; Ohyama, A. Economic models for the environmental Kuznets curve: A survey. J. Econ. Dyn. Control. 2010, 34, 1187–1201. [Google Scholar] [CrossRef]
  40. Lan, S.; Yang, C.; Huang, G.Q. Data analysis for metropolitan economic and logistics development. Adv. Eng. Inform. 2017, 32, 66–76. [Google Scholar] [CrossRef]
  41. Rennings, K.; Wiggering, H. Steps towards indicators of sustainable development: linking economic and ecological concepts. Ecol. Econ. 1997, 20, 25–36. [Google Scholar] [CrossRef]
  42. Wang, S.; Ma, H.; Zhao, Y. Exploring the relationship between urbanization and the eco-environment—A case study of Beijing–Tianjin–Hebei region. Ecol. Indic. 2014, 45, 171–183. [Google Scholar] [CrossRef]
  43. Khan, S.A.R.; Dong, Q.; Wei, S.; Zaman, K.; Zhang, Y. Environmental logistics performance indicators affecting per capita income and sectoral growth: Evidence from a panel of selected global ranked logistics countries. Environ. Sci. Pollut. Res. 2017, 24, 1518–1531. [Google Scholar] [CrossRef] [PubMed]
  44. Aldakhil, A.M.; Nassani, A.A.; Awan, U.; Abro, M.M.Q.; Zaman, K. Determinants of green logistics in BRICS countries: An integrated supply chain model for green business. J. Clean. Prod. 2018, 195, 861–868. [Google Scholar] [CrossRef]
  45. Beškovnik, B.; Twrdy, E. Green logistics strategy for south east europe: to improve intermodality and establish green transport corridors. Transp. Vilnius 2012, 27, 25–33. [Google Scholar] [CrossRef]
  46. Yildiz Çankaya, S.; Sezen, B. Effects of green supply chain management practices on sustainability performance. J. Manuf. Technol. Mana. 2019, 30, 98–121. [Google Scholar] [CrossRef]
  47. Yang, L.; Wang, K.; Geng, J. China’s regional ecological energy efficiency and energy saving and pollution abatement potentials: An empirical analysis using epsilon-based measure model. J. Clean. Prod. 2018, 194, 300–308. [Google Scholar] [CrossRef]
  48. Chang, C.; Lai, P. An evaluation of logistics policy enablers between Taiwan and the UK. Marit. Bus. Rev. 2017, 2, 2–20. [Google Scholar] [CrossRef]
  49. Hung Lau, K. Benchmarking green logistics performance with a composite index. Benchmark. Int. J. 2011, 18, 873–896. [Google Scholar] [CrossRef]
  50. Yang, Y.; Chen, S. Determinants of global logistics hub ports: Comparison of the port development policies of Taiwan, Korea, and Japan. Transp. Policy 2016, 45, 179–189. [Google Scholar] [CrossRef]
  51. Ghadimi, P.; Wang, C.; Lim, M.K. Sustainable supply chain modeling and analysis: Past debate, present problems and future challenges. Resour. Conserv. Recycl. 2019, 140, 72–84. [Google Scholar] [CrossRef]
  52. Mishra, D.; Gunasekaran, A.; Papadopoulos, T.; Hazen, B. Green supply chain performance measures: A review and bibliometric analysis. Sustain. Prod. Consum. 2017, 10, 85–99. [Google Scholar] [CrossRef]
Figure 1. Regional changes in economic development, logistics development and the ecological environment from 2008 to 2017.
Sustainability 12 01058 g001
Figure 2. Average change trend of data in sample area from 2008 to 2017.
Sustainability 12 01058 g002
Figure 3. Coupling and Coordination of economic development, logistics development and ecological environment in 2002, 2009, and 2016.
Sustainability 12 01058 g003
Figure 4. The spatial distribution of regional coupling coordination degree.
Sustainability 12 01058 g004
Table 1. The standard of the coupling coordination degree.
NumberLevel (D)Degree
10.8 < D ≤ 1Quality coordination (V1)
20.6 < D ≤ 0.8Intermediate coordination (V2)
30.5 < D ≤ 0.6Primary coordination (V3)
40.4 < D ≤ 0.5Basic coordination (V4)
50.2 < D ≤ 0.4Intermediate incoordination (V5)
60 < D ≤ 0.2Extreme incoordination (V6)
Table 2. Summary of the comprehensive evaluation indicators of the three above systems.
SystemIndicatorVariablesData Source
Economic developmentEconomic development scaleGDPChina Statistical Yearbook 2008–2017; Statistical Bulletin of National Economic and Social Development
Industrial production scale (million Yuan)
Investment in fixed assets (million Yuan)
Revenue (ten thousand Yuan)
Economic development structureProportion of value added of tertiary industry to GDP (%)China Industrial Statistical Yearbook 2008–2017; Statistical Bulletin of National Economic and Social Development
Proportion of value added of secondary industry to GDP (%)
Per capita retail sales of consumer goods (Yuan)
Economic development benefitsGDP per capita (Yuan)China Statistical Yearbook 2008–2017; Statistical Bulletin of National Economic and Social Development
Income Gap (Yuan)
Urbanization rate (%)
Logistics developmentSocial benefits of logistics developmentAdded value in transportation, storage and postal services (million Yuan)China Statistical Yearbook 2008–2017; China Logistics Statistical Yearbook 2008~2017; Statistical Bulletin of National Economic and Social Development
Total social logistics (million Yuan)
Number of employees in the logistics industry (ten thousand people)
Logistics Development FoundationTotal social investment in fixed assets in transportation, storage and postal services (million Yuan)China Traffic Statistical Yearbook 2008~2017; China Statistical Yearbook 2008–2017; Statistical Bulletin of National Economic and Social Development
Road transport density (km/km2)
Rail transport density (km/km2)
Logistics development and operation capabilitiesCargo turnover (million tons/km)China Logistics Statistical Yearbook 2008–2017; China Traffic Statistical Yearbook 2008–2017
Cargo transportation volume (million tons)
Ecological environmentEnvironmental pollutionWastewater discharge (ten thousand tons)China Environmental Statistical Yearbook 2008–2017; China Industrial Statistical Yearbook 2008–2017
Sulfur dioxide emissions (ten thousand tons)
Environmental pollution treatmentForestry Fixed Asset Investment (million Yuan)China Statistical Yearbook 2008–2017; China Industrial Statistical Yearbook 2008–2017; Statistical Bulletin of National Economic and Social
Industrial waste gas treatment investment (million Yuan)
Industrial wastewater treatment investment (million Yuan)
Industrial solid waste treatment investment (million Yuan)
Natural environment foundationWetland area (ten thousand hectares)China Environmental Statistical Yearbook 2008–2017; Statistical Bulletin of National Economic and Social
Area of nature reserves (thousand hectares)
Total groundwater resources (million cubic meters)
Forest cover rate (%)
Table 3. Index for economic development.
RegionsProvinces and CitiesYear
2008200920102011201220132014201520162017
Eastern RegionBeijing0.178 0.221 0.332 0.415 0.474 0.538 0.593 0.653 0.742 0.822
Tianjin0.215 0.261 0.311 0.434 0.523 0.597 0.713 0.761 0.794 0.765
Hebei0.187 0.238 0.349 0.508 0.497 0.562 0.616 0.643 0.728 0.825
Shandong0.191 0.229 0.297 0.379 0.442 0.510 0.590 0.650 0.744 0.809
Jiangsu0.220 0.270 0.395 0.486 0.392 0.455 0.526 0.576 0.632 0.710
Shanghai0.335 0.262 0.356 0.402 0.424 0.498 0.560 0.529 0.627 0.722
Zhejiang0.203 0.240 0.304 0.393 0.447 0.518 0.593 0.664 0.746 0.828
Fujian0.129 0.211 0.317 0.324 0.396 0.474 0.584 0.645 0.697 0.798
Guangdong0.206 0.231 0.315 0.415 0.464 0.520 0.609 0.630 0.697 0.788
Hainan0.190 0.212 0.316 0.422 0.506 0.556 0.618 0.675 0.716 0.809
Northeastern RegionLiaoning0.198 0.261 0.379 0.515 0.632 0.714 0.755 0.681 0.492 0.526
Jilin0.186 0.236 0.289 0.361 0.446 0.553 0.630 0.675 0.755 0.753
Heilongjiang0.216 0.230 0.416 0.591 0.574 0.617 0.628 0.618 0.626 0.641
Central RegionShanxi0.181 0.191 0.351 0.554 0.431 0.515 0.564 0.541 0.531 0.663
Henan0.169 0.225 0.296 0.380 0.447 0.515 0.596 0.660 0.740 0.832
Hubei0.149 0.226 0.320 0.428 0.446 0.526 0.622 0.700 0.762 0.728
Hunan0.135 0.203 0.283 0.405 0.430 0.523 0.607 0.685 0.761 0.844
Anhui0.155 0.227 0.326 0.433 0.451 0.529 0.607 0.659 0.739 0.827
Jiangxi0.152 0.206 0.314 0.429 0.462 0.544 0.613 0.693 0.764 0.745
Western RegionGuangxi0.125 0.200 0.283 0.387 0.528 0.614 0.700 0.763 0.752 0.778
Chongqing0.115 0.160 0.256 0.345 0.435 0.636 0.498 0.538 0.581 0.636
Sichuan0.161 0.239 0.326 0.422 0.502 0.569 0.640 0.689 0.747 0.742
Guizhou0.109 0.098 0.151 0.195 0.661 0.310 0.369 0.386 0.405 0.469
Yunnan0.142 0.180 0.284 0.413 0.469 0.561 0.630 0.680 0.660 0.746
Shanxi0.174 0.242 0.315 0.405 0.484 0.558 0.632 0.624 0.676 0.790
Gansu0.165 0.232 0.320 0.453 0.459 0.544 0.638 0.685 0.752 0.767
Qinghai0.192 0.262 0.395 0.527 0.390 0.453 0.537 0.562 0.601 0.649
Inner Mongolia 0.178 0.260 0.345 0.460 0.541 0.616 0.705 0.694 0.749 0.688
Ningxia0.158 0.197 0.307 0.446 0.528 0.607 0.691 0.728 0.785 0.801
Xinjiang0.188 0.202 0.287 0.422 0.497 0.588 0.675 0.707 0.724 0.837
Table 4. Index for logistics development.
RegionsProvinces and CitiesYear
2008200920102011201220132014201520162017
Eastern RegionBeijing0.053 0.077 0.240 0.570 0.763 0.773 0.874 0.420 0.436 0.518
Tianjin0.046 0.390 0.449 0.511 0.626 0.507 0.606 0.637 0.642 0.675
Hebei0.064 0.130 0.241 0.331 0.464 0.715 0.840 0.906 0.906 0.770
Shandong0.069 0.228 0.357 0.504 0.530 0.365 0.453 0.521 0.637 0.862
Jiangsu0.017 0.057 0.192 0.340 0.411 0.713 0.827 0.831 0.867 0.956
Shanghai0.213 0.185 0.352 0.450 0.421 0.433 0.576 0.757 0.824 0.996
Zhejiang0.000 0.126 0.260 0.384 0.472 0.555 0.674 0.777 0.860 0.991
Fujian0.000 0.058 0.146 0.240 0.346 0.571 0.685 0.796 0.862 0.990
Guangdong0.003 0.082 0.163 0.249 0.327 0.572 0.703 0.735 0.840 0.994
Hainan0.010 0.115 0.262 0.376 0.441 0.349 0.609 0.753 0.808 0.839
Northeastern RegionLiaoning0.073 0.094 0.215 0.348 0.549 0.750 0.841 0.813 0.656 0.746
Jilin0.052 0.116 0.218 0.325 0.594 0.635 0.705 0.729 0.785 0.911
Heilongjiang0.077 0.118 0.316 0.526 0.629 0.614 0.617 0.498 0.503 0.641
Central RegionShanxi0.125 0.097 0.228 0.363 0.470 0.564 0.748 0.759 0.802 0.900
Henan0.014 0.061 0.172 0.273 0.424 0.548 0.662 0.731 0.810 0.916
Hubei0.082 0.144 0.173 0.263 0.372 0.580 0.717 0.781 0.874 0.940
Hunan0.036 0.159 0.255 0.434 0.586 0.643 0.797 0.794 0.858 0.953
Anhui0.004 0.041 0.106 0.240 0.339 0.642 0.739 0.759 0.852 0.950
Jiangxi0.043 0.086 0.201 0.246 0.348 0.607 0.780 0.799 0.857 0.960
Western RegionGuangxi0.000 0.086 0.228 0.342 0.452 0.666 0.770 0.774 0.821 0.899
Chongqing0.005 0.055 0.158 0.270 0.301 0.572 0.688 0.781 0.871 0.996
Sichuan0.012 0.059 0.156 0.252 0.375 0.601 0.730 0.772 0.873 0.970
Guizhou0.000 0.044 0.114 0.186 0.231 0.475 0.609 0.738 0.894 0.950
Yunnan0.009 0.074 0.096 0.161 0.230 0.525 0.623 0.660 0.824 0.970
Shanxi0.042 0.100 0.214 0.288 0.387 0.598 0.808 0.791 0.864 0.986
Gansu0.004 0.036 0.074 0.257 0.329 0.485 0.664 0.711 0.794 0.956
Qinghai0.000 0.055 0.178 0.305 0.353 0.545 0.617 0.730 0.819 0.983
Inner Mongolia0.000 0.135 0.276 0.422 0.563 0.689 0.752 0.670 0.830 0.839
Ningxia0.000 0.134 0.282 0.464 0.671 0.704 0.731 0.764 0.840 0.761
Xinjiang0.019 0.046 0.113 0.193 0.333 0.582 0.696 0.708 0.721 0.981
Table 5. Index for environment development.
RegionsProvinces and CitiesYear
2008200920102011201220132014201520162017
Eastern RegionBeijing0.447 0.303 0.323 0.207 0.355 0.519 0.400 0.452 0.750 0.589
Tianjin0.417 0.167 0.141 0.277 0.101 0.299 0.336 0.350 0.336 0.400
Hebei0.370 0.548 0.270 0.365 0.310 0.221 0.281 0.306 0.357 0.456
Shandong0.577 0.233 0.250 0.314 0.234 0.163 0.201 0.359 0.464 0.438
Jiangsu0.463 0.418 0.255 0.334 0.302 0.443 0.378 0.504 0.652 0.598
Shanghai0.122 0.082 0.050 0.082 0.093 0.183 0.463 0.465 0.673 0.887
Zhejiang0.273 0.253 0.124 0.093 0.181 0.344 0.418 0.616 0.759 0.513
Fujian0.147 0.120 0.121 0.084 0.173 0.467 0.456 0.713 0.814 0.642
Guangdong0.428 0.260 0.298 0.276 0.362 0.408 0.413 0.634 0.571 0.465
Hainan0.332 0.380 0.202 0.382 0.359 0.434 0.517 0.363 0.532 0.507
Northeastern RegionLiaoning0.251 0.183 0.279 0.241 0.230 0.537 0.416 0.590 0.533 0.446
Jilin0.395 0.399 0.496 0.328 0.333 0.291 0.309 0.353 0.465 0.474
Heilongjiang0.230 0.459 0.286 0.177 0.142 0.476 0.451 0.538 0.698 0.629
Central RegionShanxi0.583 0.527 0.434 0.479 0.436 0.352 0.248 0.323 0.413 0.492
Henan0.608 0.181 0.411 0.136 0.087 0.246 0.209 0.338 0.507 0.431
Hubei0.171 0.240 0.181 0.066 0.092 0.285 0.311 0.372 0.851 0.589
Hunan0.297 0.313 0.331 0.294 0.677 0.178 0.166 0.246 0.300 0.273
Anhui0.205 0.169 0.199 0.200 0.179 0.395 0.352 0.480 0.926 0.657
Jiangxi0.272 0.431 0.319 0.242 0.261 0.240 0.218 0.343 0.450 0.487
Western RegionGuangxi0.231 0.223 0.248 0.312 0.366 0.671 0.665 0.808 0.686 0.548
Chongqing0.428 0.375 0.288 0.328 0.223 0.498 0.476 0.705 0.645 0.575
Sichuan0.394 0.478 0.245 0.333 0.358 0.555 0.470 0.417 0.496 0.532
Guizhou0.393 0.300 0.307 0.365 0.232 0.421 0.408 0.375 0.396 0.454
Yunnan0.367 0.256 0.400 0.261 0.204 0.374 0.398 0.528 0.462 0.541
Shanxi0.190 0.441 0.290 0.398 0.402 0.426 0.378 0.431 0.512 0.538
Gansu0.327 0.435 0.343 0.255 0.429 0.379 0.376 0.325 0.527 0.475
Qinghai0.229 0.312 0.354 0.276 0.225 0.373 0.463 0.511 0.580 0.543
Inner Mongolia0.281 0.272 0.202 0.221 0.278 0.541 0.463 0.503 0.723 0.659
Ningxia0.457 0.398 0.310 0.285 0.318 0.261 0.465 0.357 0.617 0.420
Xinjiang0.414 0.404 0.325 0.292 0.261 0.453 0.351 0.422 0.520 0.520
Table 6. Coupling degree of China’s economic development, logistics development and ecological environment three-element system.
RegionsProvinces and CitiesYear
2008200920102011201220132014201520162017
Eastern RegionBeijing0.166 0.179 0.295 0.369 0.503 0.599 0.592 0.498 0.626 0.630
Tianjin0.175 0.257 0.274 0.396 0.355 0.451 0.529 0.557 0.560 0.594
Hebei0.169 0.253 0.283 0.394 0.416 0.456 0.533 0.569 0.624 0.664
Shandong0.195 0.230 0.298 0.391 0.383 0.317 0.383 0.496 0.604 0.677
Jiangsu0.162 0.204 0.268 0.380 0.365 0.523 0.547 0.622 0.709 0.740
Shanghai0.206 0.161 0.212 0.269 0.274 0.346 0.531 0.570 0.703 0.861
Zhejiang0.116 0.198 0.217 0.257 0.343 0.463 0.551 0.682 0.787 0.752
Fujian0.069 0.114 0.175 0.193 0.290 0.502 0.567 0.715 0.788 0.797
Guangdong0.141 0.175 0.250 0.305 0.380 0.495 0.562 0.665 0.694 0.717
Hainan0.129 0.210 0.256 0.393 0.431 0.438 0.579 0.573 0.676 0.703
Northeastern RegionLiaoning0.158 0.166 0.283 0.351 0.438 0.661 0.645 0.689 0.556 0.559
Jilin0.164 0.223 0.314 0.338 0.445 0.471 0.521 0.562 0.653 0.690
Heilongjiang0.161 0.232 0.335 0.393 0.395 0.565 0.559 0.549 0.604 0.637
Central RegionShanxi0.226 0.209 0.327 0.459 0.445 0.469 0.479 0.512 0.559 0.664
Henan0.144 0.141 0.277 0.244 0.277 0.415 0.449 0.551 0.673 0.696
Hubei0.129 0.199 0.215 0.209 0.265 0.446 0.523 0.592 0.828 0.739
Hunan0.119 0.216 0.288 0.373 0.555 0.405 0.457 0.526 0.593 0.626
Anhui0.091 0.125 0.191 0.274 0.304 0.512 0.543 0.622 0.836 0.802
Jiangxi0.128 0.199 0.273 0.293 0.348 0.436 0.485 0.581 0.668 0.705
Western RegionGuangxi0.081 0.159 0.252 0.346 0.444 0.650 0.711 0.781 0.751 0.728
Chongqing0.094 0.152 0.227 0.313 0.308 0.566 0.546 0.667 0.688 0.712
Sichuan0.124 0.202 0.233 0.328 0.407 0.574 0.604 0.607 0.688 0.727
Guizhou0.085 0.107 0.172 0.235 0.320 0.396 0.450 0.471 0.517 0.582
Yunnan0.109 0.154 0.230 0.259 0.277 0.480 0.540 0.619 0.632 0.732
Shanxi0.119 0.224 0.270 0.360 0.422 0.522 0.580 0.598 0.669 0.749
Gansu0.113 0.178 0.215 0.308 0.402 0.464 0.544 0.546 0.681 0.706
Qinghai0.105 0.180 0.295 0.352 0.315 0.452 0.535 0.594 0.658 0.701
Inner Mongolia0.109 0.214 0.268 0.353 0.442 0.612 0.628 0.617 0.766 0.725
Ningxia0.118 0.217 0.300 0.391 0.485 0.489 0.618 0.589 0.741 0.639
Xinjiang0.144 0.168 0.224 0.288 0.350 0.537 0.552 0.598 0.648 0.755
Mean0.185 0.216 0.270 0.342 0.399 0.504 0.566 0.611 0.686 0.721
Table 7. The main coupling coordination types in 2008, 2011, 2014, and 2017.
Year2008201120142017
Quality coordination (V1) Shanghai, Fujian, Anhui
Intermediate coordination (V2) Beijing, Liaoning, Guangxi, Sichuan, Shanxi, Inner Mongolia, NingxiaBeijing, Tianjin, Hebei, Shandong, Jiangsu, Zhejiang, Guangdong, Hainan, Jilin, Heilongjiang, Shanxi, Henan, Hubei, Hunan, Jiangxi, Guangxi, Chongqing, Sichuan, Guizhou, Yunnan, Shanxi, Gansu, Qinghai, Inner Mongolia, Ningxia, Xinjiang
Primary coordination (V3) Tianjin, Hebei, Jiangsu, Shanghai, Fujian, Zhejiang, Guangdong, Hainan, Jilin, Heilongjiang, Shanxi, Hubei, Hunan, Jiangxi, Anhui, Chongqing, Yunnan, Gansu, Qinghai, XinjiangLiaoning,
Basic coordination (V4) Tianjin, Hebei, Heilongjiang, ShanxiShandong, Henan, Guizhou
Intermediate incoordination (V5)Beijing, Tianjin, Hebei, Shandong, Jiangsu, Shanghai, Guangdong, Jilin, Shanxi, Henan, Ningxia, XinjiangBeijing, Shandong, Jiangsu, Shanghai, Zhejiang, Fujian, Guangdong, Hainan, Liaoning, Jilin, Henan, Hubei, Hunan, Jiangxi, Anhui, Guangxi, Chongqing, Sichuan, Guizhou, Yunnan, Shanxi, Gansu, Qinghai, Inner Mongolia, Ningxia, Xinjiang
Extreme incoordination (V6)Zhejiang, Fujian, Hainan, Liaoning, Heilongjiang, Hubei, Hunan, Jiangxi, Anhui, Guangxi, Chongqing, Sichuan, Guizhou, Yunnan, Shanxi, Gansu, Qinghai, Inner Mongolia,

