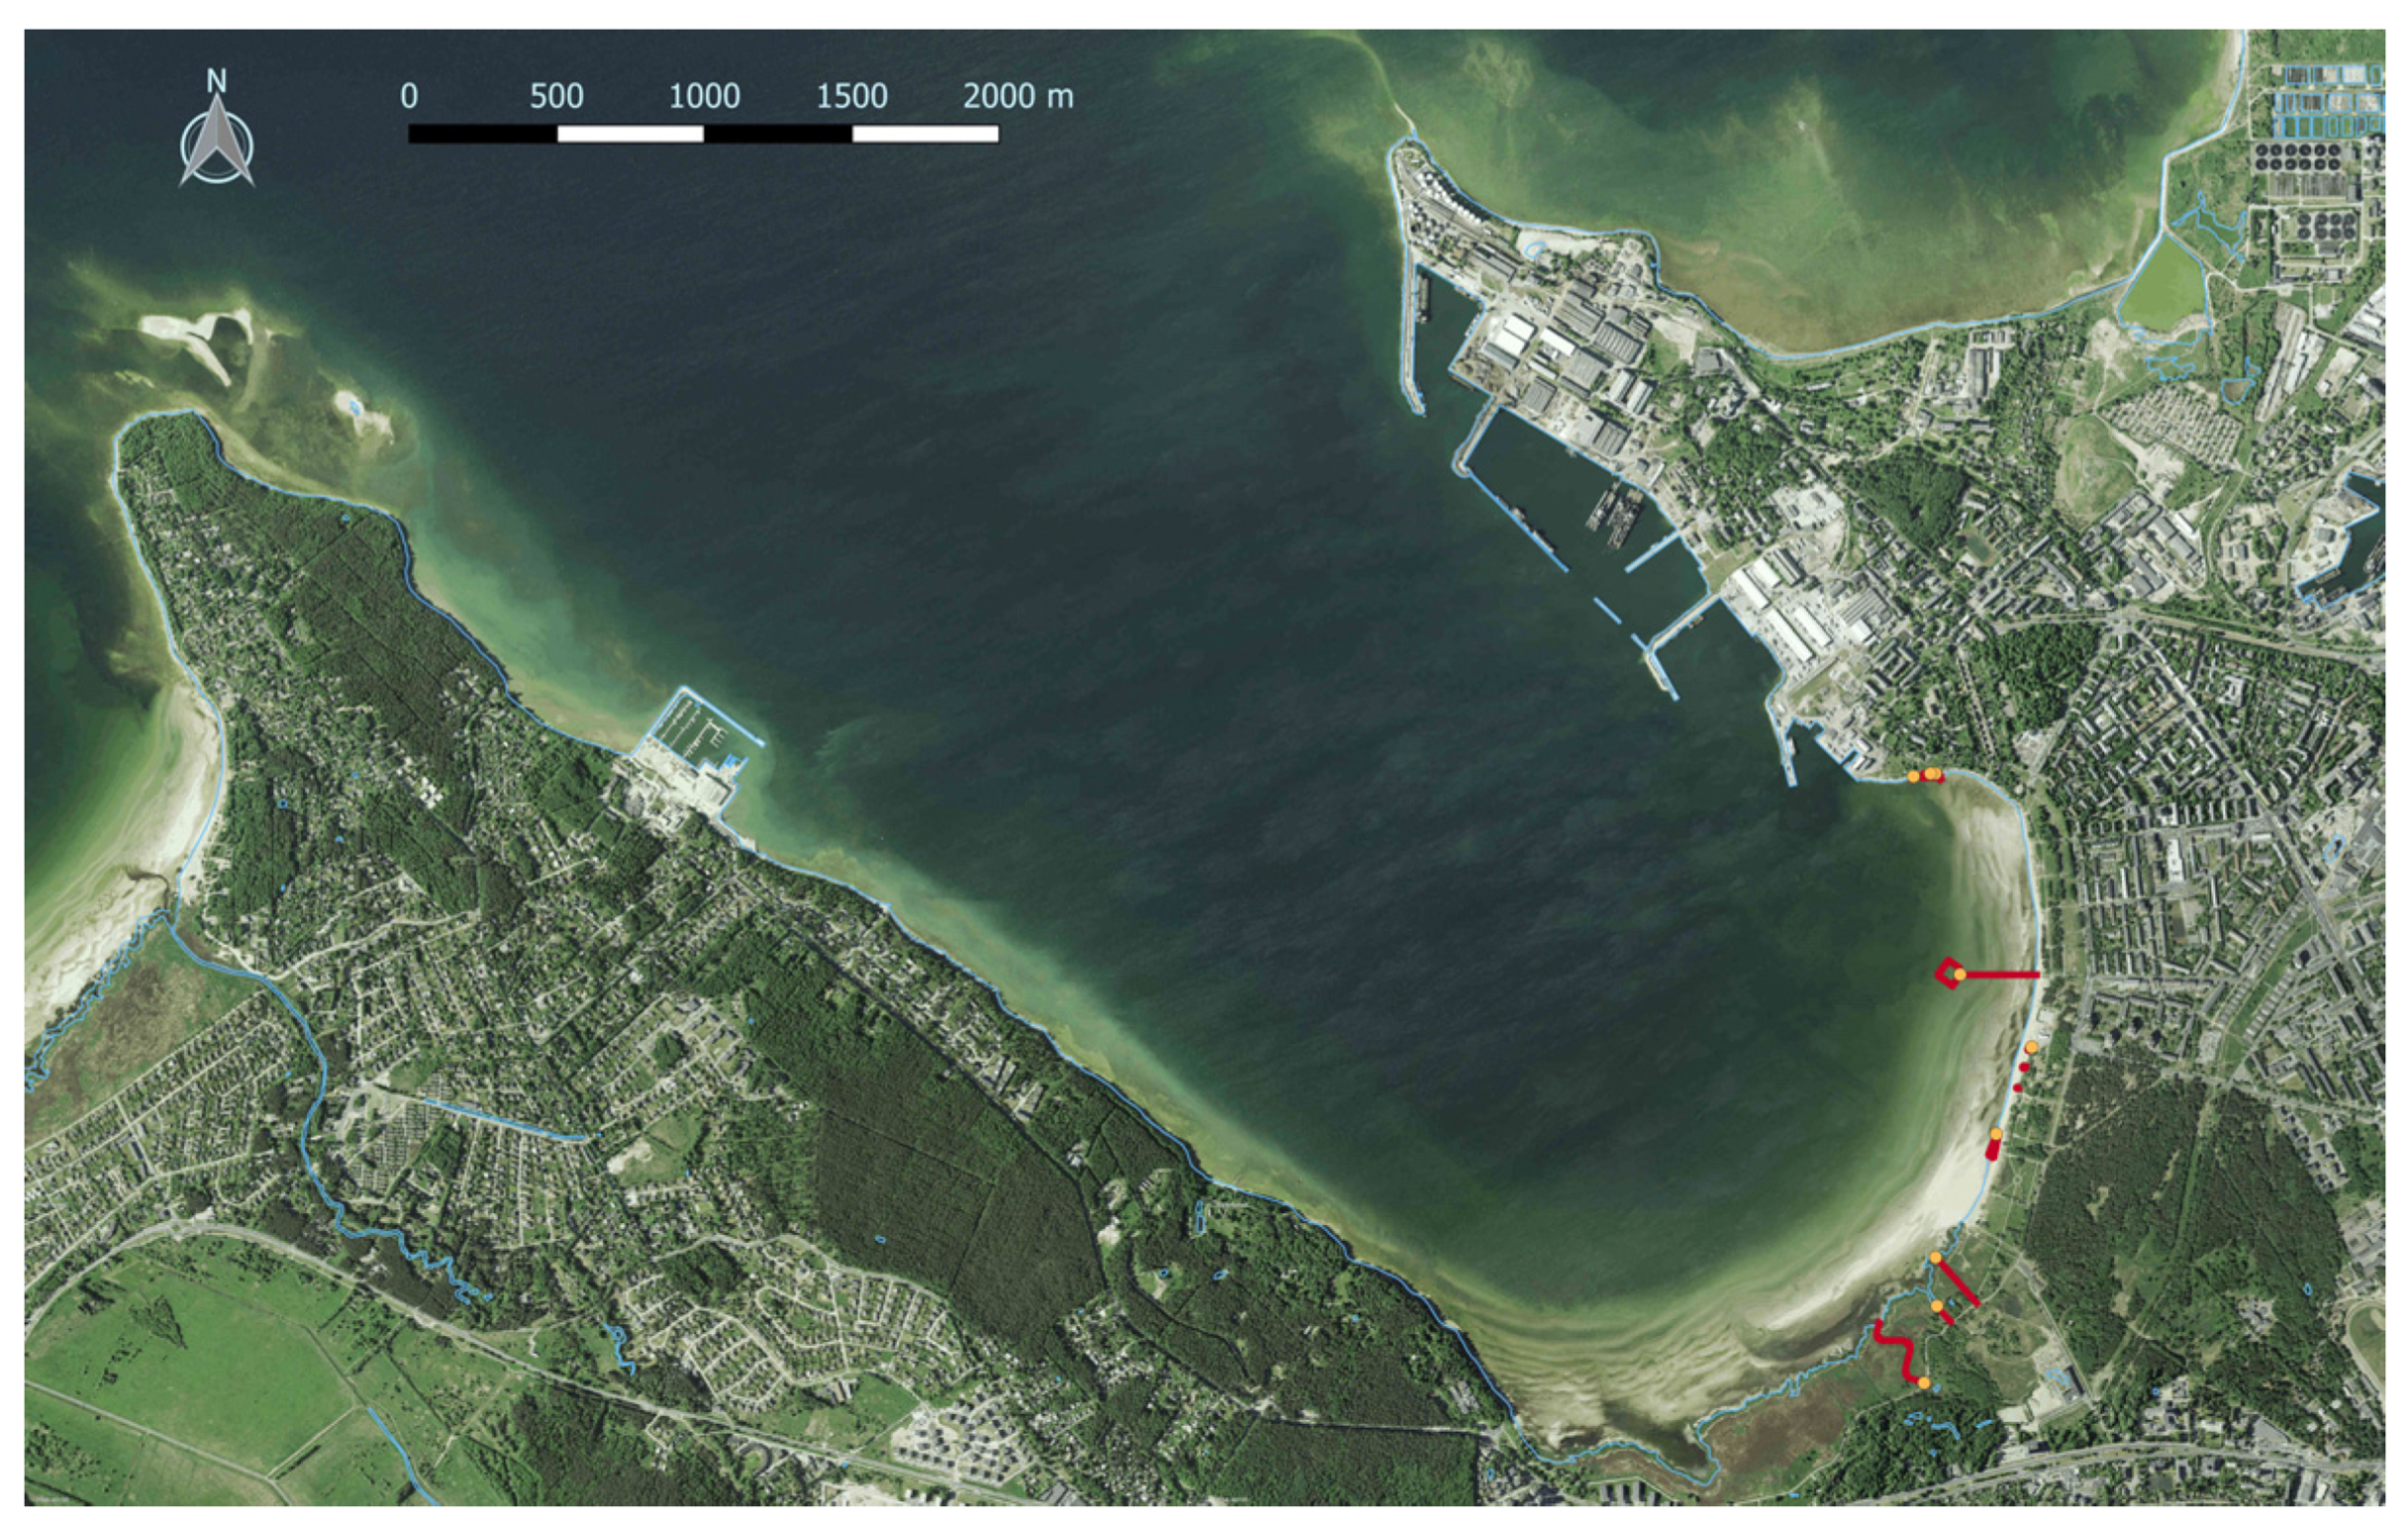
Article

Urban Blue Acupuncture: An Experiment on Preferences for Design Options Using Virtual Models

by
Peeter Vassiljev
1,*,
Simon Bell
1,2,
Jekaterina Balicka
1 and
Umme Aymona Ali Amrita
1
1
Institute of Agricultural and Environmental Sciences, Estonian University of Life Sciences, 51006 Tartu, Estonia
2
Edinburgh School of Architecture and Landscape Architecture, Edinburgh College of Art, University of Edinburgh, Edinburgh EH3 9DF, UK
*
Author to whom correspondence should be addressed.
Sustainability 2020, 12(24), 10656; https://doi.org/10.3390/su122410656
Submission received: 9 November 2020 / Revised: 15 December 2020 / Accepted: 17 December 2020 / Published: 20 December 2020
(This article belongs to the Special Issue Landscape Architecture Design to Promote Well-Being)

Abstract

:
Within the BlueHealth project, funded under the Horizon 2020 European Union research framework, a number of targeted experimental design interventions created in virtual reality (VR) were used to test the effect and impact of planning and design on encouraging people to use various blue spaces. A set of designs in three different coastal landscape types—a cliff/steep slope; a sandy beach and an area of reed beds—located in Tallinn, Estonia, were used as the sites for nine different intervention designs. The designs were based on a combination of the site features and inspirations from solutions found in different locations internationally. Using 3D modelling and a Virtual Reality system, a set of nine videos, one to depict each intervention, was created and shown to a quota sample of 252 Estonian residents. Respondents were asked a set of questions associated with each option. The results were analysed statistically and qualitatively. The results uncovered key preferences for designs and revealed differences among age groups and the levels of personal interconnection with nature. However, there were problems associated with the interpretation and understanding of some of the options by some of the people due to the degree of realism of the VR representations, which may have affected the results. The project shows that VR could be a useful tool for testing design ideas as part of public participation approaches but that care is needed in ensuring that viewers understand what they are assessing.

1. Introduction

1.1. Background

Blue spaces—outdoor environments, either natural or manmade—that prominently feature water and are accessible to humans either proximally (being in, on or near water) or distally/virtually (being able to see, hear or otherwise sense water) [1] can, like green spaces, have the potential as therapeutic landscapes and public health resources [2,3,4]. They may elicit psychological restoration [4,5], promote physical activities (both land and water-based) [6,7] and enhance social cohesion [8]. Blue spaces have been found to be highly preferred natural settings compared to other urban nature types [9]. As diverse environments, blue spaces may support different health and well-being benefits, depending on their type, quality, and characteristics [2,5,10].
While being well documented that nature and green spaces have the potential to improve people’s health and well-being [6,11,12,13,14,15,16,17], with biodiversity being one of the key factors [18], initial evidence suggests that the benefits of blue spaces may also be substantial and widespread [19,20,21,22] and maybe especially important for vulnerable populations such as children [23], those with underlying poor health, and those in deprived communities [24]. Besides health and well-being, perceived naturalness of a setting seems to affect landscape preference [25], and the level of agreement on aesthetic judgements among different respondents is greater in the case of natural views [26] (especially for scenic views [27]), while man-made structures elicit more variable responses [26]. It is important to note that restorative and well-being qualities of nature are not universal, as evidence suggests that an individual’s own connectedness with nature, which can be measured with various psychometric instruments [28,29], e.g., the Inclusion of Nature in Self (INS) Scale [28], can influence the level of restoration and well-being obtained from contact with nature [30,31,32].
As part of the BlueHealth project funded under the Horizon 2020 European Union research framework https://bluehealth2020.eu/, there was a focus on the planning and design of urban blue spaces in order to determine what makes a great blue space and what are the major design factors which should be taken into account. A tool was developed to evaluate blue spaces in terms of their positive and negative points as a basis for improved planning, design and management [33], and a number of experimental interventions were also undertaken and evaluated for their effectiveness at bringing people closer to the water [34]. However, though these are useful, it was only possible to test a limited number and there was no real chance to evaluate many design options before implementing them.
In the field of outdoor recreation planning and design, the introduction of visitor facilities into natural or managed landscapes generally serves two purposes: to provide a better, safer and more enjoyable visitor experience and to protect the landscape. In recreational planning, for example, the “planning circle” as proposed by Bürger-Arndt and Bell [35] forms a model where recreational facilities have a mediating role between the demand of visitors and the characteristics and sensitivity of the environment. It is generally considered preferable to minimize the number of facilities in more natural areas and several approaches such as the American “Recreation Opportunity Spectrum” [36] have been adopted to match the amount and style of facilities not only to the character of the setting but also to the motives and wishes of visitors, especially when escaping from the urban atmosphere of the city is desired. Even in urban areas, nature in the city provides a welcome contrast in experience.
If interventions can be made as small as possible to limit impact while having a significant effect, they fit into the concept of “urban acupuncture”. Urban acupuncture theory proposes that a small intervention can potentially have an effect out of all proportion to the investment [37]. Thus, these are small and inexpensive interventions which solve a specific, possibly locally acute, spatial/functional problem—perhaps a simple improvement to access or provision of seating which immediately enables older people to enjoy a space cost-effectively, rather than a large and complete redevelopment which is also expensive. The most appropriate type of intervention is very context- dependent and needs clear analysis before being carried out (such as applying detailed site analysis and public participation). In addition, while the problem may be local, the solution may have a wider impact.
In architecture and landscape architecture, it is normal to present design ideas to the public: to obtain feedback through public participation processes as well as to promote designs and to sell the ideas to investors or the clients. It is common nowadays to develop sophisticated graphical renderings and videos of projects using special design software which can sometimes be “hyper-realistic” [38]. These systems are often time-consuming to implement, are not particularly interactive and are limited in spatial extent, but software advances are steadily improving the situation. Various forms of virtual reality (VR) have been available for a couple of decades and are an alternative for depicting landscapes and designs and for giving people a more immersive and interactive experience.
There has been some use of VR in landscape planning and design—especially in public participation [39,40,41,42]—and it has also been applied or tested methodologically [43,44,45,46]. Notably, the evidence suggests that virtual environments of nature themselves can be the source of restorative experience [47,48,49,50]. Much focus has been on the simulation validity where it has been found that multi-sensory solutions that encompass sound and smell perform better than visual-only VR systems [45,48,51,52,53]. A major concern, still not adequately addressed, is the issue of application in real-life planning and participation situations where VR is used as a tool to define design and planning solutions through informed participation en masse [40,41,54,55,56]. However, some examples of research where design alternatives have been evaluated with the help of the wider public do exist, covering transportation infrastructure [57,58,59,60,61] solutions and green space planning [62,63]. By developing and presenting different design options in a structured way (where all the variables are controlled) differences between options can be identified as being related to specific aspects of the designs as opposed to random environmental factors (such as the effect of image lighting).

1.2. Objectives for the Research

The objectives of the research were defined as follows:
  • To test the use of virtual models in evaluating design proposals for achieving access to blue spaces (within the size range represented as “urban acupuncture”).
  • To test what elements of designs in different settings offered the greatest benefits to users.
  • To explore the variation in preferences expressed by different groups of respondents.

2. Methods

In this study, in order to reinforce or to extend the value of the physical interventions developed, constructed and evaluated within the project [34], we decided to explore how a larger range of possible solutions could be tested on members of the public. We decided to test which design characteristics would be more preferred for accessibility and other benefits in different kind of landscapes through the use of virtual models, as these hold the potential to assess more options at a lower cost than through the construction of physical examples. A summary of the methodology is as follows: We built a virtual landscape model of the selected test area comprising three different shoreline types and we inserted into this a total of nine different 3D design intervention models, three for each landscape type. We prepared nine short videos that provided a representative experience of each design option (owing to the survey method we had to adopt due to limitations imposed by the Covid-19 situation; we could not use the models in a truly immersive VR context). Using an online questionnaire survey, we obtained both quantitative and qualitative data on the preferences of 252 Estonian residents balanced across all ages and gender. We analysed the results using descriptive and predictive quantitative statistics and qualitative analysis.

2.1. Design Intervention Overview

The ideas for the design options were developed in several steps:
  • We selected a landscape which was diverse enough to represent different shoreline types and divided it into three zones—a low but steeply sloping/cliff area, a sandy beach and a reed-fringed shore, representing different potentials and limitations of contact with water typical of the Baltic Sea.
  • We created three design options for each zone, with the designs being a combination of addressing the site-specific characteristics and also informed by precedents from other locations identified and reviewed as part of the research.
  • We sketched out a set of ideas for discussion among the team, each option concentrating on a different design approach (the relative degree of development for each criterion being ranked on a scale). Thus, three design approaches were tested for each shoreline type.

2.2. Criteria for Design

We developed a set of criteria (Table 1) for the design options based on factors of importance that emerged from a review of blue space design projects that we conducted as part of the BlueHealth project [64]. These were as follows, based on a range from maximum possible (5) to minimal opportunities (1) for each criterion: degree of direct contact with water; accessible design; extent of open views to water; degree of possible contact with wildlife and vegetation and degree of opportunities for social interaction. Each design option was based on different combinations of these factors, in part determined by the possibilities of the sites chosen and in part as a result of inspiration from other successful projects (see more below).

2.3. The Sites for the Designs

The location for the intervention sites is known as Kopli Rand and is located in Tallinn. It is in a bay to the north of the city and has a diverse landscape. Part of the area is a natural reed shore with limited access; a major proportion consists of a popular sandy beach; to the north is a somewhat neglected area with a low cliff where a lot of informal activities take place associated with the water. The area is located next to a residential neighbourhood with mainly multi-storey housing. Figure 1 shows an aerial view of the study area.
Within these general areas, three design sites were selected as follows:
  • Low cliff/steep slope. This area comprises a steep slope and near-cliff with rocks and some old concrete remains from industrial use of the area during Soviet times and a somewhat broken slipway (Figure 2). This uneven and steep slope makes access to the water difficult so that dealing with the change in level and allowing different degrees of access to water was a key aspect of each design option.
  • Sandy beach. This area is a more typical beach with soft sand extending out into the sea where the water remains shallow for a considerable distance, limiting how easy it is to swim without having to wade out (Figure 3). This became an important factor in one of the design options (see below).
  • Reed beds. The Baltic sea is non-tidal and only brackish so that it is possible for reeds to grow along the water margin. These tall plants block views to the sea and also limit physical access while being in amongst them can result in a different aesthetic experience (Figure 4).

2.4. The Development of the Intervention Designs

Taking the criteria listed in Section 2.2, three options were developed for each location, each containing a different mix of the criteria and using a limited palette of materials. For each location, the landscape context suggested different potentials for the application of each criterion; for example, on the cliff/slope, the options explored different degrees of accessibility in relation to the constraints imposed by the terrain, while the potential for open views was high due to the elevated position and there were fewer possibilities for contact with nature in this area. The criteria were also applied following the potential suggested by a number of inspirational projects, such as for making contact with the water, although each realised option was a unique solution and not a copy of any specific design. Then, a series of sketches was developed and discussed among the team members before the final set was agreed and could proceed to the next stage. Figure 5 shows a sample of design sketches from which the final designs were developed.

2.5. Building Virtual Models

2.5.1. Building the Virtual Landscape

The three-dimensional model of the landscape for the virtual intervention testing was based on a section of the real landscape at Kopli in Tallinn, Estonia. The commercial software package LandSim3D (Bionatics s.a., Paris, France) was used to create the simulation. The software uses various GIS (geographic information system) layers to generate a parametric landscape model automatically that can be further enhanced with specific 3D models of components (specific 3D models of the intervention designs in our case). Figure 6 shows a view of the final model with the sea, sand dunes, forest and buildings in the distance. See Supplementary Materials A for a description of the process of creating the model in more detail.

2.5.2. Building the Landscape Intervention Models

Using the software Trimble SketchUp® (Trimble Inc., Sunnyvale, CA, USA), each of the nine options was converted into a fully 3-dimensional model. During this phase, materials had to be selected, the correct proportions to fit the terrain, details such as step heights, handrails, construction techniques and other practical aspects had to be resolved. Figure 7 shows a diagrammatic sketch map of the location of each of the sets of interventions and their extent.

2.5.3. Cliff Option 1: Observation Platform

A hanging platform oriented to provide elevated open views towards the Baltic sea located on the cliff-edge at the northern corner of the Kopli beach area (Figure 8). Inspiration for this intervention came from the following projects: New waterfront in Aalborg Denmark (Landezine International Landscape Award, 2020 [66]); Rochetaillée banks in Lyon, France (In Situ Architectes Paysagistes 2016 [67]). This platform (feeling of being away from land, surrounded by the water) is accessible for a wide range of users and will allow visitors to see through the railing if they are in a wheelchair, but does not provide seating. The railing is made of steel covered by timber and the platform is made of timber planks supported on a steel frame beneath it and cantilevered out to emphasise the height above the water.
The application of the criteria to this option is as follows:
  • Possibility for direct contact with water—2,
  • Accessible design—3,
  • Open view to water—5,
  • Contact with vegetation and wildlife—1,
  • Social interaction—2.

2.5.4. Cliff Option 2: Stepped Sitting Structure

The intervention was designed as a spacious, comfortable area to stay and rest next to the water (Figure 9). Inspiration for this intervention came from the following projects: Chicago River walk, US (Landezine International Landscape Award, 2017 [68]); Brygge promenade Oslo, Norway (LINK Landskap 2015 [69]). The area provides options for sitting or reclining whether alone, in couples, large or small groups. The intervention is big enough to provide the space for a large number of people. Depending on the user’s choice, it could be the area to socialize or contemplate while having a wide view of the water. The platform can be also used for events. The steps take visitors to the base of the cliff and let them touch the water. The steps are high and inclined so that one may lean on them while sitting or sunbathing. It is constructed out of timber over a timber or steel frame. Handrails are positioned at the steps descending each tier of seating.
The application of the criteria to this option are as follows:
  • Possibility for direct contact with water—3,
  • Accessible design—4,
  • Open view to water—4,
  • Contact with vegetation and wildlife—2,
  • Social interaction—5.

2.5.5. Cliff Option 3: Stepped Sitting Structure with Water Access Platform

The intervention was designed as a spacious, comfortable area to spend time and relax next to the water, as well as have an opportunity to touch the water (Figure 10). Inspiration for this intervention came from the following projects: Oriental Bay, Wellington, New Zealand (Johns 2007 [70]); Alsion University campus, Denmark (Schonherr Landscape Architects 2016 [71]). Depending on the water level, the concrete platform on the lower part may be covered with 5–20 cm of water. The area provides options for resting and comfortable seats for people whether alone, in couples, or in small to middle-size groups. Depending on the user’s choice, it could be an area to socialize or contemplate while having a wide view of the water. In contrast to option 2, this platform is smaller and less likely to attract large numbers of people. The structure is made in a similar way to Option 2 with a concrete platform to withstand winter ice damage.
The application of the criteria to this option are as follows:
  • Possibility for direct contact with water—4,
  • Accessible design—3,
  • Open view to water—4,
  • Contact with vegetation and wildlife—2,
  • Social interaction—4.

2.5.6. Beach Option 1: Boardwalk and Enclosed Swimming Platform

The intervention provides opportunities for water activities and direct connection with water, both visually and physically (Figure 11). Inspiration for this intervention came from the following project: Kastrup sea bath, Denmark (White Architekter 2008 [72]). A long pier brings the users to a point in the bay where the depth is comfortable enough for swimming. Besides the swimming and bathing function, the intervention also provides views, both to the sea and back to the shore, long benches for resting, looking at the view and socialising.
The application of the criteria to this option are as follows:
  • Possibility for direct contact with water—5,
  • Accessible design—4,
  • Open view to water—5,
  • Contact with vegetation and wildlife—2,
  • Social interaction—3.

2.5.7. Beach Option 2: Multi-Use Sitting Platform with Shelter and Access to Water

The intervention provides affordances to the beach area which were not currently present: a wooden deck with multifunctional sculpture-like “rock” structures, which can be used as both sitting and play elements; a wind and sun shelter, accessible for multiple user groups (Figure 12). Inspiration for this intervention came from the following project: Vinaros promenade, Spain (Guallart Architects 2011 [73]). The decking and shelter are made of timber and it is possible to enter the water directly from the edge of the platform.
The application of the criteria to this option are as follows:
  • Possibility for direct contact with water—4,
  • Accessible design—4,
  • Open view to water—4,
  • Contact with vegetation and wildlife—2,
  • Social interaction—3.

2.5.8. Beach Option 3: A Series of Sitting Decks

The interventions consist of a number of wooden platforms, built next to and around existing sand dunes with vegetation (Figure 13). Inspiration for this intervention came from the following projects: Amager beach Copenhagen Denmark (Haslov and Kjaersgaard Planners and Architects 2013 [74]); Saulkrasti sea park, Latvia (Substance 2014 [75]). The structures can be used for sunbathing, socializing in groups, in couples, and for picnicking. The intervention provides views to the sea and some contact with wildlife and vegetation of the dune ecosystem.
The application of the criteria to this option are as follows:
  • Possibility for direct contact with water—3,
  • Accessible design—4,
  • Open view to water—3,
  • Contact with vegetation and wildlife—3,
  • Social interaction—4.

2.5.9. Reed Beds Option 1: Boardwalk with Surprise View

The intervention consists of a long wooden deck path which leads through the reed area. At the end of the deck, there is an accessible elevated platform, providing a wide view over the sea (without direct contact with the water) (Figure 14). Inspiration for this intervention came from the following projects: Tagus linear park, Portugal (Topiaris Landscape Architecture 2014 [76]); Houtan park Shanghai, China (Turenscape 2011 [77]). The platform at the end of the deck provides a climax of the experience, the surprising view opening to the visitors in the area, where no view is otherwise possible. It has mesh safety rails all along the length.
The application of the criteria to this option are as follows:
  • Possibility for direct contact with water—1,
  • Accessible design—3,
  • Open view to water—3,
  • Contact with vegetation and wildlife—4,
  • Social interaction—1.

2.5.10. Reed Beds Option 2: Boardwalk with Sitting and Viewing Platform

The intervention consists of a short wooden decking path leading through the reed area (Figure 15). Inspiration for this intervention came from the following projects: Houtan Park Shanghai, China (Turenscape 2011 [77]); Qunli National Urban Wetland, Harbin, China (Turenscape 2014 [78]). At the end of the deck, there is a platform providing seating and with a view and contact with nature at the same time. There is no safety railing as the level of the decking is close to the ground.
The application of the criteria to this option are as follows:
  • Possibility for direct contact with water—2,
  • Accessible design—3,
  • Open view to water—2,
  • Contact with vegetation and wildlife—4,
  • Social interaction—2.

2.5.11. Reed Beds Option 3: Winding Boardwalk with Seating

The intervention consists of a long wooden deck meandering through the reed area, with platforms and sitting areas provided at regular intervals (Figure 16). Inspiration for this intervention came from the following projects: Houtan Park Shanghai, China (Turenscape 2011 [77]); Qunli National Urban Wetland, Harbin, China (Turenscape 2014 [78]). The focus of this intervention is on experiencing contact with nature: vegetation, wildlife, sounds and smells. It has no handrail or safety barrier as it is close to the ground.
The application of the criteria to this option are as follows:
  • Possibility for direct contact with water—2,
  • Accessible design—4,
  • Open view to water—2,
  • Contact with vegetation and wildlife—5,
  • Social interaction—3.

2.6. Development of the Questionnaire

A questionnaire was developed for online application, containing a set of questions about preferences for each alternative and the affordances they provided. The questions were developed in order to test several aspects of the designs ranging from functionality to the ability to obtain contact with water and nature. These aspects were chosen to reflect the different benefits obtained from blue spaces as identified in Reference [64] and also to reflect how we would anticipate respondents reacting to the features of the designs we included from the application of the design criteria. These—Questions 2–10—when combined, functioned as the predictor variables in the later statistical analysis (see Section 3.3). Each option was shown to the respondents as a short video lasting on average 1.5 min (some shorter because the interventions were quick to access and some longer due to the length of the boardwalk, for example). They were shown to each respondent in a random sequence in order to control for the effect of the order of the images on preference. The videos were embedded in the online survey but could be enlarged to be watched at full screen. This meant that while there was no immersive element, the videos moved as if the observer was walking along, looking around, and even being in the water so that full testing and appreciation of each option was possible.
The questions were mostly in the form of statements with a Likert scale (1–5) and respondents were also asked which was their most preferred and least preferred option. There was also room for adding qualitative remarks all through the survey steps (which were subject to qualitative analysis). It was available in Estonian and Russian; a summary is provided in Table 2. The full survey structure can be found in the Supplementary Materials B (the version also has the original English version embedded within it).
The survey started with a video of a walk from the nearby housing area to the beach in order to familiarise the respondents with the experience of the virtual model, after which the videos of each intervention design were shown and questions about each were asked. Respondents were not told of the actual location that the landscape was modelled after, so they were responding to a hypothetical site near their imaginary home.

2.7. Ethical Approval

Since the Estonian University of Life Sciences does not have its own ethical approval process for human studies, a University of Edinburgh level 1 ethics review was carried out which determined that as no sensitive or personal data were collected, people under 18 and ‘vulnerable groups’ were excluded from the sample; formal ethical approval was unnecessary.

2.8. Survey Administration

The online survey was run by Norstat (Norstat Eesti AS, Tallinn, Estonia), a survey company based in Estonia. The company took the questionnaire structure, programmed the interface, and recruited and controlled the target respondent profile. We requested a quota sample so that we could test the impact of the interventions primarily on different gender and age groups. Although not requested in the proportions, a number of Russian speakers were also included, as these form a significant proportion of the Estonian population.

2.9. Participants

The participants were from all over Estonia and both Russian and Estonian speakers. A total of 252 people completed the survey. The desired profile was achieved (see Figure 17) with male and female participants equal in number and balanced reasonably closely for each age group.

2.10. Analysis of the Data

We undertook three main types of analysis: we used descriptive statistics to explore the preferences of the respondents for each of the nine options both as their most and least preferred selections and against the different affordances we identified (feeling comfortable, relaxed, having direct contact with water, etc.). Then, we went into more depth with a set of correlations to see what aspects of the designs would tend to be associated with preferences and how strong this association would be, as well as to determine relationships associated with respondents’ age, gender or degree of INS (inclusion of self in nature). Finally, we extracted all the comments from the respondents and performed a qualitative thematic analysis—the numbers of comments in relation to each theme, the content analysis and identification of the main aspects which emerged. These are reported with some illustrative quotations. This approach, of combining quantitative and qualitative results, enabled us to explore the subject in depth as well as breadth and find out more about the perceptions and values of using VR as a participatory tool.

3. Results

3.1. Quantitative Analysis: Descriptive Statistics

In this section, we examine the results of the preferences for each of the interventions (by the three groupings) overall, including the gender and age differences, and in relation to the different questions.

3.1.1. Overall Preferences for the Design Options

Here, we present the overall pattern of preferences based on the numbers of respondents who judged the options as their most or least preferred (Figure 18). This shows a very distinctive pattern, with Beach 3 and Beach 1 being the most favourite by far and Beach 2, Cliff 1 and Reeds 1 and 2 being the least favourites.
When we break it down into preferences among different age groups, we see a different and very divergent pattern (Figure 19A,B). A chi-square test between age group and the most favourite χ2 (40, N = 252) = 68.501, p = 0.003) and the least favourite design option χ2 (40, N = 252) = 57.501, p = 0.036) confirmed that preferences are not independent of age group. We can see that preferences shift, with Beach 1 being most popular by far with the younger ages—this is the main swimming enclosure out in the bay—while Reed 2 and Beach 3 are least popular. As the age increases, the preference for Beach 1 gradually declines and that of Beach 3 increases. The other intervention designs display fluctuating fortunes with not much in a way of a pattern compared with the competition between Beach 1 and 3. Chi-square tests between gender and most favourite and least favourite designs were not significant.
In the next section of results, we calculated the mean scores of the Likert-scale results (where 1 was the least preferred and 5 the most preferred options) and present these in a series of tables where we highlight the strongest preferences with a darker colour. We also include the standard deviations, with the larger deviations (representing the wider ranges of scores around the means) in a similar graded colour for ease of understanding.

3.1.2. Spending Time at Each Site

When we look at how much time respondents would be willing to spend during a visit taking place every day or a couple of days (Table 3), we find that Beach 3, followed by Beach 1 and then Reed 3—also with lower standard deviations—have the highest preferences while Reed 2 and Cliff 1 have the lowest preference scores. These can be associated with the presence or absence of seating and the potential for direct access to water. Chi-square tests between gender and responses to spending time at design options all returned non-significant results. Chi-square tests between age groups and the preferred amount of time spent on site had significant results in many cases with older groups willing to spend less time at these designs. Notably, beach intervention 3 yielded the highest time-spending responses with no differences between age groups.

3.1.3. Perceived Site Comfort

For the question on site comfort (Table 4), Beach 3 and Beach 1 followed by Reed 3 also stand out as most preferred while Reed 3, Reed 2 and Cliff 1 have the lowest average preferences—also with lower standard deviations. Cliff 1 and Reed 2 have the lowest preferences—with lower standard deviations—also associated with designs offering less seating. Chi-square tests did not have significant results for gender but age groups showed significant differences for cliff options 2 and 3, beach option 1 and all reed options, though without any distinctive unidirectional pattern between age and comfort.

3.1.4. Enjoying the View

The responses to this question (Table 5) are very different from the first two questions. The means are greatest for Cliff 1 Beach 3, Cliff 2 and Beach 1, all with fairly low standard deviations. Cliff 1 option is the only one where view enjoyment is significantly affected by gender χ2 (4, N = 252) = 11.073, p = 0.026 with women reporting higher enjoyment. The reed options show a generally less-positive pattern—probably because extensive sections of each are confined within the reeds and only at the end does the view open. This was, however, a specific part of the design. While not the case with other options, Reed 1 and 3 options show clear difference among age groups as well with younger respondents reporting higher enjoyment χ2 (20, N = 252) = 61.257, p = 0.000 and χ2 (20, N = 252) = 47.972, p = 0.000, respectively.

3.1.5. Feeling Close to Nature

This question reveals some differences from the trends of previous themes (Table 6). This time it is Reed 3 which scores highest followed by Beach 3—with corresponding lower standard deviations, with all the rest being below the mean. Here, the age differences are prominent as well with younger groups reporting feeling closer to nature than older—χ2 (20, N = 252) = 44.023, p = 0.001 for Reed 1; χ2 (20, N = 252) = 46.385, p = 0.001 for Reed 2 and χ2 (20, N = 252) = 53.176, p = 0.000 for Reed 3. Chi-square tests for gender did not have significant results.

3.1.6. Feeling Safe and Protected from Danger

As far as feeling safe is concerned (Table 7), Beach 1 and 3 followed by Reed 3 and 4 all tend to have the higher scores (and with lower standard deviations), although the means for all are in higher than the middle scores of 3. This suggests that all locations are fairly but not very safe in general—there are more nuances if age was taken into account—the chi-square tests are significant for all but Beach 1 and Beach 3, but there is no straightforward linear pattern of relationships between age and feeling of safety. Responses did not differ by gender of the respondents in any of the cases.

3.1.7. Feeling Relaxed and Less Stressful

For this theme, feeling relaxed and less stressful (Table 8), it is Beach 3 that stands out, followed by Reed 3 (again, with relatively low standard deviations), although all options are rated above 3. Chi-square tests for gender effect revealed no significant results, while age group differences were significant but without any clear pattern of relationship.

3.1.8. Spending Time with Family and Friends

When it comes to the potential to spend time with family and friends (Table 9), it is Beach 3 that stands out as most highly rated on average (with a lower standard deviation), while Reed 1, Reed 2 and Cliff 1 are below average (although with higher standard deviations suggesting that there was a wider range of scoring overall for these).

3.1.9. Watching and Interacting with Wildlife

For watching and interacting with wildlife (Table 10), the highest-rated options are Reed 3, Beach 3 and then Reed 2 and 1—with the lower standard deviations). This is probably because they are in the most natural part of the overall site and between dense vegetation it would be possible to see various wildlife quite easily.

3.1.10. Making Direct Contact with Water

This variable is an important one given the focus on blue spaces in the research (Table 11). Beach 3 is the highest overall scorer followed by Cliff 2, Beach 1 and Cliff 3. Looking at responses within age groups, there are significant differences (for Cliff 2 χ2 (20, N = 252) = 65.807, p = 0.000; for Cliff 3 χ2 (20, N = 252) = 56.194, p = 0.000) with younger groups judging water access better than older groups.
For the beach options, it might be expected that Beach 1 (with the special swimming enclosure) would be the highest scorer followed by Beach 2 (which is right at the water’s edge) and then Beach 3, but this is not the case. Age groups respond similarly in the case of Beach options 2 and 3; Beach 1 has significant differences with older respondents judging water access to be poorer than the younger groups χ2 (20, N = 252) = 33.938, p = 0.027.
The reed options have a flatter profile apart from Reed 1, which scores very low for this factor, probably because it is the only one where there is a railing and mesh preventing anyone from stepping off the deck. Age groups respond similarly in case of Reed options 1 and 3, while Reed 2 has a significant chi-square result χ2 (20, N = 252) = 35.925, p = 0.016 with older groups giving high water accessibility scores less often (despite the fact that there are no physical barriers and the surface is right at the same level with water).

3.1.11. Accessibility of the Design

For accessibility (Table 12), Beach 3 is once again the highest scoring option—with the lowest standard deviation—although Beach 1, Cliff 2 and 3 also perform well. However, all options are scored on average above 3, meaning that they are all generally seen as accessible by a majority of respondents.

3.1.12. Willingness to Make a Return Visit

This final set of responses is seen as confirming the extent to which people find the options attractive and worth coming back again. Responses for all designs are net positive (Figure 20) but beach option 2 and reed options 1 and 2 stand out as being the least positive overall (which aligns with the rating of the most favourite and least favourite designs, Figure 18). Beach option 3 has the best responses and it is the only case where all age groups react similarly (non-significant chi-square test). It has consistently been the most preferred or highest-rated for many of the variables tested—and it is the simplest and least ambitious intervention of all.

3.2. Demographic Characteristics and Differences

Before proceeding with further analysis, we tested the intra-class correlation (ICC) on responses to questions 1 to 11 with a two-way mixed-effects model, testing for consistency in order to obtain an overview of the reliability of the respondents as a sample. The results for average measures showed very good reliability with ICC (3, k) of 0.994, 95% CI [0.992, 0.996], F (98, 24598) = 167.765, p < 0.001.
While performing the cross-tabulation analyses earlier, we tested for potential differences among the respondent groups. With respect to gender, the chi-square test almost always returned a non-significant result, but age group differences often had significant chi-square results with frequency counts suggesting a declining trend in response levels with the increase in the age group. This prompted us to check for correlations between age groups’ responses to questions 1 to 11 for the nine design options (Table 13). In many cases, we could see significant albeit small negative correlations confirming that older respondents often tended to rate design performance on different aspects lower than their younger counterparts. With the case of the design that performed best—the Beach 3 option—a column of non-significant correlations stands out, suggesting that the best design option scored similarly among all age groups. Scores for option Cliff 1 also exhibit some agreement between age groups with the smallest correlation values and two non-significant results. Conversely, design options Cliff 2 and Cliff 3, Beach 1 and Reed 1 exhibit stronger disagreements in responses depending on age with the perceived ability to make direct contact with water on Cliff 2 and Cliff 3 designs being inhibited the most. Looking at the rows in Table 13, the ability to make contact with water stands out even more, with multiple non-significant cases indicating that sometimes response levels to that factor tend not to be associated with age. At the same time, the cases where correlations are significant are for interventions where access to water has been enhanced by different design solutions. Among other factors that also seem to be related to age are willingness to spend time with others, the perceived ability to be able to relax and to enjoy views.

3.3. Quantitative Analysis: Predictive Statistical Results

From the point of view of relationships between the items on this study, questions 1 and 11 (see Table 2); 13 and 14 (most favourite and least favourite design) can, on the one hand, be regarded as outcome variables measuring the general success of the design options. Questions 2 through 10 (Table 2) on the other hand could be regarded as predictor variables—the specific features or affordances of the design that should help determine the success of the designs. We tested the reliability of predictors as part of a “composite affordance scale” with Cronbach’s alpha, which was very high and quite similar throughout the 9 trials ranging between 0.935 and 0.958. Questions 2 to 10 did seem to gauge on meaningful aspects of affordances in the virtual landscapes of this study and the wording of questions seemed to produce consistent responses in our 252 respondents. Looking at the composite affordance mean scores and standard deviations (Table 14), it is possible to see the designs with the best affordances—where Beach 3 stands out once more overall. It is also possible to judge the amount of variation among individual responses and on the rank order of which of the design options yield better or worse composite affordances.
In order to delve into the trends and results depicted in the descriptive statistics, we ran a set of correlations in order to test the relationship between the composite affordance scale components and two outcome responses (length of free time that respondents stated that they would like to spend at each intervention and their likelihood of revisiting each if they had the chance). Kendall’s tau b correlations were run separately for all designs (9 trials), all correlations were positive and significant (p < 0.01 in all 162 cases), but the strength of correlations varied (Table 15). Higher responses to questions on affordances were associated with higher responses to outcome responses, but it is important to point out that positive correlation also means that if people were responding with low scores to affordances (Q2… Q10), they would also give low scores to Q1 and Q11 (associated with spending less time and less likely to make a return visit).
It is also possible to look at the strength of correlations and rank order the affordances. This can give an insight into which affordances among Q2… Q10 are generally more correlated with the outcome responses and identify possible patterns of relationships. Looking at three highest-ranking correlations with question 1, the judgement as to whether to spend a longer time at the place is best associated with scores on site comfort and affordances of the site for spending time with family and friends and relaxation (questions 2, 7 and 6). Similarly, the willingness to come back for a return visit is best correlated with affordances for spending time with family and friends and site comfort, but the strength of the association is generally smaller. The weakest correlation (still significant at level p < 0.01) with the willingness to spend time and come back for a return visit is often with question 10 (“How accessible do you think this design is?”). Feeling safe and the ability to make direct contact with water are also weakly correlated to visit outcomes.
Next, we repeated the correlations with only those respondents who expressed an INS (Inclusion of Nature in Self) score [28] in the lowest third of the range for their willingness to spend time or re-visit the interventions. This revealed some interesting differences (Table 16). The correlations tend to be smaller, are not always significant and the rank order is much less clear. This suggests much less predictability in this sub-group—they seem to prefer a disparate range of affordances with no clear pattern.
Next, we took the respondents with the highest range of INS score and carried out the same set of correlations (Table 17). Here, the correlations tend to be much higher than for the correlations expressed for all respondents (Table 15). Highest ranking correlations with question 1, the judgement as to whether to spend a longer time at the place is best associated with scores on site comfort and affordances of the site for spending time with family and friends (questions 2, 7). Besides feeling relaxed (question 6), the feeling of being close to nature (question 4) is notable in this specific group. Willingness to come back for a return visit is best correlated with questions 2 and 7 again, but generally, the correlation pattern is more varied. The weakest correlation with a willingness to spend time and come back for a return visit is often with questions 5, 9 and 10 about feeling safe, the ability to make direct contact with water and accessibility of the site.
Testing out different levels of access to water is perhaps the central part of the virtual designs, yet responses to question about the ability to make direct contact with water are not so well associated with the popularity measures of the designs. Thus, we correlated gender, the INS score and importance of access to water against Question 9 “I could make direct contact with water (touch or enter the water)” for each design option (Table 18) (the same correlation with age has already been covered in Table 13).
Assessment on whether respondents feel they can interact with water is not associated with gender except for one case, the Reed 2 intervention. Assessment of possibilities to interact with water was not associated with respondents’ INS score either. Whether a person feels more or less connected with nature does not seem to be associated with higher or lower water accessibility scores. Notably, the correlations between judgements of water accessibility and respondents’ own determination on how important they feel water accessibility to be are in almost all cases significantly positively correlated. People who say that having direct contact with water is important to them also think that these virtual interventions provide more opportunities to interact with water, while respondents who rate water access as less important also report lower accessibility to water.

3.4. Qualitative Analysis

The basis for the findings of the qualitative analysis is from the many comments made by the respondents in justification of their points for or against any design intervention, an opportunity made available in the questionnaire. Not all the participants gave comments and some commented on only a few designs. People tended to comment if they either liked or disliked something very much. Furthermore, they conveyed their mixed views, insights and suggestions for improvement of the projects. In the sections below we describe aspects that were emphasised, the rate of liking and disliking and what else was mentioned beyond the rating scores for the interventions.

3.4.1. Frequency of Statements Liking and Disliking Specific Options

Mostly, we found that it was people who had issues about understanding the virtual models or disapproved of some designs or aspects of designs who tended to explain their ideas in the comments. Thus, it is perhaps not surprising that the rate of negative comments is higher than that of the positive ones. There were 923 comments in total, 27.7% of the comments disclosed positive preference or liking of the designs, 40.2% expressed complete dislike of the option or something specific about it and 16.0% of the comments were mixed evaluations where people had both positive and negative comments (see Table 19).
Design option Beach 2 was one of the most commented options that received many positive and also negative remarks. People who could relate to the material and playfulness of the scenario seemed to like it very much, as one 70+ man commented: “I would visit this place with my grandchildren. The children would be involved and I would do well to follow them”.
Similarly, with option Cliff 3, when someone understood the functionality of the design, they tended to have more positive feelings about it. As one of the 50–59 participants commented: “In the absence of a large sandy beach, this approach is one of the best—access to water and sunbathing facilities—despite the rocky beach strip. It is also suitable for social events. A platform that reaches into the water seems like an interesting solution”.
Many of the comments, however, revealed problems of understanding or interpreting the design intentions of the options. As the simulation was somewhat basic in terms of the level of realism available and lacked the possibility to interactively explore the virtual environment, receiving comments on the struggle of some participants to imagine the real situation by interpreting the videos was revealing. Sometimes this struggle to understand the real situation drove people towards making negative comments. For example, one 18–29 woman mentioned about Beach 1 design: “I didn’t understand if there was asphalt or water around. If it is water, it would be an interesting solution”. Another 60–69 woman stated for the design option Reed 2: “I did not understand how to get to the water. Otherwise, the route there is good”.
The design receiving most of the comments about the struggle with understanding was Beach 2 (see Table 19) which, as we saw in the descriptive statistics, suffered from lower preference scores (Figure 18 and Figure 20) and larger variability in responses (large standard deviation, Table 14) as well. People were really puzzled with the sculpted marine plywood climbing structures. One 18–29 woman commented: “It is not clear what kind of brown slides these are, if it is a skate park; it is not clear how close it is to the water”. Another 40–49 woman commented: “What are these piles? I don’t understand their purpose. Where is the waterline?”

3.4.2. Impact of the Scale of the Interventions

The scale and extent of the interventions seemed to have a noteworthy impact on the comments the respondents made. One hundred fifty-nine of the 923 comments addressed the scale of intervention as an important fact for feeling comfortable or not feeling the design to be compatible with expectations. It is important to appreciate that people participating in the experiment were often able to judge designs in the real landscape scale and they also showed their understanding of the accommodation capacity of each. For example, one 30–39 man mentioned, in relation to Cliff 1: “It’s a place for one family only”. An almost identical comment about Reed 2 option by a 60–69 woman read: “It’s like a private platform for one family”. These comments show they did not find the place uncomfortable or unsafe or unwanted, rather they understood its scale and thought it would work only if one family occupied the place at a time. As for Cliff 3 option, some people showed concern about its size and thought it could result in an uncomfortable situation where it could become crowded which might also hamper their sense of privacy. Moreover, for designs Cliff 2 or Beach 1, people also made complaints about the size or scale of intervention because those looked huge and had a large impact on nature.
Among all the design options, Reed 3 received the most negative comments or suggestions based on the physical length of the intervention. Some also expressed frustration that after traversing a long distance towards the beach, they wanted to go directly into the water and not to end the journey at a platform within the edge of the reeds. Here, we should remember that some of the designs extended a long way out just to reach either the waterline (Reed options 1 and 3) or a sufficient water depth for swimming (Beach option 1).

3.4.3. Impact of the Material and Functionality

A lot of people expressed the opinion that a specific design was ‘artificial’ or ‘very urban’ because of the materials used. Some doubted that structures would last long in the water or wet weather or questioned the cost of using building materials on such a large extent.
For the Reed options 1 and 3, most of the people disliked the fact that the path ended just when it reached the beach. The functionality of the path was disapproved by many as they wanted some interaction with the water. Some comments related to Reed 1 (Table 19) suggested adding some steps for descending to the sandy beach and not to put a barrier there.
People who liked the designs, materials and railings had good things to say irrespective of gender or age group. It could be assumed that the older people would tend to like the safety provided by the railing more but that cannot be generalised in this survey. Sometimes, the younger people seemed to like the railings more while older people complained that it separated them from nature. One participant from the age group 18–29 had an opinion on Reed 1: “Very diverse and beautiful. You could combine all sorts of options to have something for everyone. Netting fences and a road above the ground would protect against animals”. A 40–49 respondent commented on Reed 3 option: “The lack of handrails, that’s not safe for children nor people with motor and balance problems”. Another 18 to 29 commented: “most probably handrails are necessary”.
The functionality of seating—either presence or lack of it and on benches or other structures—was commented on almost exclusively by women. In the case of Reed 3, the curved benches along the trail drew most of the positive remarks: “I’d visit once a year, just to see how surroundings have changed. It’s good that there’s been a thought of providing resting opportunities for feet (70+ woman)”.; “It’s good that there’s opportunity for a longer walk and if there’s desire to sit for a while, the opportunity is there. It’s bad, that for returning you have to walk exactly the same way—it would be nice to have another track to reach back to another location (30–39 woman)”. Lack of seating opportunities was lamented more by the younger respondents. For example, a 30–39 woman commented on Cliff 1 option: “It would be nice to divert from the walking path and make a stop at the viewing platform. It’s a shame there’s nowhere to sit”. Another 30–39 woman commented on Reed 1 option: “Lack of seating and resting opportunities is blatantly obvious—it’s a really long walk for people with motor difficulties”.
Although many people did not like Beach 2 design in general, the overhanging roof was much appreciated. Respondents recognised the possibility to shelter from the sun and rain. For example, a 30–39 woman commented: “It’s good—should rain come or sun be too harsh, it would be possible to seek shelter. It’s large enough to accommodate many people. It would be possible to spend a longer time here, and even play a board game with friends”. A 50–59 man said: “I don’t understand the purpose of these dark bumps, but the sheltering roof could be used even more expansively”. Moreover, the sheltering opportunities were requested for some other designs as well. An 18–29 man commented on Reed 2 option: “I suggest to add an open gazebo to that ending platform” and a 40–49 woman seconded: “A roof is need for shelter from rain and sun”.

3.4.4. Mixed Opinions and Thoughtful Insights

People who had mixed opinions also provided comments with very revealing insights and thought-provoking facts which have the potential to lead the designer towards a more workable solution. Some valuable comments could save wasting money by catching design problems early on. The mixed views can be noted as some of the most useful practical outcomes of the experiment.
For example, of one of the most sensitive mixed opinions, one 60–69 person commented on Beach 3: “I would come here with my family for a couple of hours for sunbathing and walking along the water. It looks like an ordinary beach. Most likely, we would move out from this location further away to where the denser forest vegetation is visible”.
Quite often a single design intervention was partly disliked and partly liked at the same time and some of the comments also suggested how the design could have been improved. For example, a 60–69 male commented on Beach 1 design: “An interesting solution (in principle), but too much depends on various additional factors: the total number of people, the availability of lighting, litter bins, law enforcement patrols, video surveillance, the prevention of vandalism, etc.”. Addressing both the negatives and positives in her comments, one 50–59 woman suggested for Reed 3: “A good thing is that there are several places for stopping and resting on the long boardwalk to the beach. It’s bad that there’s a step at the end of it when you reach the sandy beach, it should rather be a sloped ramp that ends smoothly in the sand”. Furthermore, one young woman suggested about Cliff 1: “If this were larger and had a seating opportunity, it would be possible to stay longer. At the moment I would go there, enjoy the view for a moment and move away. If you could sit, you could bask in the sun or chat with someone”.

3.4.5. Concern about the Interference of Designs in Nature

Interfering in the natural setting seems to be a very crucial aspect for many of the respondents as they mentioned this as their reason for disliking a design. Many respondents found the designs very artificial or polished and one respondent called them ‘pompous’. Roughly one-fifth of all comments was that nature is harmed due to man-made interventions. These included some opinions where people completely disapproved of any development. For example, one 40–49 woman expressed her opinion rather strongly: “Why should you set such properties on the beach and destroy natural unity. It’s scary. Well, why? People come to the beach to relax and enjoy nature, not to experience any artificial attributes”. A 30–39 man had a ruder way: “Do you want me to report you to the Police?”
Some respondents disliked certain interventions for artificiality and remoteness from nature but they were simply phrased as “too urbanised” or “too artificial environment” in their comments, while some respondents tended to elaborate on their stand on disliking any intervention when it came to compromising nature. A comment by a 50–59 man: “It is pointless to artificially cover nature so that you can stay in nature. Instead of building these covered squares, put in trash bins, changing cabins, benches and tables for that money. People who do not want to sit in the sand could sit on a bench or use a table for having a picnic or playing chess on the beach, etc. It is criminal to take down the forest for money and just dump it (decking planks) in the wild for even more expensive money”.

4. Discussion

4.1. Results in Relation to the Research Objectives

The first of our research objectives was to test the use of virtual models in evaluating design proposals for achieving access to blue spaces (within the size range represented as “urban acupuncture”). Judging by the content of the comments, we found that people participating in the experiment were often willing to look beyond visualisation accuracy, contrary to the feedback received by Jiang et al. [59] in their study where the quality of the visualisation and sound was heavily commented. They were also able to judge designs at the real landscape scale and they also showed their understanding of the accommodation capacity of each design. Beach 3 design was the only one that received net positive comments. People liked the fact that it could be used for events as well as regular beach activities (i.e., sunbathing) without getting too sandy. Beach 2 design received the most comments indicating a struggle to understand the design. Respondents could not figure out the plywood sculptures there. Another problem also presents in other designs was poor visualisation of water.
The second objective was to test what elements of designs in different settings offered the greatest benefits to users. Affordances that were best associated with a design option’s popularity (spending longer at the site and a willingness to come back for a return visit) included perceived comfort, the suitability of a site for spending time with family and friends and the possibility to relax. The affordance of nature contact (feeling closer to nature and the ability to watch or interact with wildlife) had slightly weaker correlations. Indicating a more individual response pattern, the smallest associations were with perceived accessibility, feeling safe and perceived ability to make direct contact with water (an indication of the individuality of that aspect). Respondents with a stronger connectedness to nature had even higher correlations but the ordering of the correlations was very similar. Respondents who expressed weaker connectedness to nature also had a much weaker and less coherent pattern of association between various site affordances and design option’s popularity. Apart from site comfort and the possibility to spend time with family and friends, they seemed to prefer a disparate range of affordances. Our findings agree with the literature as postulated by, e.g., Berto et al. [30], Martin et al. [31] or Ojala et al. [32].
Reed 1 received the largest share of negative comments that were critical of the length of the boardwalk, lack of seating, narrowness and lack of possibility to access water after a long walk. Reed 2 also attracted a large share of negative comments that were critical of its small size being unable to accommodate more than a few people at a time. Although many people did not like Beach 2 design in general, the overhanging roof was much appreciated. Respondents recognised the possibility to shelter from sun and rain. Sheltering opportunities were also requested for some other designs. The functionality of seating—either presence or lack of it and on benches or other structures—was commented almost exclusively by women and the lack of seating opportunities was lamented more by the younger respondents.
The third objective was to explore the variation in preferences expressed by different groups of respondents. Gender did not have any meaningful impact on these results but age often did. Older respondents often tended to rate the designs’ performance on different aspects lower than their younger counterparts. Notable exceptions to this trend, indicating more individual responses, were the most popular design option Beach 3 (where none of the questionnaire items had a significant correlation with age) and responses to the question on access to water (where some of the design options had a non-significant correlation). Notably, the perceived ability to make direct contact with water was also unrelated to a persons’ connectedness to nature but was associated with the reported importance of that factor. This suggests that people who, regardless of gender, age and connectedness to nature, find access to water important also realise potential possibilities to interact with water more easily.
Although there is plenty of evidence that contact with nature, including blue space, is important for stress reduction and well-being [2,3,6,11,12,13,14,15,16,17,20], our results suggest that other factors might be even more important for making a decision to make a return visit and spend longer at a “park near water”. Perceived comfort of the site and suitability to socialise with family and friends stand out, this latter point conforming with that of Ashbulby et al. [8]. Interfering in the natural setting also seems to be a very crucial aspect for many of the respondents as they mentioned this as their reason for disliking a design. While many respondents found the designs very artificial, others were happy with them, a variability also found in studies such as that of Vessel et al. [26]. The comments made about interference with or over-development in nature fit with the recreational planning and design approach of the, e.g., US Recreational Opportunity Spectrum, which tries to minimise human interference in natural landscapes to meet the desires of different visitors [36].

4.2. Limitations

From the results presented in previous sections, we can see that the method of using virtual models to elicit responses to different design options has a lot of potentials and that it offered a reasonably effective way of uncovering preferences. Owing to the limitations caused by the Covid19 outbreak for inviting people in person to immerse themselves in the VR experience and to discuss the design options directly with the design team—where we would have expected a more open and in-depth debate of the pros and cons of each option—we were forced to rely on the online survey by itself. This allowed us to obtain a very satisfactory sample of responses representing different age groups and gender and so also a good number for the application of statistical analysis which helped to reveal some fascinating similarities and differences. However, the reliance on the respondents own screens to depict the videos which, if small, could have limited the resolution and consequently the degree of understanding of each option is something to think about for future application. This also limited the degree of VR immersion possible.
We can see from this study that, since design always has to be context- and place-dependent, there are many potential design solutions and so a generalisation is not possible. However, it was possible, despite the limited and specific alternatives we developed, to see a key number of aspects to emerge since there was a statistically strong pattern of preferences and levels of satisfaction among the respondents for the designs they particularly liked or disliked. This has to be viewed with caution, however, since the qualitative results—which also revealed some strongly held views—showed that there were some problems with interpretation of the modelled landscapes and designs, limiting the confidence in the conclusions which could be drawn, especially in relation to some specific designs such as Beach 2.
If fully immersive VR is to be used for such testing, there need to be some means of improving the readability of the designs—for scale, for function and for materials used, perhaps by introducing some movement into the elements such as water, and means of acquiring the design context possibly by the narration or the facilitator that explains the design while it is being experienced. One of the additional benefits of VR is to be able to select a route, viewing angles, length of time to pause or stay at a particular spot and also to have a sense of control over the experience, much as one would have on a real visit to a real place. In the experiment, it was necessary to pre-record the videos and to limit the time for experiencing the design options within the practical limitations of a survey—where respondents can become bored or frustrated and drop out of the study. In the case of several of the design options, which contain long sections of the boardwalk leading to the water, it was necessary to limit the videos and to jump from point to point so as to be able to provide a comprehensive overview of the anticipated experience a visitor would obtain. This probably limited the understanding and may have affected the preference to some extent, which would not necessarily have been the case if the VR was shown live and with some control in a VR theatre, for example.
So far, the use of VR has been carried out experimentally in limited ways. It has been tested as a tool for public participation [42]—which to some extent can be defined as part of our experiment—and some different modes of testing preferences comparing VR to other methods have been carried out [43]. So far, few experiments of the type we present have been undertaken.
One of the challenges for using VR in relation to blue space research is the depiction of water. While vegetation does move to some extent, for example, trees or reeds blowing in the wind, to see it more statically is also not a problem. However, water is usually moving to some degree and its specific reflectiveness, transparency and translucency and the way that shadows are cast into it provide challenges which some advanced software can solve but which in the programme we used is rather limited. This partly accounts for why some respondents expressed problems with understanding if a surface was water or asphalt—and which may have affected their preferences for some of the designs.

5. Conclusions

The aim of the study was to test the use of virtual models in identifying key aspects to take into account in developing designs for achieving access to blue spaces. The study revealed five main findings:
  • The use and application of VR as a tool for testing design interventions before detailed design and construction has merits and the comments offered by respondents were very valuable as a means of obtaining useful feedback, as long as the respondents understood what the intervention was, which raises issues of realism or clarity in the VR models.
  • There are limitations to the use of virtual models, at least in the degree of realism used in this study. Failure to understand materials or surfaces (including whether a surface was water or not) or the purpose of some elements probably led to some of the differences in the preferences for some of the interventions—Beach 2 being a specific example of this.
  • There needs to be a balance between the scale of the development and respecting the natural characteristics of the place: creating the swimming area required, in this case, a long boardwalk out to sea which made the intervention practical but also dominating the site. When applying the concept of urban acupuncture, it is important to respect the scale of the landscape and to keep designs modest but occasionally practical issues force the issue.
  • Comfort, relaxation and sociability come higher on the list of key affordances than water access—but probably it is a matter of priorities since there were statistically significant relationships with all factors and with preferences.
  • Designs with seating were generally rated more highly than those without, suggesting that this is the most important affordance that can be provided in any setting.
  • Younger age groups were much more invested in access to the water than older people. Thus, different design ideas could/should be aimed at different user segments.
The very honest and critical feedback received from the participants is important for designers and should lead us to try to ensure a clearer depiction or explanation of the design in the model while preparing them for public consultation or engagement, which is why identifying the reasons behind those gaps in understanding are essential to be addressed. This type of experiment, therefore, helps designers take account of constructive negative feedback before implementing a design. A tendency for respondents to argue with the given situation each time brought out different insights and possibilities for improving public engagement and understanding related to certain design interventions and also the use of VR at the same time. As noted by Lovett et al. [40], visualisation methods used are not independent of project objectives, identified target audience and the planning process itself. Our project was purely a thought experiment and if such an approach is to be used in real life, further considerations might need to be applied to make it a more effective tool.

Supplementary Materials

The following are available online at https://www.mdpi.com/2071-1050/12/24/10656/s1. Supplementary Materials A: Generation of the landscape model; Supplementary Materials B: Questionnaire.

Author Contributions

Project supervision, structure and drafting main text: S.B. and P.V.; literature review and discussion: S.B. and P.V.; development of the design approaches and criteria: J.B.; project design development: U.A.A.A.; landscape model development: P.V.; statistical analysis: P.V.; qualitative analysis: U.A.A.A. and P.V. All authors have read and agreed to the published version of the manuscript.

Funding

This project has received funding from the European Union’s Horizon 2020 research and innovation programme under grant agreement No 666773.

Conflicts of Interest

The authors declare no conflict of interest.

References

  1. Grellier, J.; White, M.P.; Albin, M.; Bell, S.; Elliott, L.R.; Gascón, M.; Gualdi, S.; Mancini, L.; Nieuwenhuijsen, M.J.; Sarigiannis, D.A.; et al. BlueHealth: A study programme protocol for mapping and quantifying the potential benefits to public health and well-being from Europe’s blue spaces. BMJ Open 2017, 7, e016188. [Google Scholar] [CrossRef] [PubMed] [Green Version]
  2. Völker, S.; Kistemann, T. The impact of blue space on human health and well-being—Salutogenetic health effects of inland surface waters: A review. Int. J. Hyg. Environ. Health 2011, 214, 449–460. [Google Scholar] [CrossRef] [PubMed]
  3. Völker, S.; Kistemann, T. Reprint of: “I’m always entirely happy when I’m here!” Urban blue enhancing human health and well-being in Cologne and Düsseldorf, Germany. Soc. Sci. Med. 2013, 91, 141–152. [Google Scholar] [CrossRef] [PubMed]
  4. Gascon, M.; Zijlema, W.; Vert, C.; White, M.P.; Nieuwenhuijsen, M.J. Outdoor blue spaces, human health and well-being: A systematic review of quantitative studies. Int. J. Hyg. Environ. Health 2017, 220, 1207–1221. [Google Scholar] [CrossRef]
  5. White, M.; Smith, A.; Humphryes, K.; Pahl, S.; Snelling, D.; Depledge, M. Blue space: The importance of water for preference, affect, and restorativeness ratings of natural and built scenes. J. Environ. Psychol. 2010, 30, 482–493. [Google Scholar] [CrossRef]
  6. Barton, J.; Rogerson, M. The importance of greenspace for mental health. BJPsych Int. 2017, 14, 79–81. [Google Scholar] [CrossRef] [Green Version]
  7. White, M.P.; Elliott, L.R.; Taylor, T.; Wheeler, B.W.; Spencer, A.; Bone, A.; Depledge, M.H.; Fleming, L.E. Recreational physical activity in natural environments and implications for health: A population based cross-sectional study in England. Prev. Med. 2016, 91, 383–388. [Google Scholar] [CrossRef]
  8. Ashbullby, K.J.; Pahl, S.; Webley, P.; White, M.P. The beach as a setting for families’ health promotion: A qualitative study with parents and children living in coastal regions in Southwest England. Health Place 2013, 23, 138–147. [Google Scholar] [CrossRef]
  9. Korpela, K.M.; Ylén, M.; Tyrväinen, L.; Silvennoinen, H. Favorite green, waterside and urban environments, restorative experiences and perceived health in Finland. Health Promot. Int. 2010, 25, 200–209. [Google Scholar] [CrossRef] [Green Version]
  10. Völker, S.; Kistemann, T. Developing the urban blue: Comparative health responses to blue and green urban open spaces in Germany. Health Place 2015, 35, 196–205. [Google Scholar] [CrossRef]
  11. Frumkin, H.; Bratman, G.N.; Breslow, S.J.; Cochran, B.; Kahn, P.H.; Lawler, J.J.; Levin, P.S.; Tandon, P.S.; Varanasi, U.; Wolf, K.L.; et al. Nature Contact and Human Health: A Research Agenda. Environ. Health Perspect. 2017, 125, 075001. [Google Scholar] [CrossRef] [PubMed] [Green Version]
  12. Hartig, T.; Mitchell, R.; de Vries, S.; Frumkin, H. Nature and Health. Annu. Rev. Public Health 2014, 35, 207–228. [Google Scholar] [CrossRef] [PubMed] [Green Version]
  13. Braubach, M.; Egorov, A.; Mudu, P.; Wolf, T.; Ward Thompson, C.; Martuzzi, M. Effects of urban green space on environmental health, equity and resilience. In Nature-Based Solutions to Climate Change Adaptation in Urban Areas: Linkages between Science, Policy and Practice; Kabisch, N., Korn, H., Stadler, J., Bonn, A., Eds.; Theory and Practice of Urban Sustainability Transitions; Springer International Publishing: Cham, Switzerland, 2017; pp. 187–205. ISBN 978-3-319-56091-5. [Google Scholar]
  14. De Vries, S. Nearby nature and human health: Looking at mechanisms and their implications. In Innovative Approaches to Researching Landscape and Health; Ward Thompson, C., Aspinall, P., Bell, S., Eds.; Open Space: People Space; Routledge: Abingdon, UK, 2010; pp. 77–96. ISBN 978-1-138-78793-3. [Google Scholar]
  15. USDA (U.S. Department of Agriculture, Forest Service). Urban Nature for Human Health and Well-Being: A Research Summary for Communicating the Health Benefits of Urban Trees and Green Space; USDA (U.S. Department of Agriculture, Forest Service): Washington, DC, USA, 2018; p. 24.
  16. WHO Regional Office for Europe. Urban Green Spaces and Health—A Review of Evidence (2016); WHO Regional Office for Europe: Copenhagen, Denmark, 2016; p. 91. [Google Scholar]
  17. Public Health England. Local Action on Health Inequalities: Improving Access to Green Spaces; Health Equity UCL Institute of Health Equity: London, UK, 2014; p. 29.
  18. Wood, E.; Harsant, A.; Dallimer, M.; Cronin de Chavez, A.; McEachan, R.R.C.; Hassall, C. Not All Green Space Is Created Equal: Biodiversity Predicts Psychological Restorative Benefits from Urban Green Space. Front. Psychol. 2018, 9. [Google Scholar] [CrossRef] [PubMed]
  19. White, M.P.; Alcock, I.; Wheeler, B.W.; Depledge, M.H. Coastal proximity, health and well-being: Results from a longitudinal panel survey. Health Place 2013, 23, 97–103. [Google Scholar] [CrossRef] [PubMed] [Green Version]
  20. White, M.P.; Pahl, S.; Ashbullby, K.; Herbert, S.; Depledge, M.H. Feelings of restoration from recent nature visits. J. Environ. Psychol. 2013, 35, 40–51. [Google Scholar] [CrossRef]
  21. MacKerron, G.; Mourato, S. Happiness is greater in natural environments. Glob. Environ. Chang. 2013, 23, 992–1000. [Google Scholar] [CrossRef] [Green Version]
  22. Wheeler, B.W.; Lovell, R.; Higgins, S.L.; White, M.P.; Alcock, I.; Osborne, N.J.; Husk, K.; Sabel, C.E.; Depledge, M.H. Beyond greenspace: An ecological study of population general health and indicators of natural environment type and quality. Int. J. Health Geogr. 2015, 14. [Google Scholar] [CrossRef] [Green Version]
  23. Amoly, E.; Dadvand, P.; Forns, J.; López-Vicente, M.; Basagaña, X.; Julvez, J.; Alvarez-Pedrerol, M.; Nieuwenhuijsen, M.J.; Sunyer, J. Green and blue spaces and behavioral development in Barcelona schoolchildren: The BREATHE project. Environ. Health Perspect. 2014, 122, 1351–1358. [Google Scholar] [CrossRef]
  24. Wheeler, B.W.; White, M.; Stahl-Timmins, W.; Depledge, M.H. Does living by the coast improve health and wellbeing? Health Place 2012, 18, 1198–1201. [Google Scholar] [CrossRef] [Green Version]
  25. Ode, Å.; Fry, G.; Tveit, M.S.; Messager, P.; Miller, D. Indicators of perceived naturalness as drivers of landscape preference. J. Environ. Manag. 2009, 90, 375–383. [Google Scholar] [CrossRef]
  26. Vessel, E.A.; Maurer, N.; Denker, A.H.; Starr, G.G. Stronger shared taste for natural aesthetic domains than for artifacts of human culture. Cognition 2018, 179, 121–131. [Google Scholar] [CrossRef] [PubMed]
  27. Kalivoda, O.; Vojar, J.; Skřivanová, Z.; Zahradník, D. Consensus in landscape preference judgments: The effects of landscape visual aesthetic quality and respondents’ characteristics. J. Environ. Manag. 2014, 137, 36–44. [Google Scholar] [CrossRef] [PubMed]
  28. Schultz, P.W. Inclusion with nature: The psychology of human-nature relations. In Psychology of Sustainable Development; Schmuck, P., Schultz, W.P., Eds.; Springer: Boston, MA, USA, 2002; pp. 61–78. ISBN 978-1-4613-5342-3. [Google Scholar]
  29. Mayer, F.S.; Frantz, C.M. The connectedness to nature scale: A measure of individuals’ feeling in community with nature. J. Environ. Psychol. 2004, 24, 503–515. [Google Scholar] [CrossRef] [Green Version]
  30. Berto, R.; Barbiero, G.; Barbiero, P.; Senes, G. An Individual’s Connection to Nature Can Affect Perceived Restorativeness of Natural Environments. Some Observations about Biophilia. Behav. Sci. 2018, 8, 34. [Google Scholar] [CrossRef] [PubMed] [Green Version]
  31. Martin, L.; White, M.P.; Hunt, A.; Richardson, M.; Pahl, S.; Burt, J. Nature contact, nature connectedness and associations with health, wellbeing and pro-environmental behaviours. J. Environ. Psychol. 2020, 68. [Google Scholar] [CrossRef]
  32. Ojala, A.; Korpela, K.; Tyrväinen, L.; Tiittanen, P.; Lanki, T. Restorative effects of urban green environments and the role of urban-nature orientedness and noise sensitivity: A field experiment. Health Place 2019, 55, 59–70. [Google Scholar] [CrossRef]
  33. Mishra, H.S.; Bell, S.; Vassiljev, P.; Kuhlmann, F.; Niin, G.; Grellier, J. The development of a tool for assessing the environmental qualities of urban blue spaces. Urban For. Urban. Green. 2020, 49, 126575. [Google Scholar] [CrossRef]
  34. Bell, S.; Mishra, H.S.; Elliott, L.R.; Shellock, R.; Vassiljev, P.; Porter, M.; Sydenham, Z.; White, M.P. Urban Blue Acupuncture: A Protocol for Evaluating a Complex Landscape Design Intervention to Improve Health and Wellbeing in a Coastal Community. Sustainability 2020, 12, 4084. [Google Scholar] [CrossRef]
  35. Bürger-Arndt, R.; Bell, S. The recreation planning process. In European Forest Recreation and Tourism: A Handbook; Bell, S., Simpson, M., Tyrvainen, L., Sievanen, T., Proebstl, U., Eds.; Taylor & Francis: London, UK, 2008; ISBN 978-0-415-44363-0. [Google Scholar]
  36. Bell, S. Design for Outdoor Recreation, 2nd ed.; Taylor & Francis: Abingdon, UK, 2008; ISBN 978-0-203-92811-0. [Google Scholar]
  37. Lerner, J. Urban Acupuncture; Island Press: Washington, DC, USA; Covelo: London, UK, 2014; ISBN 978-1-61091-583-0. [Google Scholar]
  38. Cantrell, B.; Michaels, W. Digital Drawing for Landscape Architecture: Contemporary Techniques and Tools for Digital Representation in Site Design, 2nd ed.; Wiley: Hoboken, NJ, USA, 2014; ISBN 978-1-118-69318-6. [Google Scholar]
  39. Gill, L.; Lange, E.; Morgan, E.; Romano, D. An Analysis of Usage of Different Types of Visualisation Media within a Collaborative Planning Workshop Environment. Environ. Plan. B Plan. Des. 2013. [Google Scholar] [CrossRef] [Green Version]
  40. Lovett, A.; Appleton, K.; Warren-Kretzschmar, B.; Von Haaren, C. Using 3D visualization methods in landscape planning: An evaluation of options and practical issues. Landsc. Urban Plan. 2015, 142, 85–94. [Google Scholar] [CrossRef]
  41. Portman, M.E.; Natapov, A.; Fisher-Gewirtzman, D. To go where no man has gone before: Virtual reality in architecture, landscape architecture and environmental planning. Comput. Environ. Urban Syst. 2015, 54, 376–384. [Google Scholar] [CrossRef]
  42. Miller, D.; Ode-Sang, Å.; Brown, I.; Muñoz-Rojas, J.; Wang, C.; Donaldson-Selby, G. Landscape modelling and stakeholder engagement: Participatory approaches and landscape visualisation. In Modelling Nature-Based Solutions; Sang, N.S., Ed.; Cambridge University Press: Cambridge, UK, 2020; pp. 19–55. ISBN 978-1-108-55382-7. [Google Scholar]
  43. Gao, T.; Liang, H.; Chen, Y.; Qiu, L. Comparisons of Landscape Preferences through Three Different Perceptual Approaches. Int. J. Environ. Res. Public. Health 2019, 16, 4754. [Google Scholar] [CrossRef] [PubMed] [Green Version]
  44. Patterson, Z.; Darbani, J.M.; Rezaei, A.; Zacharias, J.; Yazdizadeh, A. Comparing text-only and virtual reality discrete choice experiments of neighbourhood choice. Landsc. Urban Plan. 2017, 157, 63–74. [Google Scholar] [CrossRef]
  45. Jallouli, J.; Moreau, G. Virtual Reality as a Landscape Decision-Making Tool: The Wind Turbines’ Case. Int. J. Des. Sci. Technol. 2009, 16, 73–88. [Google Scholar]
  46. Shi, J.; Honjo, T.; Zhang, K.; Furuya, K. Using Virtual Reality to Assess Landscape: A Comparative Study Between On-Site Survey and Virtual Reality of Aesthetic Preference and Landscape Cognition. Sustainability 2020, 12, 2875. [Google Scholar] [CrossRef] [Green Version]
  47. Valtchanov, D.; Barton, K.R.; Ellard, C. Restorative effects of virtual nature settings. Cyberpsychology Behav. Soc. Netw. 2010, 13, 503–512. [Google Scholar] [CrossRef]
  48. Annerstedt, M.; Jönsson, P.; Wallergård, M.; Johansson, G.; Karlson, B.; Grahn, P.; Hansen, A.M.; Währborg, P. Inducing physiological stress recovery with sounds of nature in a virtual reality forest—Results from a pilot study. Physiol. Behav. 2013, 118, 240–250. [Google Scholar] [CrossRef]
  49. White, M.P.; Yeo, N.L.; Vassiljev, P.; Lundstedt, R.; Wallergård, M.; Albin, M.; Lõhmus, M. A prescription for “nature”—The potential of using virtual nature in therapeutics. Neuropsychiatr. Dis. Treat. 2018, 14, 3001–3013. [Google Scholar] [CrossRef] [Green Version]
  50. Yin, J.; Yuan, J.; Arfaei, N.; Catalano, P.J.; Allen, J.G.; Spengler, J.D. Effects of biophilic indoor environment on stress and anxiety recovery: A between-subjects experiment in virtual reality. Environ. Int. 2020, 136, 105427. [Google Scholar] [CrossRef]
  51. Lindquist, M.; Lange, E.; Kang, J. From 3D landscape visualization to environmental simulation: The contribution of sound to the perception of virtual environments. Landsc. Urban Plan. 2016, 148, 216–231. [Google Scholar] [CrossRef] [Green Version]
  52. Hedblom, M.; Gunnarsson, B.; Iravani, B.; Knez, I.; Schaefer, M.; Thorsson, P.; Lundström, J.N. Reduction of physiological stress by urban green space in a multisensory virtual experiment. Sci. Rep. 2019, 9, 10113. [Google Scholar] [CrossRef] [PubMed] [Green Version]
  53. Schebella, M.F.; Weber, D.; Schultz, L.; Weinstein, P. The Nature of Reality: Human Stress Recovery During Exposure to Biodiverse, Multisensory Virtual Environments. Int. J. Environ. Res. Public Health 2019, 17, 56. [Google Scholar] [CrossRef] [PubMed] [Green Version]
  54. Orland, B.; Budthimedhee, K.; Uusitalo, J. Considering virtual worlds as representations of landscape realities and as tools for landscape planning. Landsc. Urban Plan. 2001, 54, 139–148. [Google Scholar] [CrossRef]
  55. Lange, E. 99 volumes later: We can visualise. Now what? Landsc. Urban Plan. 2011, 100, 403–406. [Google Scholar] [CrossRef] [Green Version]
  56. Gill, L.; Lange, E. Getting virtual 3D landscapes out of the lab. Comput. Environ. Urban Syst. 2015, 54, 356–362. [Google Scholar] [CrossRef] [Green Version]
  57. Reichhart, T.; Arnberger, A. Exploring the influence of speed, social, managerial and physical factors on shared trail preferences using a 3D computer animated choice experiment. Landsc. Urban Plan. 2010, 96, 1–11. [Google Scholar] [CrossRef]
  58. Perdomo, M.; Rezaei, A.; Patterson, Z.; Saunier, N.; Miranda-Moreno, L.F. Pedestrian preferences with respect to roundabouts—A video-based stated preference survey. Accid. Anal. Prev. 2014, 70, 84–91. [Google Scholar] [CrossRef]
  59. Jiang, L.; Masullo, M.; Maffei, L.; Meng, F.; Vorländer, M. How do shared-street design and traffic restriction improve urban soundscape and human experience?—An online survey with virtual reality. Build. Environ. 2018, 143, 318–328. [Google Scholar] [CrossRef]
  60. Kasraian, D.; Adhikari, S.; Kossowsky, D.; Luubert, M.; Hall, B.G.; Hawkins, J.; Habib, K.N.; Roorda, M.J. Evaluating pedestrian perceptions of street design with a 3D stated preference survey. Environ. Plan. B Urban Anal. City Sci. 2020. [Google Scholar] [CrossRef]
  61. Wu, H.; Ashmead, D.H.; Bodenheimer, B. Using immersive virtual reality to evaluate pedestrian street crossing decisions at a roundabout. In Proceedings of the 6th Symposium on Applied Perception in Graphics and Visualization—APGV ’09, Chania, Crete, Greece, 30 September–2 October 2009; ACM Press: New York, NY, USA, 2009; pp. 35–40. [Google Scholar]
  62. Wang, C.; Miller, D.; Jiang, Y.; Donaldson-Selby, G. Use of 3D visualisation tools for representing urban greenspace spatial planning. In Proceedings of the 2015 2nd International Conference on Information Science and Control Engineering, Shanghai, China, 24–26 April 2015; pp. 528–532. [Google Scholar]
  63. Tabrizian, P.; Baran, P.K.; Van Berkel, D.; Mitasova, H.; Meentemeyer, R. Modeling restorative potential of urban environments by coupling viewscape analysis of lidar data with experiments in immersive virtual environments. Landsc. Urban Plan. 2020, 195, 103704. [Google Scholar] [CrossRef]
  64. Mishra, H.S.; Bell, S.; Kuhlmann, F.; Vassiljev, P.; Niin, G. What makes a successful Blue Space? A systematic review of projects providing access to urban blue space and derivation of design guidelines. In Proceedings of the ECLAS Conference 2017 Creation/Reaction, University of Greenwich, Department of Architecture & Landscape, Greenwich, London, UK, 10–13 September 2017; pp. 911–926. [Google Scholar]
  65. Estonian Land Board Orthophoto. Summertime Forestry Flight 28.05.2018; Estonian Land Board: Tallinn, Estonia, 2020. [Google Scholar]
  66. Landezine International Landscape Award LILA. Aalborg Waterfront. Available online: https://landezine-award.com/aalborg-waterfront/ (accessed on 5 December 2020).
  67. Landscape Architecture Platform Landezine. Rochetaillée Banks of the Saone by In Situ. Available online: http://landezine.com/index.php/2016/09/rochetaillee-banks-of-the-saone-by-in-situ/ (accessed on 5 December 2020).
  68. Landezine International Landscape Award LILA. 2017. Chicago Riverwalk Expansion. Available online: https://landezine-award.com/chicago-riverwalk-expansion/ (accessed on 5 December 2020).
  69. Landscape Architecture Platform Landezine. 2015. The Waterfront Promenade at Aker Brygge by Link Landskap. Available online: http://landezine.com/index.php/2015/12/the-waterfront-promenade-at-aker-brygge-by-link-landskap/ (accessed on 5 December 2020).
  70. Johns, R. Where city meets sea. TOPOS 2007, 59, 18–23. [Google Scholar]
  71. Landscape Architecture Platform Landezine. 2016. Alsion—University of Southern Denmark and Science Park South by Schønherr. Available online: http://landezine.com/index.php/2016/08/alsion-university-of-southern-denmark-and-science-park-south-by-schonherr/ (accessed on 5 December 2020).
  72. ArchDaily. 2008. Kastrup Sea Bath/White Arkitekter. Available online: https://www.archdaily.com/2899/kastrup-sea-bath-white-arkitekter-ab (accessed on 5 December 2020).
  73. Landscape Architecture Platform Landezine. 2011. Vinaròs Promenade by Guallart Architects. Available online: http://landezine.com/index.php/2011/01/vinaros-promenade-by-guallart-architects (accessed on 5 December 2020).
  74. Landscape Architecture Platform Landezine. 2013. Amager Beach by Haslov and Kjaersgaard. Available online: http://landezine.com/index.php/2013/01/amager-beach-by-haslov-and-kjaersgaard/ (accessed on 5 December 2020).
  75. Landscape Architecture Platform Landezine. 2014. Sea Park by Substance. Available online: http://landezine.com/index.php/2014/12/sea-park-by-substance/ (accessed on 5 December 2020).
  76. ArchDaily. 2014. Tagus Linear Park/Topiaris Landscape Architecture. Available online: https://www.archdaily.com/515442/tagus-linear-park-topiaris-landscape-architecture (accessed on 5 December 2020).
  77. ArchDaily. 2011. Shanghai Houtan Park/Turenscape. Available online: https://www.archdaily.com/131747/shanghai-houtan-park-turenscape (accessed on 5 December 2020).
  78. Landscape Architecture Platform Landezine. 2014. Qunli National Urban Wetland by Turenscape. Available online: http://landezine.com/index.php/2014/01/qunli-national-urban-wetland-by-turenscape/ (accessed on 5 December 2020).
Figure 1. Aerial view of the site in Tallinn with the location of the interventions noted with orange dots and red outlines. (Source: Orthophoto—Estonian Land Board 2020 [65] Published under Licence of open data by Estonian Land Board, 1 July 2018).
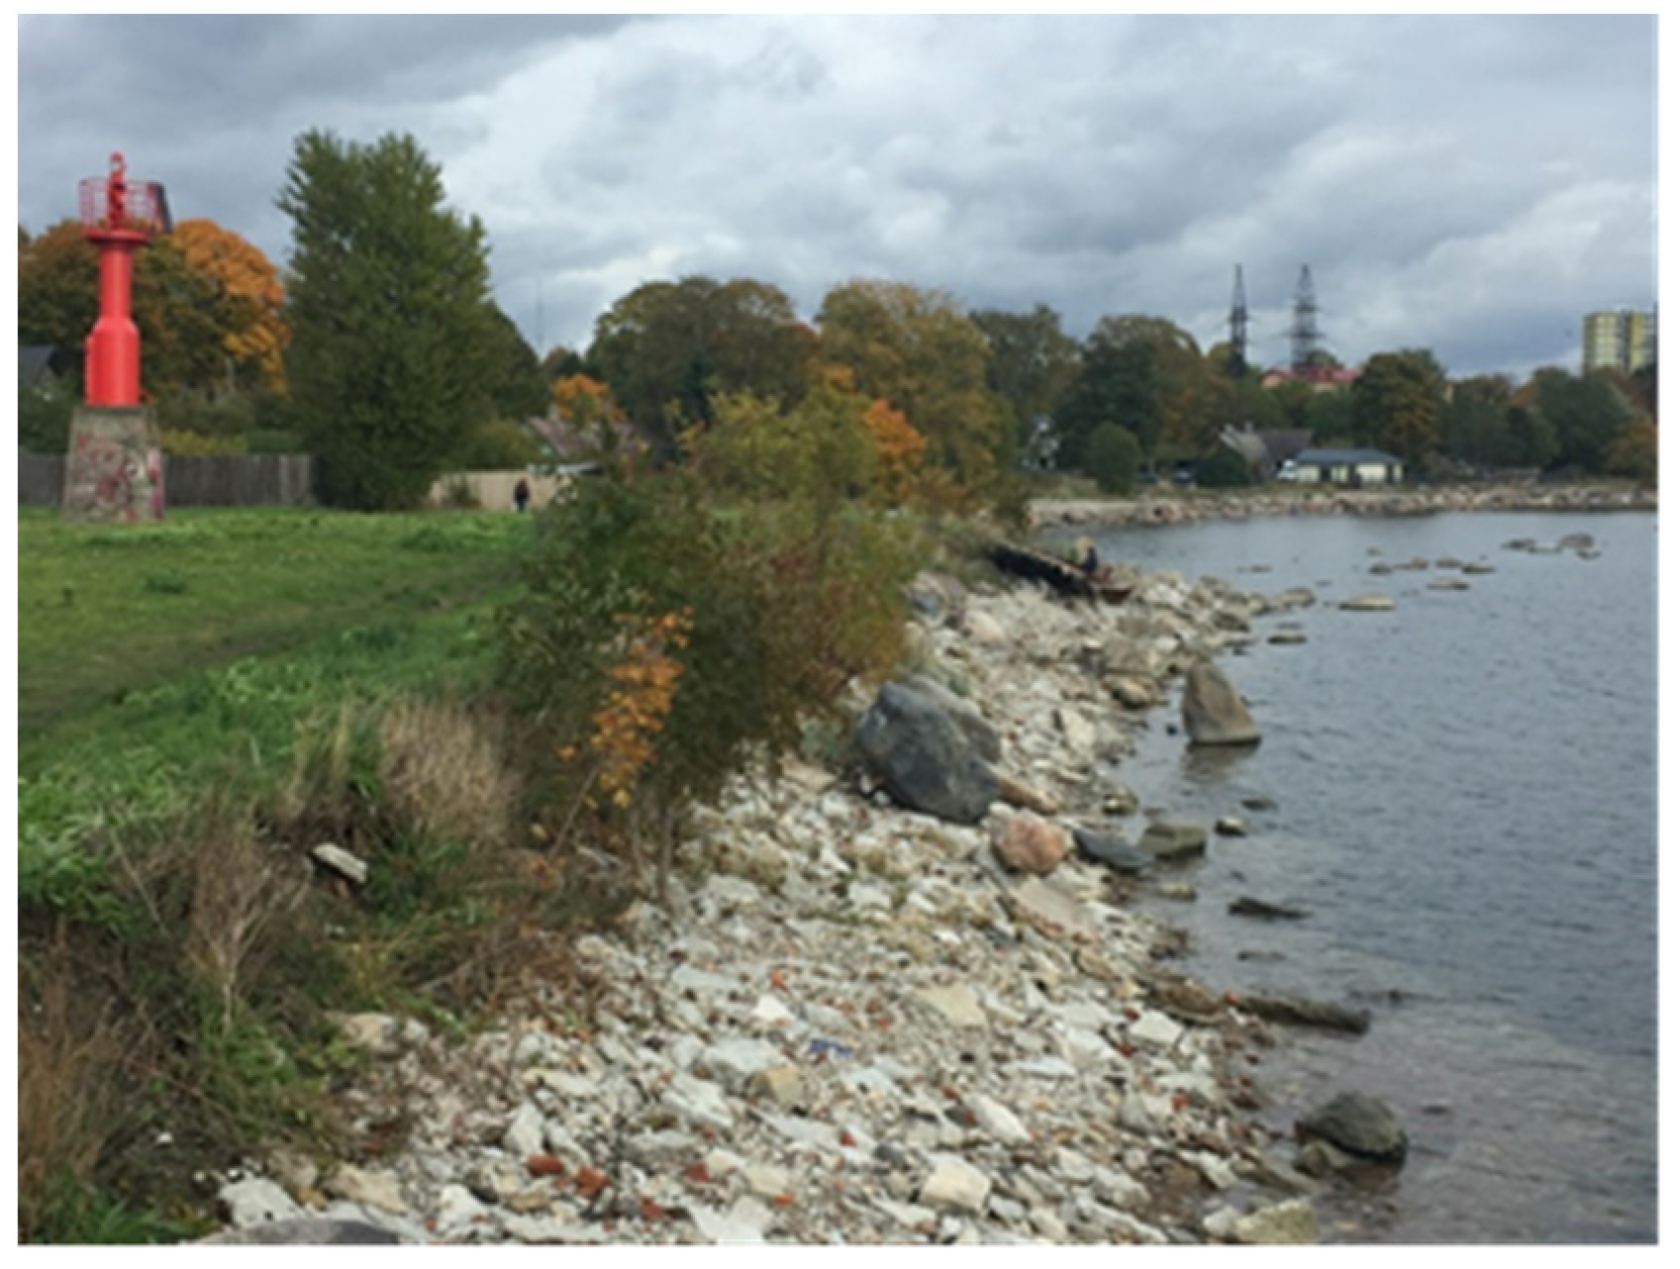
Sustainability 12 10656 g001
Figure 2. The profile of the steep slope/cliff section (Source: Jekaterina Balicka).
Sustainability 12 10656 g002
Figure 3. The beach section (Source: Jekaterina Balicka).
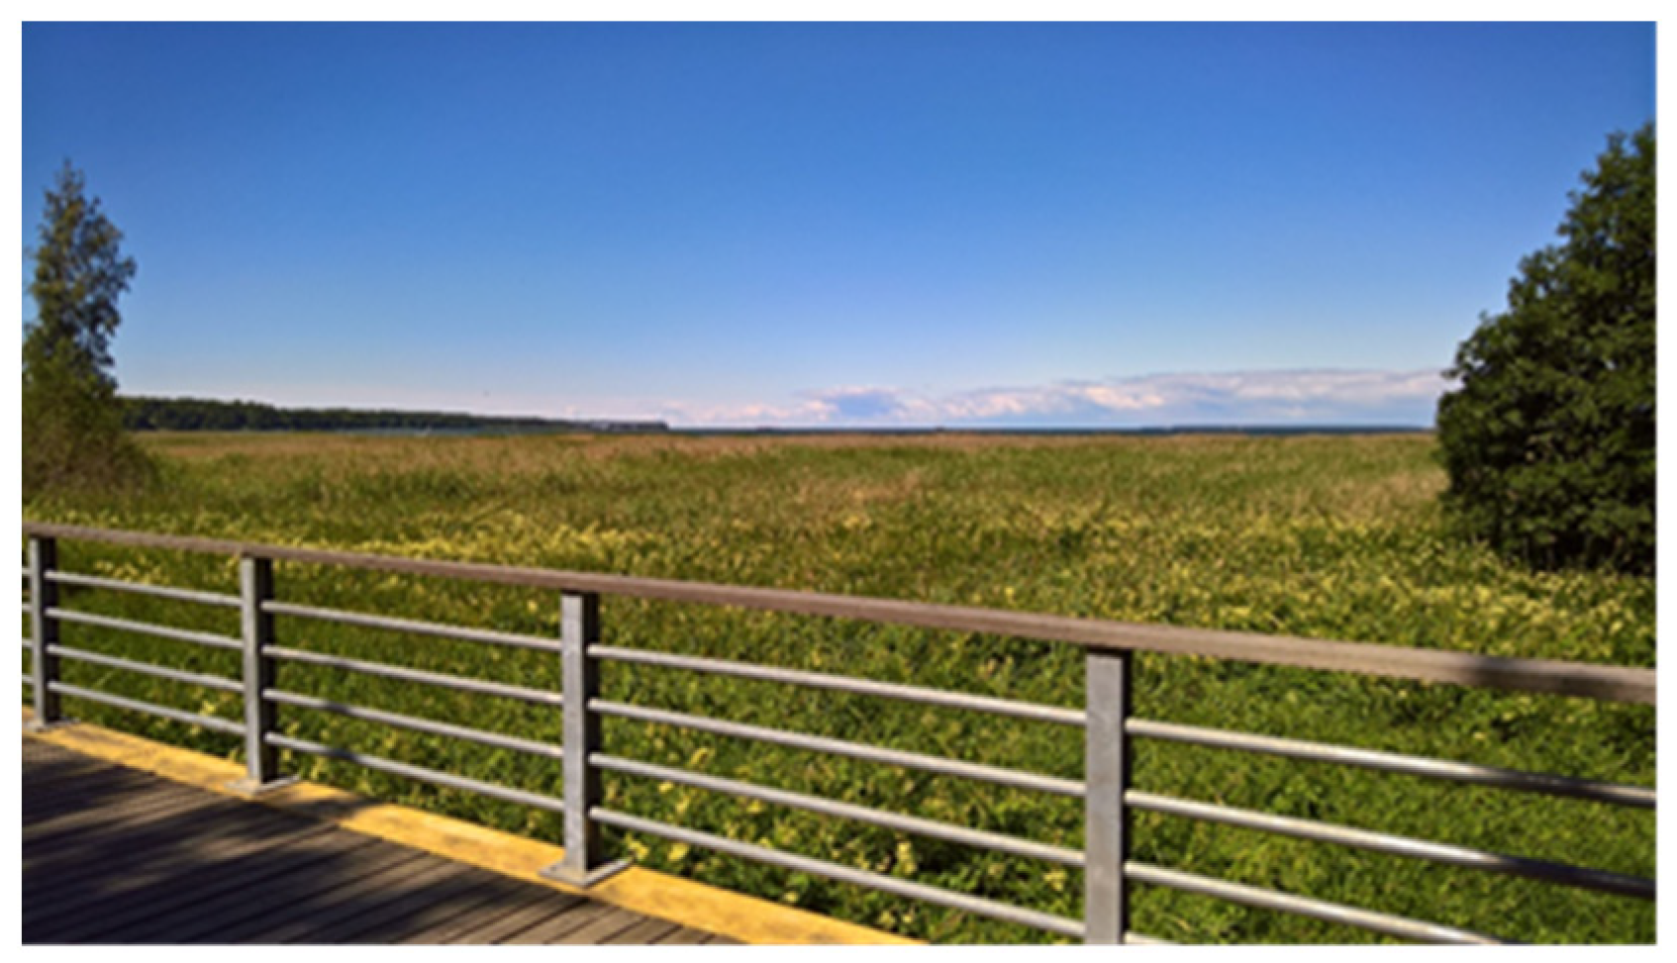
Sustainability 12 10656 g003
Figure 4. The reed beds section (Source: Peeter Vassiljev).
Sustainability 12 10656 g004
Figure 5. A sample of design development sketches used for the basis of the design solutions: (a) testing viewpoint ideas in an area of tall reeds; (b) developing beach seating and a water access structure; (c) designing a deck with playful structures and a shelter. (Source: Jekaterina Balicka and Umme Aymona Ali Amrita).
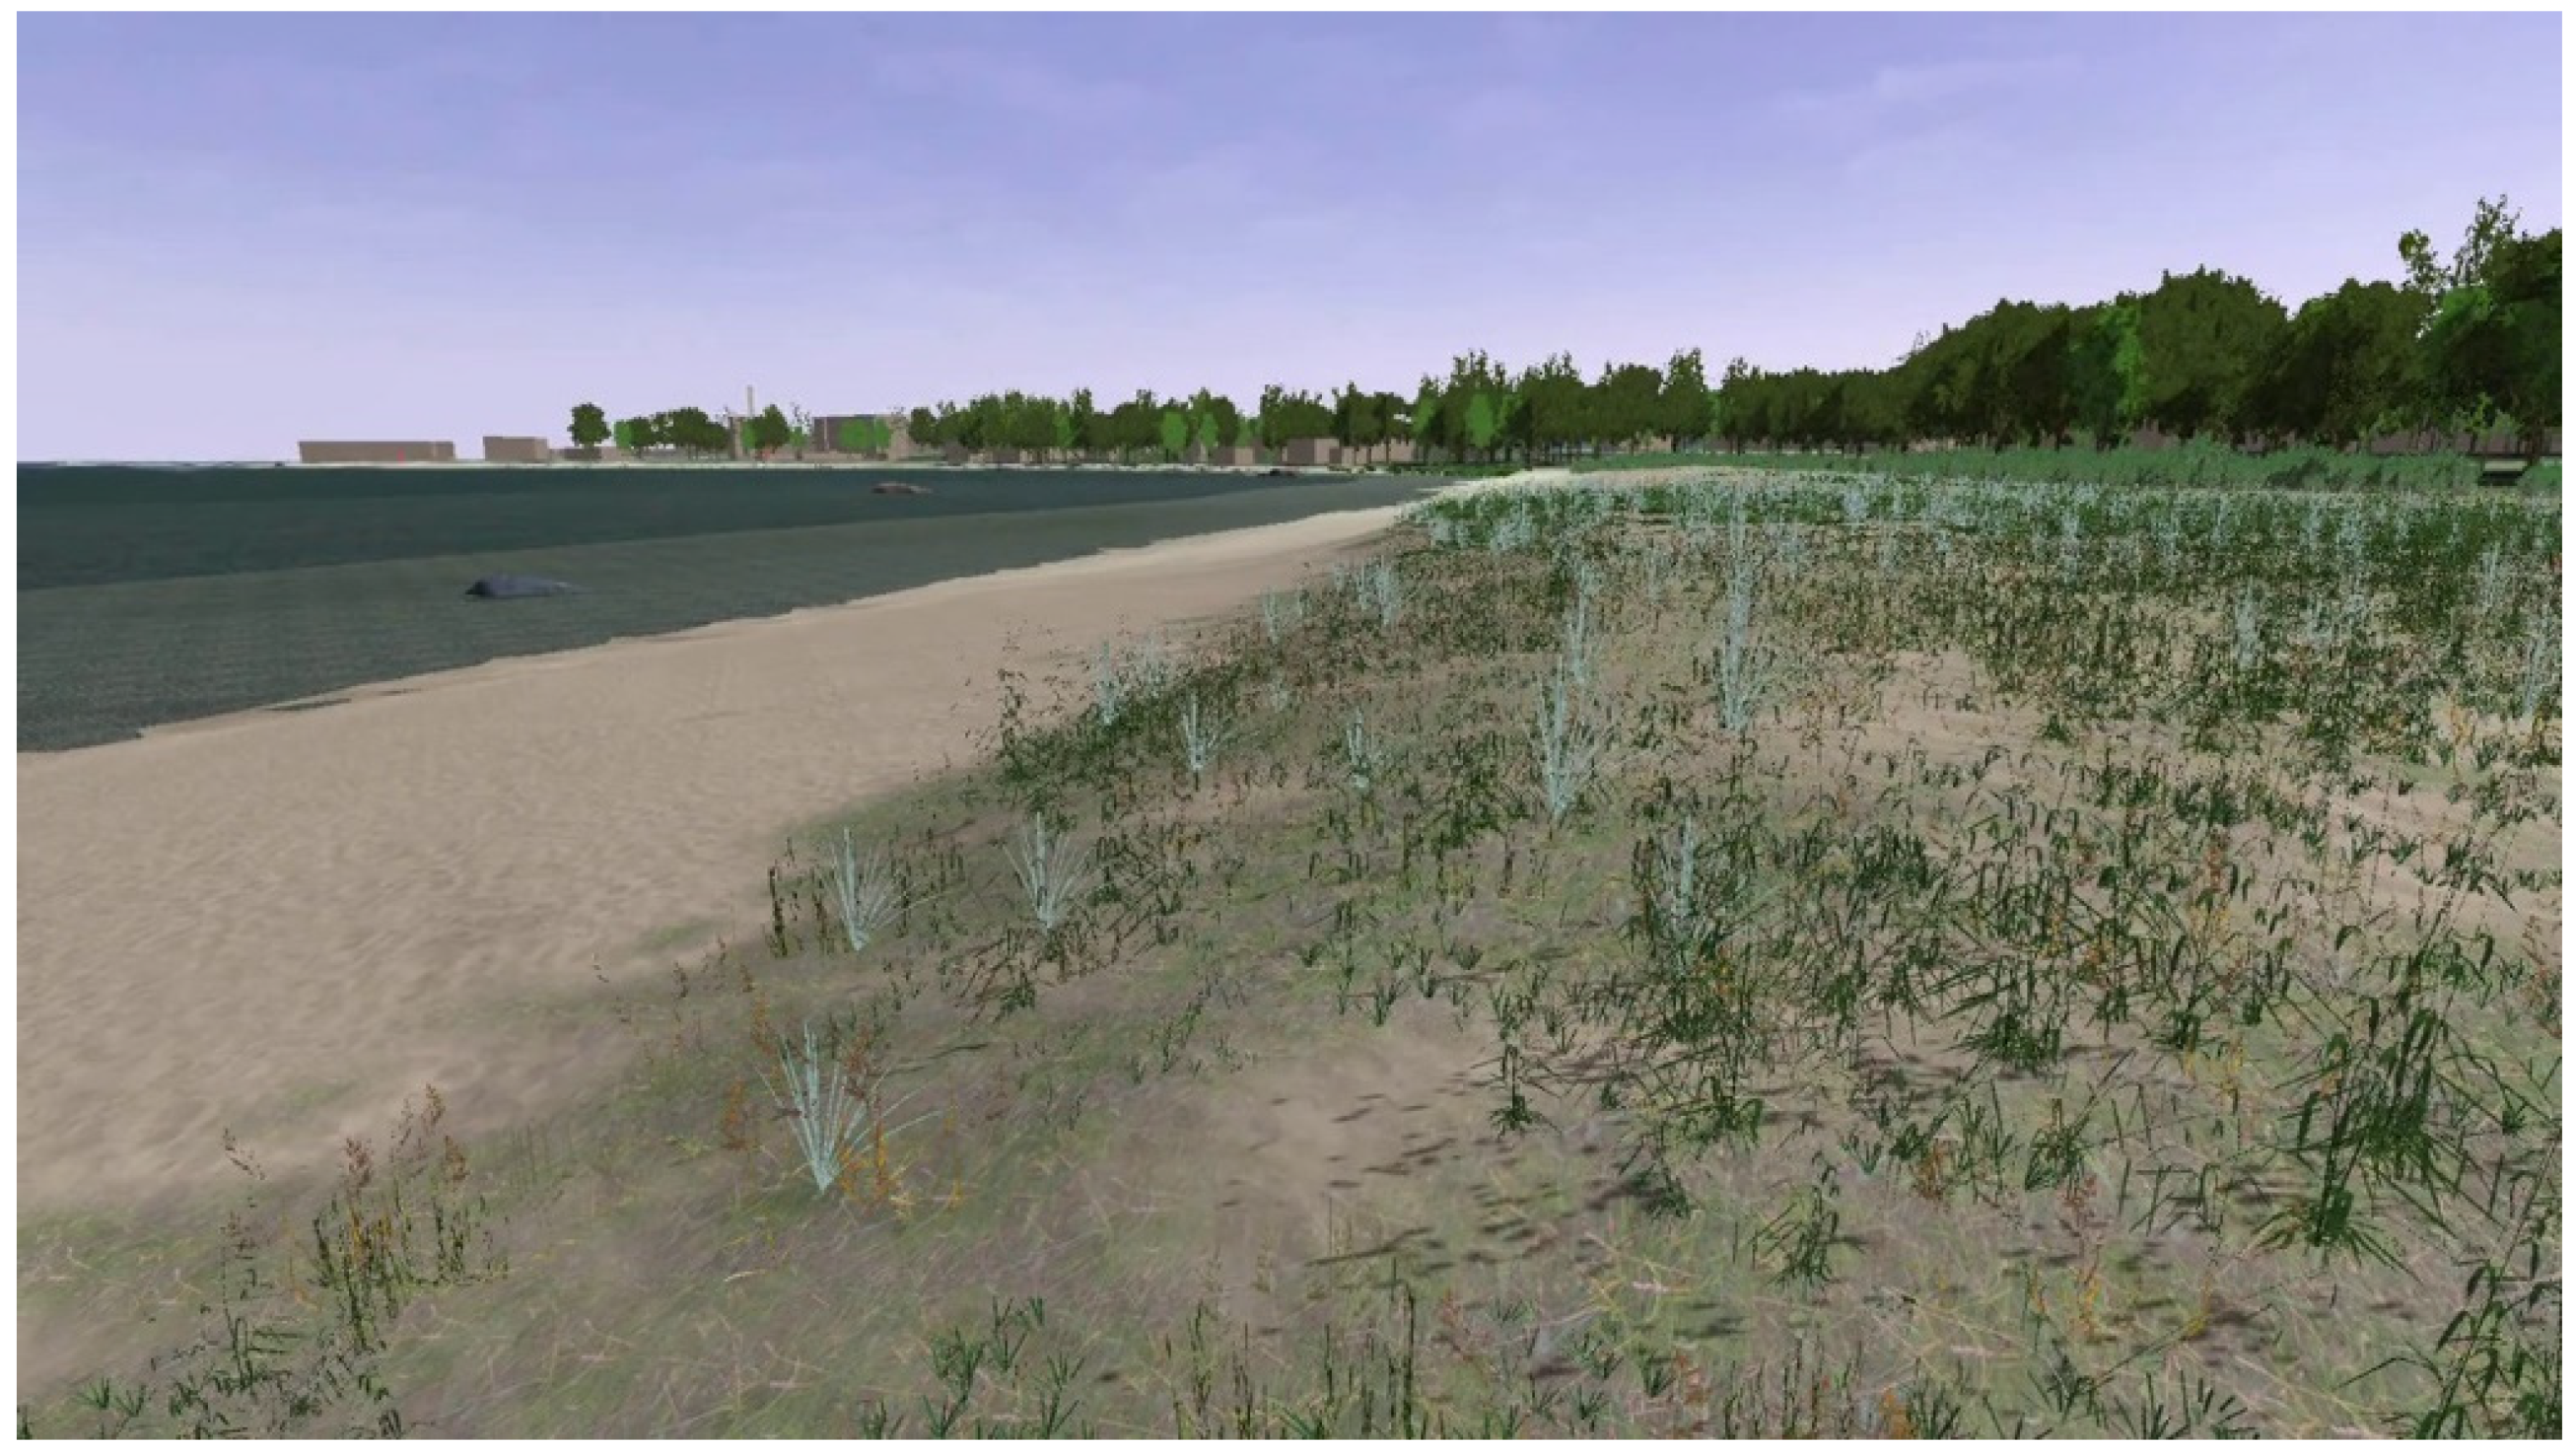
Sustainability 12 10656 g005
Figure 6. A typical view of the virtual reality (VR) landscape model, demonstrating the degree of realism possible with the software (Source: Peeter Vassiljev).
Sustainability 12 10656 g006
Figure 7. Kopli sea beach and adjacent existing setup with the position of each intervention for the visualisation (Source: Umme Aymona Ali Amrita and Jekaterina Balicka).
Sustainability 12 10656 g007
Figure 8. The final VR model of the Cliff Option 1 viewing platform (Source: Peeter Vassiljev).
Sustainability 12 10656 g008
Figure 9. The final VR model of the Cliff Option 2 stepped sitting structure (Source: Peeter Vassiljev).
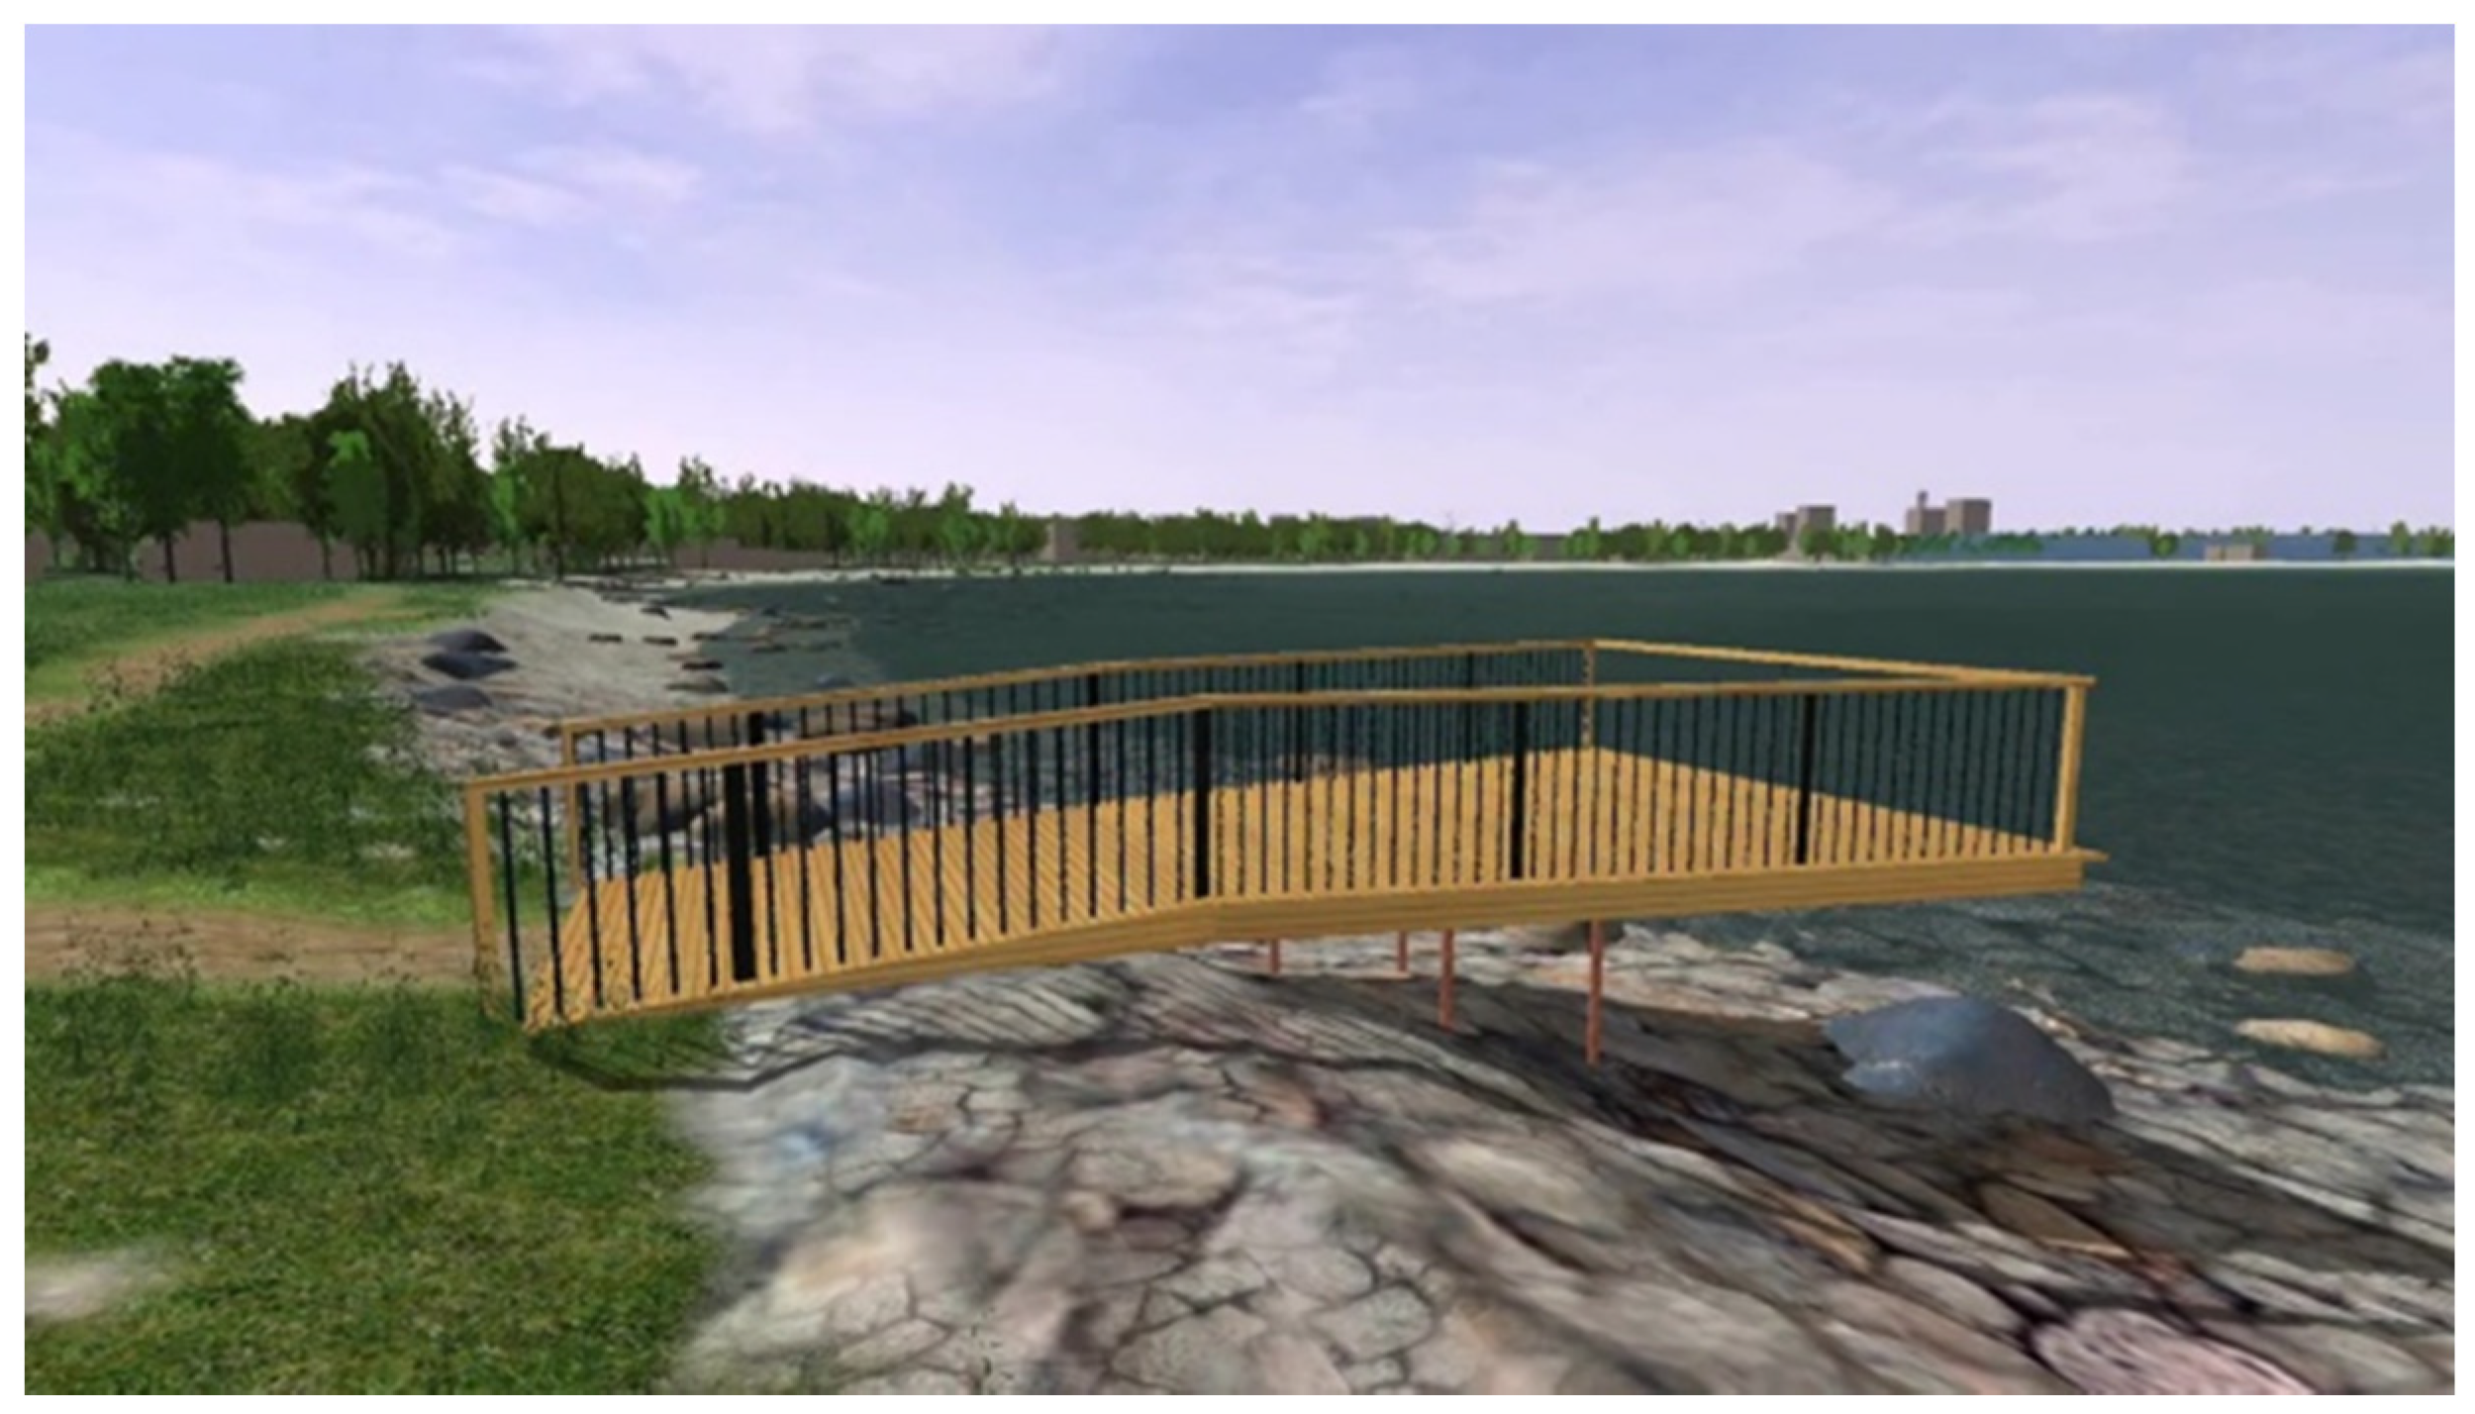
Sustainability 12 10656 g009
Figure 10. The final VR model of the Cliff Option 3 stepped sitting structure with water access platform (Source: Peeter Vassiljev).
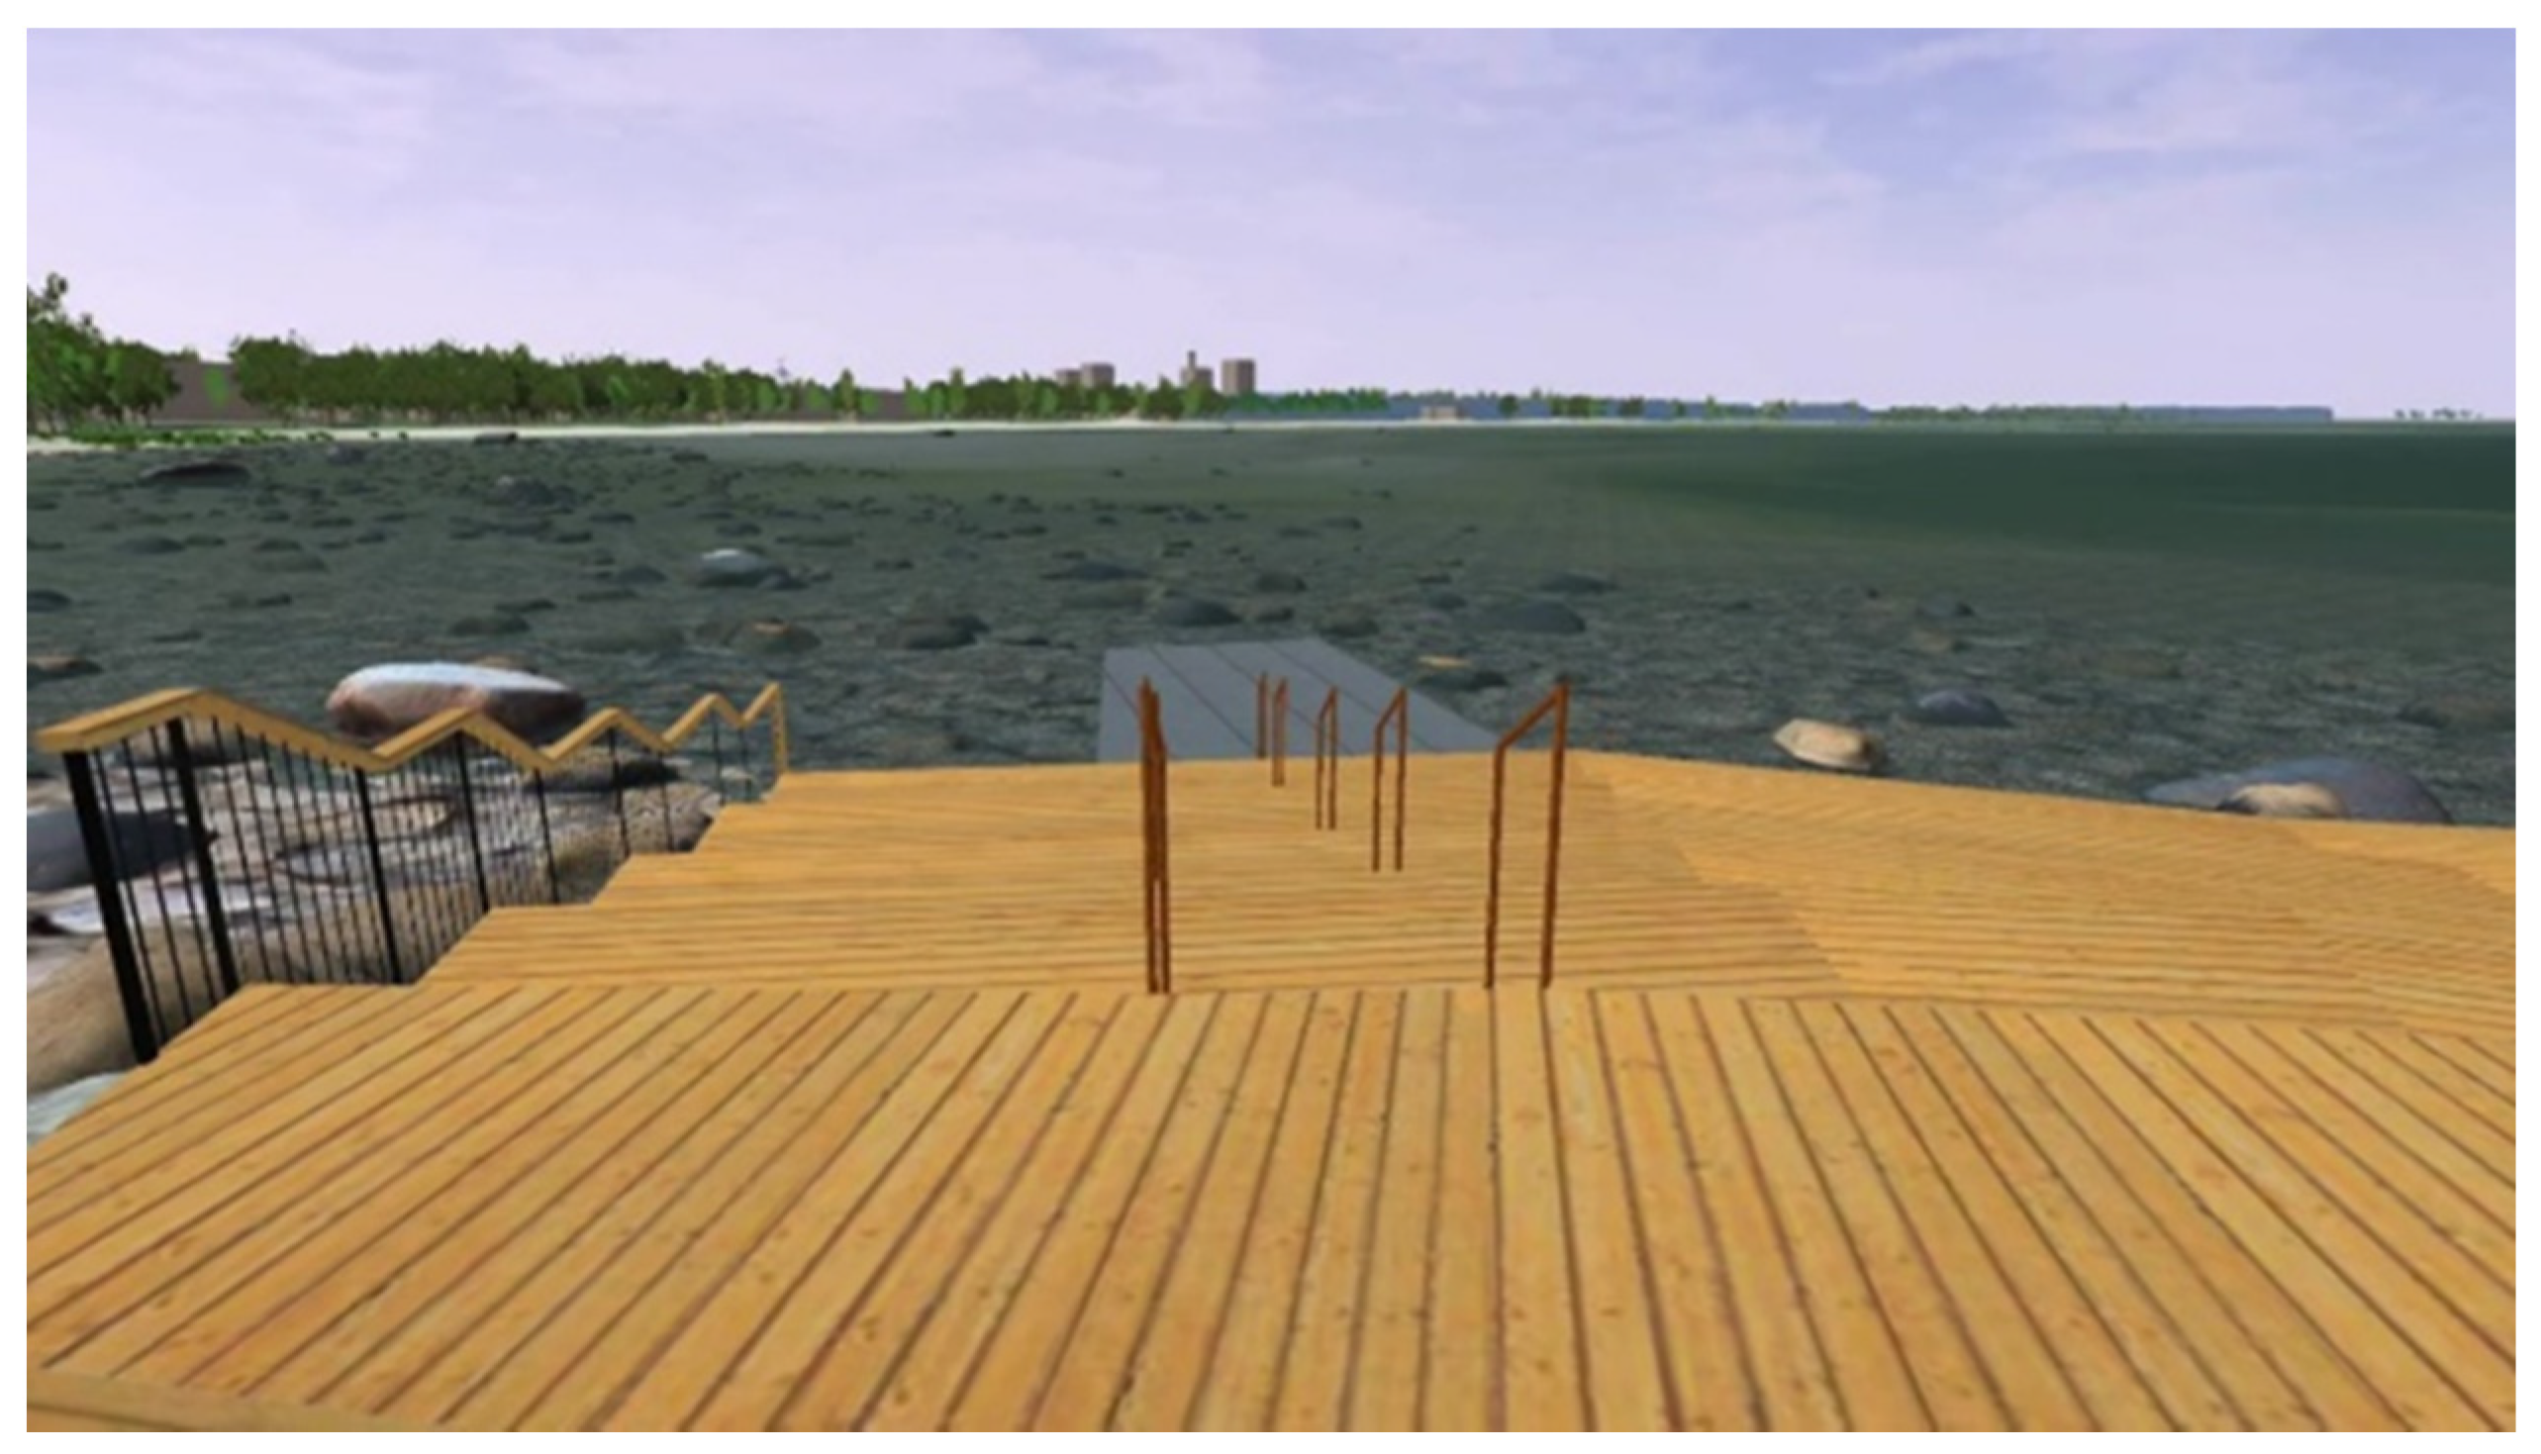
Sustainability 12 10656 g010
Figure 11. The final VR model of the Beach Option 1 boardwalk and enclosed swimming platform (Source: Peeter Vassiljev).
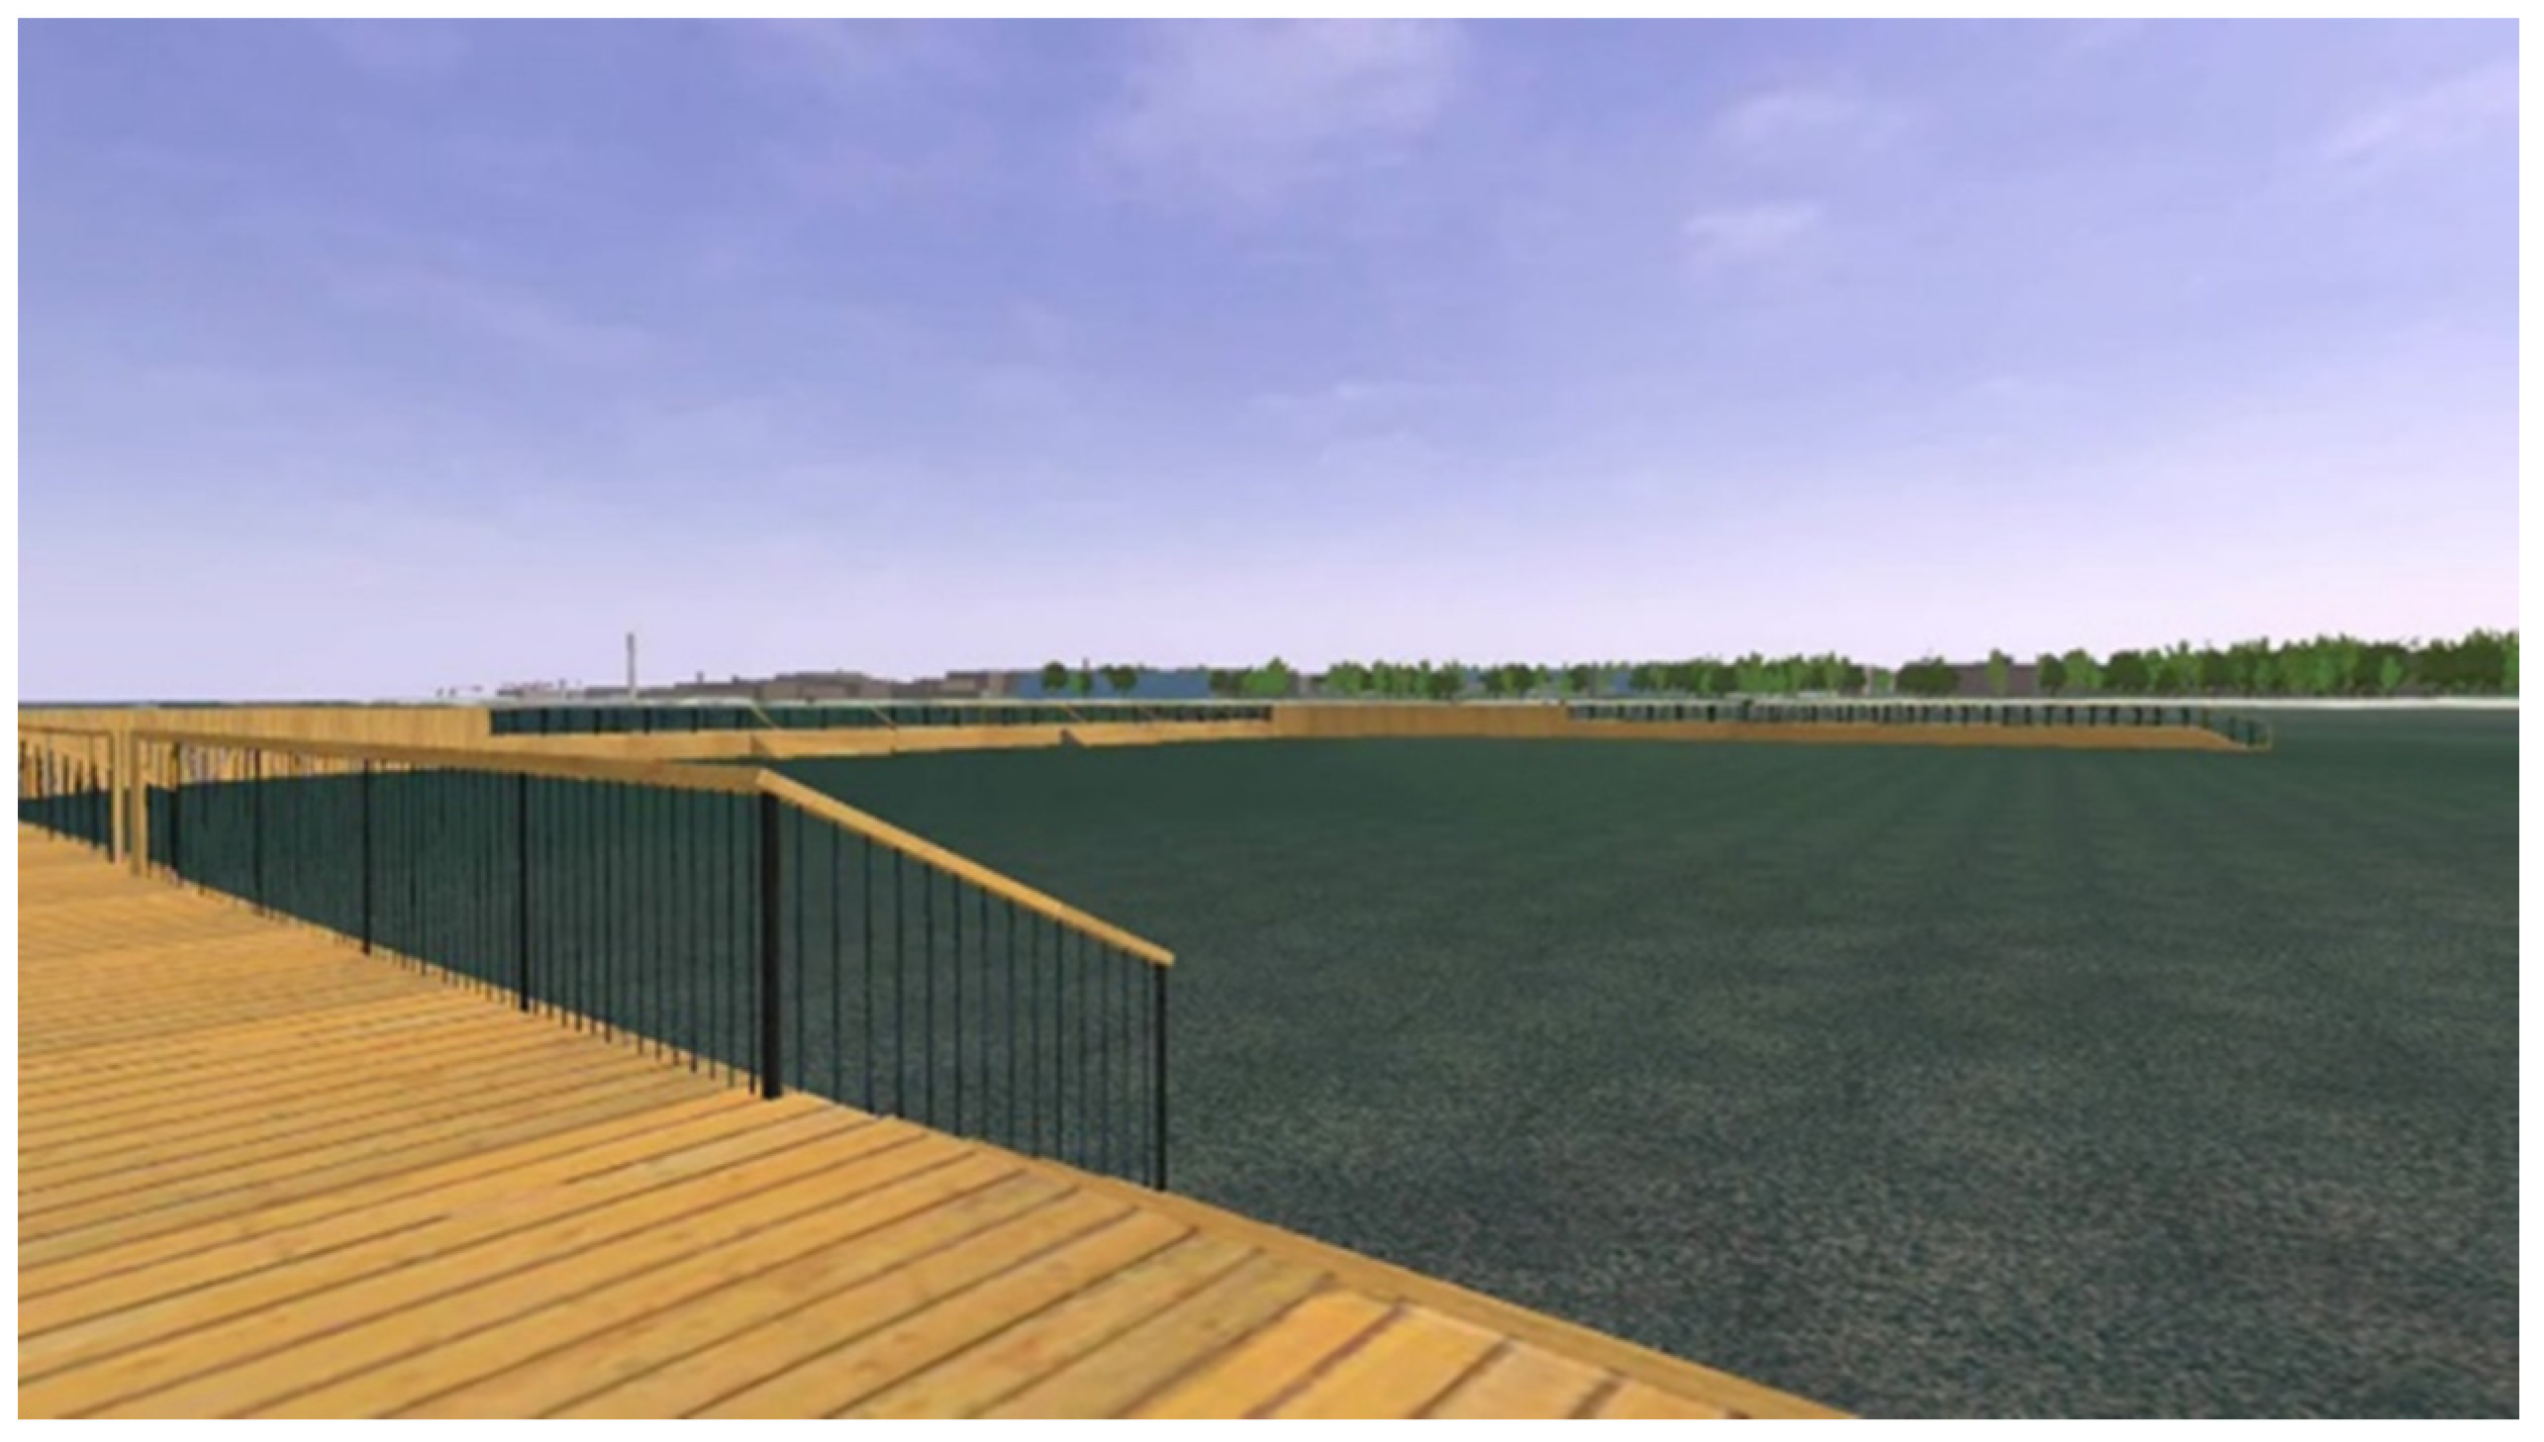
Sustainability 12 10656 g011
Figure 12. The final VR model of the Beach Option 2 platform with shelter, seen from the seaside (Source: Peeter Vassiljev).
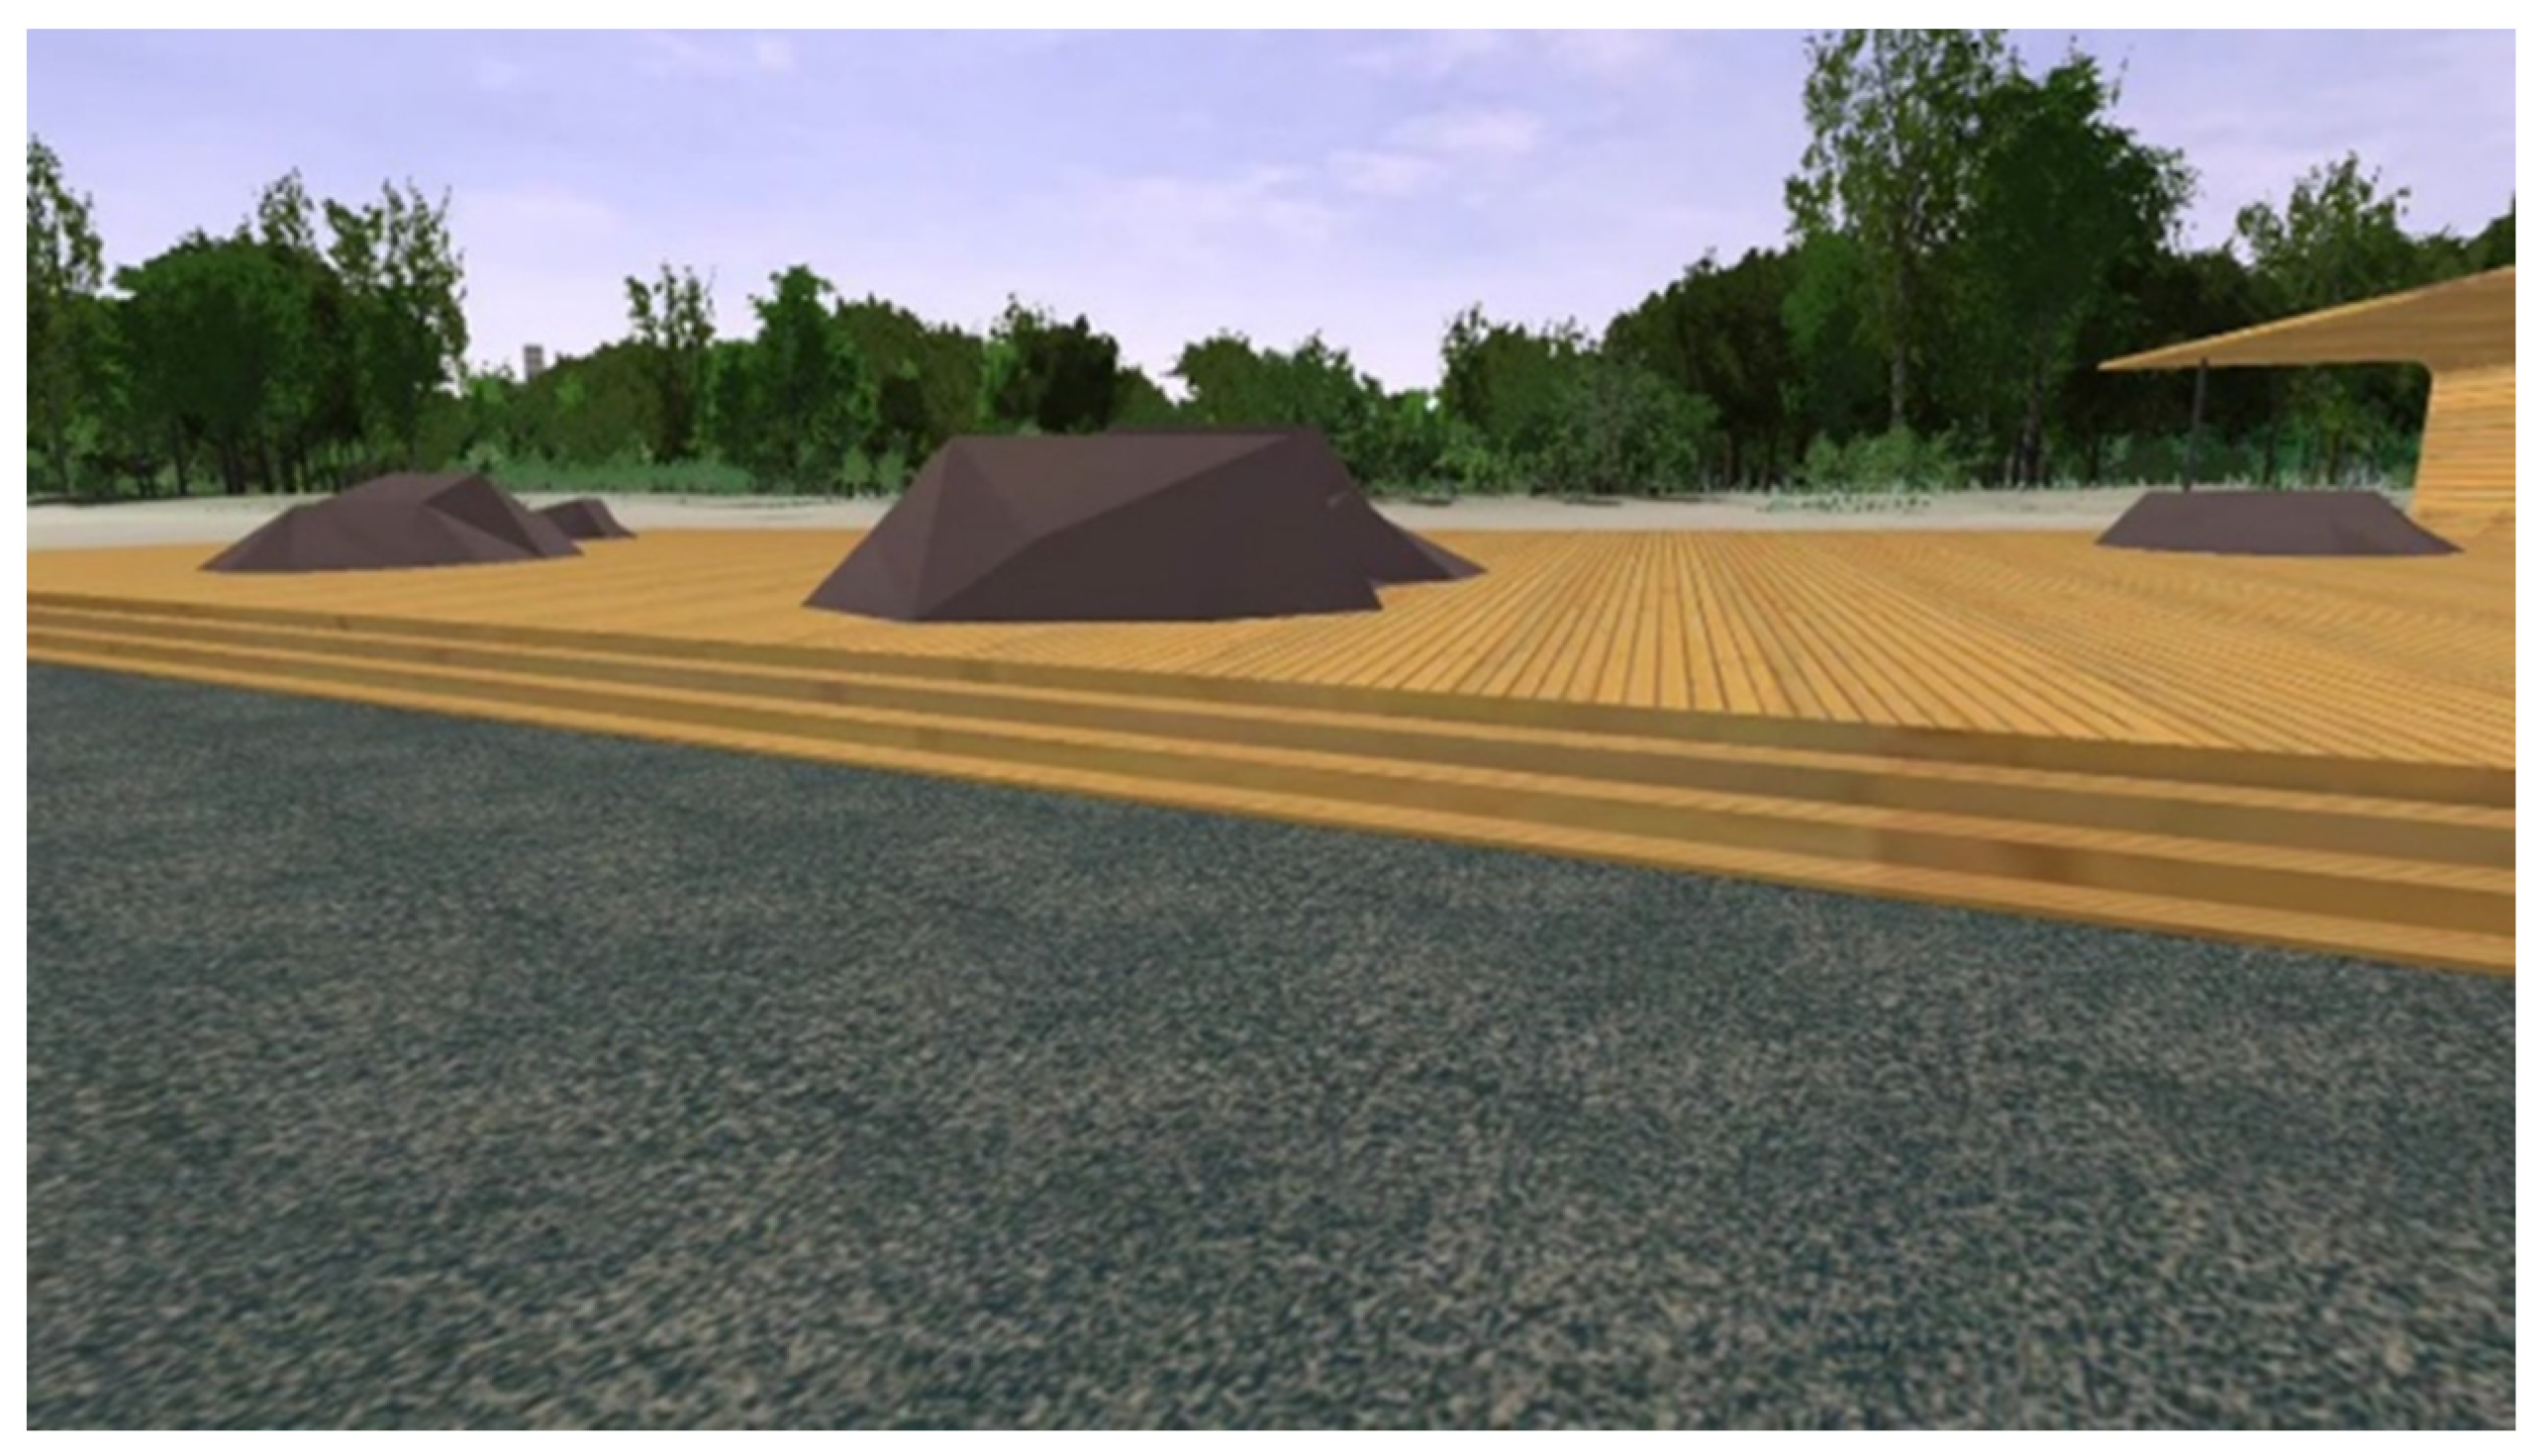
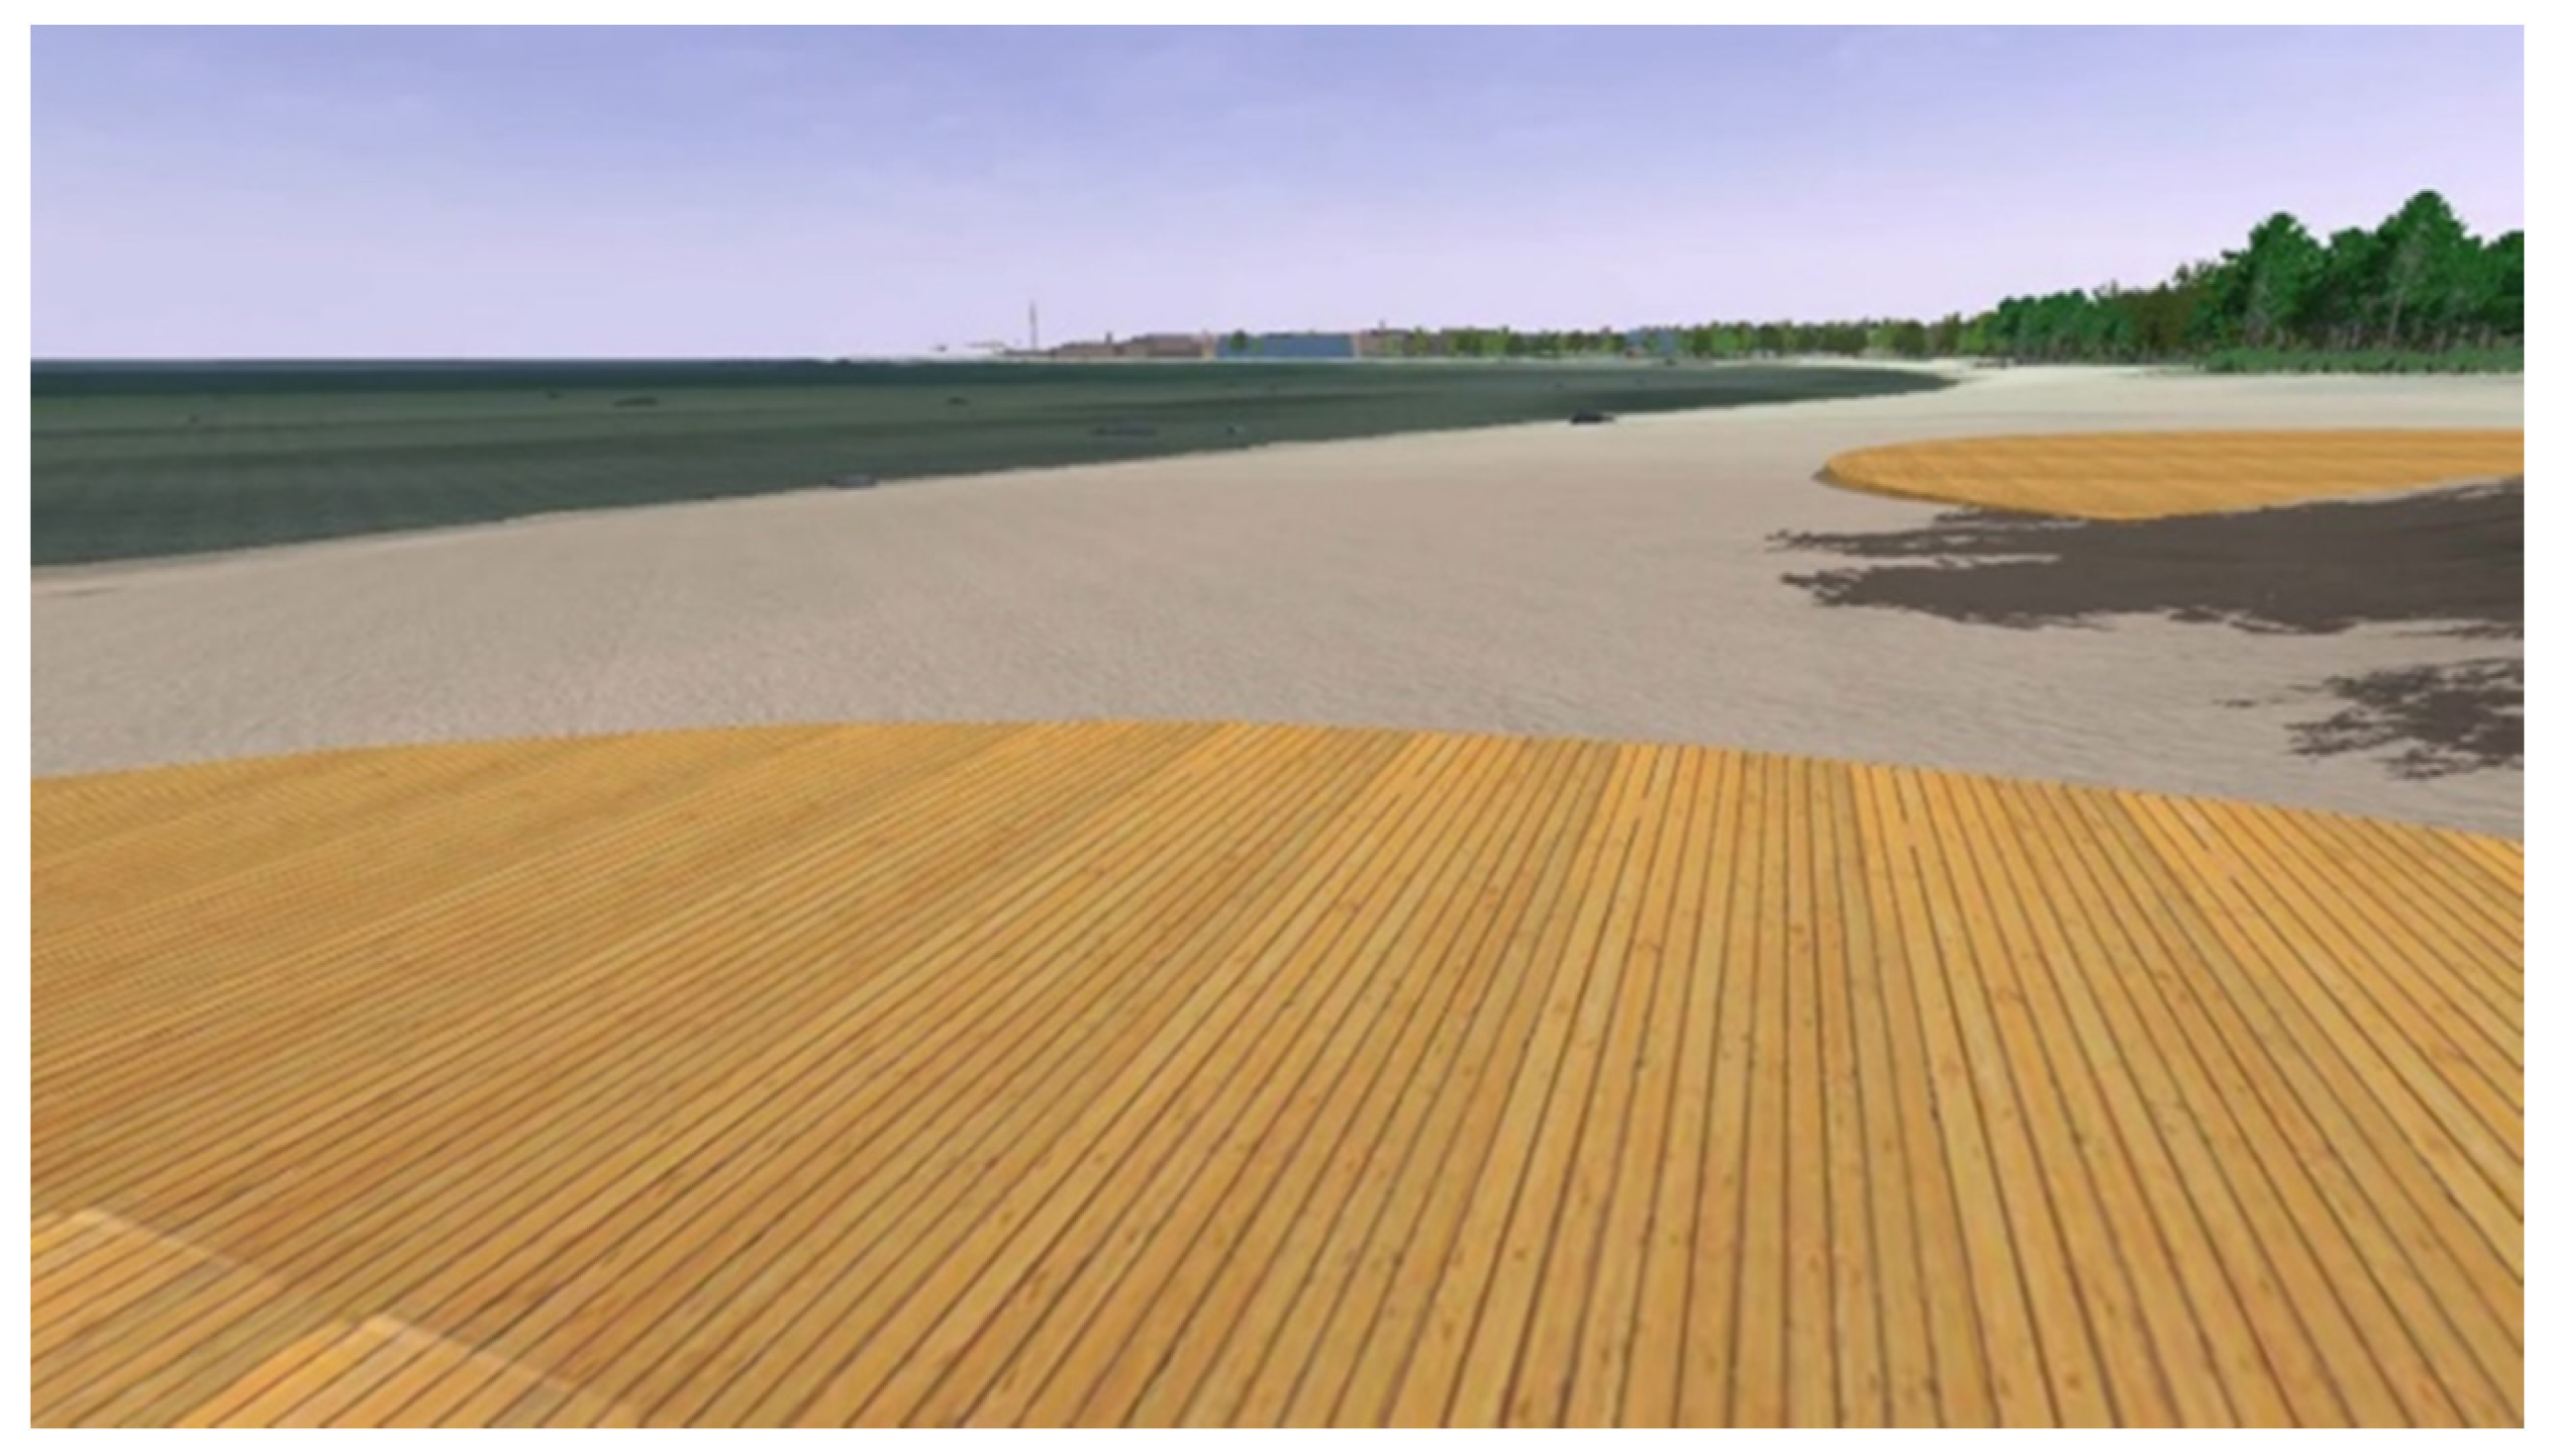
Sustainability 12 10656 g012
Figure 13. The final VR model of the Beach Option 3 Beach sitting platforms (Source: Peeter Vassiljev).
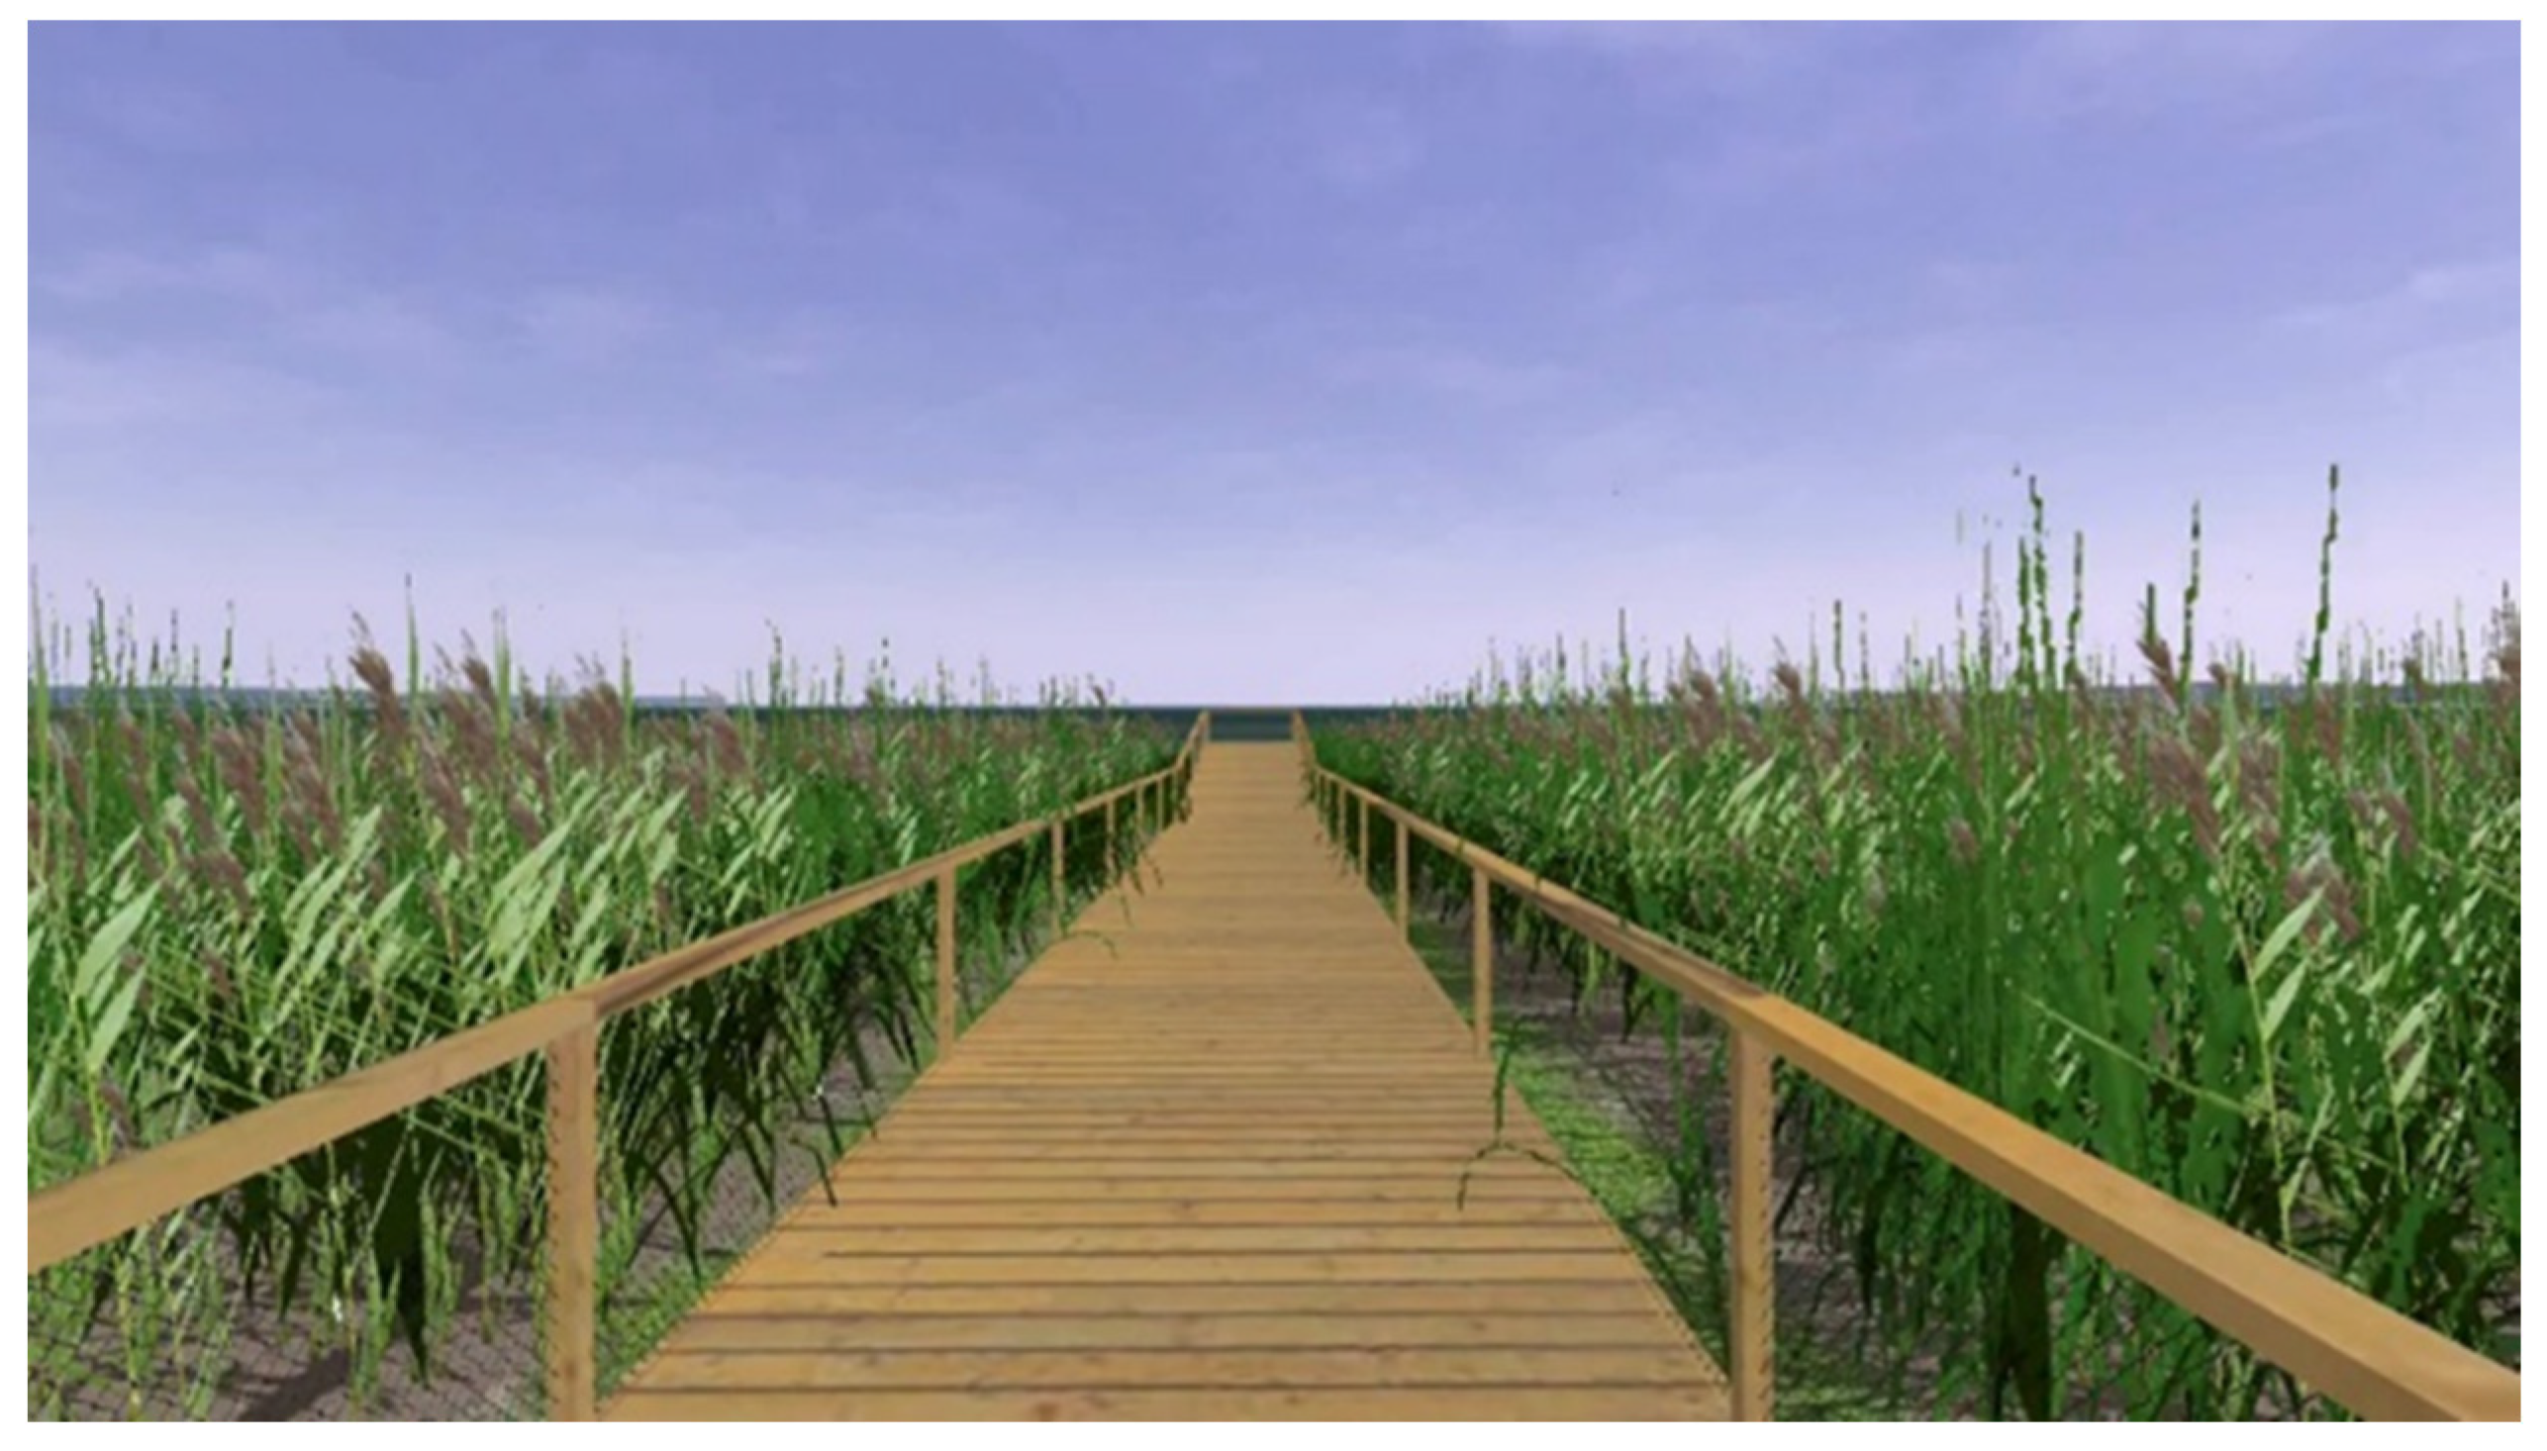
Sustainability 12 10656 g013
Figure 14. The final VR model of the Reed Option 1 Boardwalk with surprise view (Source: Peeter Vassiljev).
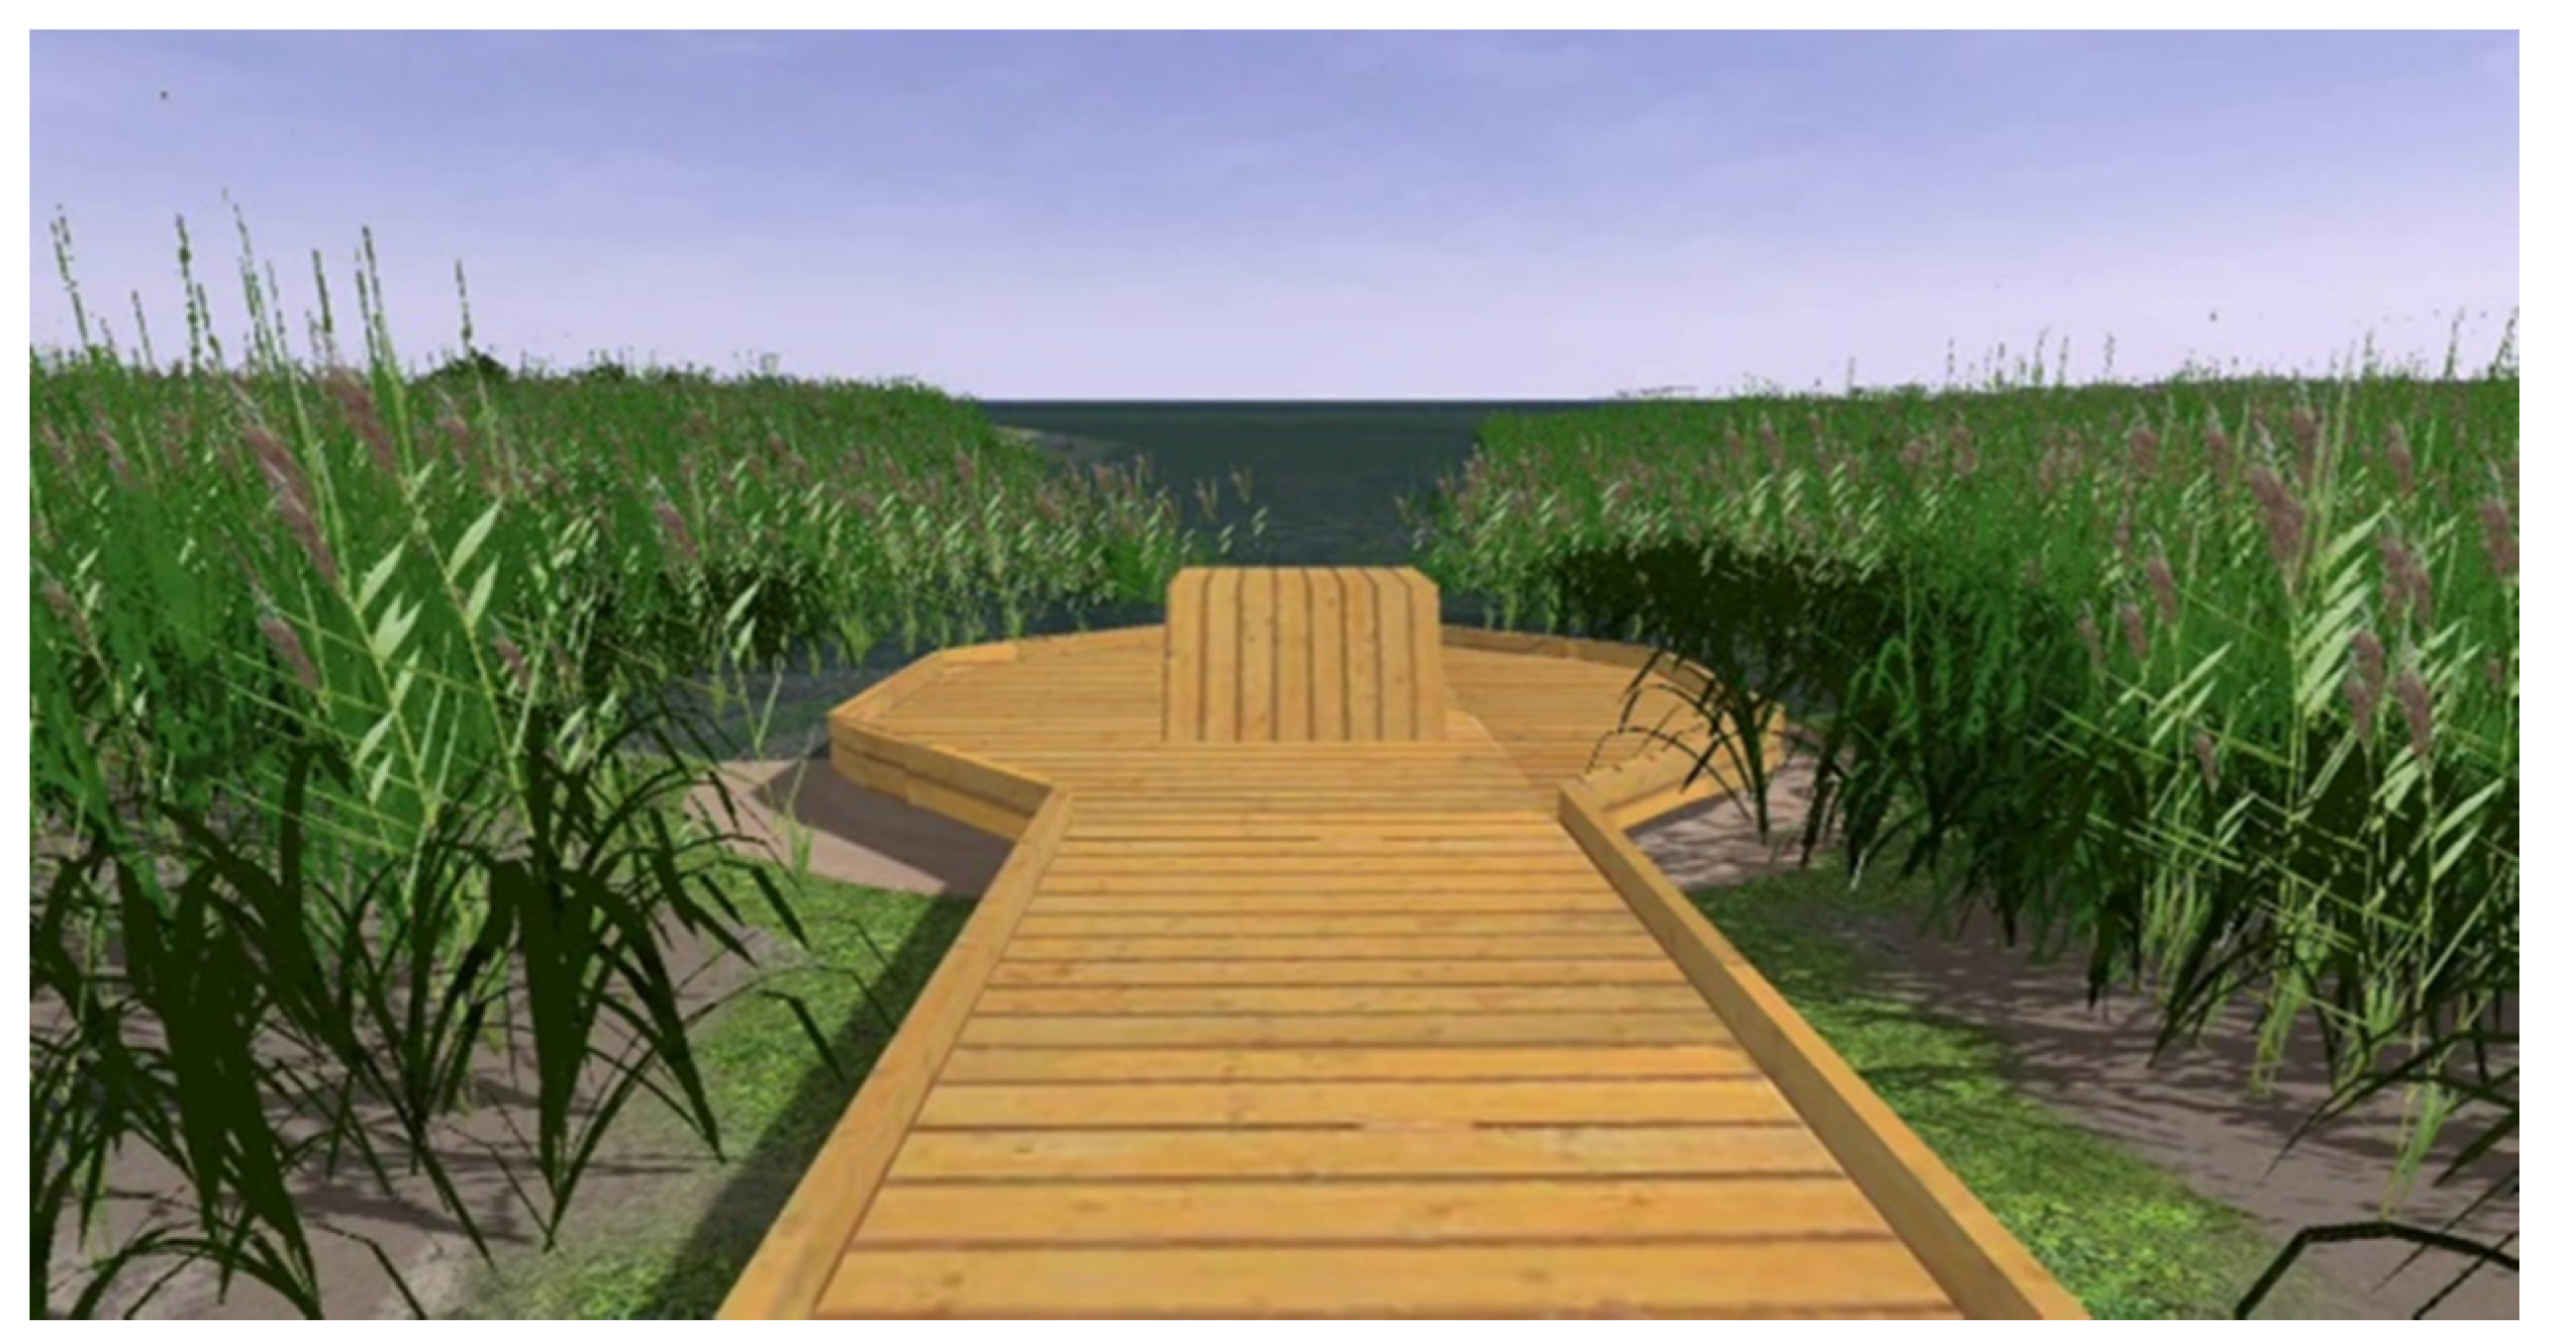
Sustainability 12 10656 g014
Figure 15. The final VR model of the Reed Option 2 Boardwalk with sitting and viewing platform (Source: Peeter Vassiljev).
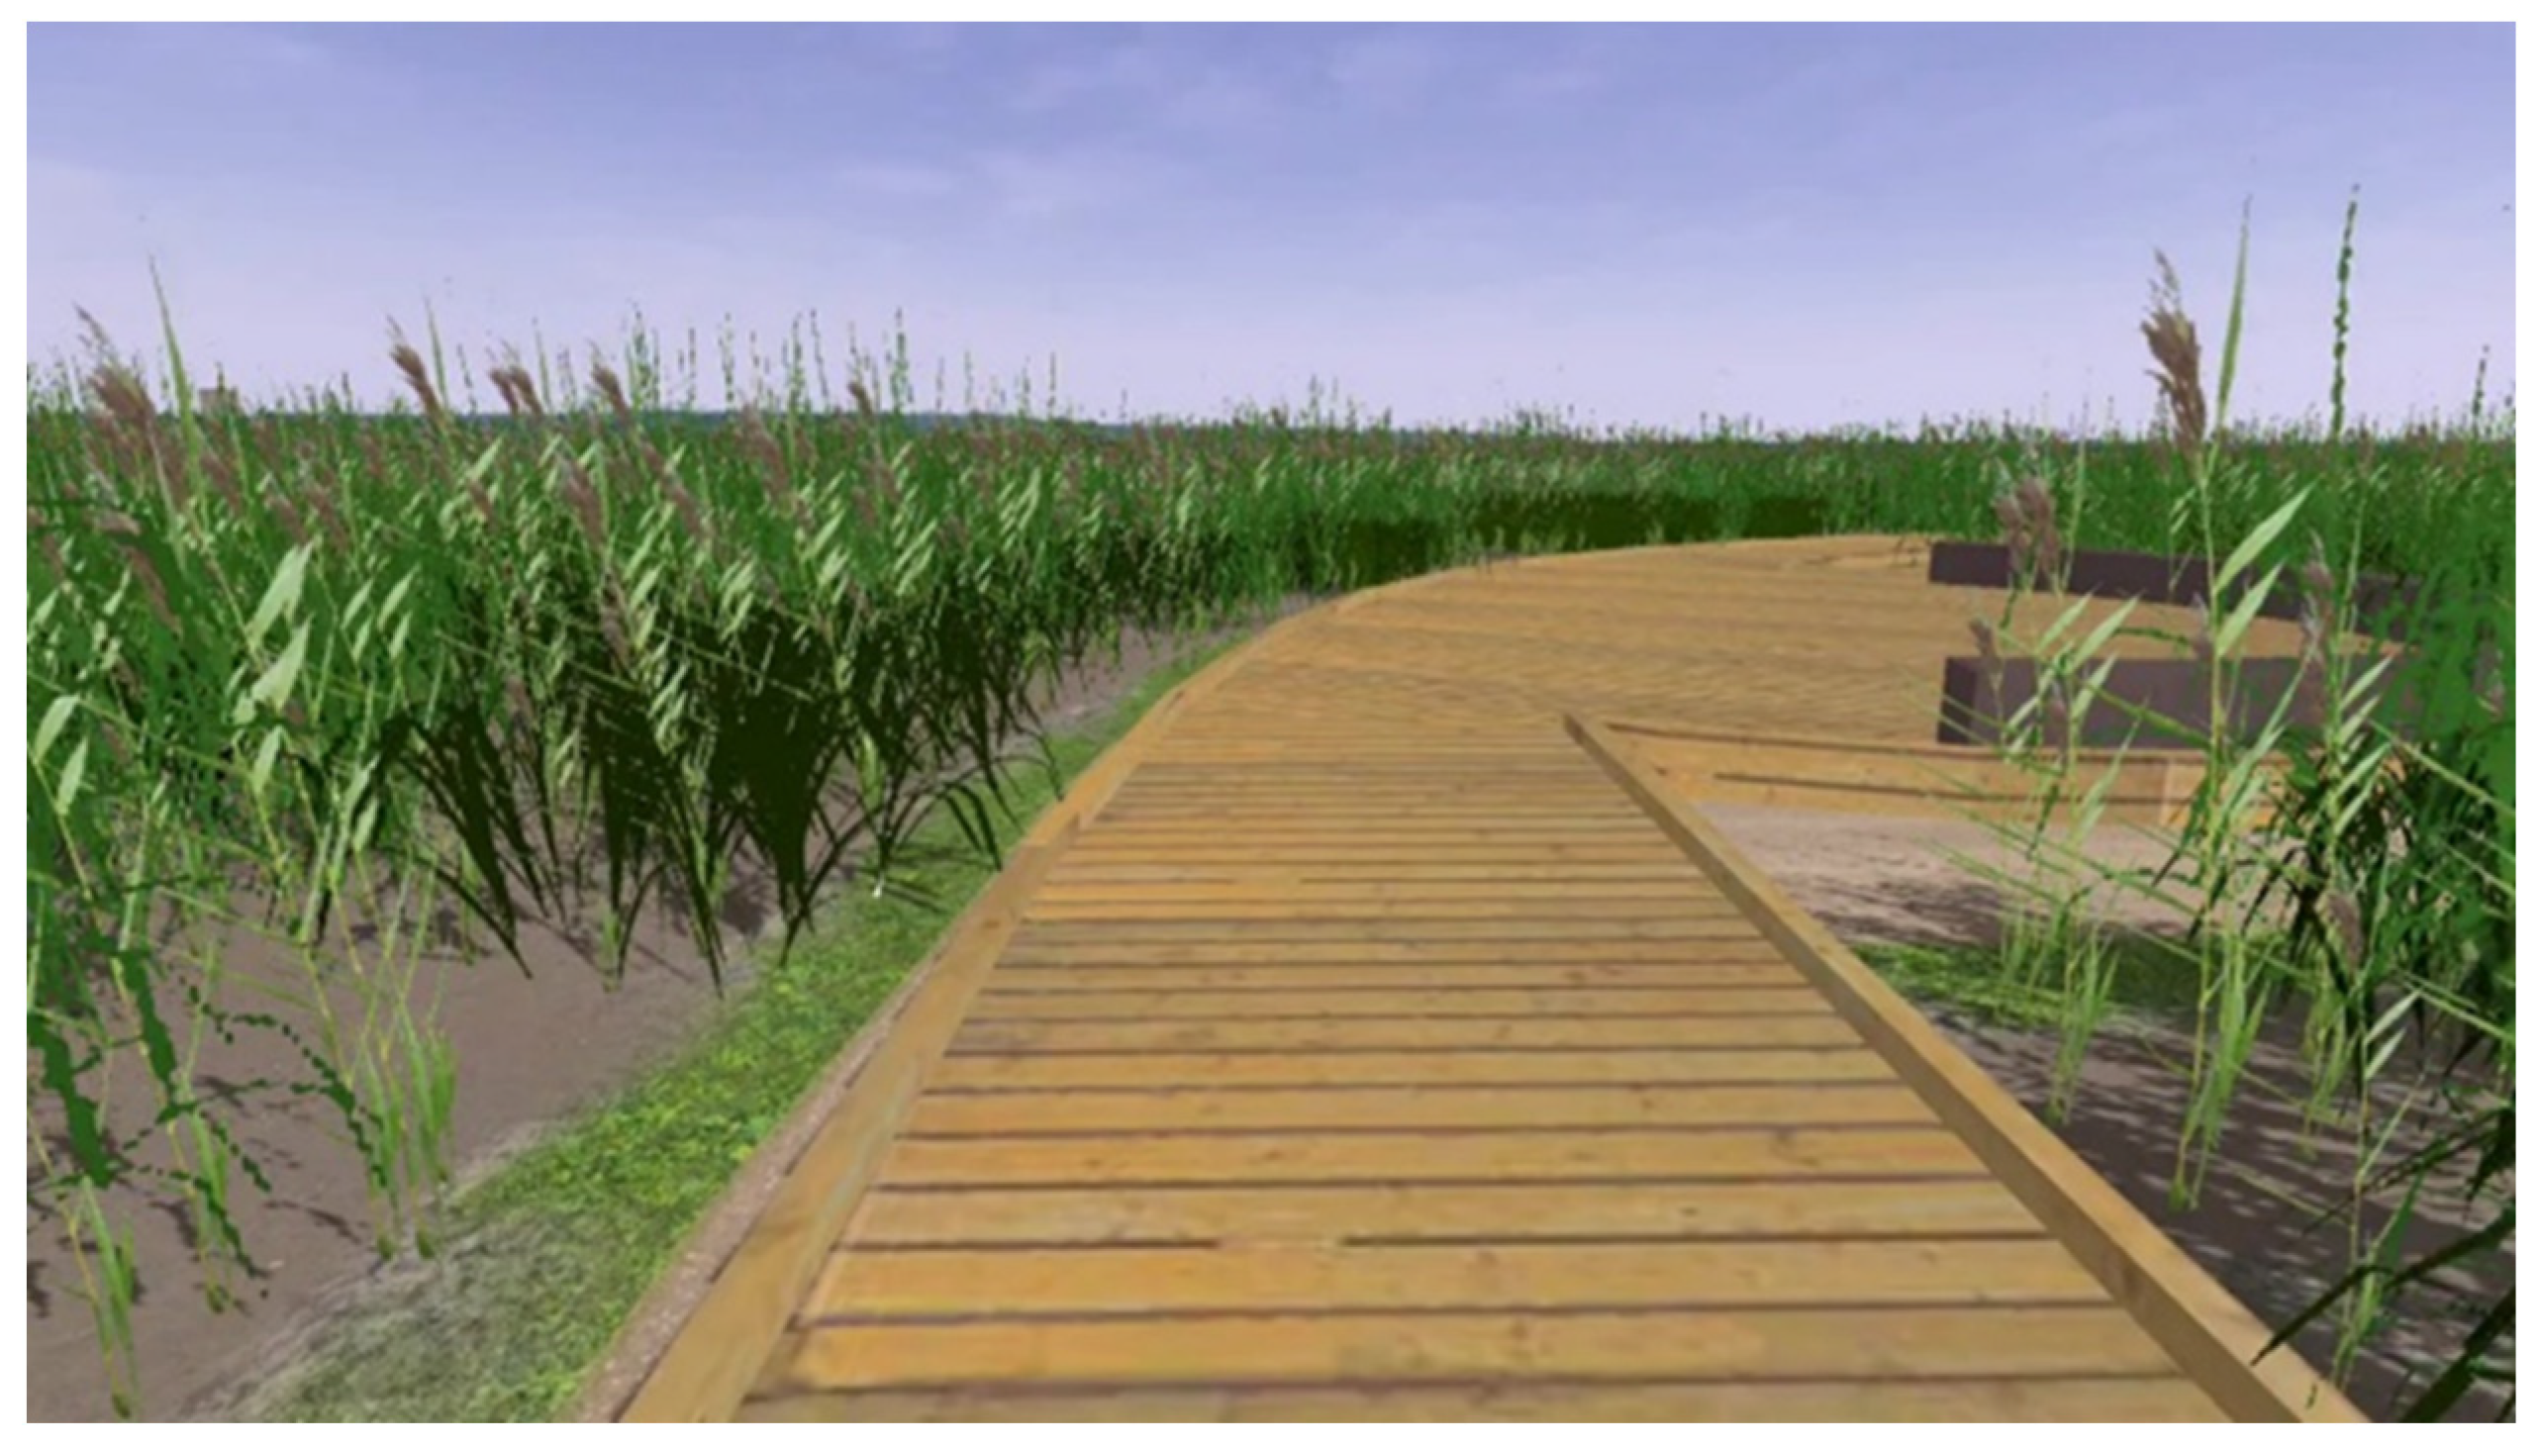
Sustainability 12 10656 g015
Figure 16. The final VR model of the Reed Option 3 Winding boardwalk with seating (Source: Peeter Vassiljev).
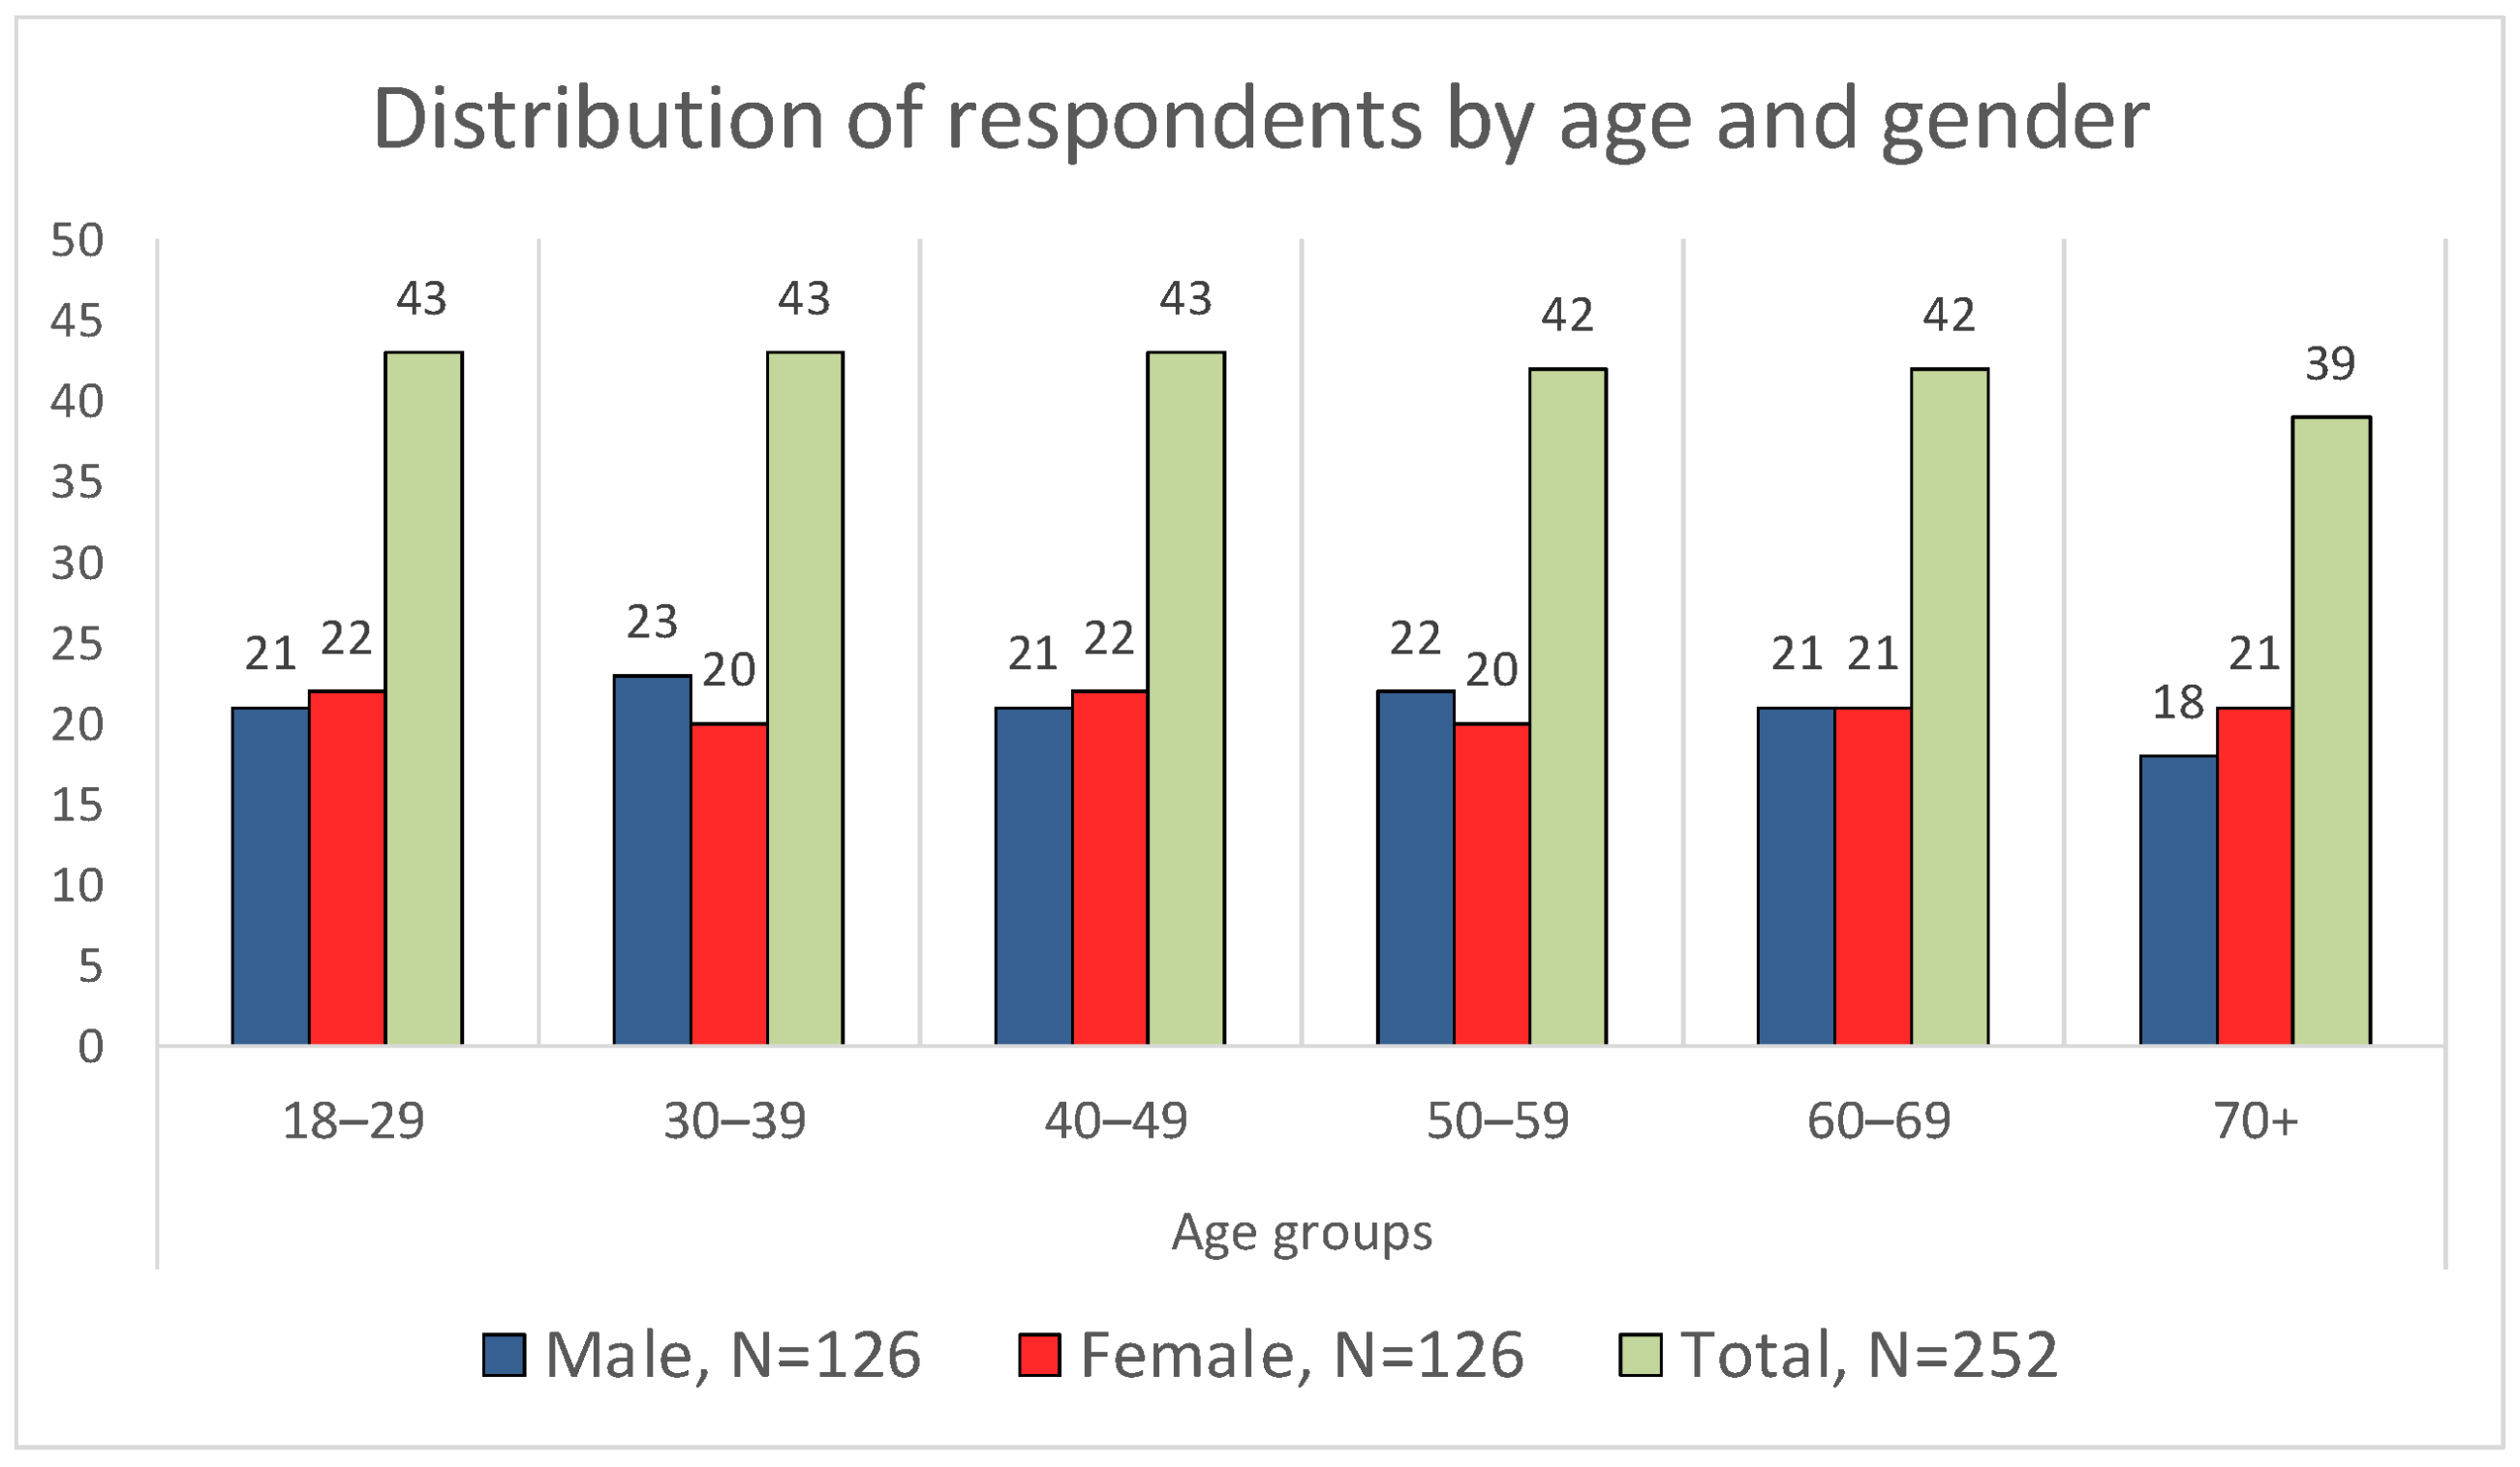
Sustainability 12 10656 g016
Figure 17. Characteristics of the survey sample by age and gender.
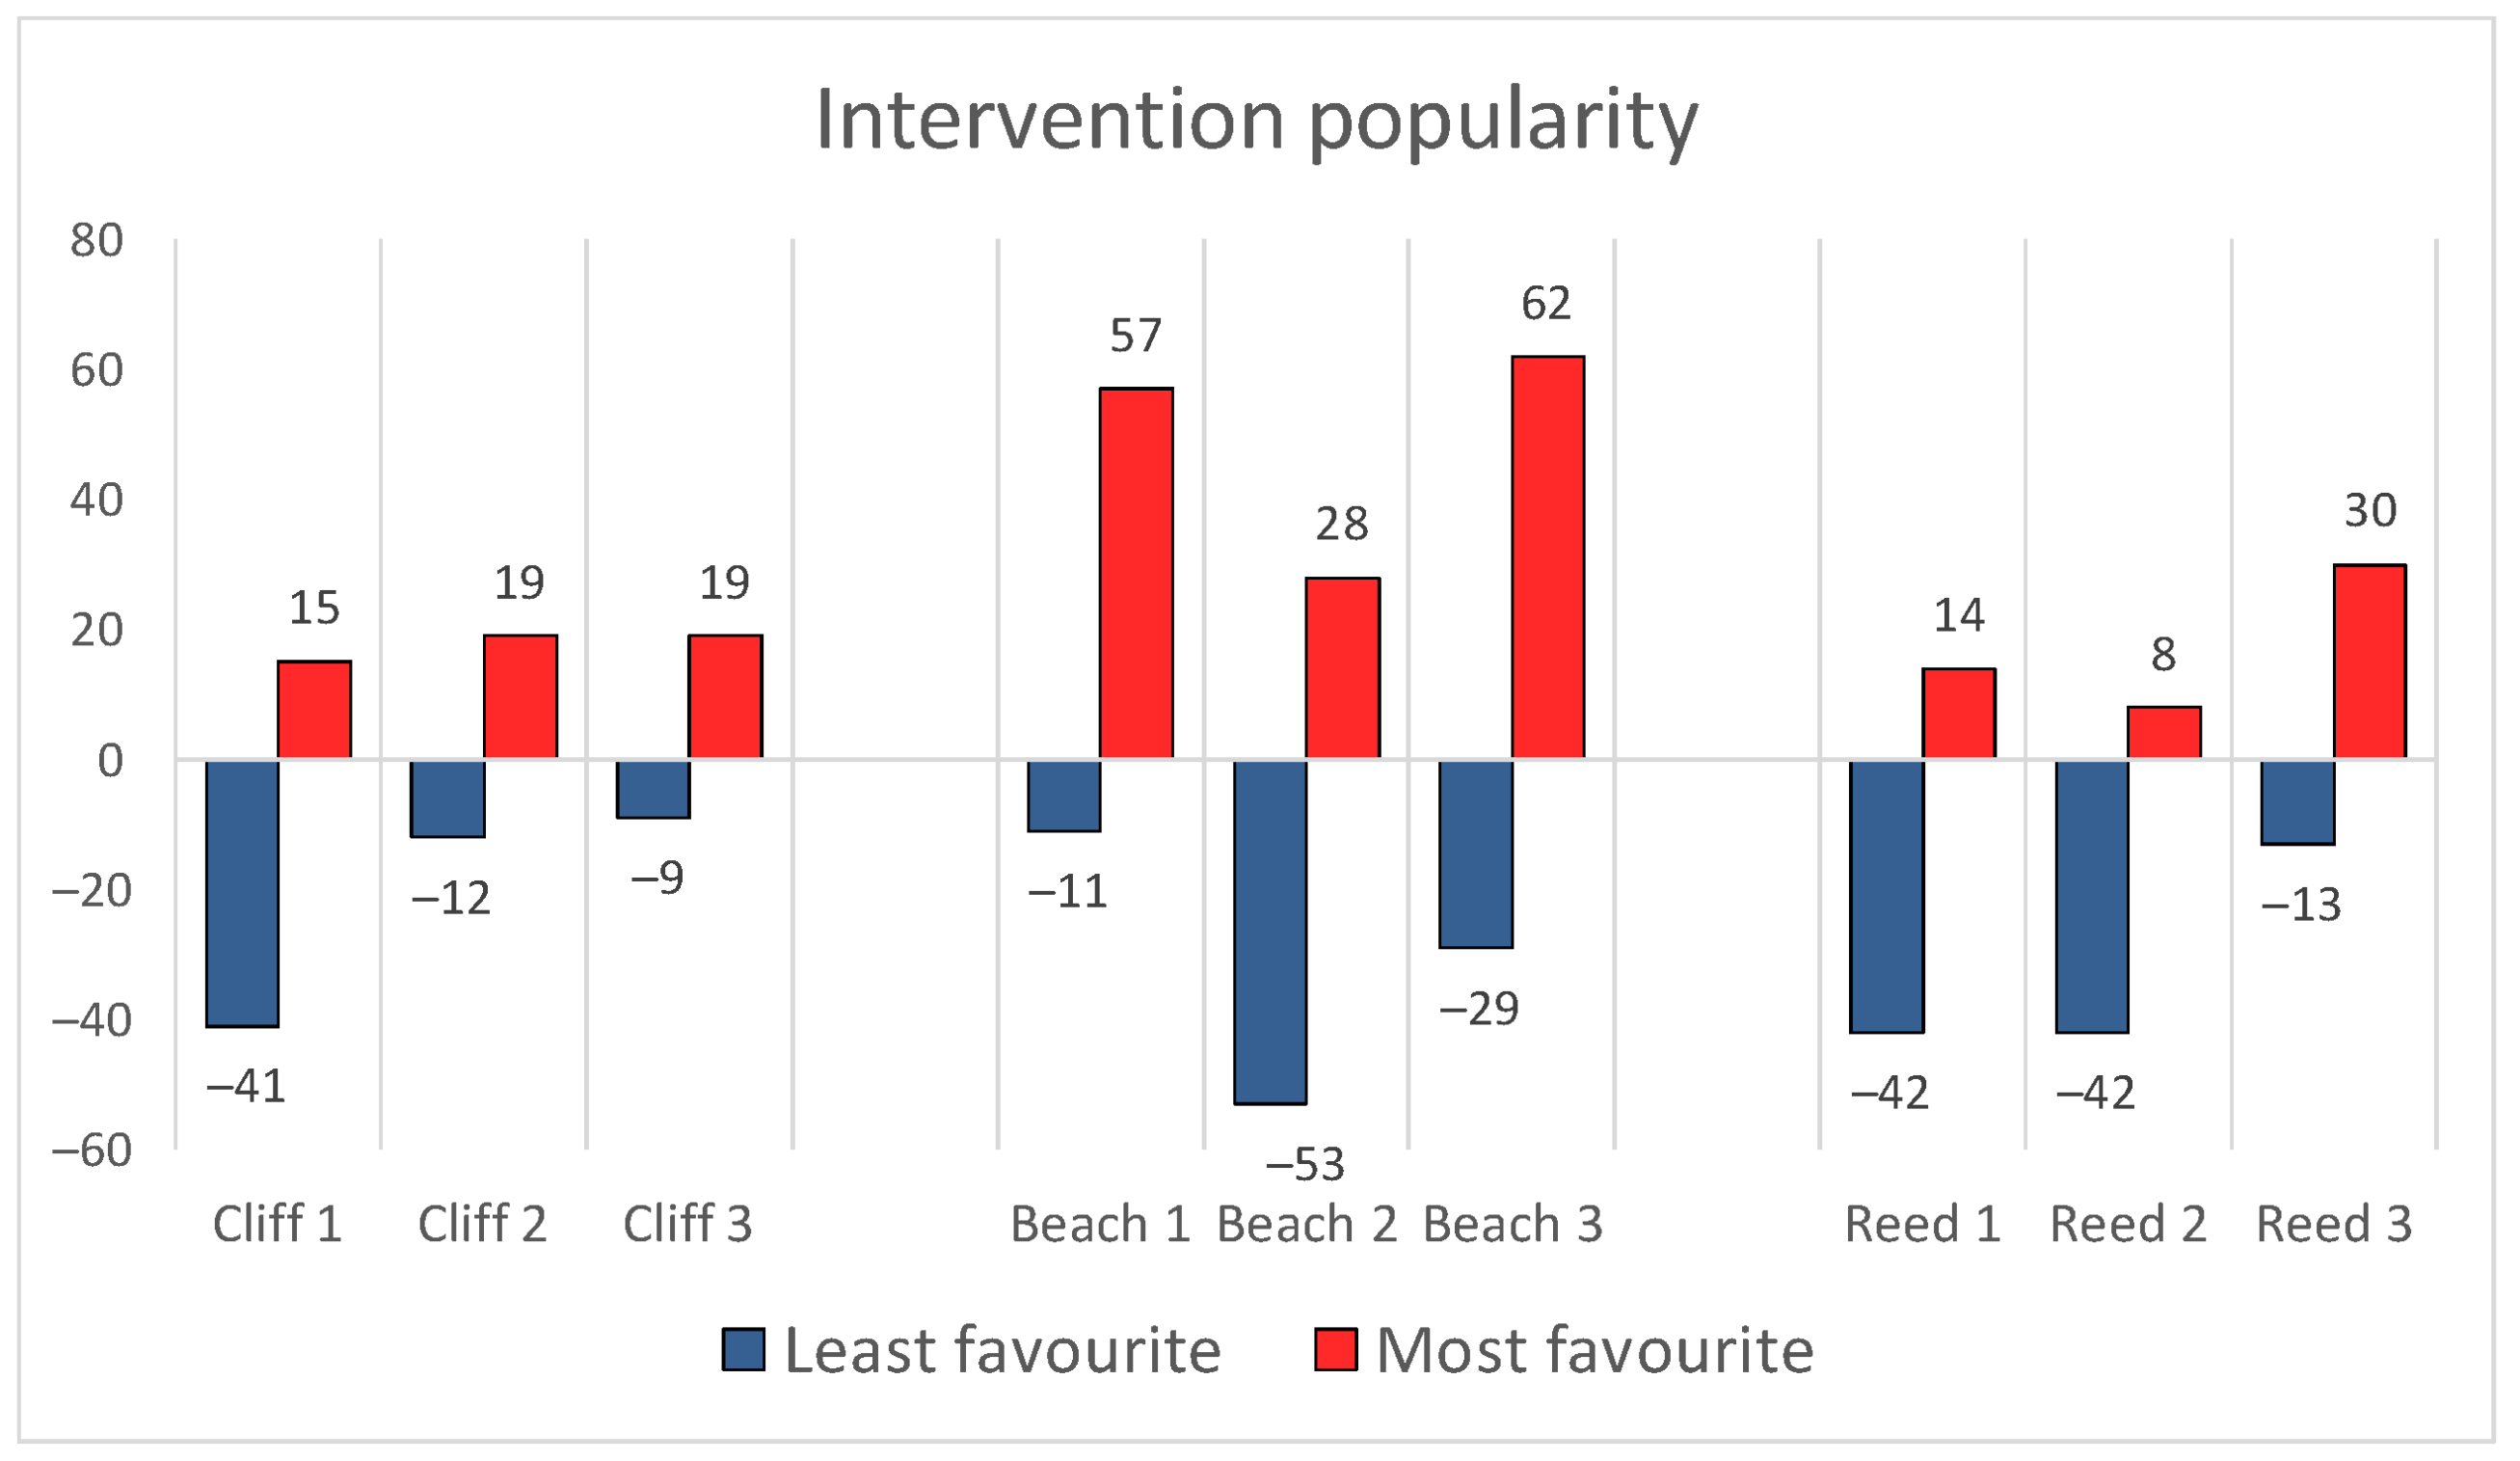
Sustainability 12 10656 g017
Figure 18. Distribution of the most favourite and least favourite intervention designs among all respondents.
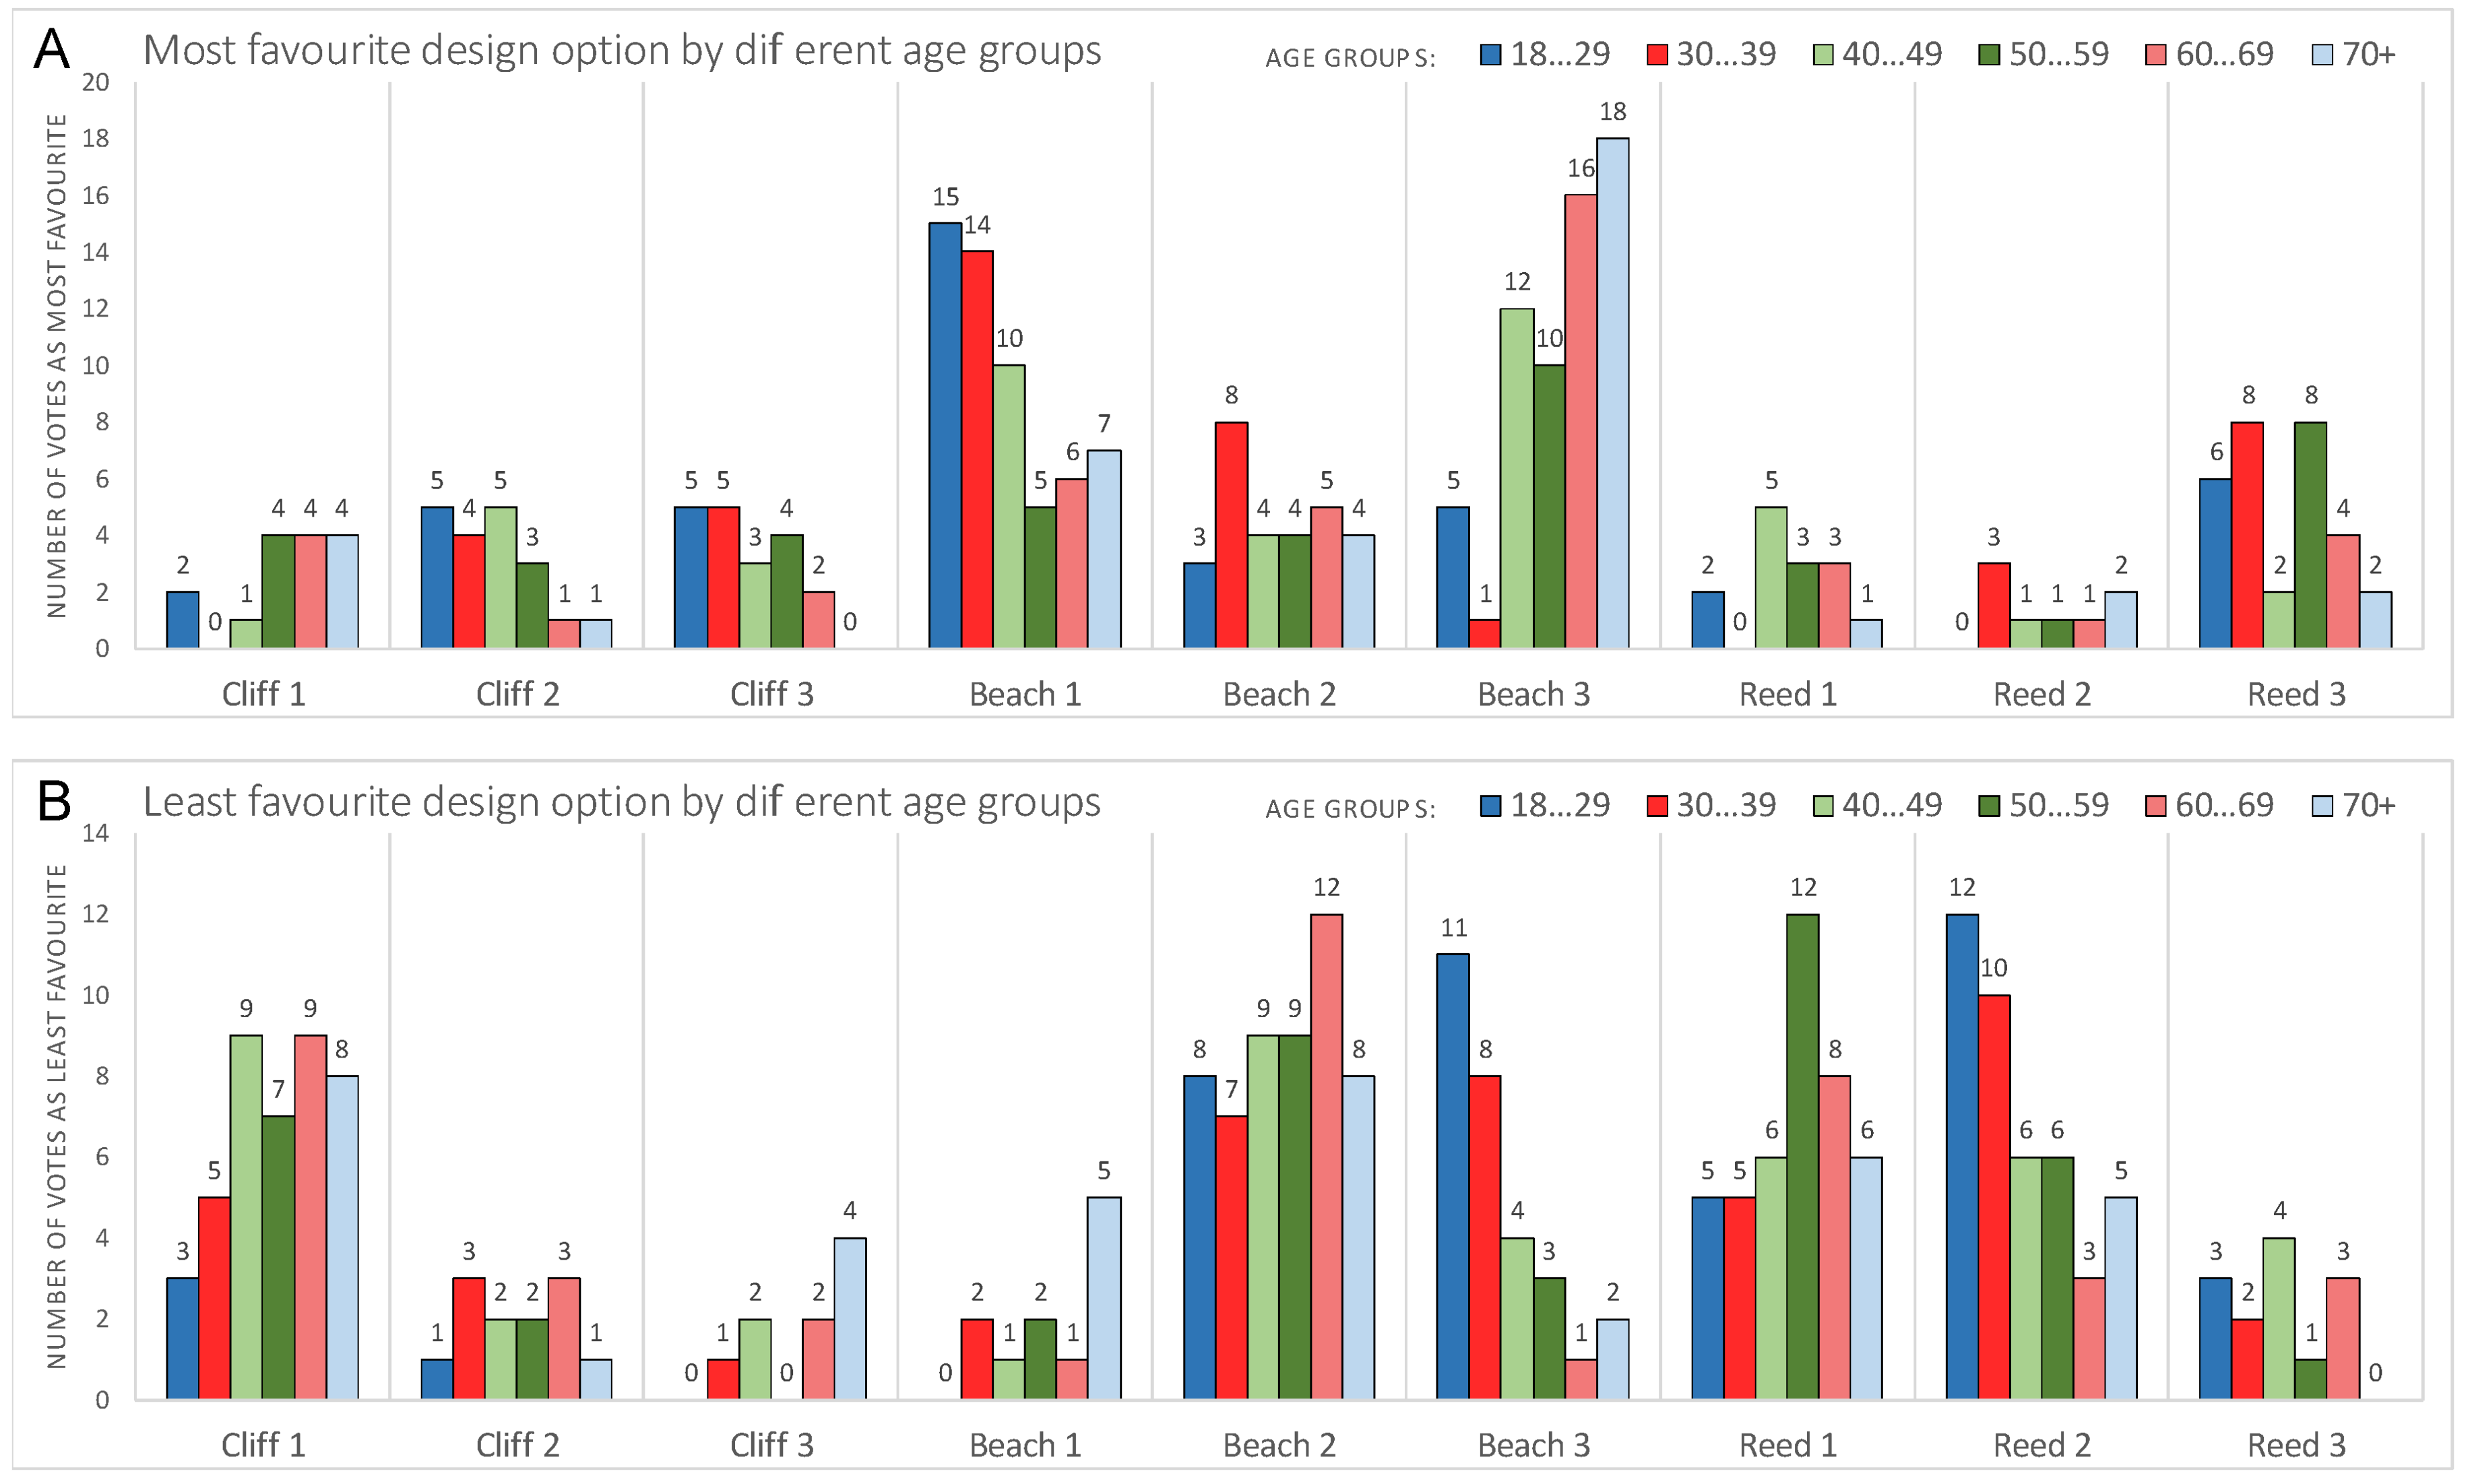
Sustainability 12 10656 g018
Figure 19. Preferences for (A) most and (B) least favourite interventions by age group.
Sustainability 12 10656 g019
Figure 20. Willingness to make a return visit to each intervention.
Sustainability 12 10656 g020
Table 1. Design criteria definition with scales of grading of each criterion; these were applied to the designs as a combination of what was possible given the physical setting and by following inspiration from other successful projects dealing with access to waterbodies in order to provide different combinations for testing by selecting the relevant grading level.
Design CriterionGradeAvailable Activities or Environmental Properties
Direct contact with water5swimming, bathing, diving
4touching the water, wading, paddling
3possible to touch but with some effort, contact with splashing water
2possible to hear sound of water, contact with splashing water if there are big waves
1no direct contact
Accessible design5accessible for all, with comfortable options for staying there for many user groups and with wind/sun shelter/shade
4accessible for many user groups, has comfortable options for staying there
3accessible for many or has comfortable options for staying there
2accessible for some groups or has some seating
1less accessible for many groups, has no resting options
Open view to water5more than 180°
4view around 135°
3view around 90° or disturbed
2very narrow or disturbed view
1no view
Contact with wildlife and vegetation5lush and diverse vegetation, wildlife with opportunity to “immerse”: hear, smell and touch
4lush vegetation, wildlife without opportunity to “immerse”, or less diversity in vegetation
3some contact with vegetation or wildlife, without high diversity
2mostly anthropogenic environment but opportunity to see some wildlife by chance
1no contact with wildlife, no vegetation
Social interaction5opportunities for public events, gathering in bigger or smaller groups, in couples, alone, watching other people
4opportunities for gathering in bigger or smaller groups, as couples, alone, watching other people
3opportunities to gather in smaller groups, as couples, alone
2opportunities to stay as couples, but uncomfortable with more people
1no social interaction potential
Table 2. The main contents of the survey questionnaire.
What Language Would You Prefer for this Survey?
Please Indicate Your Age in Years
Please Indicate Your Sex
<Q1> How much free time would you spend here on a warm summer day if you are visiting the area couple of times a week?
Very little (a few minutes) 1—2—3—4—5 Quite a lot (more than 1 h)
<Q2> How comfortable would you find the place to be for you?
Very uncomfortable 1—2—3—4—5 Very comfortable
Please assess how much you agree to the following statements.
<Q3> “I could enjoy the view”
Not at all 1—2—3—4—5 Yes, very much so
<Q4> “I could feel closer to nature”
Not at all 1—2—3—4—5 Yes, very much so
<Q5> “I could feel safe and protected from danger”
Not at all 1—2—3—4—5 Yes, very much so
<Q6> “I could feel relaxed and less stressful”
Not at all 1—2—3—4—5 Yes, very much so
<Q7> “I would like to spend time with my family or/and friends at this place”
Not at all 1—2—3—4—5 Yes, very much so
<Q8> “I could enjoy watching and/or interaction with wildlife (e.g., birds, fish, insects, flowers)”
Not at all 1—2—3—4—5 Yes, very much so
<Q9> “I could make direct contact with water (touch or enter the water, e.g., to paddle or swim)”
Not at all 1—2—3—4—5 Yes, very much so
<Q10> How accessible do you think this design is?
Difficult for me to access 1—2—3—4—5 Easy for me to access
<Q11> If this was a real place, would you come back for a return visit?
Yes—No
<Q12> Please write some comments if you have any about what you think is particularly good or bad about this design.
<Q13> Please assess which of the designs is your most favourite.
<Q14> Please assess which of the designs is your least favourite.
<Q17> Please indicate which of these seven diagrams below best describes your relationship with the natural environment. How interconnected are you with nature?
Sustainability 12 10656 i001
Table 3. Mean scores and standard deviations for responses to the question: “How much free time would you spend here on a warm summer day if you are visiting the area couple of times a week?”, on a scale from 1 (very little—a few minutes) to 5 (quite a lot—more than 1 h). Darker green signifies higher values, darker blue signifies greater standard deviation.
Cliff 1Cliff 2Cliff 3Beach 1Beach 2Beach 3Reed 1Reed 2Reed 3
Mean2.633.233.063.412.963.552.872.733.32
Std. Deviation1.2321.2381.2831.2671.3871.2411.4101.2751.260
Table 4. Mean scores and standard deviations for responses to the question: “How comfortable would you find the place to be for you?” on a scale from 1 = Very uncomfortable to 5 = Very comfortable. Darker green signifies higher values, darker blue signifies greater standard deviation.
Cliff 1Cliff 2Cliff 3Beach 1Beach 2Beach 3Reed 1Reed 2Reed 3
Mean2.883.253.053.393.023.482.892.783.30
Std. Deviation1.1631.1861.2001.2431.3031.1721.3451.2221.212
Table 5. Mean scores and standard deviations for responses to the question: “I could enjoy the view.” on a scale from 1 = Not at all to 5 = Yes, very much so. Darker green signifies higher values, darker blue signifies greater standard deviation.
Cliff 1Cliff 2Cliff 3Beach 1Beach 2Beach 3Reed 1Reed 2Reed 3
Mean3.823.713.543.613.183.813.373.013.40
Std. Deviation1.1721.2051.2311.3211.3371.0661.3371.3211.307
Table 6. Mean scores and standard deviations for responses to the question: “I could feel closer to nature.” on a scale from 1 = Not at all to 5 = Yes, very much so. Darker green signifies higher values, darker blue signifies greater standard deviation.
Cliff 1Cliff 2Cliff 3Beach 1Beach 2Beach 3Reed 1Reed 2Reed 3
Mean3.103.233.283.102.853.583.343.373.60
Std. Deviation1.2311.2691.2311.3871.3091.2001.2911.2051.228
Table 7. Mean scores and standard deviations for responses to the question: “I could feel safe and protected from danger.” on a scale from 1 = Not at all to 5 = Yes, very much so. Darker green signifies higher values, darker blue signifies greater standard deviation.
Cliff 1Cliff 2Cliff 3Beach 1Beach 2Beach 3Reed 1Reed 2Reed 3
Mean3.223.333.213.543.203.503.373.013.38
Std. Deviation1.1561.1331.1301.1511.2341.0691.2481.2081.159
Table 8. Mean scores and standard deviations for responses to the question: “I could feel relaxed and less stressful.” on a scale from 1 = Not at all to 5 = Yes, very much so. Darker green signifies higher values, darker blue signifies greater standard deviation.
Cliff 1Cliff 2Cliff 3Beach 1Beach 2Beach 3Reed 1Reed 2Reed 3
Mean3.153.353.243.393.063.623.233.073.46
Std. Deviation1.1681.1901.2151.2941.2811.0851.3091.2251.182
Table 9. Mean scores and standard deviations for responses to the question: “I would like to spend time with my family or/and friends at this place.” on a scale from 1 = Not at all to 5 = Yes, very much so. Darker green signifies higher values, darker blue signifies greater standard deviation.
Cliff 1Cliff 2Cliff 3Beach 1Beach 2Beach 3Reed 1Reed 2Reed 3
Mean2.773.263.083.353.043.642.852.753.32
Std. Deviation1.2781.3061.3261.3681.3631.2141.3651.3021.292
Table 10. Mean scores and standard deviations for responses to the question: “I could enjoy watching and/or interaction with wildlife.” on a scale from 1 = Not at all to 5 = Yes, very much so. Darker green signifies higher values, darker blue signifies greater standard deviation.
Cliff 1Cliff 2Cliff 3Beach 1Beach 2Beach 3Reed 1Reed 2Reed 3
Mean3.083.083.152.962.773.333.193.213.39
Std. Deviation1.2771.2571.3201.3681.2531.1881.3651.2651.247
Table 11. Mean scores and standard deviations for responses to the question: “I could make direct contact with water (touch or enter the water).” on a scale from 1 = Not at all to 5 = Yes, very much so. Darker green signifies higher values, darker blue signifies greater standard deviation.
Cliff 1Cliff 2Cliff 3Beach 1Beach 2Beach 3Reed 1Reed 2Reed 3
Mean2.443.453.423.433.253.812.372.732.99
Std. Deviation1.3541.2531.3961.3441.3771.2481.4941.3711.368
Table 12. Mean scores and standard deviations for responses to the question: “How accessible do you think this design is?” on a scale from 1 = Not at all to 5 = Yes, very much so. Darker green signifies higher values, darker blue signifies greater standard deviation.
Cliff 1Cliff 2Cliff 3Beach 1Beach 2Beach 3Reed 1Reed 2Reed 3
Mean3.343.613.483.623.333.883.043.193.33
Std. Deviation1.2351.1871.2451.2551.2811.1211.3921.2941.289
Table 13. Correlations (Kendall’s tau b) between age group and question responses. The colours range from darker blue (highest correlation) to lighter blue (lowest correlation). Non-significant correlations are indicated with “ns”. Cumulative sums of correlations coloured with greens and lilacs help indicate the factors and design options that stand out (with the darkest colour indicating larger values).
Kendall’s tau_b Correlations between Age Group and Question ResponsesCliffBeachReedCumulative Sum Per Factor
123123123
<Q1> spending free timens−0.18−0.24−0.24−0.15ns−0.21−0.11−0.21−1.34
<Q2> comfortable place−0.12−0.23−0.27−0.26−0.15ns−0.21−0.17−0.21−1.62
<Q3> enjoy the view−0.22−0.31−0.27−0.24−0.20ns−0.32−0.20−0.24−1.99
<Q4> feel closer to nature−0.11−0.29−0.24−0.21−0.19ns−0.26−0.26−0.28−1.83
<Q5> safe from danger−0.15−0.23−0.25−0.20−0.17ns−0.26−0.22−0.20−1.69
<Q6> relaxed and less stressful−0.18−0.26−0.26−0.26−0.21ns−0.31−0.25−0.24−1.97
<Q7> spend time with family and friends−0.16−0.28−0.30−0.29−0.23ns−0.29−0.22−0.24−2.01
<Q8> watching wildlife−0.15−0.27−0.30−0.21−0.19ns−0.26−0.26−0.25−1.90
<Q9> direct contact with waterns−0.33−0.33−0.23−0.18nsns−0.19ns−1.26
<Q10> accessible design−0.13−0.21−0.27−0.24−0.17ns−0.23−0.18−0.23−1.66
<Q11> return visit?−0.16−0.24−0.26−0.28−0.23ns−0.25−0.17−0.24−1.83
Cumulative sum per design option−1.38−2.83−2.99−2.64−2.060.00−2.63−2.24−2.35
Table 14. Scale statistics for “composite affordance” scores of design options.
Mean (N = 9)Std. DeviationRank by Mean
Cliff 127.818.9666
Cliff 230.279.3883
Cliff 329.469.7885
Beach 130.409.9632
Beach 227.7110.1297
Beach 332.658.7161
Reed 127.6610.1478
Reed 227.119.4699
Reed 330.179.4864
Table 15. Correlations (Kendall’s tau b, N = 252) heatmap between questions on affordances and how much free time a respondent would be willing to spend at each intervention and how likely they would be to come back again. The colours range from darker blue (highest correlation) to lighter blue (lowest correlation).
<Q1> How Much Free Time Would You Spend Here on a Warm Summer Day if You Are Visiting the Area Couple of Times a Week?<Q11> If This Was a Real Place, Would You Come Back for a Return Visit?
CliffBeachReedCliffBeachReed
123123123123123123
<Q2>0.690.750.770.770.780.790.790.780.750.570.610.620.620.640.570.620.630.57
<Q3>0.340.550.580.680.620.580.570.560.630.440.470.540.570.570.410.520.530.53
<Q4>0.490.610.620.680.610.630.630.560.620.500.530.520.540.530.520.600.470.52
<Q5>0.390.570.610.560.570.550.530.530.570.440.480.540.480.500.440.470.510.50
<Q6>0.500.620.650.710.700.640.640.620.640.470.550.650.580.640.530.550.580.58
<Q7>0.650.680.720.750.710.710.720.690.680.590.600.620.620.640.550.620.610.60
<Q8>0.510.560.580.570.540.550.590.520.570.500.490.530.470.480.510.530.500.50
<Q9>0.540.540.540.610.580.550.550.500.490.410.470.520.440.560.440.420.410.34
<Q10>0.360.480.460.560.480.440.550.450.500.350.410.490.440.490.330.520.430.46
1.00.90.80.70.60.50.40.30.20.10.0
Table 16. Heatmap (Kendall’s tau b) for respondents with lower INS (Inclusion of Nature in Self) scores (below 4 on 7-point scale, N = 55) for correlations between questions on affordances and interest in spending time and returning to the intervention sites (colours relate to the order of correlation strength as per Table 15 and white cells mean non-significant correlation).
<Q1> How Much Free Time Would You Spend Here on a Warm Summer Day if You Are Visiting the Area Couple of Times a Week?<Q11> If this Was a Real Place, Would You Come Back for a Return Visit?
CliffBeachReedCliffBeachReed
123123123123123123
<Q2>0.620.590.650.720.680.760.820.750.750.530.610.560.700.580.560.650.650.53
<Q3> 0.490.580.570.530.510.590.420.360.370.520.620.640.580.300.540.320.44
<Q4>0.430.490.550.590.570.460.600.480.380.530.560.460.590.410.360.630.310.48
<Q5>0.360.390.540.470.520.510.560.480.480.380.410.460.410.460.370.580.440.56
<Q6>0.510.510.630.650.580.600.670.570.460.420.590.590.620.590.470.610.510.49
<Q7>0.630.580.660.630.600.690.720.700.450.570.680.490.650.620.520.690.570.56
<Q8>0.520.410.530.540.560.520.530.450.430.460.550.440.460.350.480.490.420.35
<Q9>0.410.430.460.530.550.470.640.540.390.280.530.510.440.420.310.510.430.35
<Q10>0.280.550.460.430.550.280.530.320.38 0.420.600.430.61 0.510.250.34
1.00.90.80.70.60.50.40.30.20.10.0ns
Table 17. Correlations (Kendall’s tau b) between respondents with higher INS scores (above 5 on 7-point scale, N = 83) for their interest in spending time and returning to the intervention sites (colours relate to the order of correlation strength as per Table 15).
<Q1> How Much Free Time Would You Spend Here on a Warm Summer Day if You Are Visiting the Area Couple of Times a Week?<Q11> If this Was a Real place, Would You Come Back for a Return Visit?
CliffBeachReedCliffBeachReed
123123123123123123
<Q2>0.700.810.840.770.820.840.810.830.840.570.630.670.610.680.630.710.700.63
<Q3>0.430.660.690.720.690.650.640.660.770.480.520.620.570.540.550.690.610.64
<Q4>0.610.730.690.720.670.740.670.710.770.490.620.650.530.560.610.700.570.64
<Q5>0.410.700.640.670.640.590.560.720.670.490.590.650.540.560.460.570.620.63
<Q6>0.530.680.660.730.760.630.680.740.760.520.580.700.600.640.560.650.690.67
<Q7>0.690.750.750.790.710.740.720.700.800.580.640.690.630.630.640.690.620.66
<Q8>0.550.640.630.620.540.620.730.650.700.540.530.600.480.550.600.700.640.59
<Q9>0.570.670.610.640.570.660.500.540.610.480.510.570.390.550.530.340.470.44
<Q10>0.420.570.470.600.490.600.620.590.640.530.530.530.400.500.530.590.540.58
1.00.90.80.70.60.50.40.30.20.10.0
Table 18. Correlation of gender, INS score and importance of access to water against Question 9 for each design option; (N = 252, significant correlations have been marked with green colour).
<Q9> “I Could Make Direct Contact with Water (Touch or Enter the Water)”
CliffBeachReed
123123123
Gender 1 = male, 2 = femaleKendall’s tau B0.039−0.015−0.047−0.047−0.003−0.0360.0090.124−0.074
p0.4910.7900.4130.4110.9550.5350.8780.0290.192
<Q17> INS scoreKendall’s tau B0.056−0.008−0.052−0.022−0.0450.0200.0180.0920.073
p0.2690.8760.3050.6580.3720.6940.7220.0680.145
<Q9.1> Importance of water contactKendall’s tau B0.1610.1760.1540.1220.0550.2230.1410.2130.140
p0.0020.0010.0040.0210.2960.0000.0080.0000.008
Table 19. Number of comments about each design option that can be categorised as negative, mixed or positive and sometimes additionally categorised as expressing struggle to understand the simulation or disapproval of functionality. Nonsensical comments have been omitted.
Design OptionNegative CommentsMixed ResponsePositive CommentsStruggle to UnderstandDisapproved of FunctionalityMost Frequent or Notable Ideas
Cliff 1
n = 96
361627132Small size mattered; nothing special; lack of seats and activities; cannot access water; felt unsafe; recognised the expansive sea view and asked for a telescope.
Cliff 2
n = 96
331331213Pompous; affordance of spending time with friends and family can be good benefit here; too many steps for some; asked for more railing for the safety of the children; many people did not like a rocky beach at all. Some worries about crowding.
Cliff 3
n = 102
431329320Mixed reaction for concrete platform under shallow water; steps are disliked for tripping hazard and wheelchair access problems and liked for sunbathing and view affordance; concerns about the material slipperiness and durability.
Beach 1
n = 107
411735615Artificial and very little nature; urban; indoor pool not in blend with nature, the problem in understanding the real scenario. Worries about crowding because of the narrowness. Worries about the accumulation of pollution in the water.
Beach 2
n = 107
4416342016Monstrous, too artificial and very little nature; struggle to understand the purpose of plywood sculptures or mistaking them for rocks, looks like a skate-park. Appreciation of roof protecting from the elements.
Beach 3
n = 100
331039615Space for events and regular beach activities; deck can be sandy; most of the mixed reviews are positive but request some additional facilities like WC or benches to run it. Negative comments say that structures are pointless as they are similar to the regular sandy beach.
Reed 1
n = 114
601717058Disliked mostly because of not being allowed to access the sea; length of the walk and narrowness annoyed; doubts about durability, wire fence, no seating; did not like the dead end.
Reed 2
n = 101
472315725Desire of connection with the beach; could not understand the purpose of the elevated seat; too narrow; too long; suitable for family or single person use.
Reed 3
n = 100
342329013Too long a walk; concerned about wild animals; asked for railing, covered benches and additional facilities; complaints about not providing access to beach at the end of the walk.
Publisher’s Note: MDPI stays neutral with regard to jurisdictional claims in published maps and institutional affiliations.

