Article

The Effects of Water Levels and Interspecific Competition on Two Carex Species in a Temperate Wetland of Northeast China

1
University of Chinese Academy of Science, Beijing 100049, China
2
Key Laboratory of Wetland Ecology and Environment, Northeast Institute of Geography and Agroecology, Chinese Academy of Sciences, Changchun 130102, China
3
National Observation and Research Station of Wetland Ecology, Sanjiang Plain, Tongjiang 156400, China
4
School of Environment, Nanjing Normal University, Nanjing 210046, China
*
Author to whom correspondence should be addressed.
Sustainability 2020, 12(24), 10654; https://doi.org/10.3390/su122410654
Submission received: 13 November 2020 / Revised: 14 December 2020 / Accepted: 15 December 2020 / Published: 20 December 2020
(This article belongs to the Special Issue Wetland Ecosystem under Climate Change)

Abstract

:
Zonation along a water level is the main spatial distribution characteristic of wetland plants. This is mainly because of the influences of hydrological conditions and interspecific competition, which finally narrow the fundamental niche of a species to its realized niche. In the present study, a controlled experiment was conducted in order to analyze the relationship between Carex lasiocarpa/Carex pseudocuraica and Glyceria spiculosa, in conditions of three competitive treatments at four water levels. The results showed that in no competition, C. lasiocarpa preferred low water levels, but this preference receded when competing with G. spiculosa. In contrast, C. pseudocuraica had greater preference for low water level when competing with G. spiculosa. The root/shoot ratios of the two Carex species decreased with increasing water levels, but they were almost unaffected by different competition treatments. With the increase in water level during full competition with G. spiculosa, the competitive ability of C. lasiocarpa showed an increasing trend, whereas a contrary trend was observed in C. pseudocuraica. Our results suggested the effects of water levels and their interactions with interspecific competition varied between the two Carex species and played an important role in determining spatial distribution patterns and potential community succession of wetland plants.

1. Introduction

The spatial distribution of wetland plants generally shows zonation along environmental gradients [1], which could mainly be attributed to the influences of hydrological and biotic factors [2,3,4,5]. However, because multiple factors often function together, there is still no clear consensus on the mechanism of the formation of zonation patterns and plant community development in natural wetlands. On one hand, flooding causes excessive depletion of soil oxygen, which changed soil redox conditions [6]. As a consequence, leaf stomatal conductance, photosynthesis, and biomass were influenced by inundation directly or indirectly [7,8,9]. On the other hand, the effects of the interactions between different wetland species are numerous. Ellenberg [2] demonstrated that, when interactions with other plant species were prevented, all species had very similar hydrological optima, but in contrast, in the presence of interspecific interactions, optimal growth considerably shifted to different positions along the hydrological gradient. This finding was also supported by the concept of niche presented by Hutchinson [10]. Further research by Silvertown [11] suggested that the fundamental niche of a species is narrowed to the realized niche as a consequence of interspecific competition and natural enemies. In fact, the extent to what hydrological and biotic factors affect plant species distribution could be dependent on many factors. For example, Lenssen et al. [12] found that species distribution and richness along a freshwater flooding gradient were mainly dependent on hydrology in the frequently flooded zone, whereas at higher elevations, they were mainly dependent on plant interactions.
During the process of growth and development, plants compete with adjacent individuals for water, light, and nutrients. Competition, a ubiquitous phenomenon in plant communities, has long been considered as a major force shaping plant communities [13]. However, the role of competition in community composition remains controversial, and this was discussed in the debate between Grime and Tilman on the role of competition in the formation of plant community structure [14]. The conclusions of this debate have been included in a new conceptual model of stress-gradient hypothesis which predicts a shift of plant interaction from competition to facilitation with increasing physical stress [15,16]. To date, there are still many different opinions on the competition or facilitation relationships of plants along environmental gradients [17].
The Sanjiang Plain lies in northeast China and it was once the largest national distribution area of freshwater marsh wetlands. Although the area has experienced dramatic reduction in wetland areas because of agricultural conversions, it is still an important distribution area of natural freshwater wetlands and it plays an important role in maintaining regional biodiversity. The distribution of plant communities in the wetlands of the Sanjiang Plain generally exhibits distinct plant zonation patterns along the water level gradients [6,18]. Typical plant species in these wetlands include Carex lasiocarpa Ehrh., Carex pseudocuraica F. Schmidt, and Glyceria spiculosa (Schmidt.) Roshev., and they generally occupy niches with similar hydrological conditions [19]. As a result, individuals of these species are influenced by hydrological fluctuations as well as species interactions [8]. In recent years, research was conducted on the distribution of wetland plants of the Sanjiang Plain under different water levels [5,20,21], but studies focusing on the competition between Carex species and G. spiculosa at different water levels are still quite limited. Considering the fact that the water level of the typical inundated freshwater wetlands in the Sanjiang Plain generally varies from 0 to 40 cm above the soil surface [6,20,
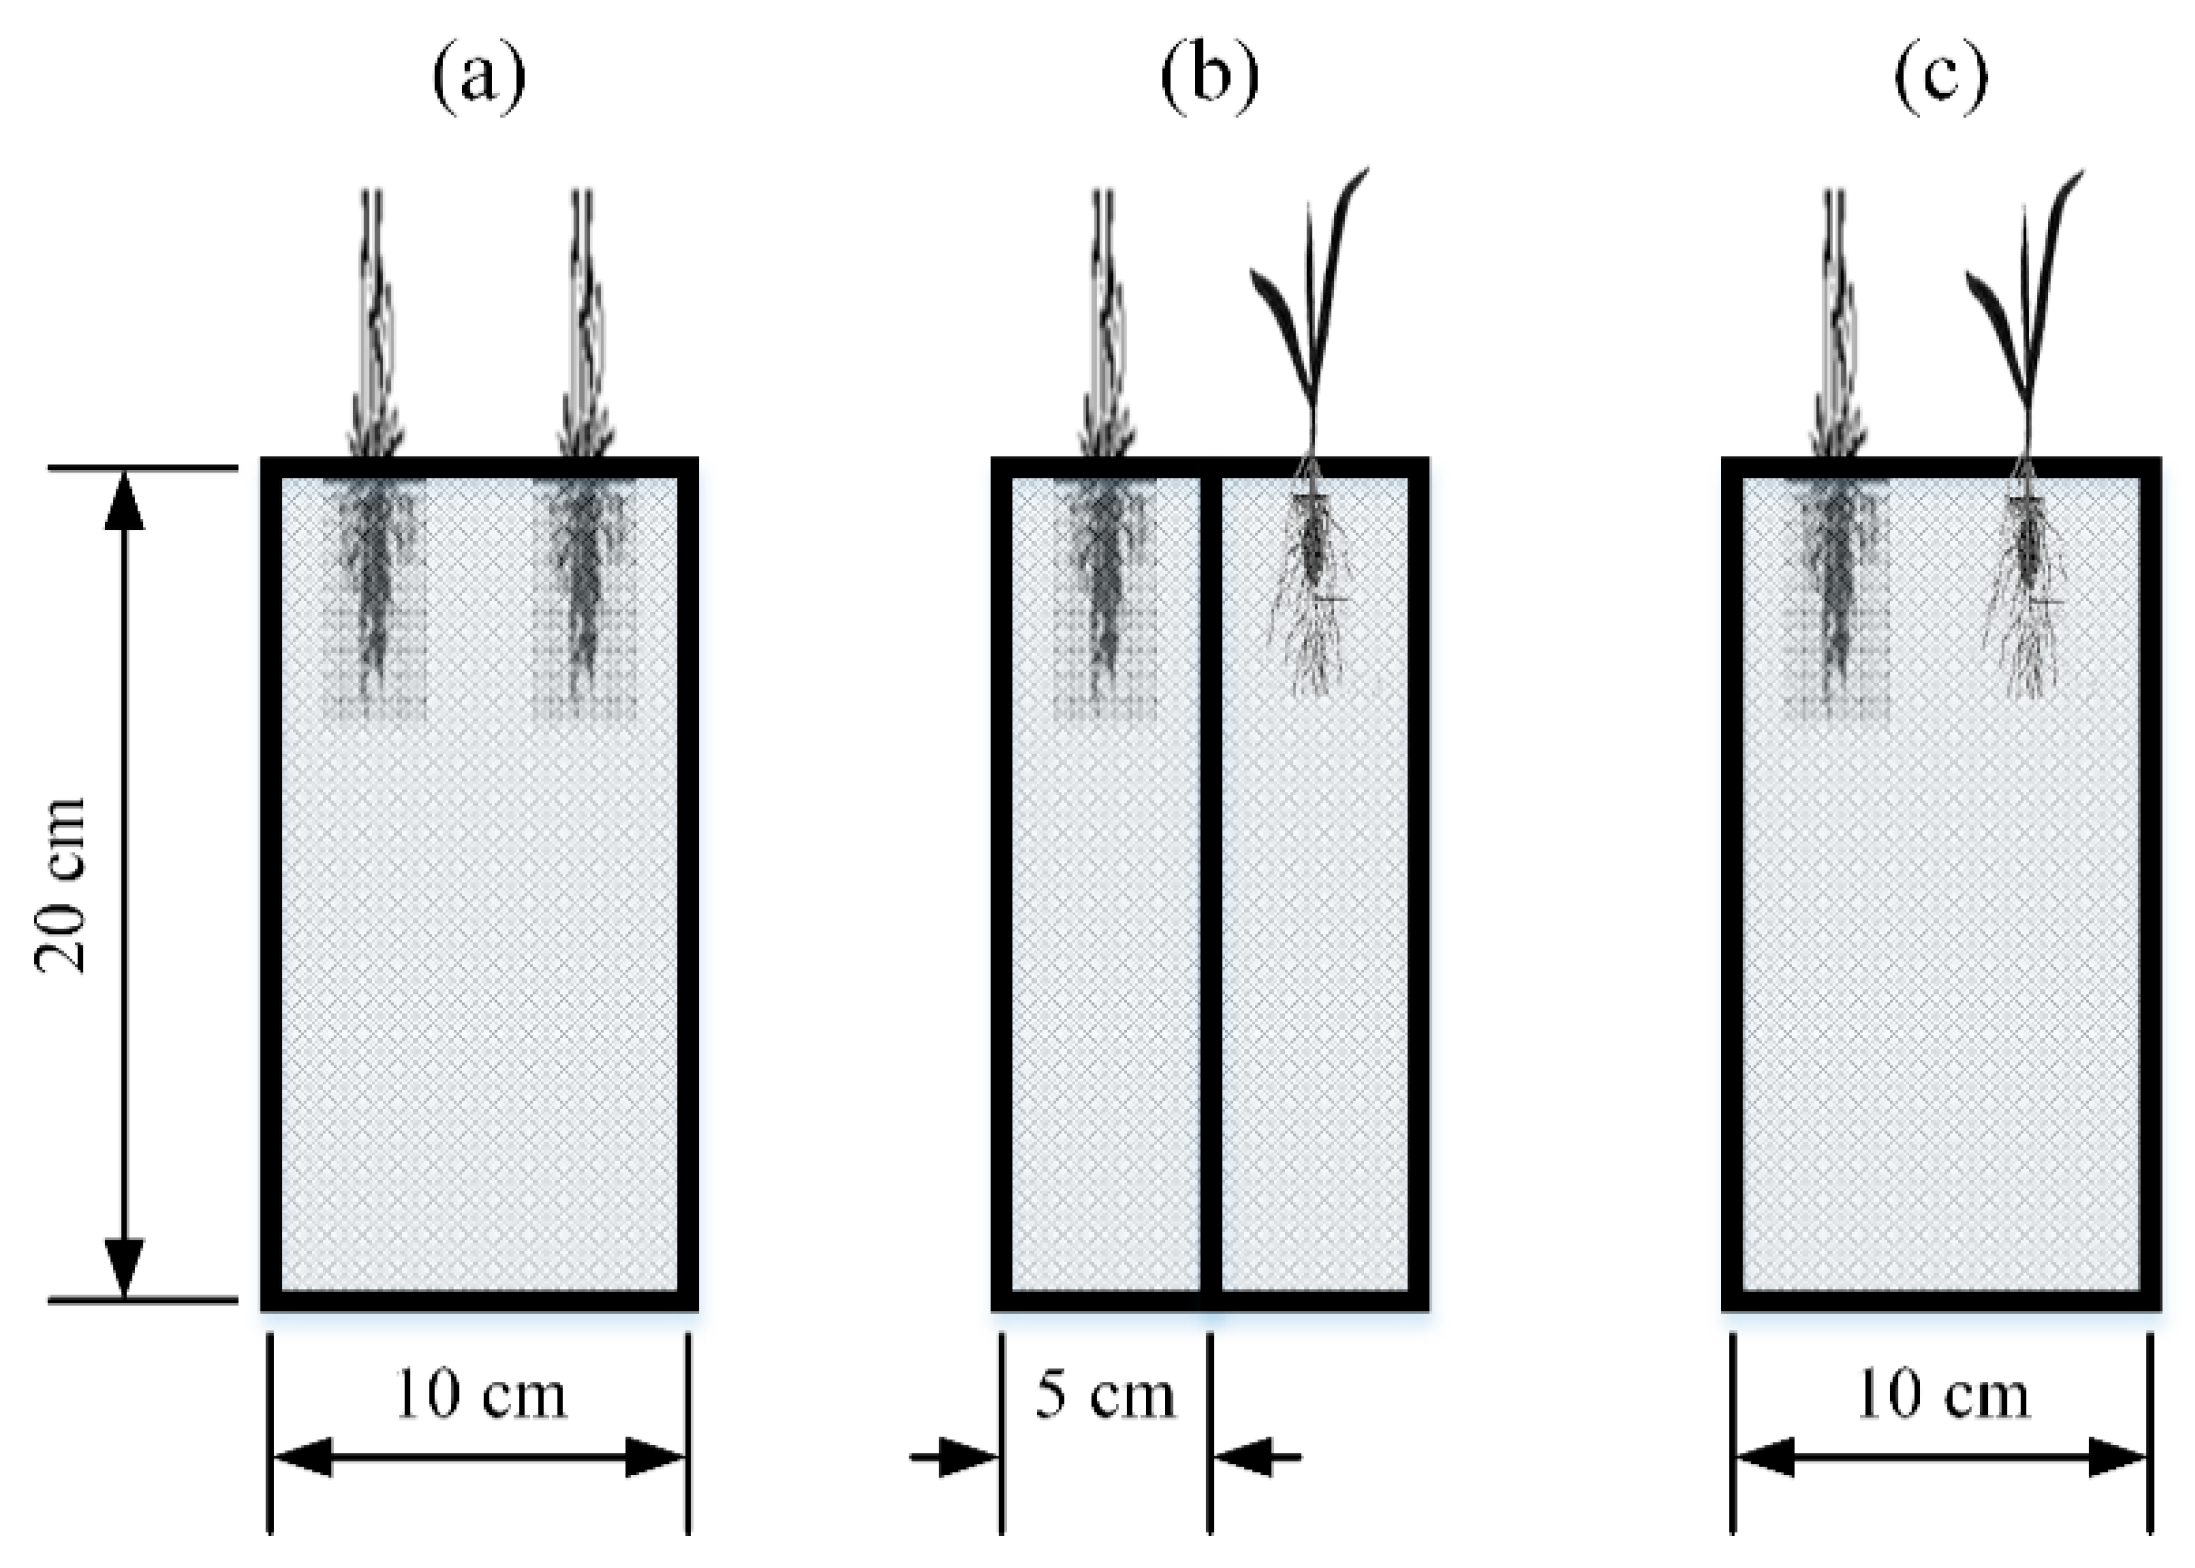
21], we designed a controlled experiment in order to investigate the effect of different water levels (0–30 cm) on species interactions between C. lasiocarpa and G. spiculosa, and between C. pseudocuraica and G. spiculosa. The aims of this study were to: (1) investigate the response strategies of wetland plants to flooding, (2) investigate the effect of water level on interspecific competition, and (3) compare the interspecific relationships under different competition treatments. We aimed to discuss the mechanism of wetlands species distribution driven by interspecific competition and hydrological factors.

2. Materials and Methods

2.1. Study Site

This study was conducted at the National Observation and Research Station of Wetland Ecology, Sanjiang Plain, northeast China (hereafter referred to as the Sanjiang Station, 47°35′10.66″ N, 133°29′57.06″ E, 55 m a.s.l.). The climate of the area is the temperate continental monsoon climate type in the seasonally frozen zone. The mean annual temperature (1990–2010) is 2.5 °C with monthly mean temperature ranging from −20.4 °C in January to 21.6 °C in July. The mean annual precipitation is 566 mm, with 80% of precipitation occurring from May to September, and the frost-free period is 125 days. About 150 ha of natural wetlands, which are representative of the pristine wetlands in the Sanjiang Plain, were protected by the station and these wetlands can mostly be classified as permanently and seasonally inundated wetlands. The water level in the permanently inundated wetlands generally varies from 10 to 40 cm during the growing season, and the water and soil are frozen during the non-growing season. Dominant plants in the permanently inundated wetlands are C. pseudocuraica, C. lasiocarpa, G. spiculosa, and Carex appendiculata (Trautv.) Kukenth., which account for more than 90% of the above ground biomass. C. lasiocarpa and C. pseudocuraica are the two closely related species living in similar hydrological conditions with water levels 10–30 cm during the full growing seasons, and they often co-occur in the same habitats [8,21]. In the permanently inundated wetlands, G spiculosa is an important accompanying species in the C. lasiocarpa and C. pseudocuraica communities. Due to the long term anaerobic environment and the relatively low temperature, the plant residues in the wetland decomposed slowly, and piled up a 0 to 45 cm thick floating peat mat with moss in it. For most plants in the permanently inundated wetland, their roots and part of shoots were unemerged during the growing seasons.

2.2. Experimental Design

A controlled outdoor experiment was set up at the end of April 2017 at the Sanjiang Station. The experimental site was about 500 m away from the permanently inundated wetland and was undisturbed during the study period. We designed the experiment to investigate the responses of C. lasiocarpa and C. pseudocuraica when competing with G. spiculosa in three competitive modes (no competition, shoot competition, and full competition) at four water levels.
For the purpose of allowing and preventing root interactions, rectangular tubes made of polymethyl methacrylate of two sizes (height 20 cm, width 5 cm, and length 10 cm for no competition and full competition, and height 20 cm, width 5 cm, and length 5 cm for shoot competition) were used as containers. Each rectangular tube (hereafter referred to as tube) was filled with a volumetric mixture of wetland soil and sand (1:1) so that the roots could be collected more accurately [22]. Ramets of similar sizes (3–4 leaves, 5–8 cm height) of C. lasiocarpa, C. pseudocuraica, and G. spiculosa were carefully collected in early May 2017 from the permanently inundated wetland of the Sanjiang Station (with the permission of the Station for scientific research), and the same species were collected in a 30 × 30 m plot. We identified the ramets carefully by referring to Flora of China (http://www.iplant.cn/foc). The three competitive modes were set as follows: (1) two ramets of C. lasiocarpa or two ramets of C. pseudocuraica or two ramets of G. spiculosa were planted in a 10 cm long tube (no competition; Figure 1a); (2) two 5 cm long tubes were first connected by their single surfaces as one tube group, and one ramet of C. lasiocarpa or C. pseudocuraica was planted with one ramet of G. spiculosa in each of the two tubes (shoot competition; Figure 1b); (3) one ramet of C. lasiocarpa or C. pseudocuraica was planted with one ramet of G. spiculosa in a 10 cm long tube (full competition; Figure 1c). There were six repetitions for each competition treatment. Every six replicate tubes or tube groups of each competitive mode were arranged in one plastic tank (height 50 cm, width 40 cm, length 45 cm; Figure 2).
According to McPhee and Aarssen [23], the main partition techniques of root and shoot competitions could be classified as: the divided pot technique, the row technique, and the target technique. Row technique is arrangement of partitions in aerial portion and soil portion of competition box: (1) no competition contains two units of soil and two units of aerial portion; (2) full competition contains one unit of each; (3) root competition contains one unit of soil portion and two units of aerial portion; (4) shoot competition contains two units of soil portion and one unit of aerial portion. In this study, we chose the simplified way of row technique and planted two herbaceous individuals in each tube. The advantage of this simplified row technique is that, in the shoot competition and full competition modes, each genetic individual competes only with another different genetic individual.
In order to investigate the effect of water level on interspecific competition, we included four water levels of 0, 10, 20, and 30 cm for each competitive mode in our experimental design. As a result, there were 28 tanks in total. Water taken from the permanently inundated wetland nearby was added to the tanks until water surface was flush with (0) or 10, 20, or 30 cm higher than the soil surface of the tube. During the experimental period, we measured water levels in each tank every two days and added water if needed in order to keep the water level constant. The nutrients concentration was consistent for each tank since we collected the soil and water from the same place. Light availability was also the same for each individual as enough room was retained for each tube and the east-west direction of each competitive group avoided shadow to the greatest degree (Figure 2).
According to the phenology of wetland plants, the experiment lasted for the whole growing season from early May to the end of September 2017. At the end of the experiment, we counted the ramet amount for ramets with no less than three leaves and propagule amount (including all ramets, buds, and rhizomes) of all the six tubes in each tank and calculated the average value. All plants from each tank were then collected, divided into root and shoot parts, and dried at 65 ℃. The average dry weight and root/shoot ratio were then calculated.

2.3. Data Analysis

Biomass can be an important index for explaining the differences caused by different competitive ability [24], and it is especially useful when all species are clonal herbs, as in the present experiment. We selected three parameters to represent the fitness of different species: (1) total dry biomass of the whole plant; (2) single shoot dry biomass, mean shoot biomass of single ramets that had more than three leaves, and (3) propagule amount, including all ramets, buds, and rhizomes, representing clonal growth ability. In order to further evaluate the relative competition ability of two species, we used relative yield (RY, [9,25]) as follows:
RYA = YAB/(p × YA)
RYB = YBA/(q × YB)
where YAB is the yield of species A growing with species B, YBA is the yield of species B growing with species A, YA is the yield of species A growing in pure culture, YB is the yield of species B growing in pure culture, p is the initial proportion of species A in mixed culture, and q is the initial proportion of species B in the mixed culture, with p + q = 1.
If a species grows in competition as well as grown in no competition, RY value of the species is 1.0. In order to investigate the relative competitive ability between two species, RYA values were plotted against RYB values in space, and there were six main areas of interest in the graph ([25], Figure 3).
All data analyses were conducted in R (R Development Core Team, 2019). The normality of the data and the homogeneity of variances were tested by Shapiro–Wilk test and Bartlett’s test, respectively. Data that did not satisfy the normal distribution or the homogeneity of variance were square-root-transformed (X = √x) to make sure the prerequisites of the analysis of variance (ANOVA) were met. Two-way ANOVA was used to test the effects of water level and competition treatment using the “Anova” function (type III) in “car” package [26]. One-way ANOVA was used to test the effect of water level in each competition mode and the effect of competition at each water level. Tukey multiple comparisons using “HSD.test function” in “agricolae” package [27] were used to group differences of each treatment when the results of one-way ANOVA were significant. All figures were plotted using “ggplot2” package [28].

3. Results

3.1. Influence of Water Level and Competition on Plant Biomass

Both water level and competitive mode had a significant effect on total biomass of C. lasiocarpa and C. pseudocuraica, but their interaction only affected total biomass of C. pseudocuraica significantly (Figure 4). Total biomass of C. lasiocarpa decreased with the increasing of water level in no competition and shoot competition (Figure 4a, Table A7 and Table A8). Different to C. lasiocarpa, water level had a significant effect on total biomass of C. pseudocuraica in shoot competition and full competition (Figure 4b, Table A9 and Table A10), and competitive mode had significant effects at 20 cm and 30 cm water levels (Figure 4b, Table A1 and Table A2).
Water level, competitive mode and their interaction had no significant effect on single shoot biomass of C. lasiocarpa, while water level and its interaction with competitive mode had a significant effect on single shoot biomass of C. pseudocuraica (Figure 5). There was no significant difference in single shoot biomass of C. lasiocarpa between competitive modes at each water level or between water levels in each competitive mode (Figure 5a). Water levels had a significant effect on single shoot biomass of C. pseudocuraica in all competitive modes (Figure 5b, Table A11, Table A12 and Table A13), and competitive mode had a significant effect at 30 cm water level (Figure 5b, Table A3).

3.2. Influence of Water Level and Competition on Clonal Growth

Water level and competitive mode had a significant effect on propagule amount of C. lasiocarpa, while only water level had a significant effect on propagule amount of C. pseudocuraica (Figure 6). Propagule amount of C. lasiocarpa decreased significantly with increasing water levels in no competition and shoot competition (Figure 6a, Table A14 and Table A15), and differed significantly in different competitive modes at 0–20 cm water levels (Figure 6a, Table A4, Table A5 and Table A6). As to propagule amount of C. pseudocuraica, water level had a significant effect only in full competitive mode (Figure 6b, Table A16).

3.3. Influence of Water Level and Competition on Biomass Allocation

Root/shoot ratio of both C. lasiocarpa and C. pseudocuraica was only significantly affected by water level (Figure 7). Root/shoot ratio of both C. lasiocarpa and C. pseudocuraica decreased significantly with increasing water level at each competitive mode (Figure 7, Table A17, Table A18, Table A19, Table A20, Table A21 and Table A22).

3.4. Influence of Water Level on the Competitive Ability of Plants

In full competition, the competitive ability of C. lasiocarpa was strengthened with the increase in water level, whether evaluated by relative total biomass or relative single shoot biomass (Figure 8a,c). The competitive ability of C. lasiocarpa was always weaker than that of G. spiculosa when evaluated by relative total biomass (Figure 8a), whereas the competitive ability of C. lasiocarpa varied from weaker to greater than that of G. spiculosa when evaluated by relative single shoot biomass (Figure 8c). Different from C. lasiocarpa, C. pseudocuraica only beat G. spiculosa at 10 cm water level when evaluated by both relative total biomass and relative single shoot biomass (Figure 8b,d).
In shoot competition, the relative competitive ability of C. lasiocarpa to G. spiculosa had no regular trends, whether evaluated by relative total biomass or relative single shoot biomass (Figure 8a,c). The relative competitive ability of C. pseudocuraica was always superior to that of G. spiculosa, except at 30 cm water level (Figure 8b,d).

4. Discussion

C. lasiocarpa, and C. pseudocuraica are typical plant species in Sanjiang Plain wetlands, and they generally occupy niches with similar hydrological conditions [19]. In the present research, a controlled experiment was set up to explore the influence of water level and interspecific competition with G. spiculosa on these two Carex species.
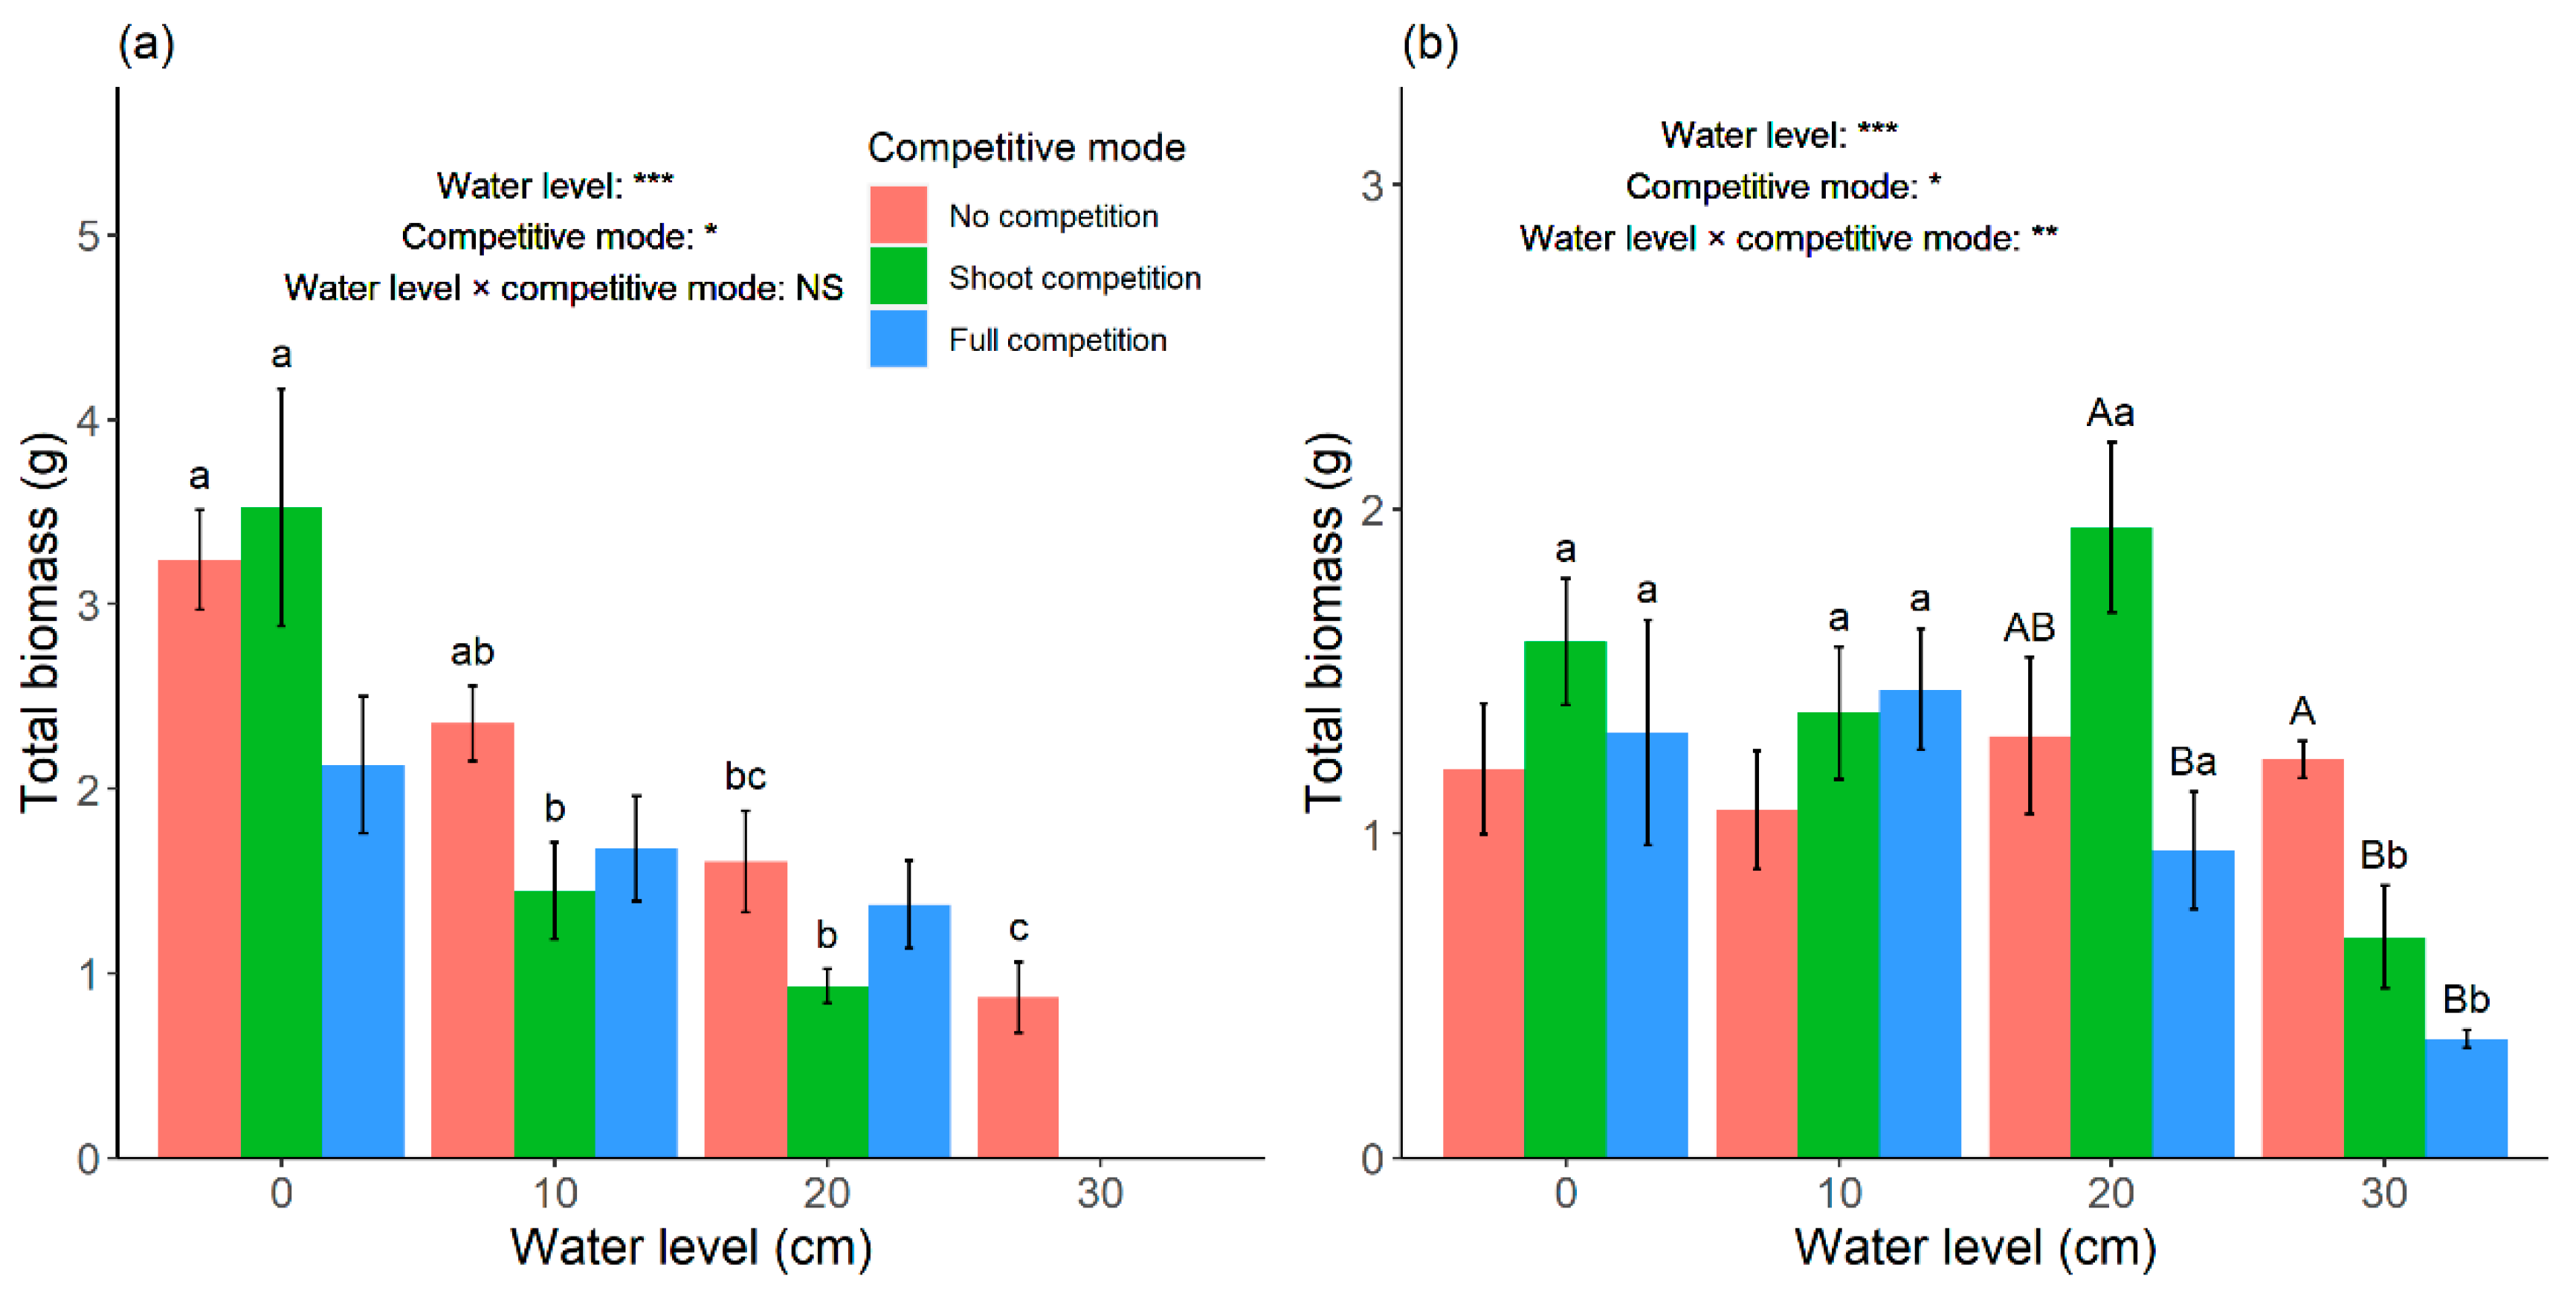
According to our results, total biomass of C. lasiocarpa decreased as the water level increased in no competition conditions, which was consistent with the results of Luo et al. [8] and Zhang et al. [
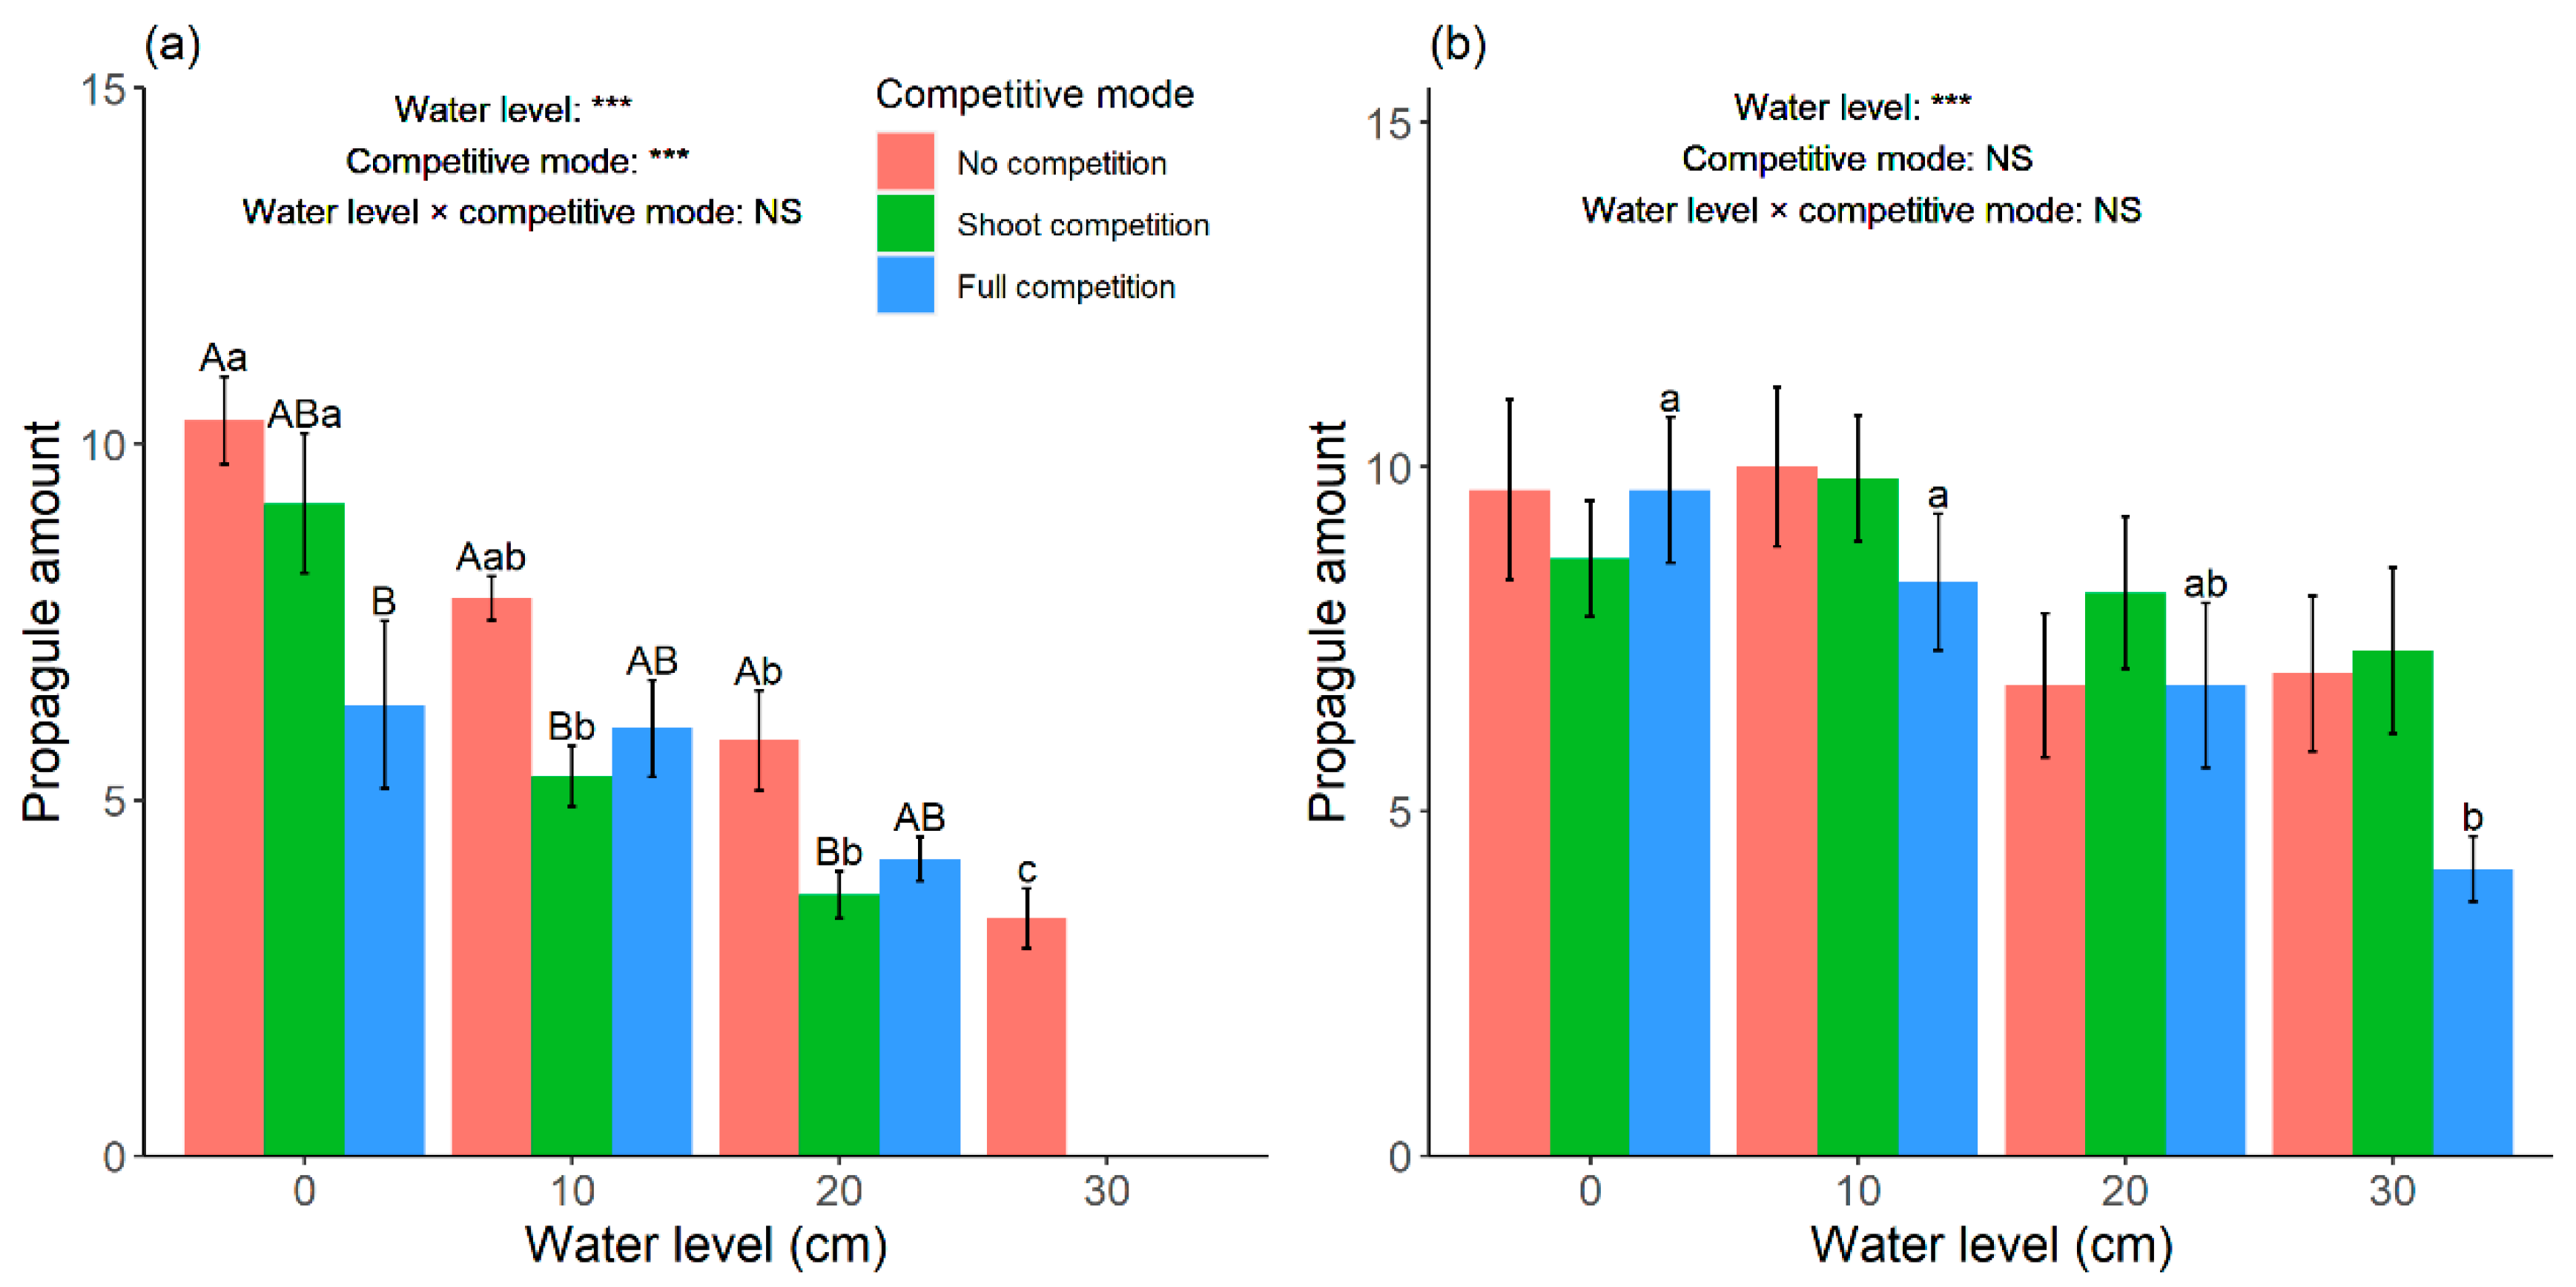
9]. The effects of water level on total biomass and propagule amount of C. lasiocarpa were similar (Figure 4a and Figure 6a). This indicated the fundamental water level niche of 
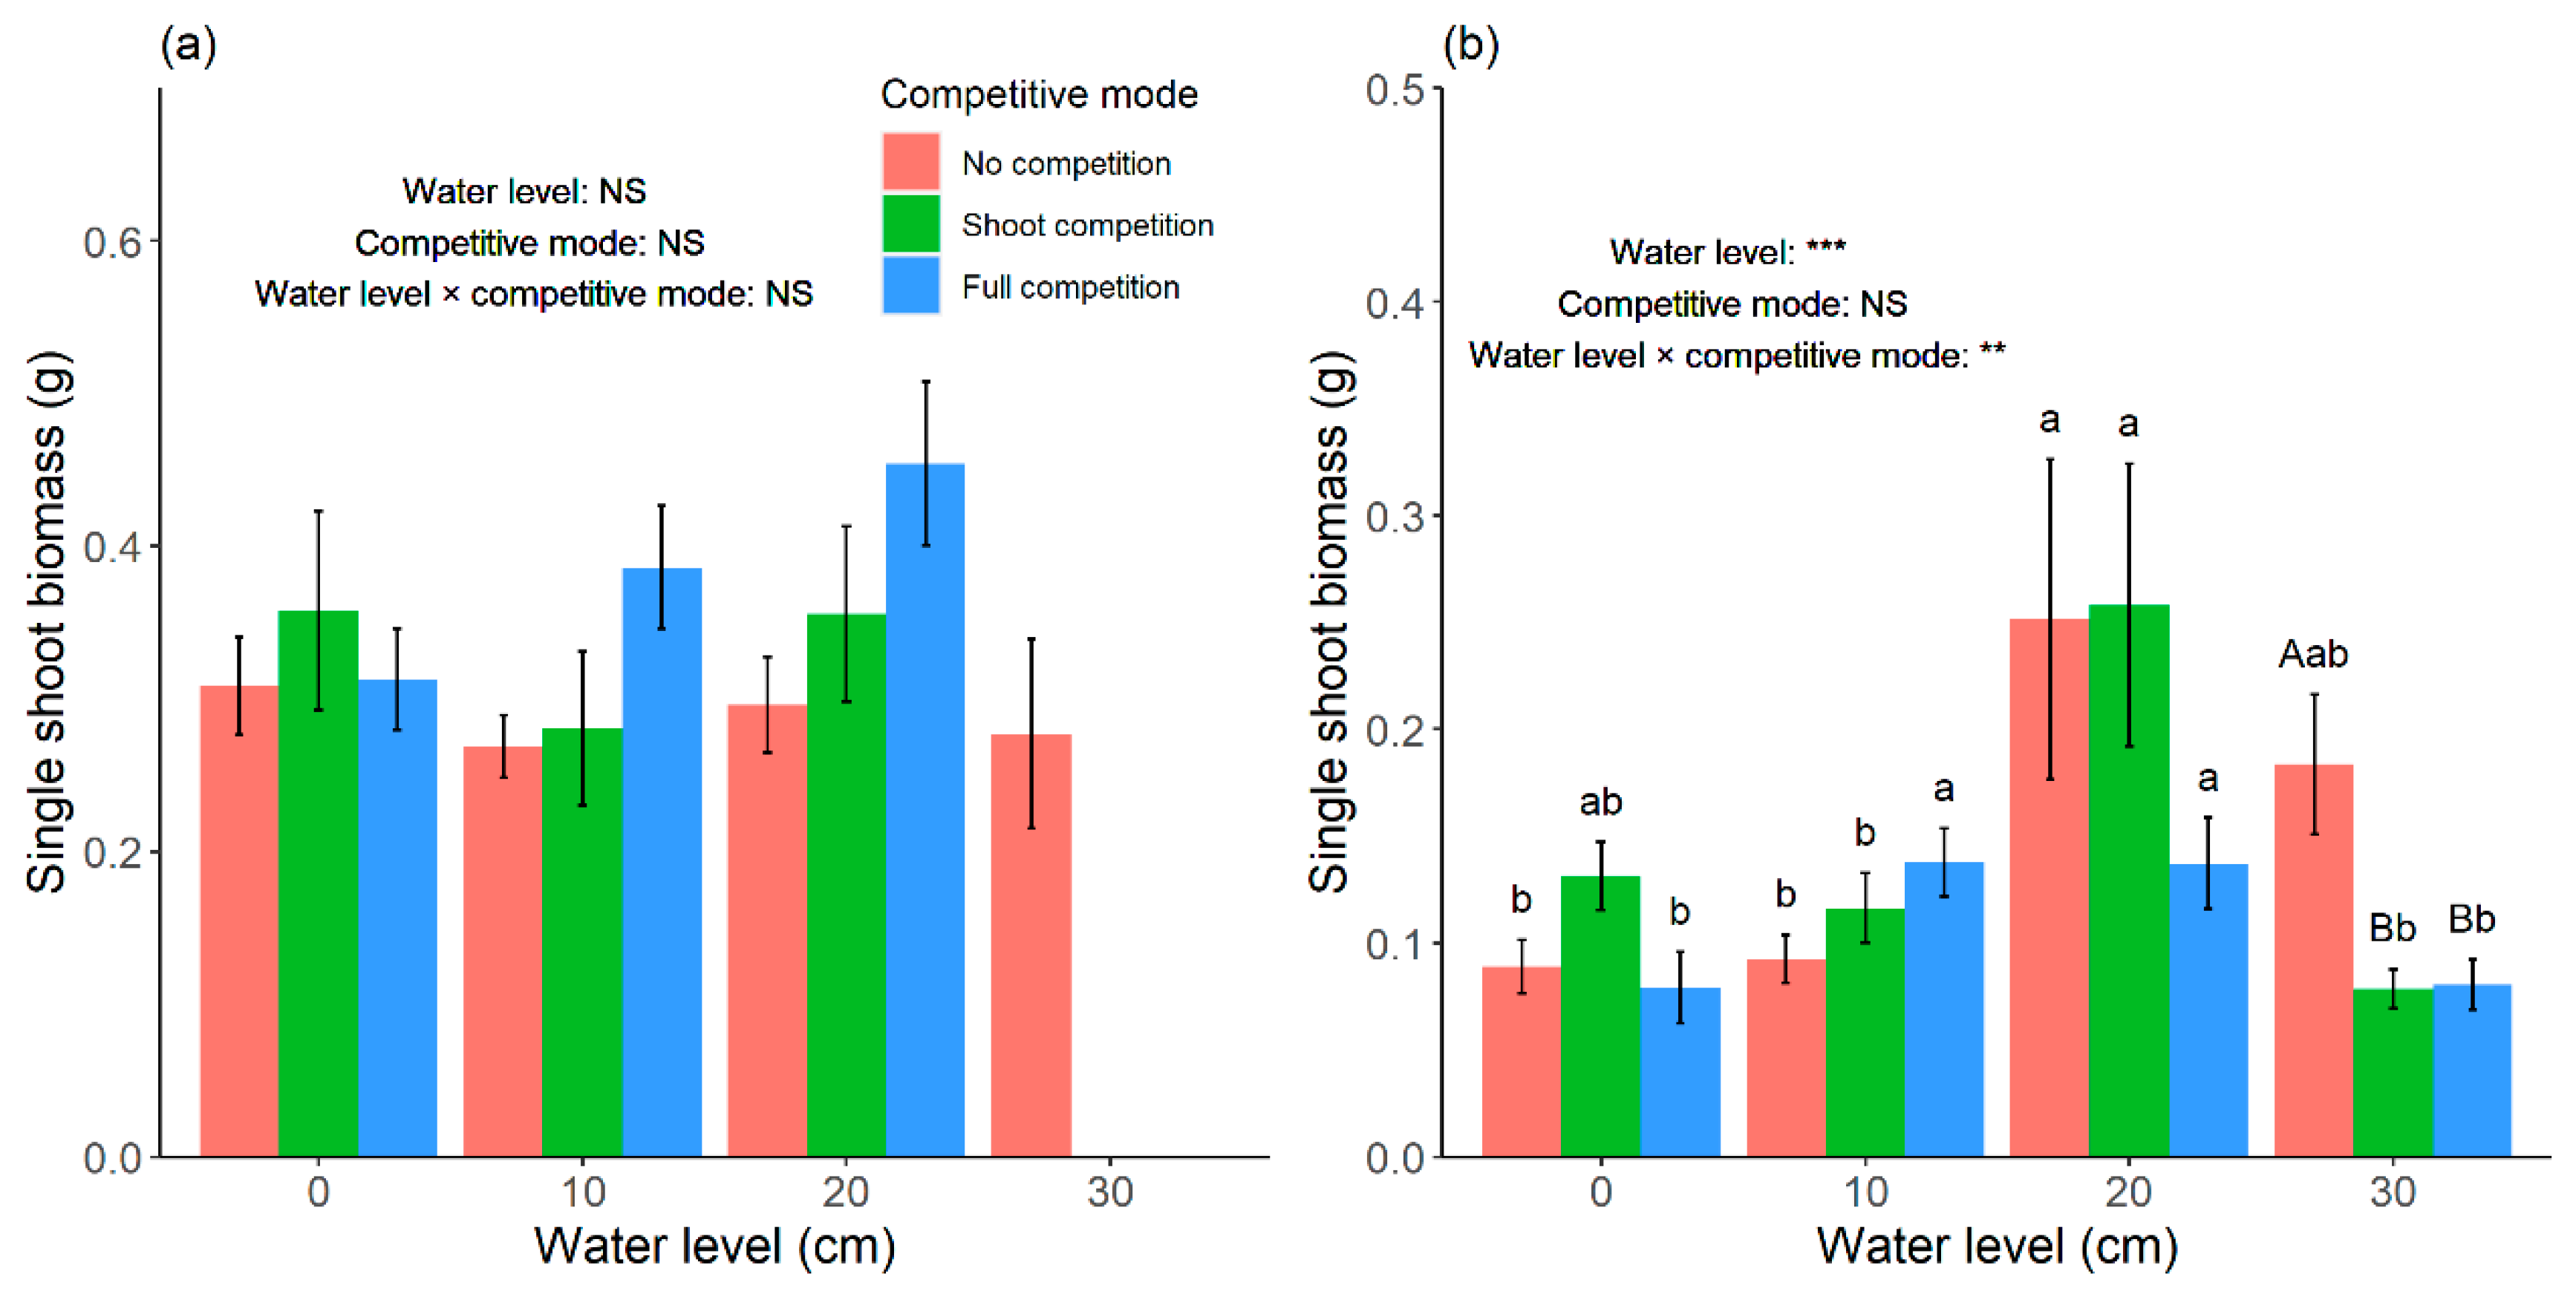
C. lasiocarpa was no more than 0 cm when evaluated by the total biomass and propagule amount indices. However, no significant differences in single shoot biomass of C. lasiocarpa were observed among the four water levels (Figure 5a). As C. lasiocarpa is clonal plant, total biomass and propagule amount could represent the characteristics of a genetic individual, while single shoot biomass could represent the characteristics of a physiological individual [29]. Our results suggested that the physiological individual and the whole genetic individual of C. lasiocarpa use different trade-off strategies for surviving flooding stress. Genetic individuals were inhibited by deep water, whereas physiological individuals were not.
Unlike C. lasiocarpa, there was no significant difference in total biomass and propagule amount of C. pseudocuraica in no competition among the four water levels (p > 0.05). When evaluated by single shoot biomass, C. pseudocuraica preferred a deeper water level (Figure 5b), which indicated that it had better resistance ability than C. lasiocarpa under flooding stress. As the stems and leaves of C. pseudocuraica are functionally plastic, e.g., they can have an increased number and thickness of vascular bundles in stems and leaves, elongated internode length, and more air cavities under flooding stress [30,31,32]. Thus, C. pseudocuraica is capable of adapting to large water level amplitude [33]. Furthermore, because of the opposite trends of single shoot biomass and propagule amount of C. pseudocuraica in this study, it could be inferred that in conditions of increased water levels, more resources were used for the preservation of physiological individuals than for clonal reproduction. This could also help to explain why C. pseudocuraica was better adapted to the deep water conditions than C. lasiocarpa during the experimental period.
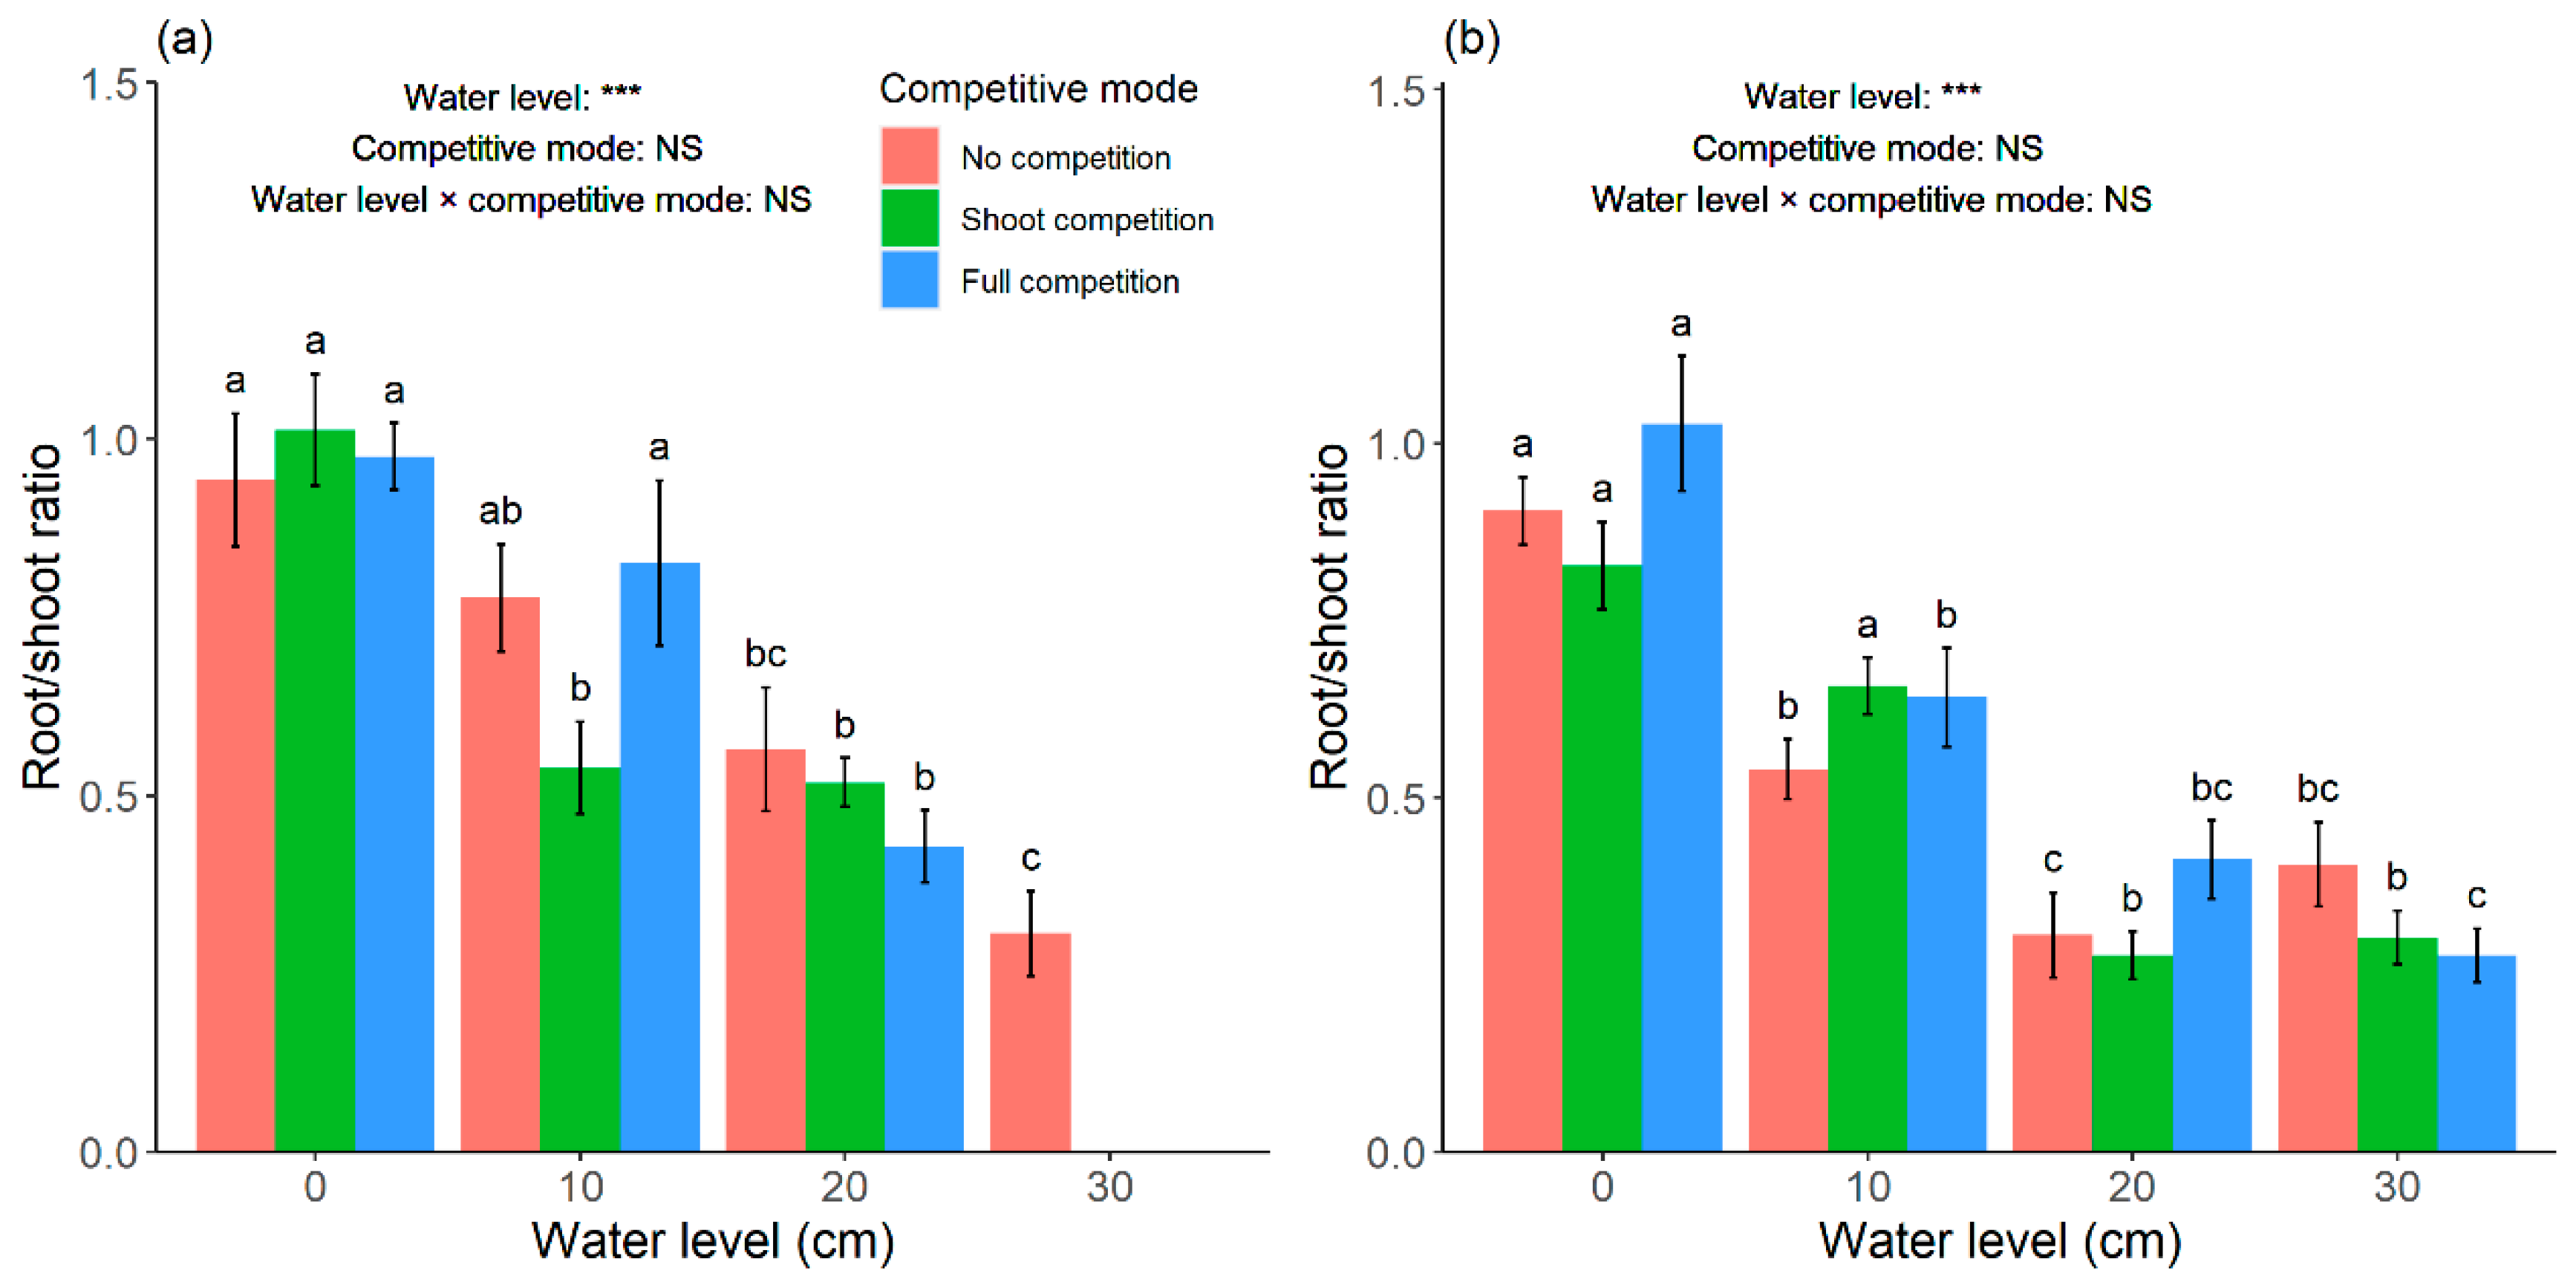
Root/shoot ratio showed a downward trend in the two Carex species with the increase in water level in no competition (Figure 7), which was similar to the results of Shi et al. [22] and Zhang et al. [9]. Interspecific competition did not significantly affect root/shoot ratio (Figure 7), indicating that plants allocated more resources or energy to the shoots than to the roots in order to acquire more light and air, which aids photosynthesis [34]. According to Cahill [35], plants can alter root–shoot allocation in response to environmental conditions under certain conditions, which is also supported by the growth–balance hypothesis (optimal foraging theory), which states that plants prioritize resource allocation to organs responsible for acquiring the most limited resources [36]. These resource allocation characteristics could explain, to some extent, the variations of root/shoot ratio under flooding stress in the present study.
In the natural inundated wetlands of the Sanjiang Plain, the optimum water level niche of C. lasiocarpa generally varied from 13 to 29 cm with an optimal growing point of 21 cm [20]. Similar to C. lasiocarpa, C. pseudocuraica was mostly distributed in the water level niche of 13–30 cm [19]. Therefore, the realistic water level niches of C. lasiocarpa and C. pseudocuraica largely overlapped. This could not be the actual situation when competitions exist. In the current research, although total biomass of C. lasiocarpa was not significantly influenced by competition modes, there existed the trend that competitive suppression by G. spiculosa in full competition was decreasing along increasing water level (Figure 4a). By contrast, total biomass of C. pseudocuraica was relatively constant along water levels under no competition, but the competitive suppression by G. spiculosa increased when water level was higher than 10 cm (Figure 4b). Therefore, we could infer that the physiological niche of C. lasiocarpa is emerged habitats, where the water level is 0 cm or lower; however, in a field environment, the coexistence of competitors and the relatively better adaptation of C. lasiocarpa drive it away from emerged habitats. On the contrary, the actual water level niche of C. pseudocuraica could tend to be far away from deep water. The interspecific competition could thus play an important role in the spatial differentiation of the actual water level niche of the two Carex species.
According to the variations of propagule amount under different competition modes along the increase in water level (Figure 6a), C. lasiocarpa tended to modulate resources allocation by reducing clonal reproduction to survive in the competition with 
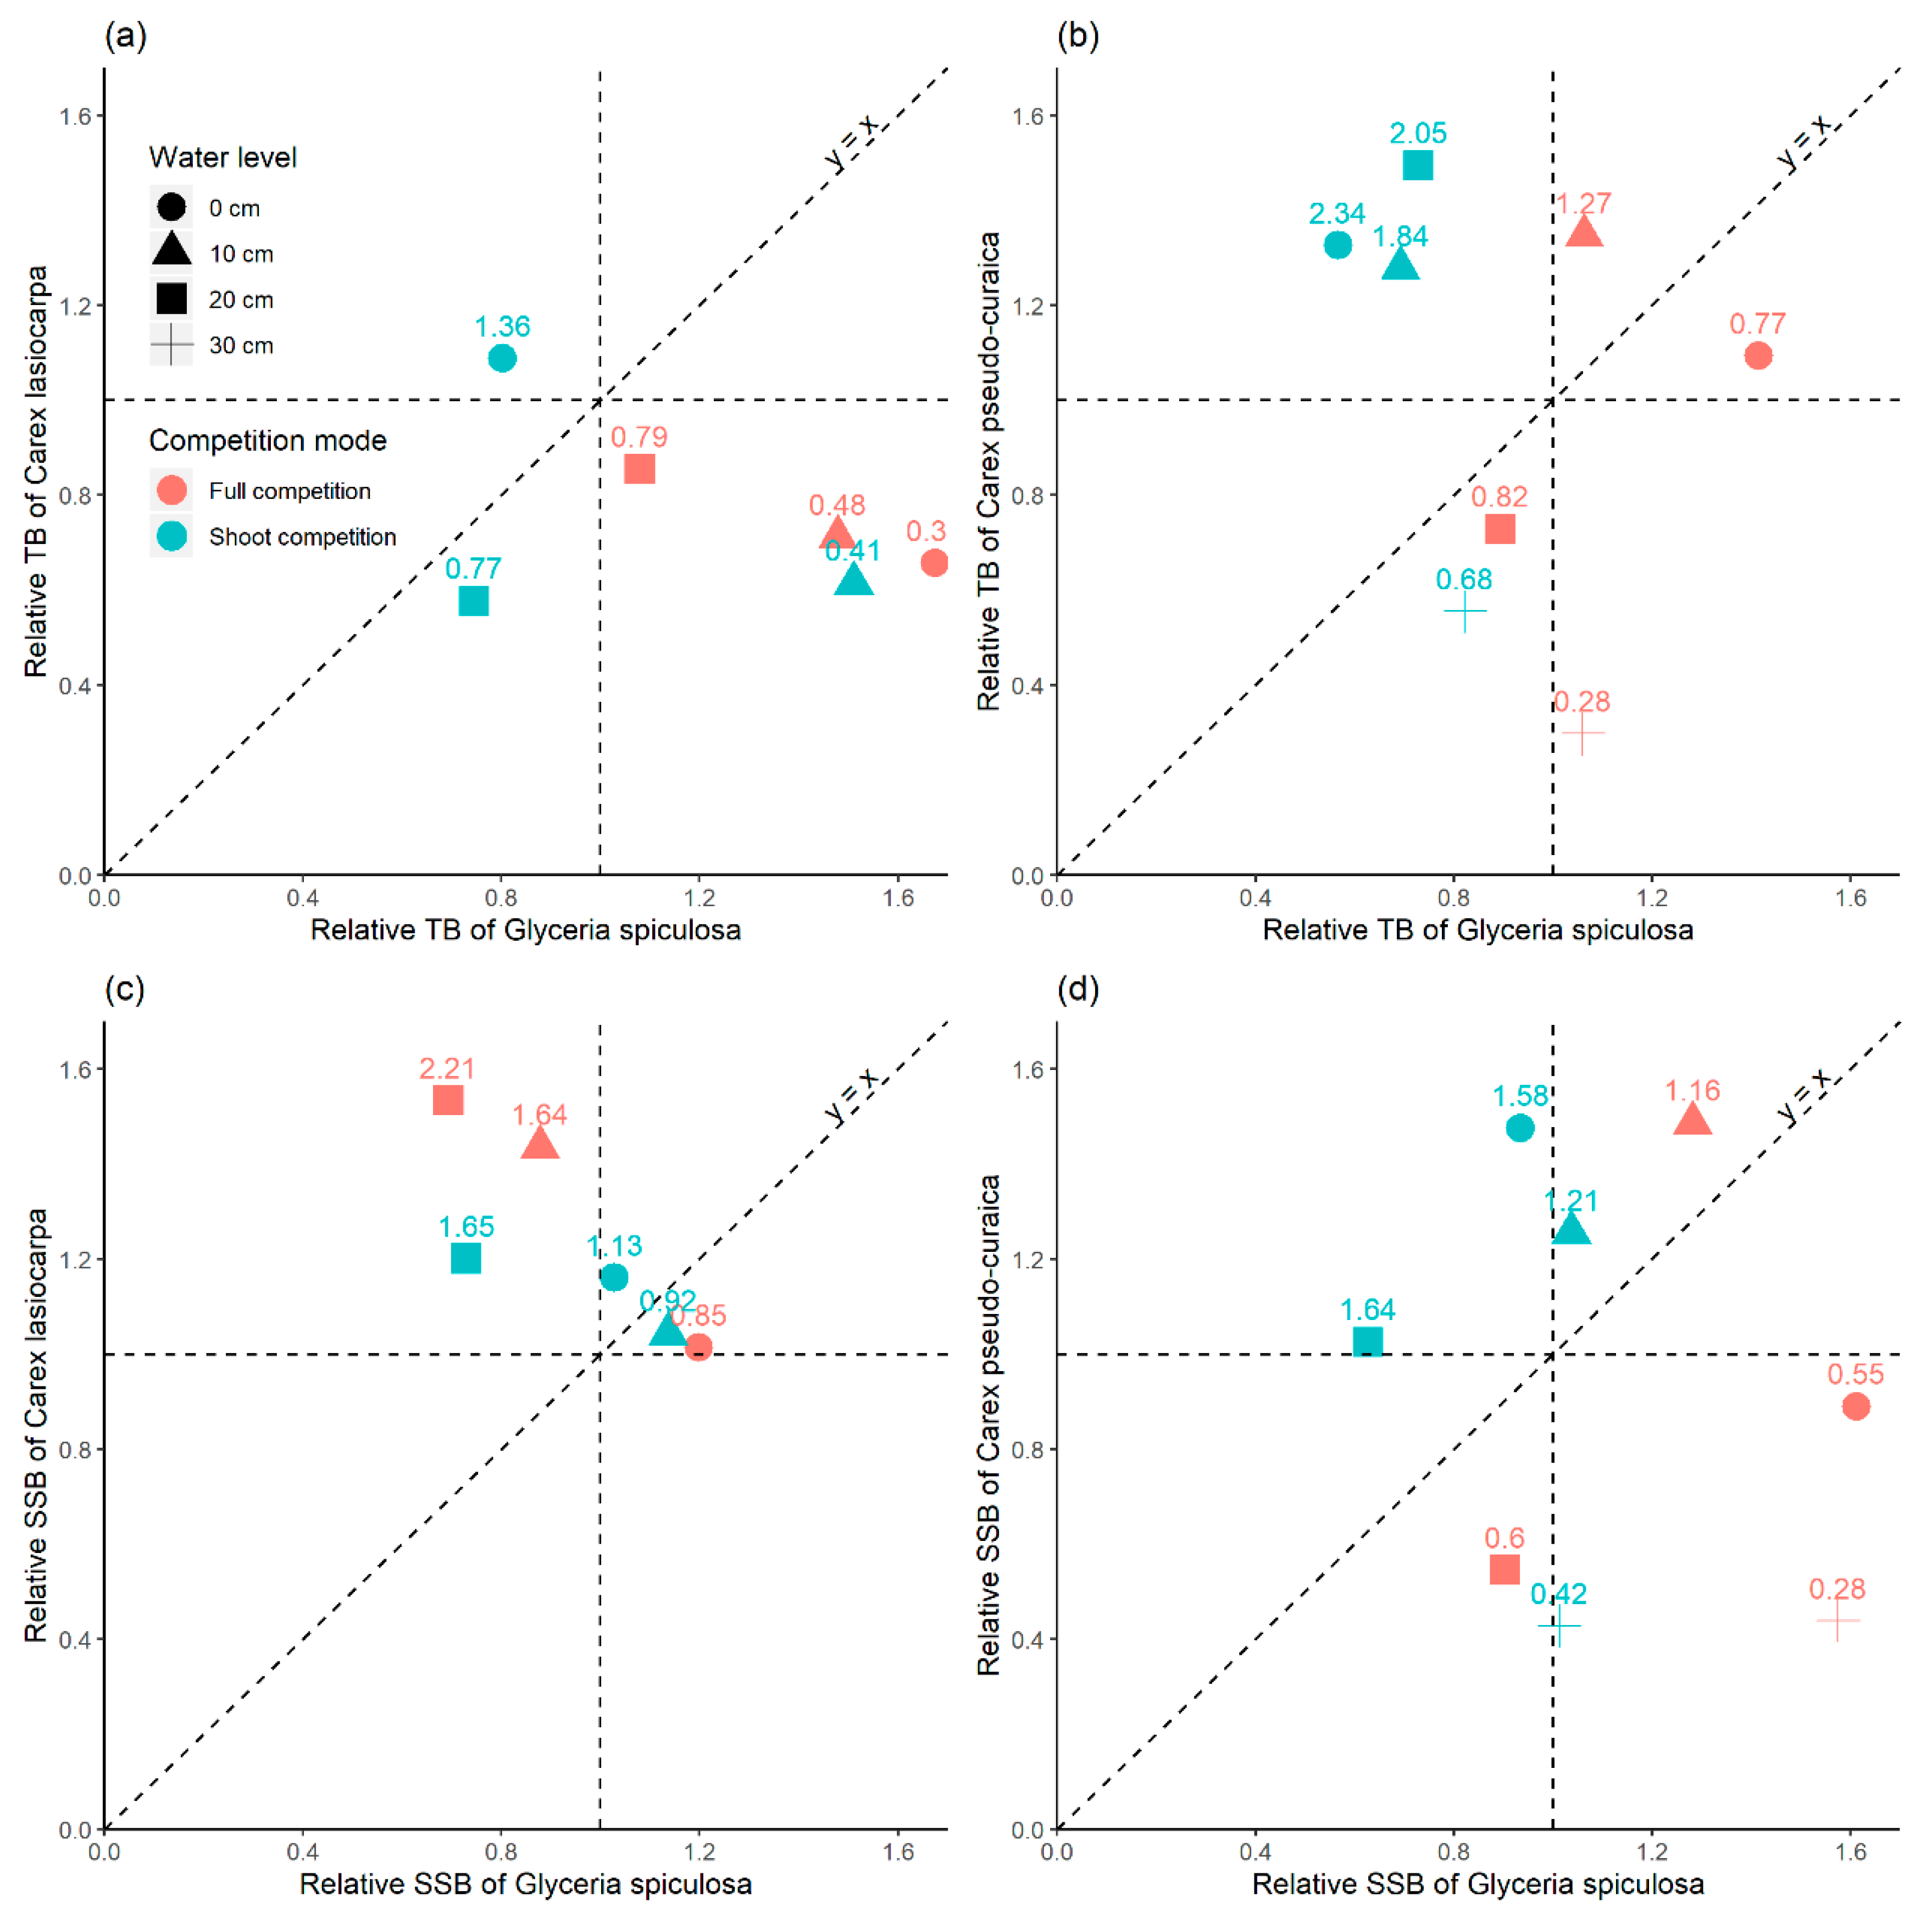
G. spiculosa. The slope change of relative single shoot biomass and relative total biomass between C. lasiocarpa and G. spiculosa also indicated that the stress imposed by G. spiculosa on C. lasiocarpa showed a decreasing trend with increasing water level (Figure 8a,c), and this is consistent with the actual distribution of these species in natural wetland ecosystems [19,20]. The performances of C. lasiocarpa and G. spiculosa are in accordance with Ellenberg’s rule which states that competition can drive the distribution of a species away from its physiological optimum [37]. Our results showed that based on its competitive ability and individual physiological performance, C. lasiocarpa tended to choose a deeper water level niche in competition with G. spiculosa compared to that in no competition. The hydrological niche segregation could mediate the coexistence of plants with similar hydrological niches and finally determine their actual distribution in wetlands.
At full competition (C. pseudocuraica vs. G. spiculosa), the slopes of relative total biomass and relative single shoot biomass at 0, 20 and 30 cm were smaller than 1 (Figure 8b,d), indicating that shallow (0 cm) or relatively deep (>10 cm) water level are not optimal for the survival of C. pseudocuraica. However, C. pseudocuraica has greater adaptability than G. spiculosa at 10 cm water level, which has been suggested by the high slopes (>1) of relative total biomass and relative single shoot biomass (Figure 8b,d). According to our field observations, C. pseudocuraica communities tend to be the first plants that colonize the waterlogged area after trampling disturbances, and their tangled roots (dead and alive) could gradually form floating organic layers, which often perform the similar function of soil. Considering the clonal reproduction mode of C. pseudocuraica and the fact that it could be suppressed by G. spiculosa in deep water level, we infer that C. pseudocuraica often acts as the pioneer plant in natural wetlands and could further benefit the growth of other plants.
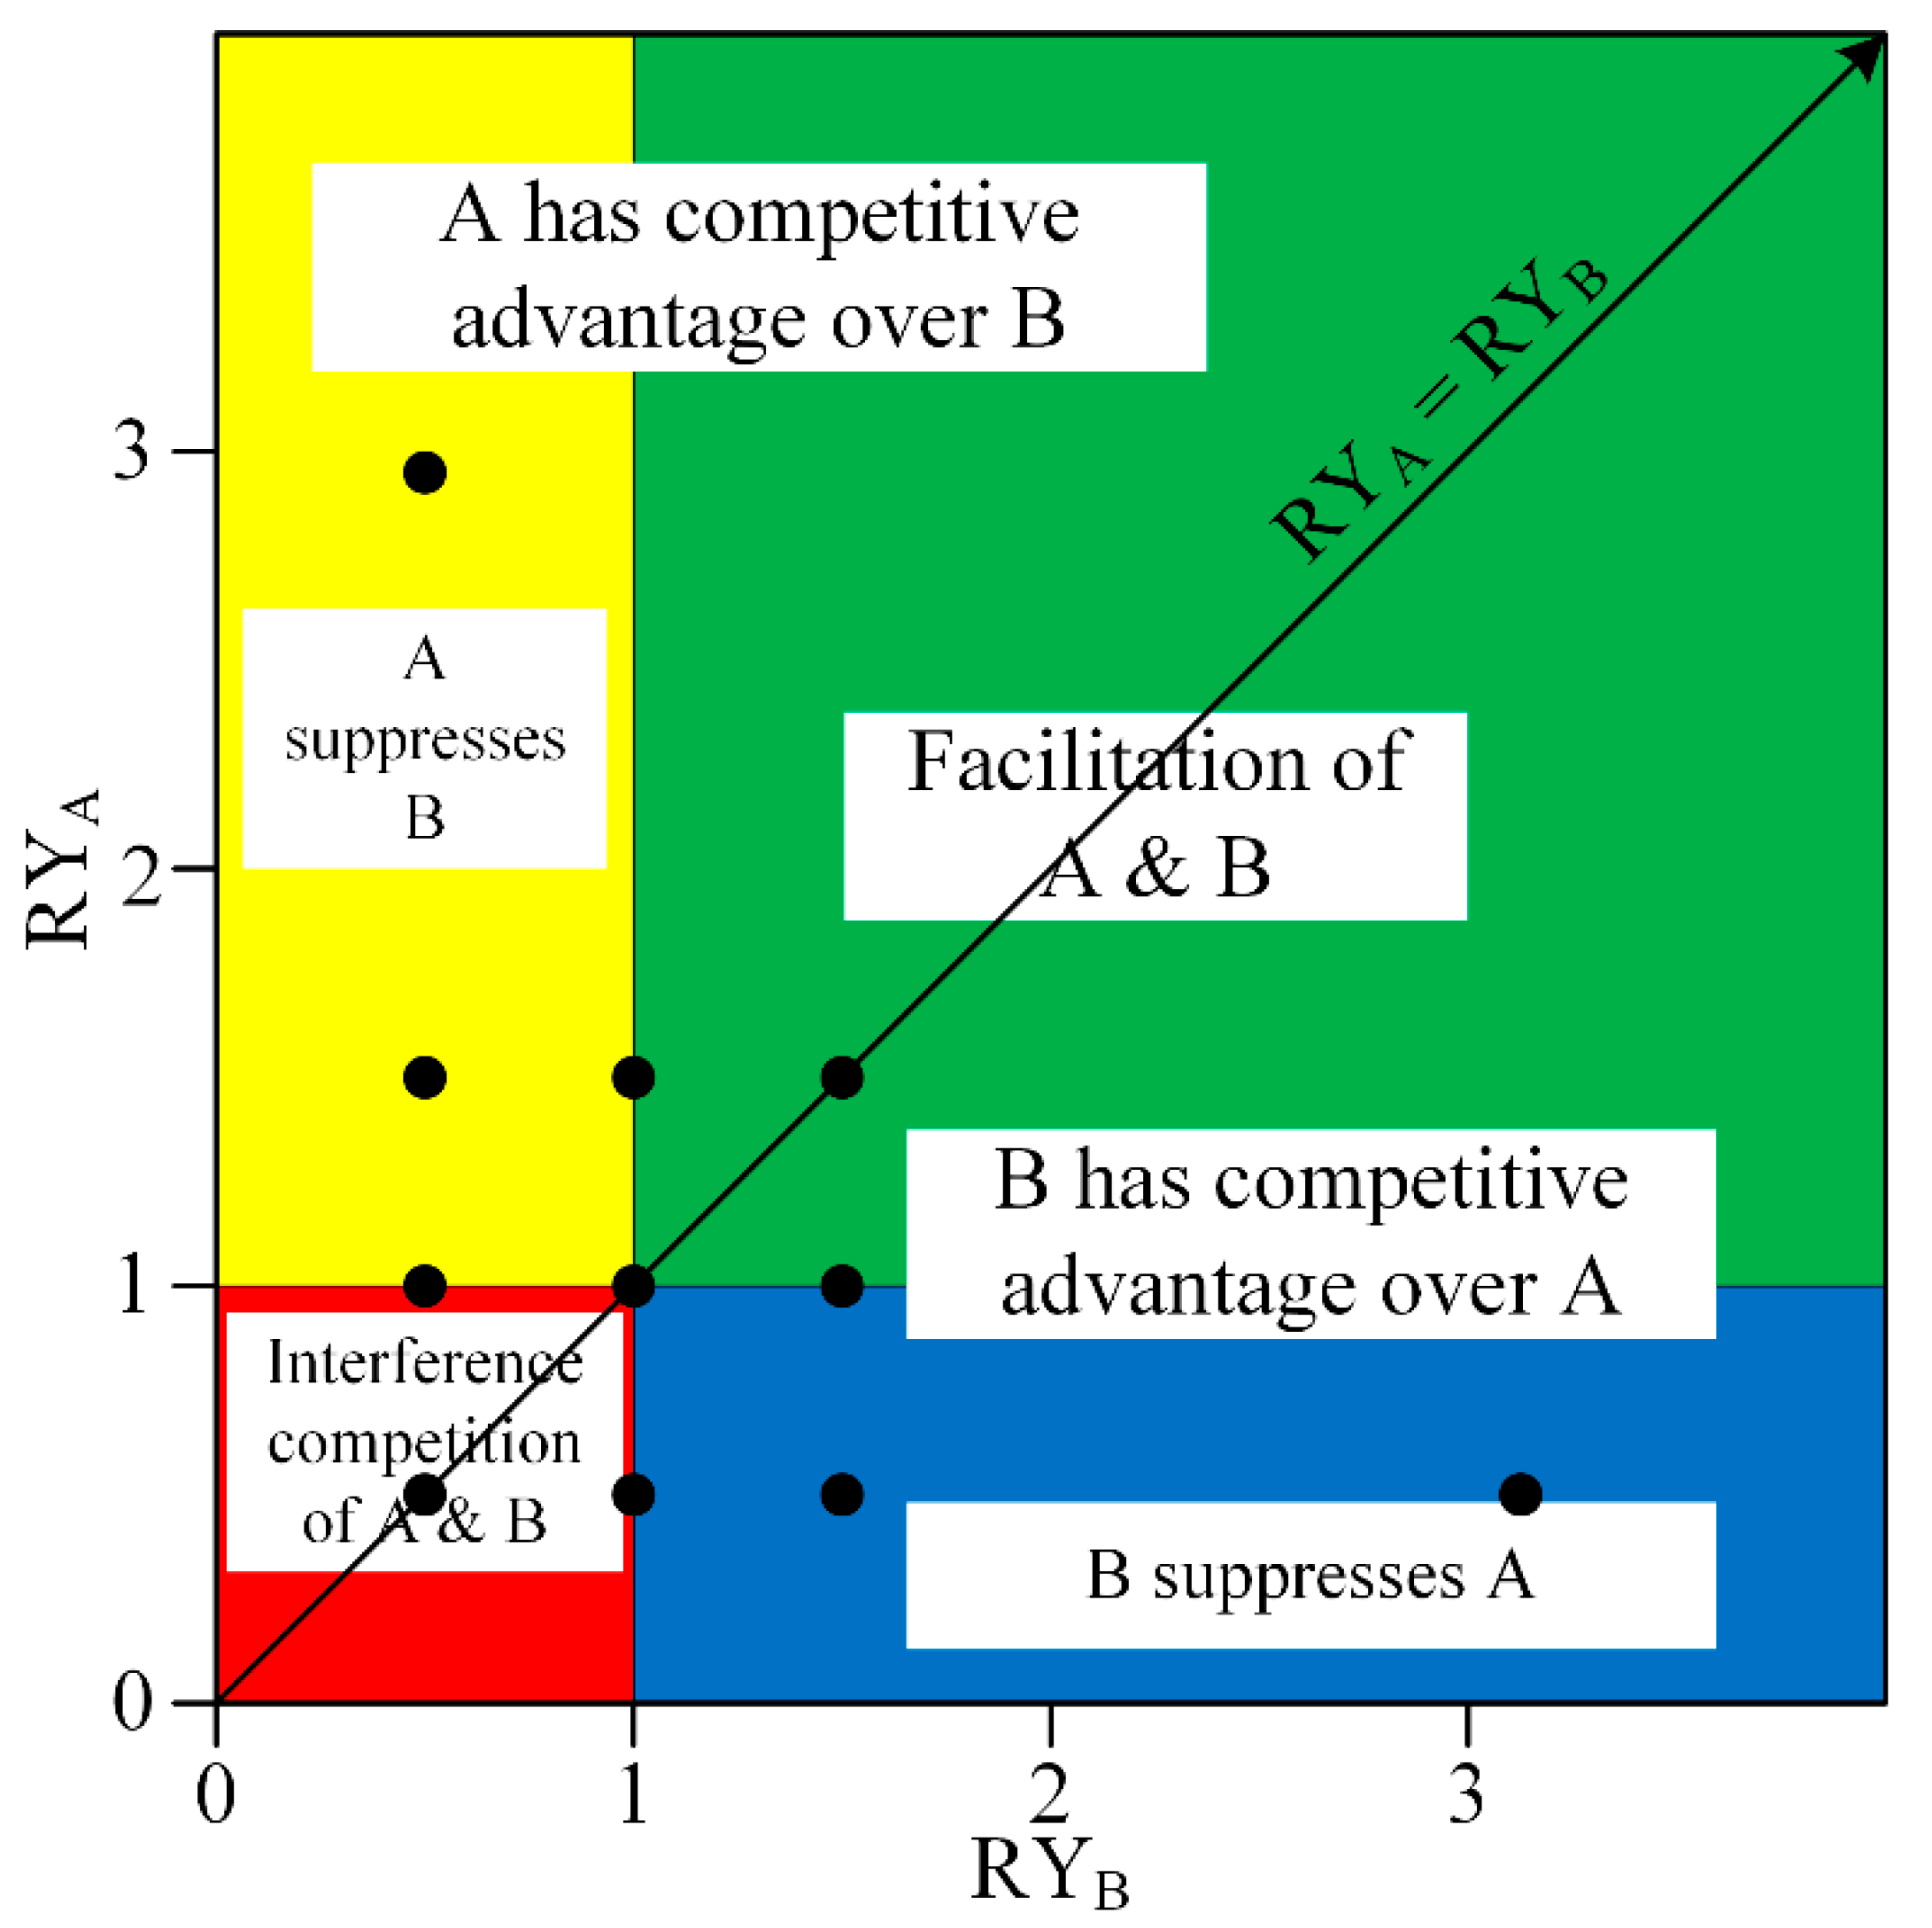
The stress-gradient hypothesis predicts a shift from net negative interactions in benign environments to net positive interactions in harsh environments [15], which means that in Figure 3, in cases when the flooding stress was strong enough, the relative indices should be located in top green area (Facilitation of A and B). As evaluated by relative total biomass, in the relationship between C. lasiocarpa and G. spiculosa, only G. spiculosa was facilitated. Generally, in this research, facilitation changed to competition with the increase in flooding stress (Figure 8). This may be because flooding is a non-resource stress in permanently inundated wetlands of the Sanjiang Plain. Although in permanently flooded wetlands, water availability is not a limited resource, other resources, such as rhizosphere air, could be limited by flooding. Our results were consistent with an alternative of stress-gradient hypothesis of that facilitation generally switches to competition in highly flooding stressed conditions [17].
Competitive response is associated with traits related to resource acquisition [38]. As root competition is more size-symmetric than shoot competition and involves multiple resources [39], root competition and shoot competition will show different characteristics. Here, we inferred root competition ability from the difference between the slope of full competition. At 0 cm water level, shoot competitive ability of C. lasiocarpa was greater than that of G. spiculosa, and root competition ability weaker than that of G. spiculosa (Figure 8a). However, it was the opposite at 10 and 20 cm water level. The relative changes in root competition abilities between C. lasiocarpa and G. spiculosa along water levels could be the main reason why the realistic niche of C. lasiocarpa was quite different from its physiological one. When comparing the relative competitive abilities between C. pseudocuraica and G. spiculosa, we found the shoot competitive ability of C. pseudocuraica was greater than that of G. spiculosa, and root competitive ability was weaker than that of G. spiculosa at 0–20 cm water levels. At 30 cm water level, both shoot and root competitive abilities of C. pseudocuraica were weaker than those of G. spiculosa (Figure 8b). These results suggested that the relatively weak position of C. pseudocuraica when competing with G. spiculosa could mainly be ascribed to its low root competition ability.

5. Conclusions

The species C. lasiocarpa and C. pseudocuraica are two dominant Carex species with similar niches inhabiting the inundated wetlands of the Sanjiang Plain. Our experiments indicated that the two Carex species generally exhibited similar survival strategies in response to the change in water levels in the absence of interspecific competition. Both Carex species tended to preserve their physiological individuals to adapt to flooding environment. In full competition with G. spiculosa, the increase in hydrological stress weakened the suppression of G. spiculosa on C. lasiocarpa, whereas it enhanced the suppression of G. spiculosa on C. pseudocuraica, which could explain to a large extent the actual spatial distribution difference of the two Carex species in the inundated wetlands of the Sanjiang Plain. As our experiment lasted for only one growing season, the response of wetland plants to varying water levels and interspecific competition could be different at larger time scales under more complex conditions, and more observations are undoubtedly needed to further unveil the underlying mechanisms of the zonation characteristics of wetland plants.

Author Contributions

W.T.: The conception and design of the work; the acquisition, analysis, and interpretation of data; drafted the work. L.S.: Design of the work; revised the work critically for important intellectual content; approved the version to be published. X.Z.: Design of the work; revised the work critically for important intellectual content. C.S.: Approved the version to be published; agreed to be accountable for all aspects of the work in ensuring that questions related to the accuracy or integrity of any part of the work are appropriately investigated and resolved. All authors have read and agreed to the published version of the manuscript.

Funding

This research was funded by the National Key Research and Development Program of China, grant number 2016YFA0602303; National Natural Science Foundation of China, grant number 41730643; Key Research Program of Frontier Sciences, CAS, grant number QYZDJ-SSW-DQC013.

Acknowledgments

We gratefully acknowledge two anonymous reviewers and the editors for their constructive comments on an earlier version of this paper. We thank Tianhua Qiao, Jiashuang Zhang, Zhe Han, and Lijun Wang for their help in conducting the experiment. We thank Shaofei Jin for his statistical guidance and comments on the manuscript.

Conflicts of Interest

The authors declare no conflict of interest.

Appendix A

Table A1. Effects of competitive modes on the total biomass of Carex pseudocuraica at 20 cm water level.
Sum of SquaresDegree of FreedomF ValueProbability (>F)
(Intercept)21.35971902.6277<0.001
Competition Mode0.220324.65550.02674
Residuals0.35515
Table A2. Effects of competitive modes on the total biomass of Carex pseudocuraica at 30 cm water level.
Sum of SquaresDegree of FreedomF ValueProbability (>F)
(Intercept)13.836811063.238<0.001
Competition Mode0.3886214.9310.00027
Residuals0.195215
Table A3. Effects of competitive modes on the single shoot biomass of Carex pseudocuraica at 30 cm water level.
Sum of SquaresDegree of FreedomF ValueProbability (>F)
(Intercept)3.97221996.9008<0.001
Competition Mode0.0728.77950.00299
Residuals0.059815
Table A4. Effects of competitive modes on the propagule amount of Carex lasiocarpa at 0 cm water level.
Sum of SquaresDegree of FreedomF ValueProbability (>F)
(Intercept)73.63811780.7348<0.001
Competition Mode0.4124.96210.02218
Residuals0.6215
Table A5. Effects of competitive modes on the propagule amount of Carex lasiocarpa at 10 cm water level.
Sum of SquaresDegree of FreedomF ValueProbability (>F)
(Intercept)61.15414103.6181<0.001
Competition Mode0.19126.41060.009724
Residuals0.22415
Table A6. Effects of competitive modes on the propagule amount of Carex lasiocarpa at 20 cm water level.
Sum of SquaresDegree of FreedomF ValueProbability (>F)
(Intercept)48.512654.6789<0.001
Competition Mode0.225.47010.01644
Residuals0.27415
Table A7. Effects of water level on the total biomass of Carex lasiocarpa in no competition.
Sum of SquaresDegree of FreedomF ValueProbability (>F)
(Intercept)13.02461583.739<0.001
Water level1.0131315.134<0.001
Residuals0.446220
Table A8. Effects of water level on the total biomass of Carex lasiocarpa in shoot competition.
Sum of SquaresDegree of FreedomF ValueProbability (>F)
(Intercept)13.13971300.5627<0.001
Water level0.841829.62770.002043
Residuals0.655815
Table A9. Effects of water level on the total biomass of Carex pseudocuraica in shoot competition.
Sum of SquaresDegree of FreedomF ValueProbability (>F)
(Intercept)8.02281343.7193<0.001
Water level0.501237.15770.001885
Residuals0.466820
Table A10. Effects of water level on the total biomass of Carex pseudocuraica in full competition.
Sum of SquaresDegree of FreedomF ValueProbability (>F)
(Intercept)6.69141318.5568<0.001
Water level0.575539.1324<0.001
Residuals0.420120
Table A11. Effects of water level on the single shoot biomass of Carex pseudocuraica in no competition.
Sum of SquaresDegree of FreedomF ValueProbability (>F)
(Intercept)1.167081138.097<0.001
Water level0.1153234.54860.0138
Residuals0.1690220
Table A12. Effects of water level on the single shoot biomass of Carex pseudocuraica in shoot competition.
Sum of SquaresDegree of FreedomF ValueProbability (>F)
(Intercept)1.519341250.8466<0.001
Water level0.1149536.32610.003416
Residuals0.1211420
Table A13. Effects of water level on the single shoot biomass of Carex pseudocuraica in full competition.
Sum of SquaresDegree of FreedomF ValueProbability (>F)
(Intercept)1.051731271.899<0.001
Water level0.0463833.9970.02214
Residuals0.0773620
Table A14. Effects of water level on the propagule amount of Carex lasiocarpa in no competition.
Sum of SquaresDegree of FreedomF ValueProbability (>F)
(Intercept)28.359211610.124<0.001
Water level1.5811329.924<0.001
Residuals0.352320
Table A15. Effects of water level on the propagule amount of Carex lasiocarpa in shoot competition.
Sum of SquaresDegree of FreedomF ValueProbability (>F)
(Intercept)25.890411194.154<0.001
Water level0.8983220.716<0.001
Residuals0.325215
Table A16. Effects of water level on the propagule amount of Carex pseudocuraica in full competition.
Sum of SquaresDegree of FreedomF ValueProbability (>F)
(Intercept)26.84951640.1095<0.001
Water level0.90737.20810.00182
Residuals0.838920
Table A17. Effects of water level on the root/shoot ratio of Carex lasiocarpa in no competition.
Sum of SquaresDegree of FreedomF ValueProbability (>F)
(Intercept)5.32671139.111<0.001
Water level1.3621311.858<0.001
Residuals0.765820
Table A18. Effects of water level on the root/shoot ratio of Carex lasiocarpa in shoot competition.
Sum of SquaresDegree of FreedomF ValueProbability (>F)
(Intercept)6.15341267.465<0.001
Water level0.9406220.442<0.001
Residuals0.345115
Table A19. Effects of water level on the root/shoot ratio of Carex lasiocarpa in full competition.
Sum of SquaresDegree of FreedomF ValueProbability (>F)
(Intercept)5.70641157.847<0.001
Water level0.9594213.269<0.001
Residuals0.542315
Table A20. Effects of water level on the root/shoot ratio of Carex pseudocuraica in no competition.
Sum of SquaresDegree of FreedomF ValueProbability (>F)
(Intercept)4.91071288.668<0.001
Water level1.2337324.173<0.001
Residuals0.340220
Table A21. Effects of water level on the root/shoot ratio of Carex pseudocuraica in shoot competition.
Sum of SquaresDegree of FreedomF ValueProbability (>F)
(Intercept)4.11171346.326<0.001
Water level1.318337.005<0.001
Residuals0.237420
Table A22. Effects of water level on the root/shoot ratio of Carex pseudocuraica in full competition.
Sum of SquaresDegree of FreedomF ValueProbability (>F)
(Intercept)6.34171230.559<0.001
Water level1.9427323.543<0.001
Residuals0.550120

References

  1. Engels, J.G.; Jensen, K. Patterns of wetland plant diversity along estuarine stress gradients of the Elbe (Germany) and Connecticut (USA) Rivers. Plant Ecol. Divers. 2009, 2, 301–311. [Google Scholar] [CrossRef]
  2. Ellenberg, H. Physiologisches und ökologisches Verhalten derselben Pflanzenarten. Ber. Dtsch. Bot. Ges. 1953, 65, 351–361. [Google Scholar] [CrossRef]
  3. Casanova, M.T.; Brock, M.A. How do depth, duration and frequency of flooding influence the establishment of wetland plant communities? Plant Ecol. 2000, 147, 237–250. [Google Scholar] [CrossRef]
  4. Correa-Araneda, F.J.; Urrutia, J.; Soto-Mora, Y.; Figueroa, R.; Hauenstein, E. Effects of the hydroperiod on the vegetative and community structure of freshwater forested wetlands, Chile. J. Freshw. Ecol. 2012, 27, 459–470. [Google Scholar] [CrossRef] [Green Version]
  5. Lou, Y.; Pan, Y.; Gao, C.; Jiang, M.; Lu, X.; Xu, Y.J. Response of Plant Height, Species Richness and Aboveground Biomass to Flooding Gradient along Vegetation Zones in Floodplain Wetlands, Northeast China. PLoS ONE 2016, 11, e0153972. [Google Scholar] [CrossRef] [PubMed]
  6. Lou, Y.; Wang, G.; Lu, X.; Jiang, M.; Zhao, K. Zonation of plant cover and environmental factors in wetlands of the Sanjiang Plain, northeast China. Nord. J. Bot. 2013, 31, 748–756. [Google Scholar] [CrossRef]
  7. Parolin, P.; Lucas, C.; Piedade, M.T.F.; Wittmann, F. Drought responses of flood-tolerant trees in Amazonian floodplains. Ann. Bot. 2010, 105, 129–139. [Google Scholar] [CrossRef] [Green Version]
  8. Luo, W.; Xie, Y.; Chen, X.; Li, F.; Qin, X. Competition and facilitation in three marsh plants in response to a water-level gradient. Wetlands 2010, 30, 525–530. [Google Scholar] [CrossRef]
  9. Zhang, X.; Mao, R.; Gong, C.; Yang, G.; Lu, Y. Effects of hydrology and competition on plant growth in a freshwater marsh of northeast China. J. Freshw. Ecol. 2014, 29, 117–128. [Google Scholar] [CrossRef] [Green Version]
  10. Hutchinson, G.E. Population studies-animal ecology and demography-concluding remarks. Cold Spring Harb. Symp. Quant. Biol. 1957, 22, 415–427. [Google Scholar] [CrossRef]
  11. Silvertown, J. Plant coexistence and the niche. Trends Ecol. Evol. 2004, 19, 605–611. [Google Scholar] [CrossRef]
  12. Lenssen, J.; Menting, F.; van der Putten, W.; Blom, K. Control of Plant Species Richness and Zonation of Functional Groups along a Freshwater Flooding Gradient. Oikos 1999, 86, 523–534. [Google Scholar] [CrossRef]
  13. Bartelheimer, M.; Gowing, D.; Silvertown, J. Explaining hydrological niches: The decisive role of below-ground competition in two closely related Senecio species. J. Ecol. 2010, 98, 126–136. [Google Scholar] [CrossRef]
  14. Grace, J.B. A Clarification of the Debate Between Grime and Tilman. Funct. Ecol. 1991, 5, 583–587. [Google Scholar] [CrossRef]
  15. Bertness, M.D.; Callaway, R. Positive interactions in communities. Trends Ecol. Evol. 1994, 9, 191–193. [Google Scholar] [CrossRef]
  16. Brooker, R.; Kikvidze, Z.; Pugnaire, F.I.; Callaway, R.M.; Choler, P.; Lortie, C.J.; Michalet, R. The importance of importance. Oikos 2005, 109, 63–70. [Google Scholar] [CrossRef]
  17. Michalet, R.; Le Bagousse-Pinguet, Y.; Maalouf, J.-P.; Lortie, C.J. Two alternatives to the stress-gradient hypothesis at the edge of life: The collapse of facilitation and the switch from facilitation to competition. J. Veg. Sci. 2014, 25, 609–613. [Google Scholar] [CrossRef]
  18. Zhao, K.Y. Wetlands in China; Chinese Science Press: Beijing, China, 1999. (In Chinese) [Google Scholar]
  19. Lou, Y.; Gao, C.; Pan, Y.; Xue, Z.; Liu, Y.; Tang, Z.; Jiang, M.; Lu, X.; Rydin, H. Niche modelling of marsh plants based on occurrence and abundance data. Sci. Total Environ. 2018, 616–617, 198–207. [Google Scholar] [CrossRef]
  20. Luan, Z.; Wang, Z.; Yan, D.; Liu, G.; Xu, Y. The ecological response of Carex lasiocarpa community in the Riparian Wetlands to the environmental gradient of water depth in Sanjiang Plain, Northeast China. Sci. World J. 2013, 2013, 402067. [Google Scholar] [CrossRef] [Green Version]
  21. Lou, Y.; Zhao, K.; Wang, G.; Jiang, M.; Lu, X.; Rydin, H. Long-term changes in marsh vegetation in Sanjiang Plain, northeast China. J. Veg. Sci. 2015, 26, 643–650. [Google Scholar] [CrossRef]
  22. Shi, F.; Song, C.; Zhang, X.; Mao, R.; Guo, Y.; Gao, F. Plant zonation patterns reflected by the differences in plant growth, biomass partitioning and root traits along a water level gradient among four common vascular plants in freshwater marshes of the Sanjiang Plain, Northeast China. Ecol. Eng. 2015, 81, 158–164. [Google Scholar] [CrossRef]
  23. McPhee, C.S.; Aarssen, L.W. The separation of above- and below-ground competition in plants: A review and critique of methodology. Plant Ecol. 2001, 152, 119–136. [Google Scholar] [CrossRef]
  24. Gaudet, C.L.; Keddy, P.A. A comparative approach to predicting competitive ability from plant traits. Nature 1988, 334, 242–243. [Google Scholar] [CrossRef]
  25. Williams, A.C.; McCarthy, B.C. A new index of interspecific competition for replacement and additive designs. Ecol. Res. 2001, 16, 29–40. [Google Scholar] [CrossRef]
  26. Fox, J.; Weisberg, S. An R Companion to Applied Regression, 3rd ed.; Sage: Thousand Oaks, CA, USA, 2019. [Google Scholar]
  27. de Mendiburu, F. Agricolae: Statistical Procedures for Agricultural Research; R Package Version 1.3–3. Available online: https://CRAN.R-project.org/package=agricolae (accessed on 2 November 2020).
  28. Wickham, H. ggplot2: Elegant Graphics for Data Analysis; Springer: New York, NY, USA, 2016. [Google Scholar]
  29. Dong, M.; Yu, F.H.; Chen, Y.F.; Song, M.H.; Liu, J.; Chen, J.S.; Li, J.M.; Liu, F.H. Clonal Plant Ecology; Science Publishing: Beijing, China, 2011. (In Chinese) [Google Scholar]
  30. Luan, J.; Zou, Y.; Lu, X.; Sui, G.S.; Zhang, Y.W. Variation law of stem diameter and internode length aboveground of Carex pseudocuraica ramets under different water content. J. Northwest A F Univ. (Nat. Sci. Ed.) 2006, 34, 643–650. (In Chinese) [Google Scholar] [CrossRef]
  31. Sha, W.; Xu, Z.W.; Wang, X.Q.; Ni, H. Leaf anatomy of Carex pseudocuraica growing in different environments of Sanjiang Campagna. Guihaia 2006, 26, 583–588. (In Chinese) [Google Scholar]
  32. Sha, W.; Xu, Z.W.; Wang, X.Q.; Ni, H. Study on stem anatomy of Carex pseudocuraica growing in different water environment of Sanjiang plain in Carex genus pseudocuraica. J. Qiqihar Univ. (Nat. Sci. Ed.) 2009, 25, 77–81. (In Chinese) [Google Scholar]
  33. Yabe, K.; Onimaru, K. Key variables controlling the vegetation of a cool-temperate mire in northern Japan. J. Veg. Sci. 1997, 8, 29–36. [Google Scholar] [CrossRef]
  34. Webb, J.A.; Wallis, E.M.; Stewardson, M.J. A systematic review of published evidence linking wetland plants to water regime components. Aquat. Bot. 2012, 103, 1–14. [Google Scholar] [CrossRef]
  35. Cahill, J.F.J. Lack of relationship between below-ground competition and allocation to roots in 10 grassland species. J. Ecol. 2003, 91, 532–540. [Google Scholar] [CrossRef] [Green Version]
  36. Shipley, B.; Meziane, D. The balanced-growth hypothesis and the allometry of leaf and root biomass allocation. Funct. Ecol. 2002, 16, 326–331. [Google Scholar] [CrossRef]
  37. Bartelheimer, M.; Poschlod, P. Functional characterizations of Ellenberg indicator values–a review on ecophysiological determinants. Funct. Ecol. 2016, 30, 506–516. [Google Scholar] [CrossRef]
  38. Semchenko, M.; Lepik, A.; Abakumova, M.; Zobel, K. Different sets of belowground traits predict the ability of plant species to suppress and tolerate their competitors. Plant Soil 2018, 424, 157–169. [Google Scholar] [CrossRef]
  39. Cahill, J.F.J.; Casper, B.B. Investigating the relationship between neighbor root biomass and belowground competition: Field evidence for symmetric competition belowground. Oikos 2000, 90, 311–320. [Google Scholar] [CrossRef] [Green Version]
Figure 1. Illustration of the experimental design. (a) No competition with two ramets of same plant (Carex lasiocarpa, Carex pseudocuraica or Glyceria spiculosa) planted in one 10 cm long tube; (b) Shoot competition with two species (one C. lasiocarpa or C. pseudocuraica and one G. spiculosa) planted in two 5 cm long tubes; (c) Full competition with two species (one C. lasiocarpa or C. pseudocuraica and one G. spiculosa) planted in one 10 cm long tube.
Sustainability 12 10654 g001
Figure 2. Sketch of the tubes or tube-group arrangement in a plastic tank. There were 28 tanks for the whole experiment, which included 2 species (C. lasiocarpa and C. pseudocuraica) × 3 competitive modes × 4 water levels, and 4 water levels of G. spiculosa in no competitive mode.
Sustainability 12 10654 g002
Figure 3. Graphic representation of all possible outcomes of a competition situation between two species (from Williams and McCarthy [25]). The 11 points on the figure are the relative yield (RY) values. Note that these dots span a wide range of outcomes. The diagonal reference line denotes the area of the graph in which species A has competitive advantage over species B (above the line RYA = RYB) and the area where B has a competitive advantage over A (below the line RYA = RYB). The area of red indicates both species A and B were suppressed in competition. The area of yellow indicates species B was reduced in competition, but species A performed better in competition, so species A had a clear advantage over species B. The area of green indicates both species performed better in the competition than they did in no competition, showing facilitation of both species. The area of blue indicates species B performed better in competition and suppressed species A.
Sustainability 12 10654 g003
Figure 4. Total biomass (mean ± SE) of (a) C. lasiocarpa and (b) C. pseudocuraica under different competition and water level conditions. As few individuals of C. lasiocarpa survived at 30 cm water level with the presence of competition, these data are not shown. Significance symbols of two-way ANOVA: ***, p < 0.001, **, p < 0.01, *, p < 0.05, and NS, no significance. Capital letters represent the differences between competitive modes at the same water level at p < 0.05. Lower cases represent the differences between water levels in the same competitive mode at p < 0.05.
Sustainability 12 10654 g004
Figure 5. Single shoot biomass (mean ± SE) of (a) C. lasiocarpa and (b) C. pseudocuraica under different competition and water level conditions. As few individuals of C. lasiocarpa survived at 30 cm water level with the presence of competition, these data are not shown. Significance symbols of two-way ANOVA: *** p < 0.001, ** p < 0.01, NS no significance. Capital letters represent the differences between competitive modes at the same water level at p < 0.05. Lower cases represent the differences between water levels in the same competitive mode at p < 0.05.
Sustainability 12 10654 g005
Figure 6. Propagule amount (mean ± SE) of (a) C. lasiocarpa and (b) C. pseudocuraica under different competition and water level conditions. As few individuals of C. lasiocarpa survived at 30 cm water level with the presence of competition, these data are not shown. Significance symbols of two-way ANOVA: *** p < 0.001, NS no significance. Capital letters represent the differences between competitive modes at the same water level at p < 0.05. Lower cases represent the differences between water levels in the same competitive mode at p < 0.05.
Sustainability 12 10654 g006
Figure 7. Root/shoot ratio (mean ± SE) of (a) C. lasiocarpa and (b) C. pseudocuraica under different competition and water level conditions. As few individuals of C. lasiocarpa survived at 30 cm water level with the presence of competition, these data are not shown. Significance symbols of two-way ANOVA: *** p < 0.001, NS no significance. Lower cases represent the differences between water levels in the same competitive mode at p < 0.05.
Sustainability 12 10654 g007
Figure 8. Relative competitive ability of (a) C. lasiocarpa vs. G. spiculosa evaluated by relative total biomass, (b) C. pseudocuraica vs. G. spiculosa evaluated by relative total biomass, (c) C. lasiocarpa vs. G. spiculosa evaluated by relative single shoot biomass, and (d) C. pseudocuraica vs. G. spiculosa evaluated by relative single shoot biomass. The numbers next to the symbols are their slopes, indicating the relative competitive ability.
Sustainability 12 10654 g008
Publisher’s Note: MDPI stays neutral with regard to jurisdictional claims in published maps and institutional affiliations.

