Prediction of Remaining Life for Bridge Decks Considering Deterioration Factors and Propose of Prioritization Process for Bridge Deck Maintenance


Abstract
1. Introduction
2. Research Method
3. Analysis of Condition States Data
4. Determination of Deterioration Factors
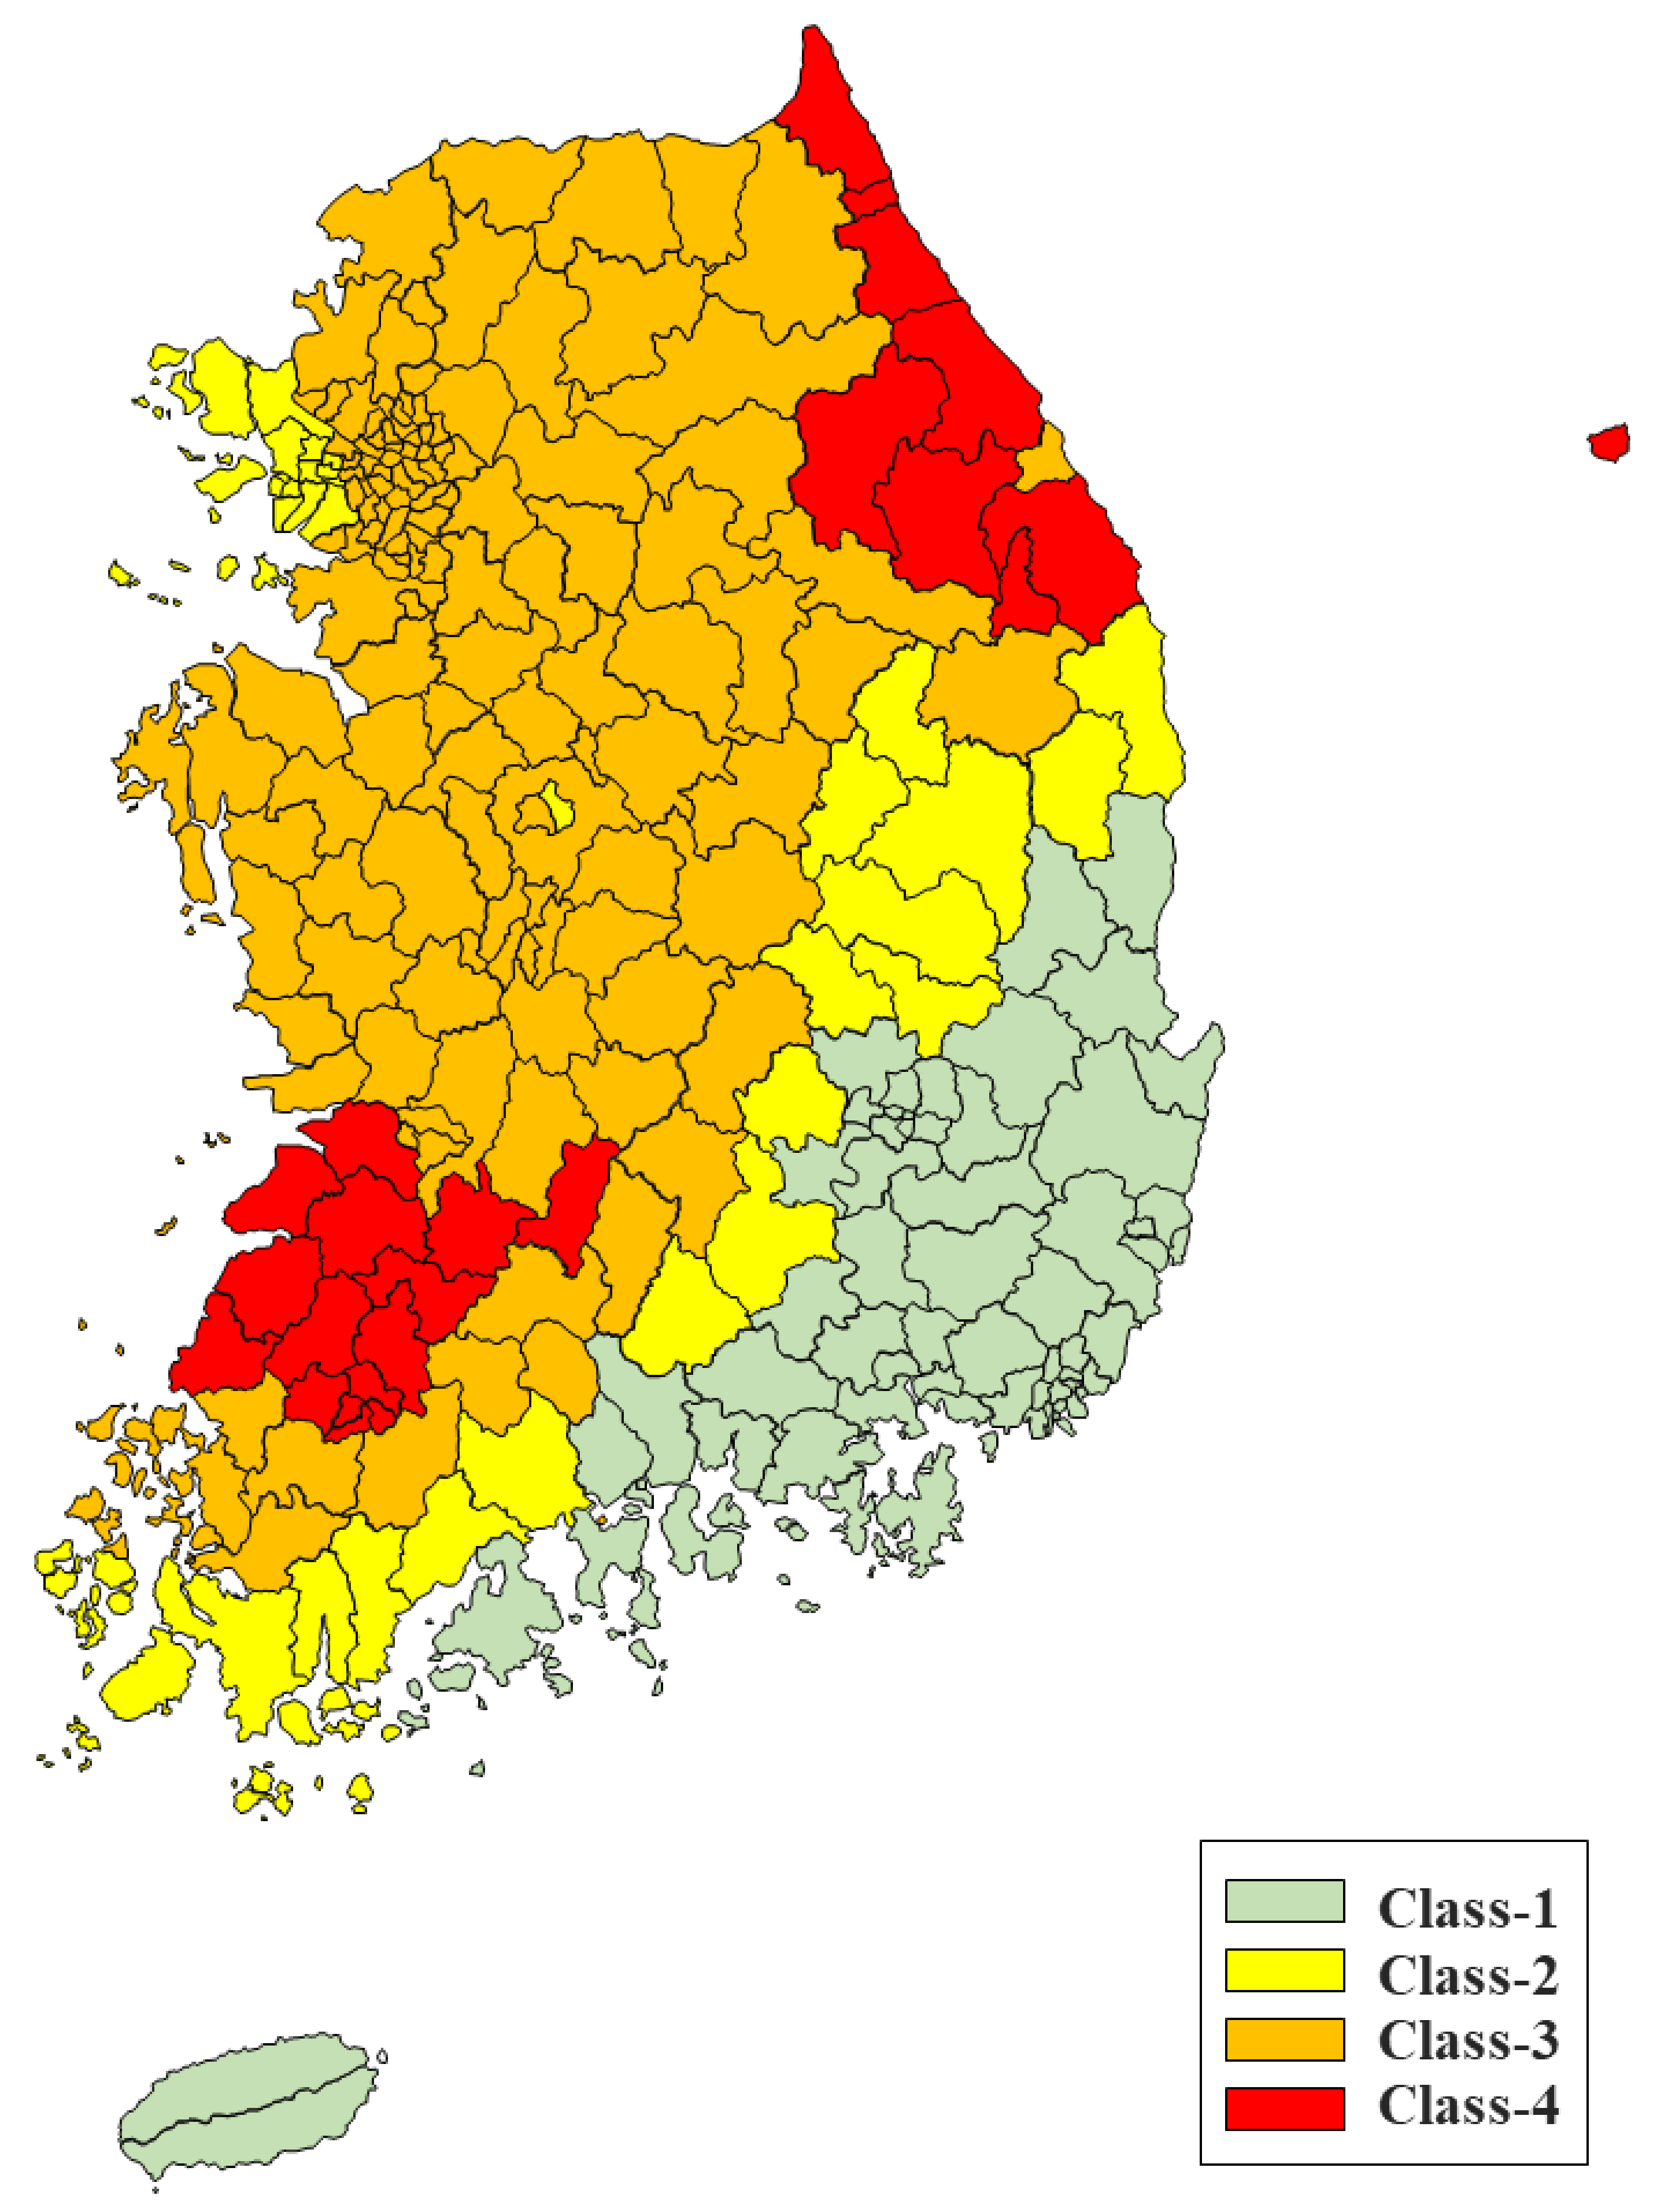
4.1. Deicing Agent Exposure Grade
4.2. Pavement Condition State
4.3. Re-Pavement or Deck Improvement Status (Surface Improvement Status)
5. Derivation of Deck Performance Degradation Curves Considering the Deterioration Factors
6. Prediction of the Residual Service Life of Bridge Decks
- -
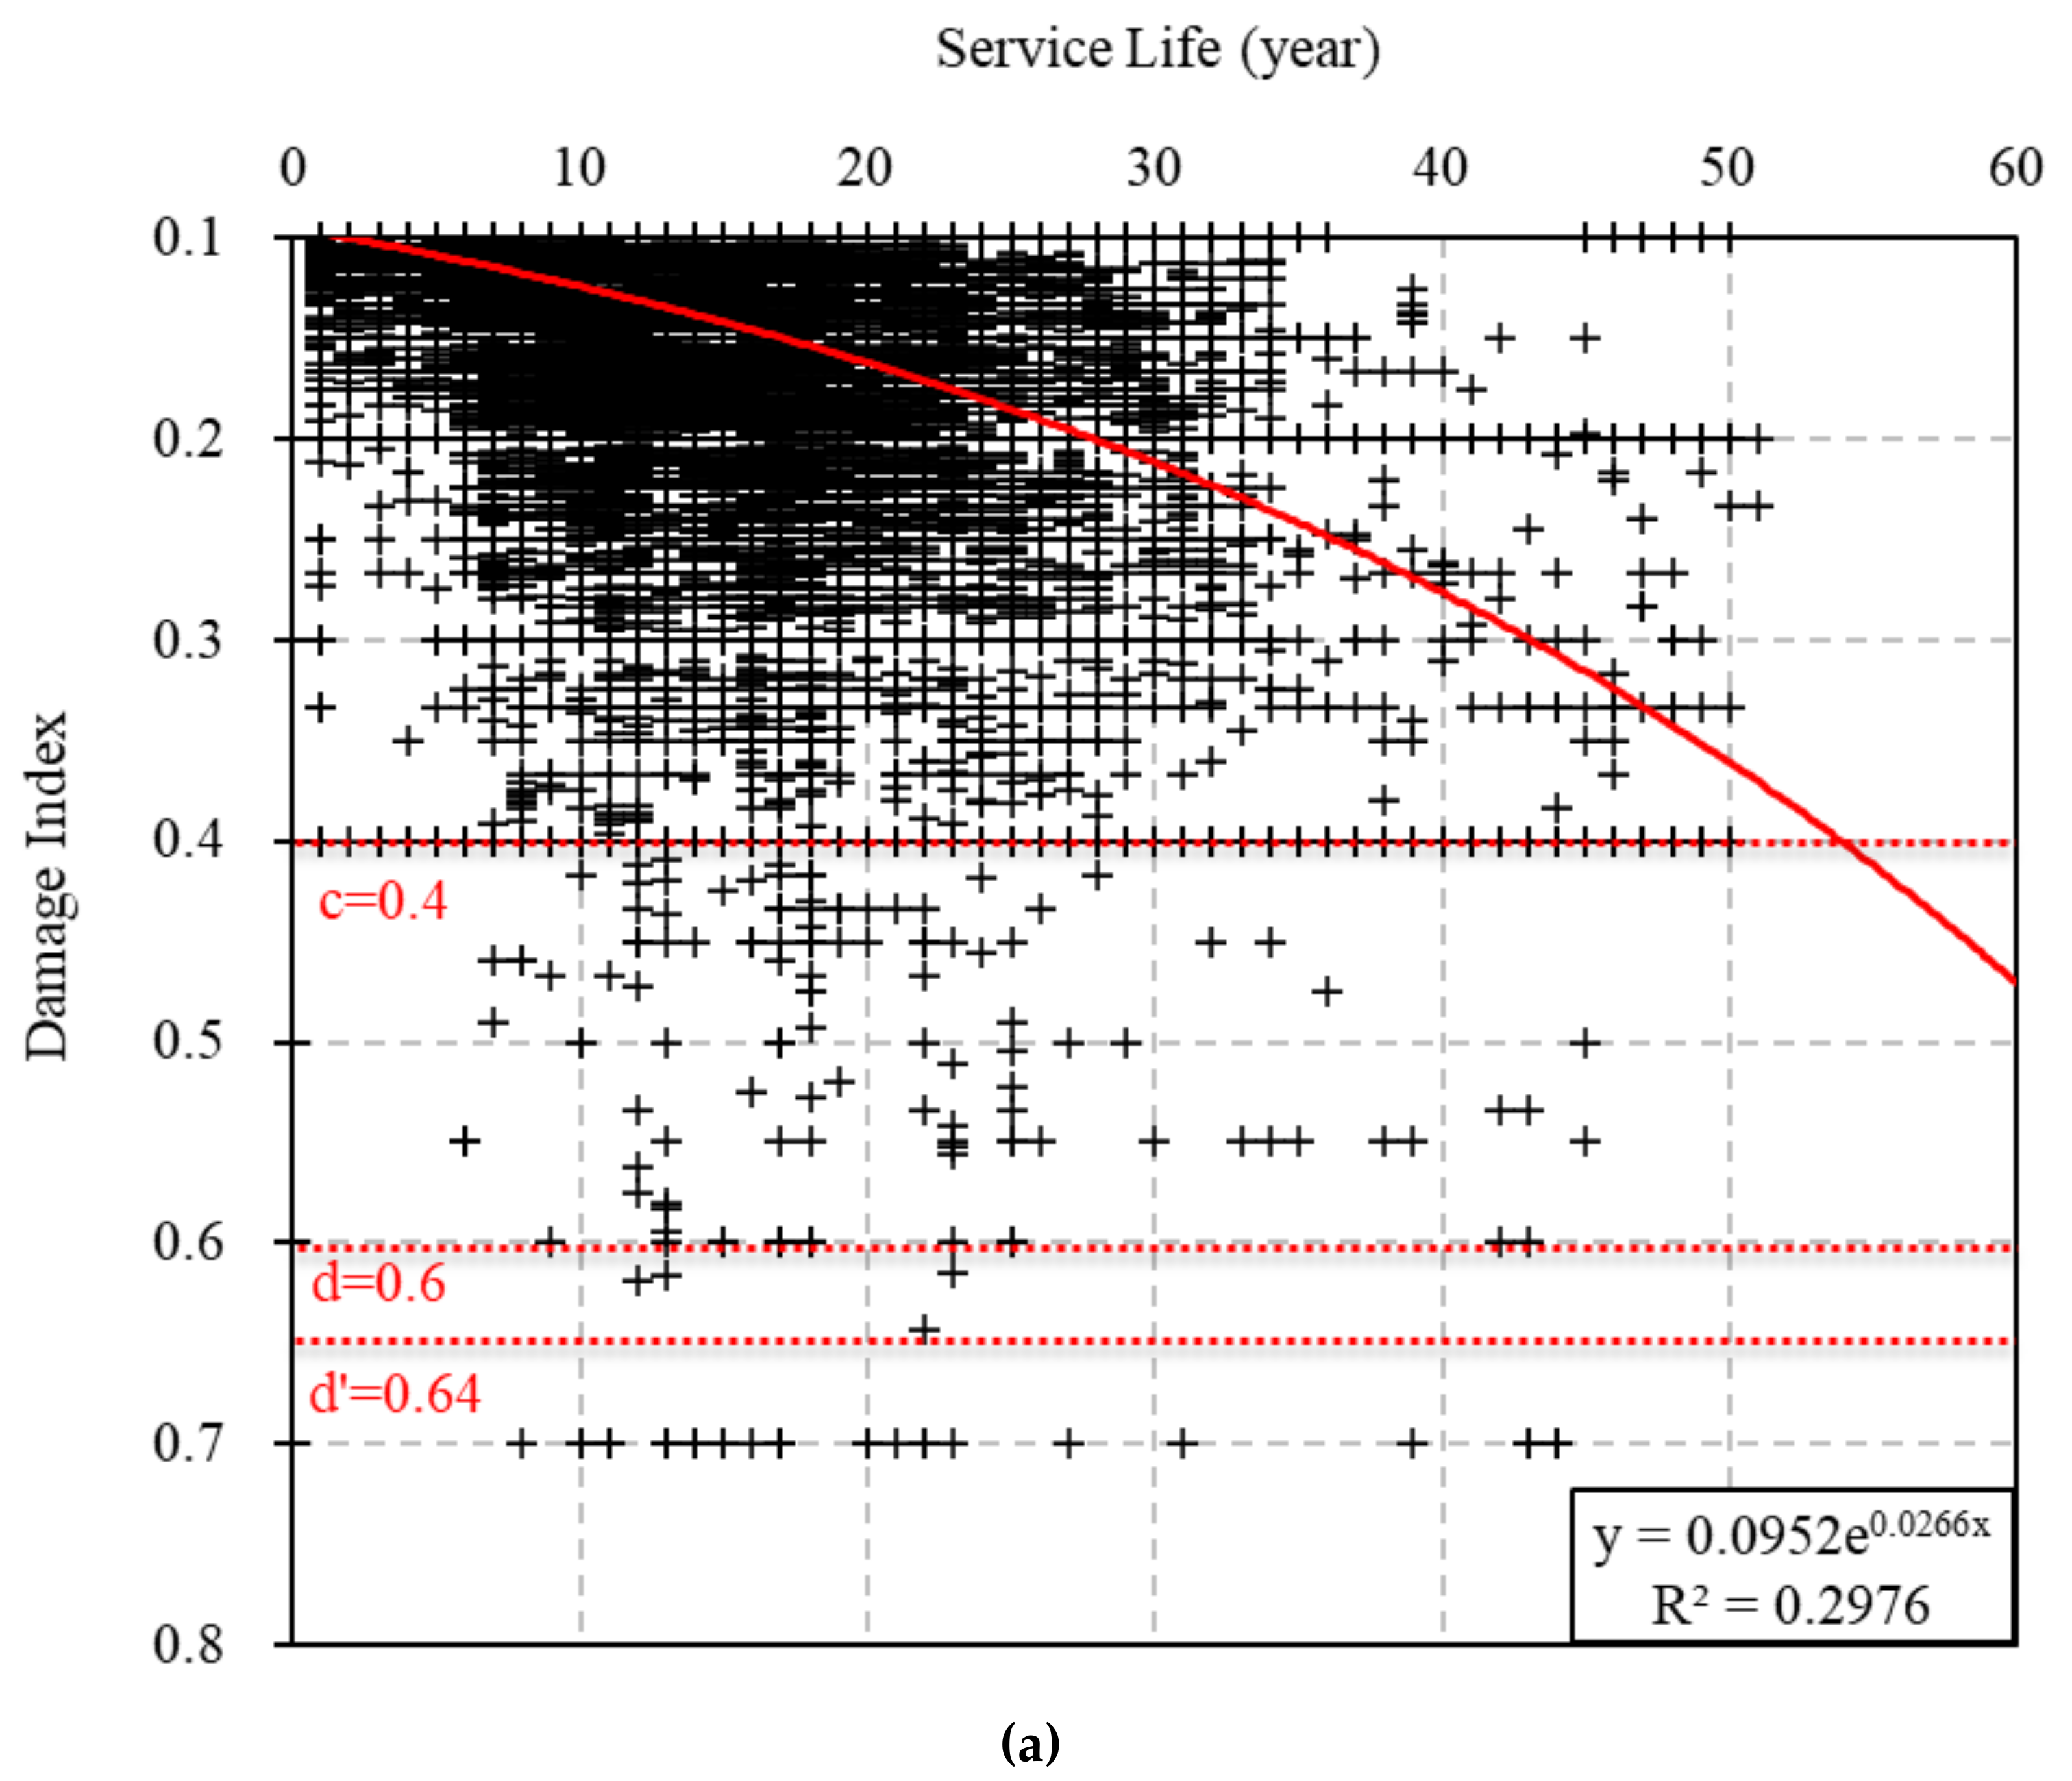
- When repair is necessary due to minor deterioration or damage (grade c, DI = 0.4)
- -
- When reinforcement is needed owing to the reduction in the load-carrying capacity of the bridge deck (graded, DI = 0.6)
- -
- When a certain period of time has elapsed since the load carrying capacity has been reduced and reinforcement is needed (grade d’, DI = 0.64) [35]
- RL = Remaining Life
- DI = Targeting Damage Index (0.64)
- CA = Current Age
7. Determination of Maintenance Priorities
8. Accomplishment of Bridges Decks Sustainability
9. Conclusions
- (1)
- Factors that can represent various deterioration factors for decks were examined; following three factors that can reflect combined deterioration and damage were selected and reflected in the analysis: (1) deicing agent exposure grade, (2) pavement condition state, and (3) surface improvement status.
- (2)
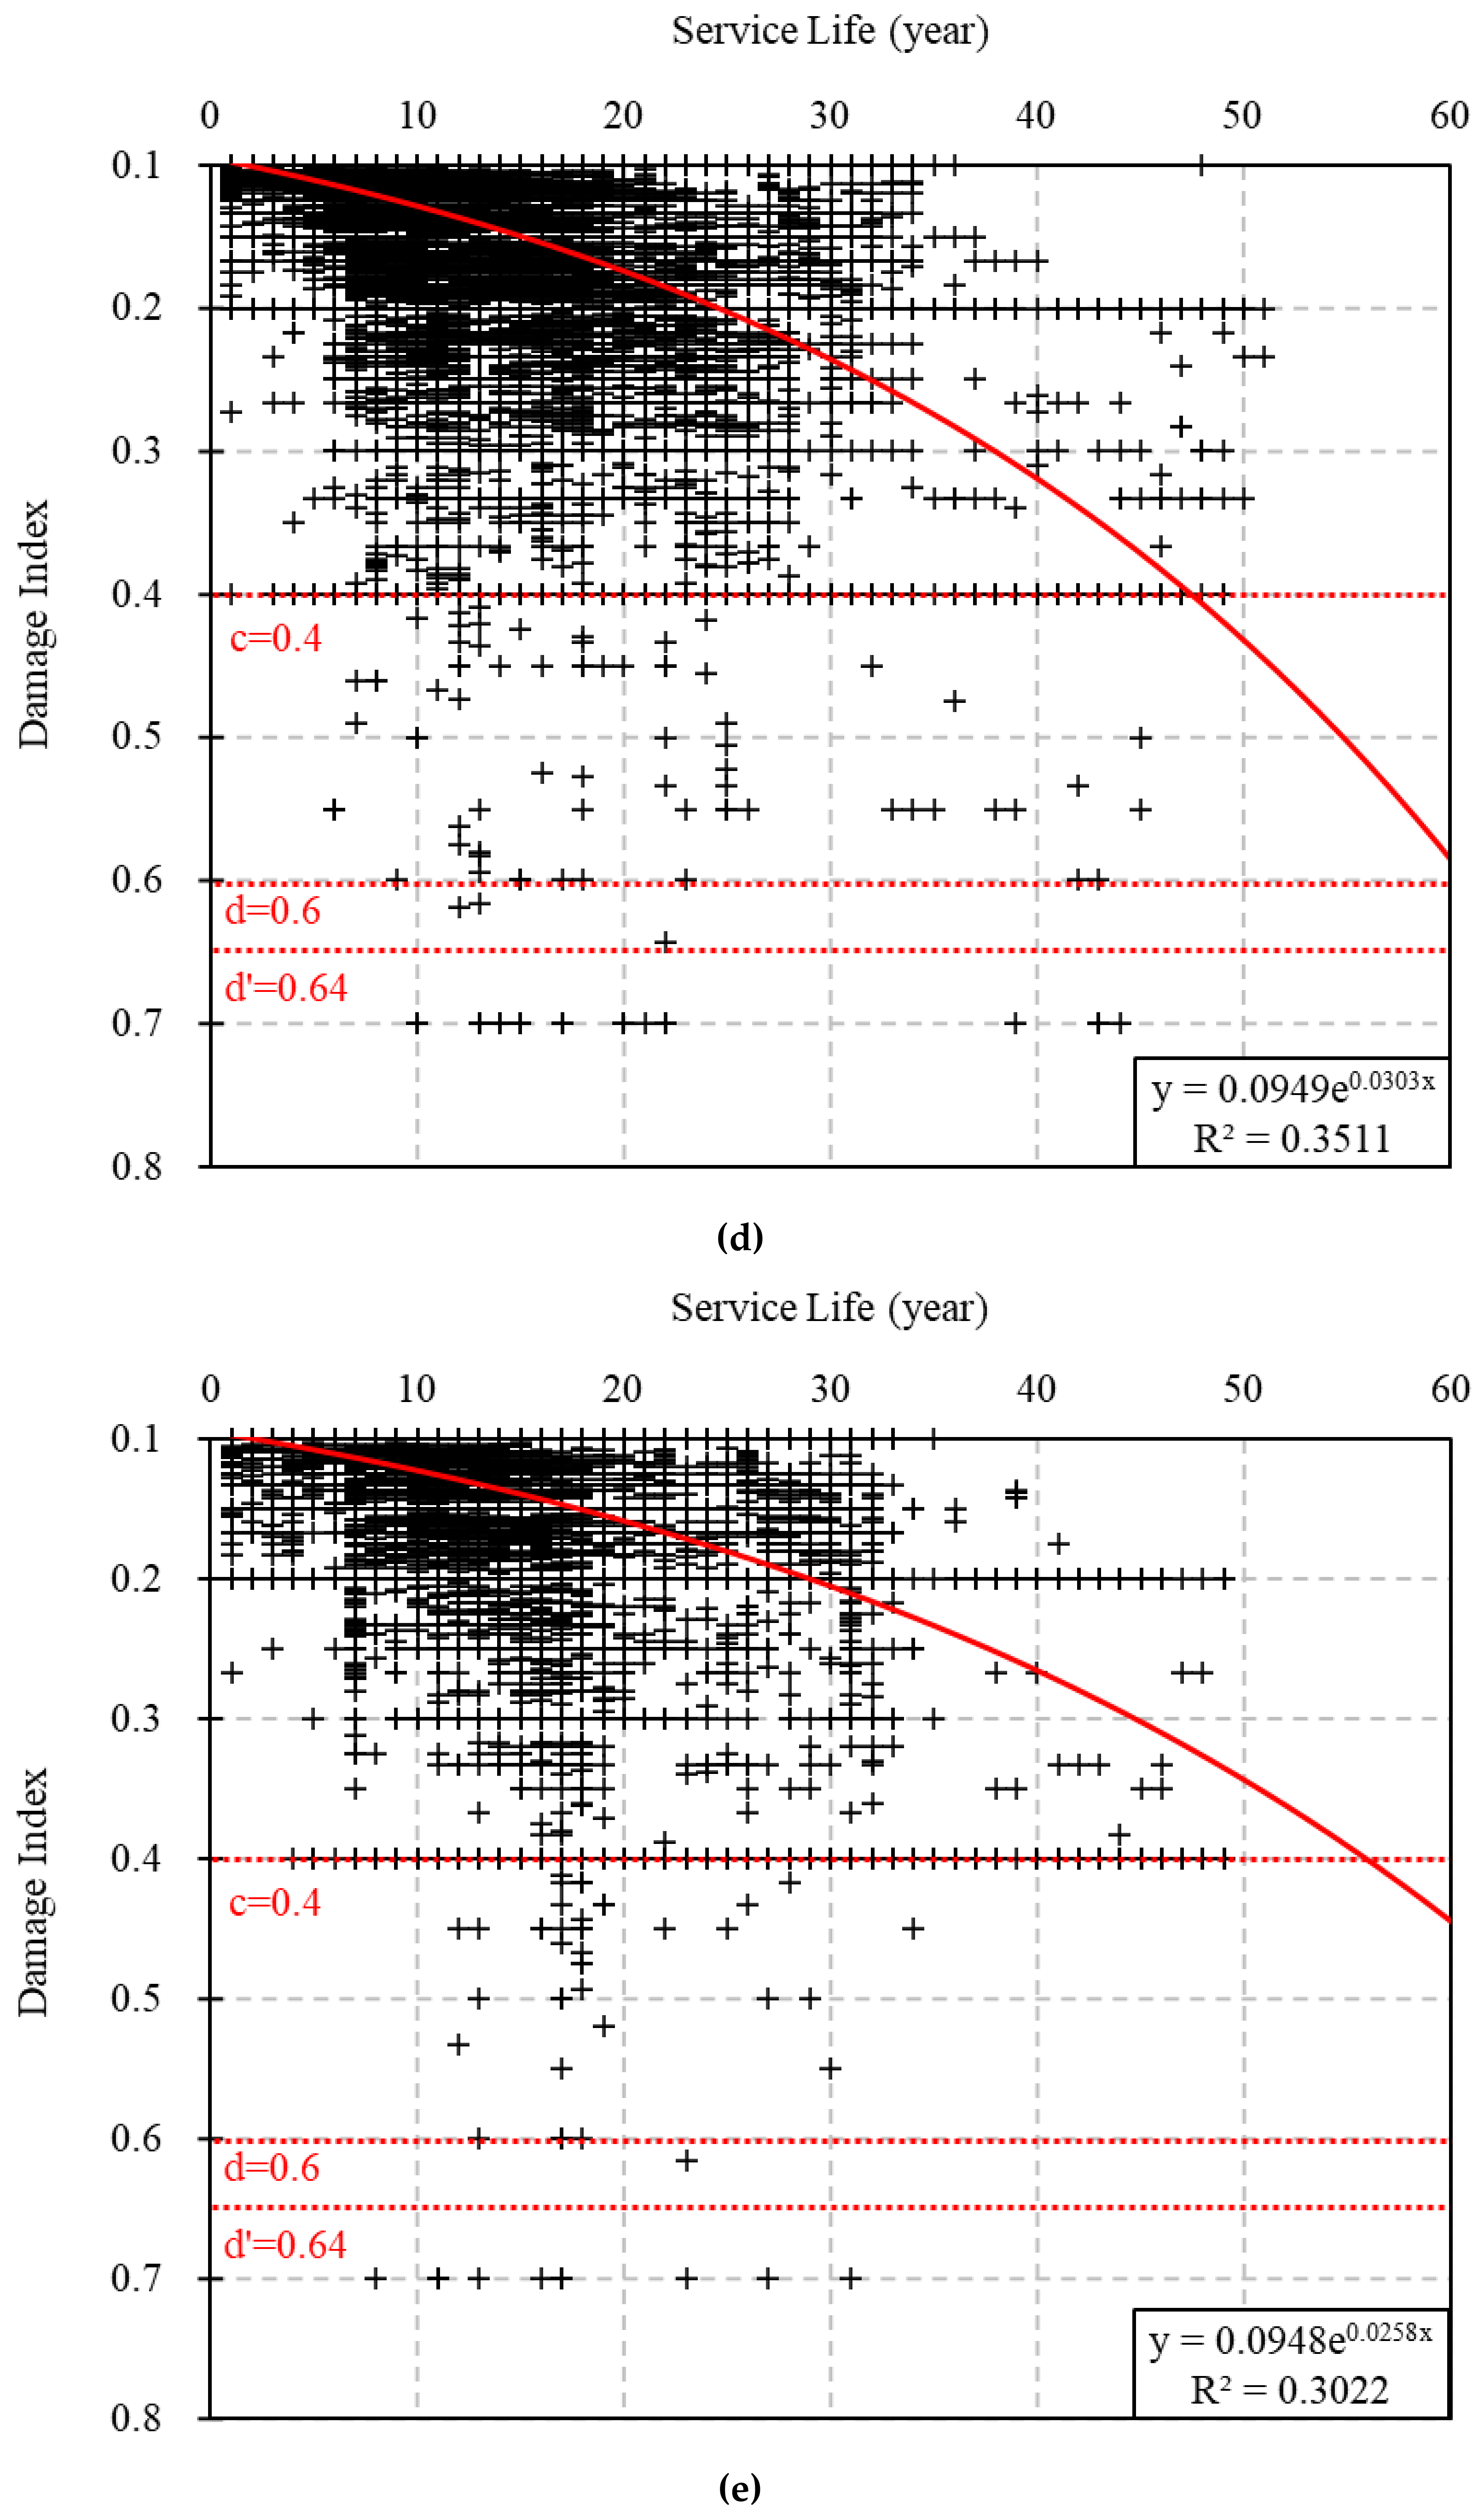
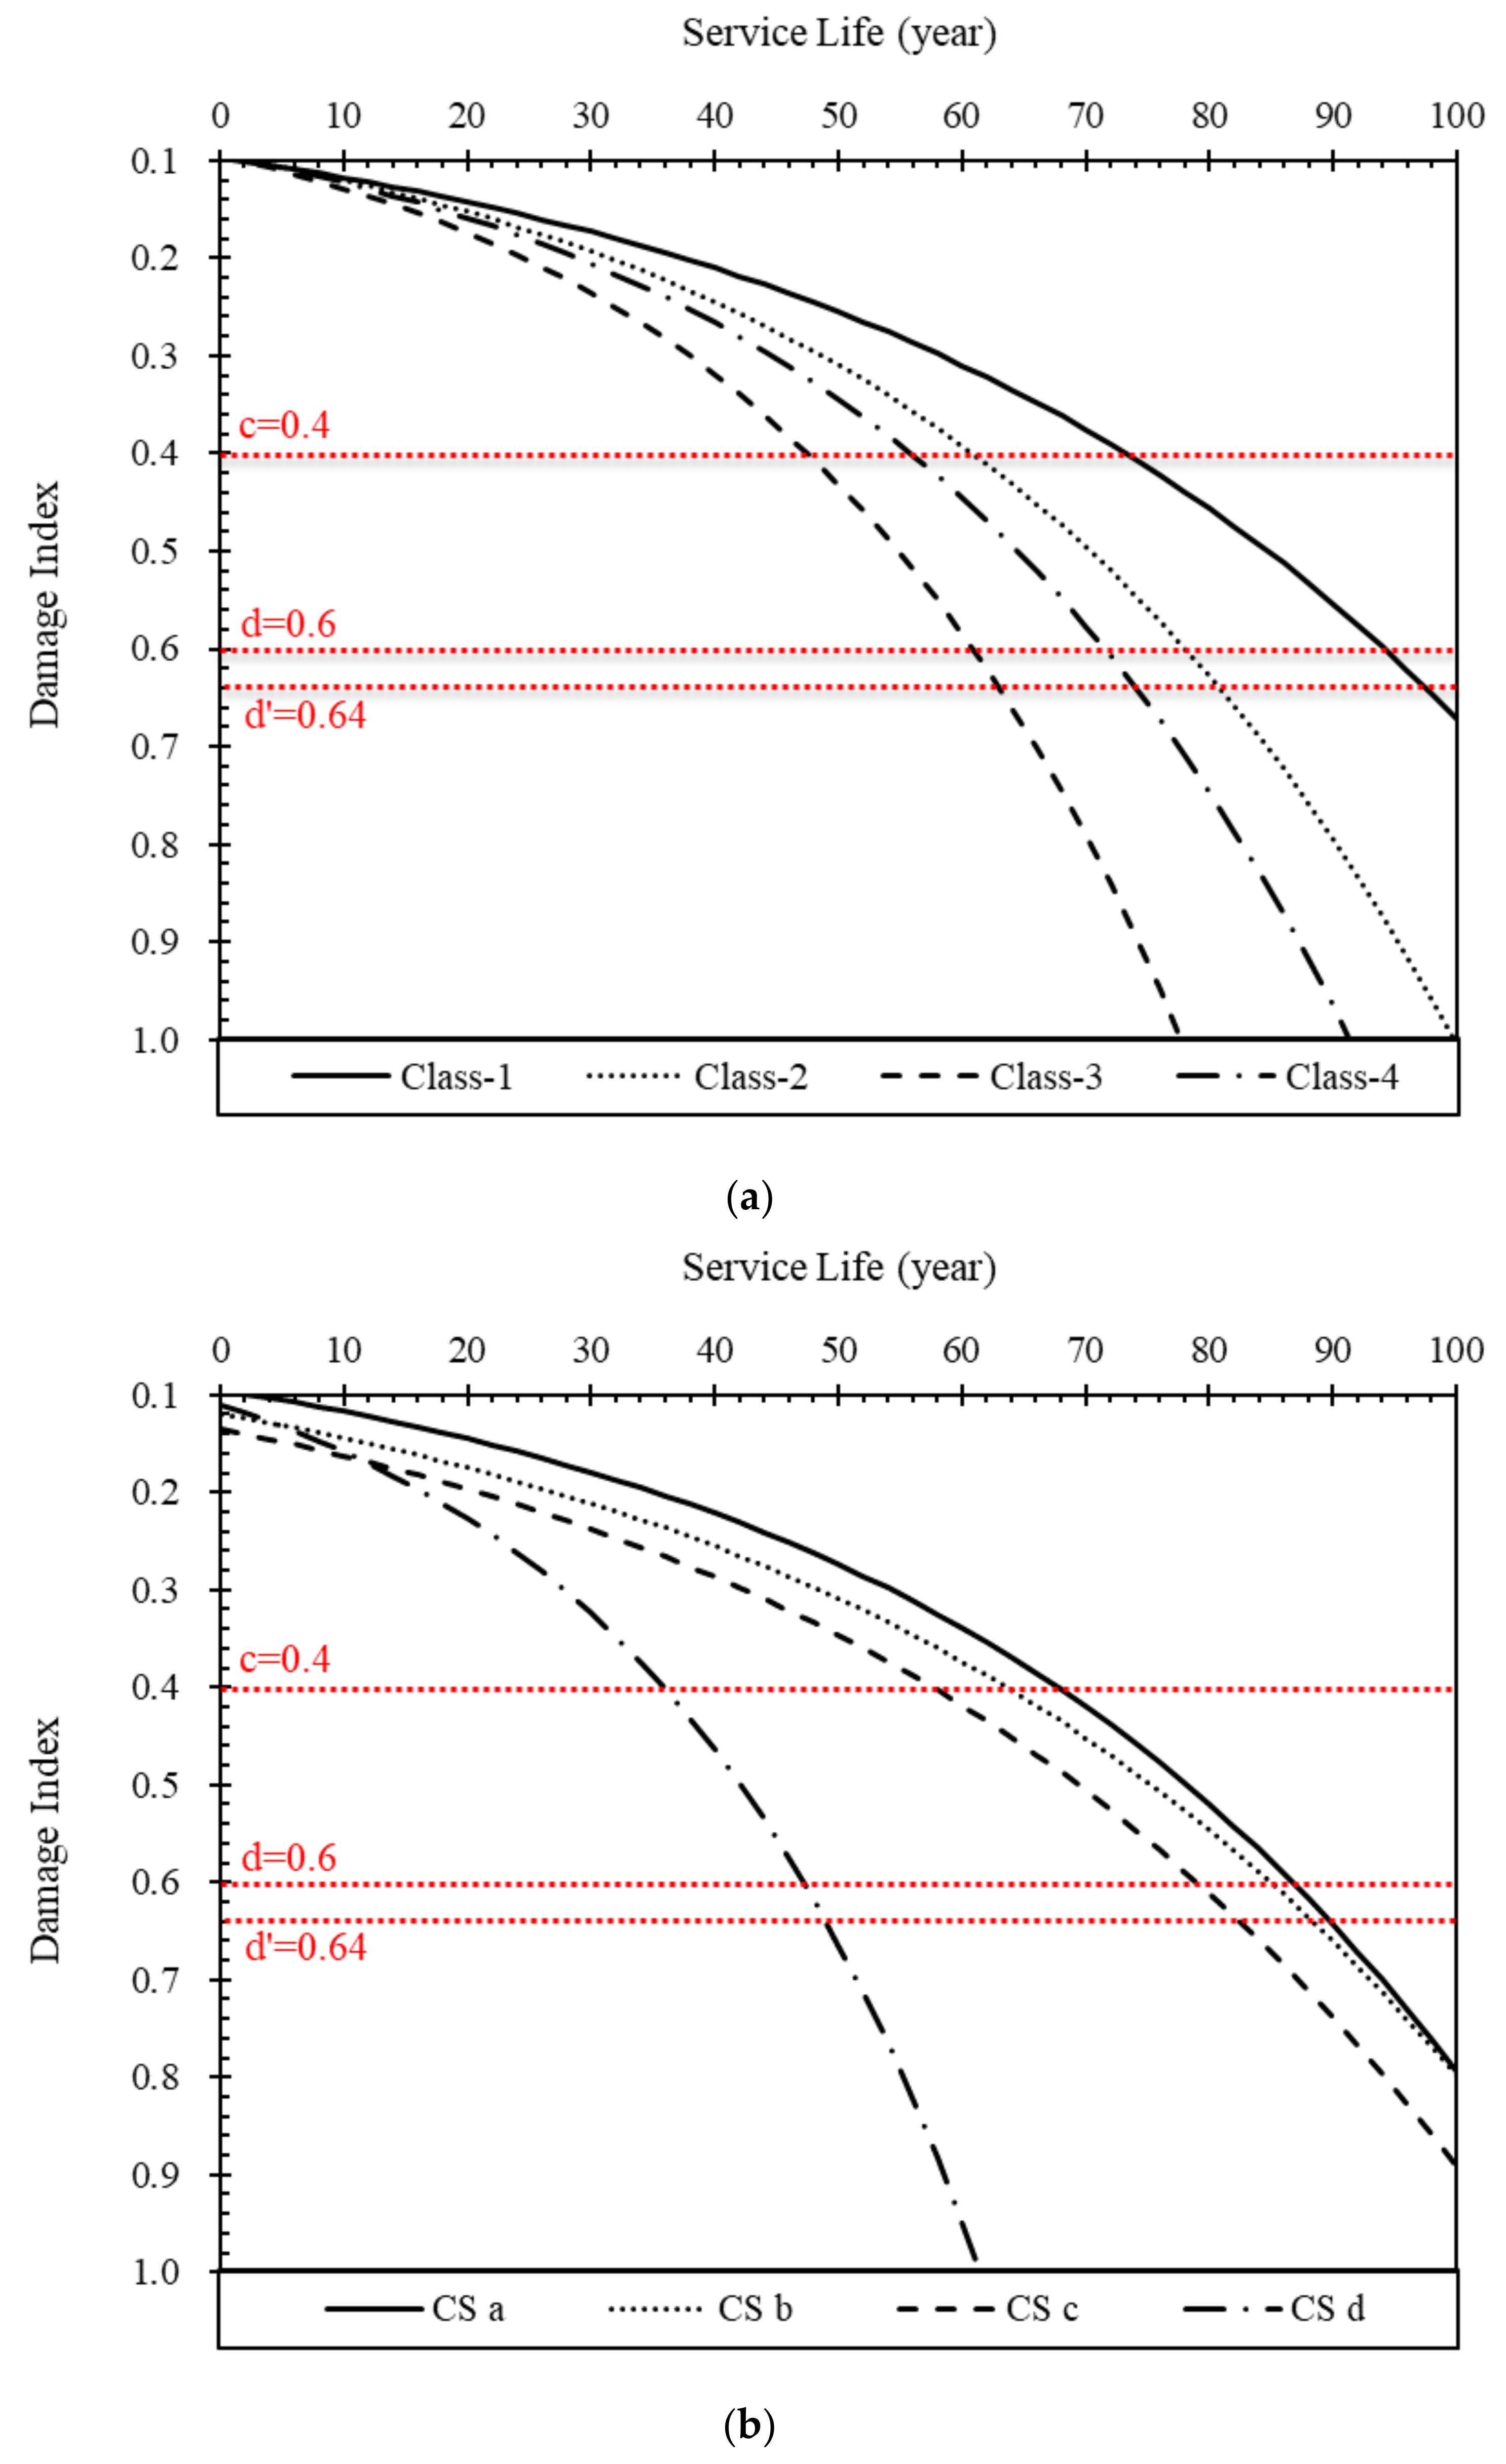
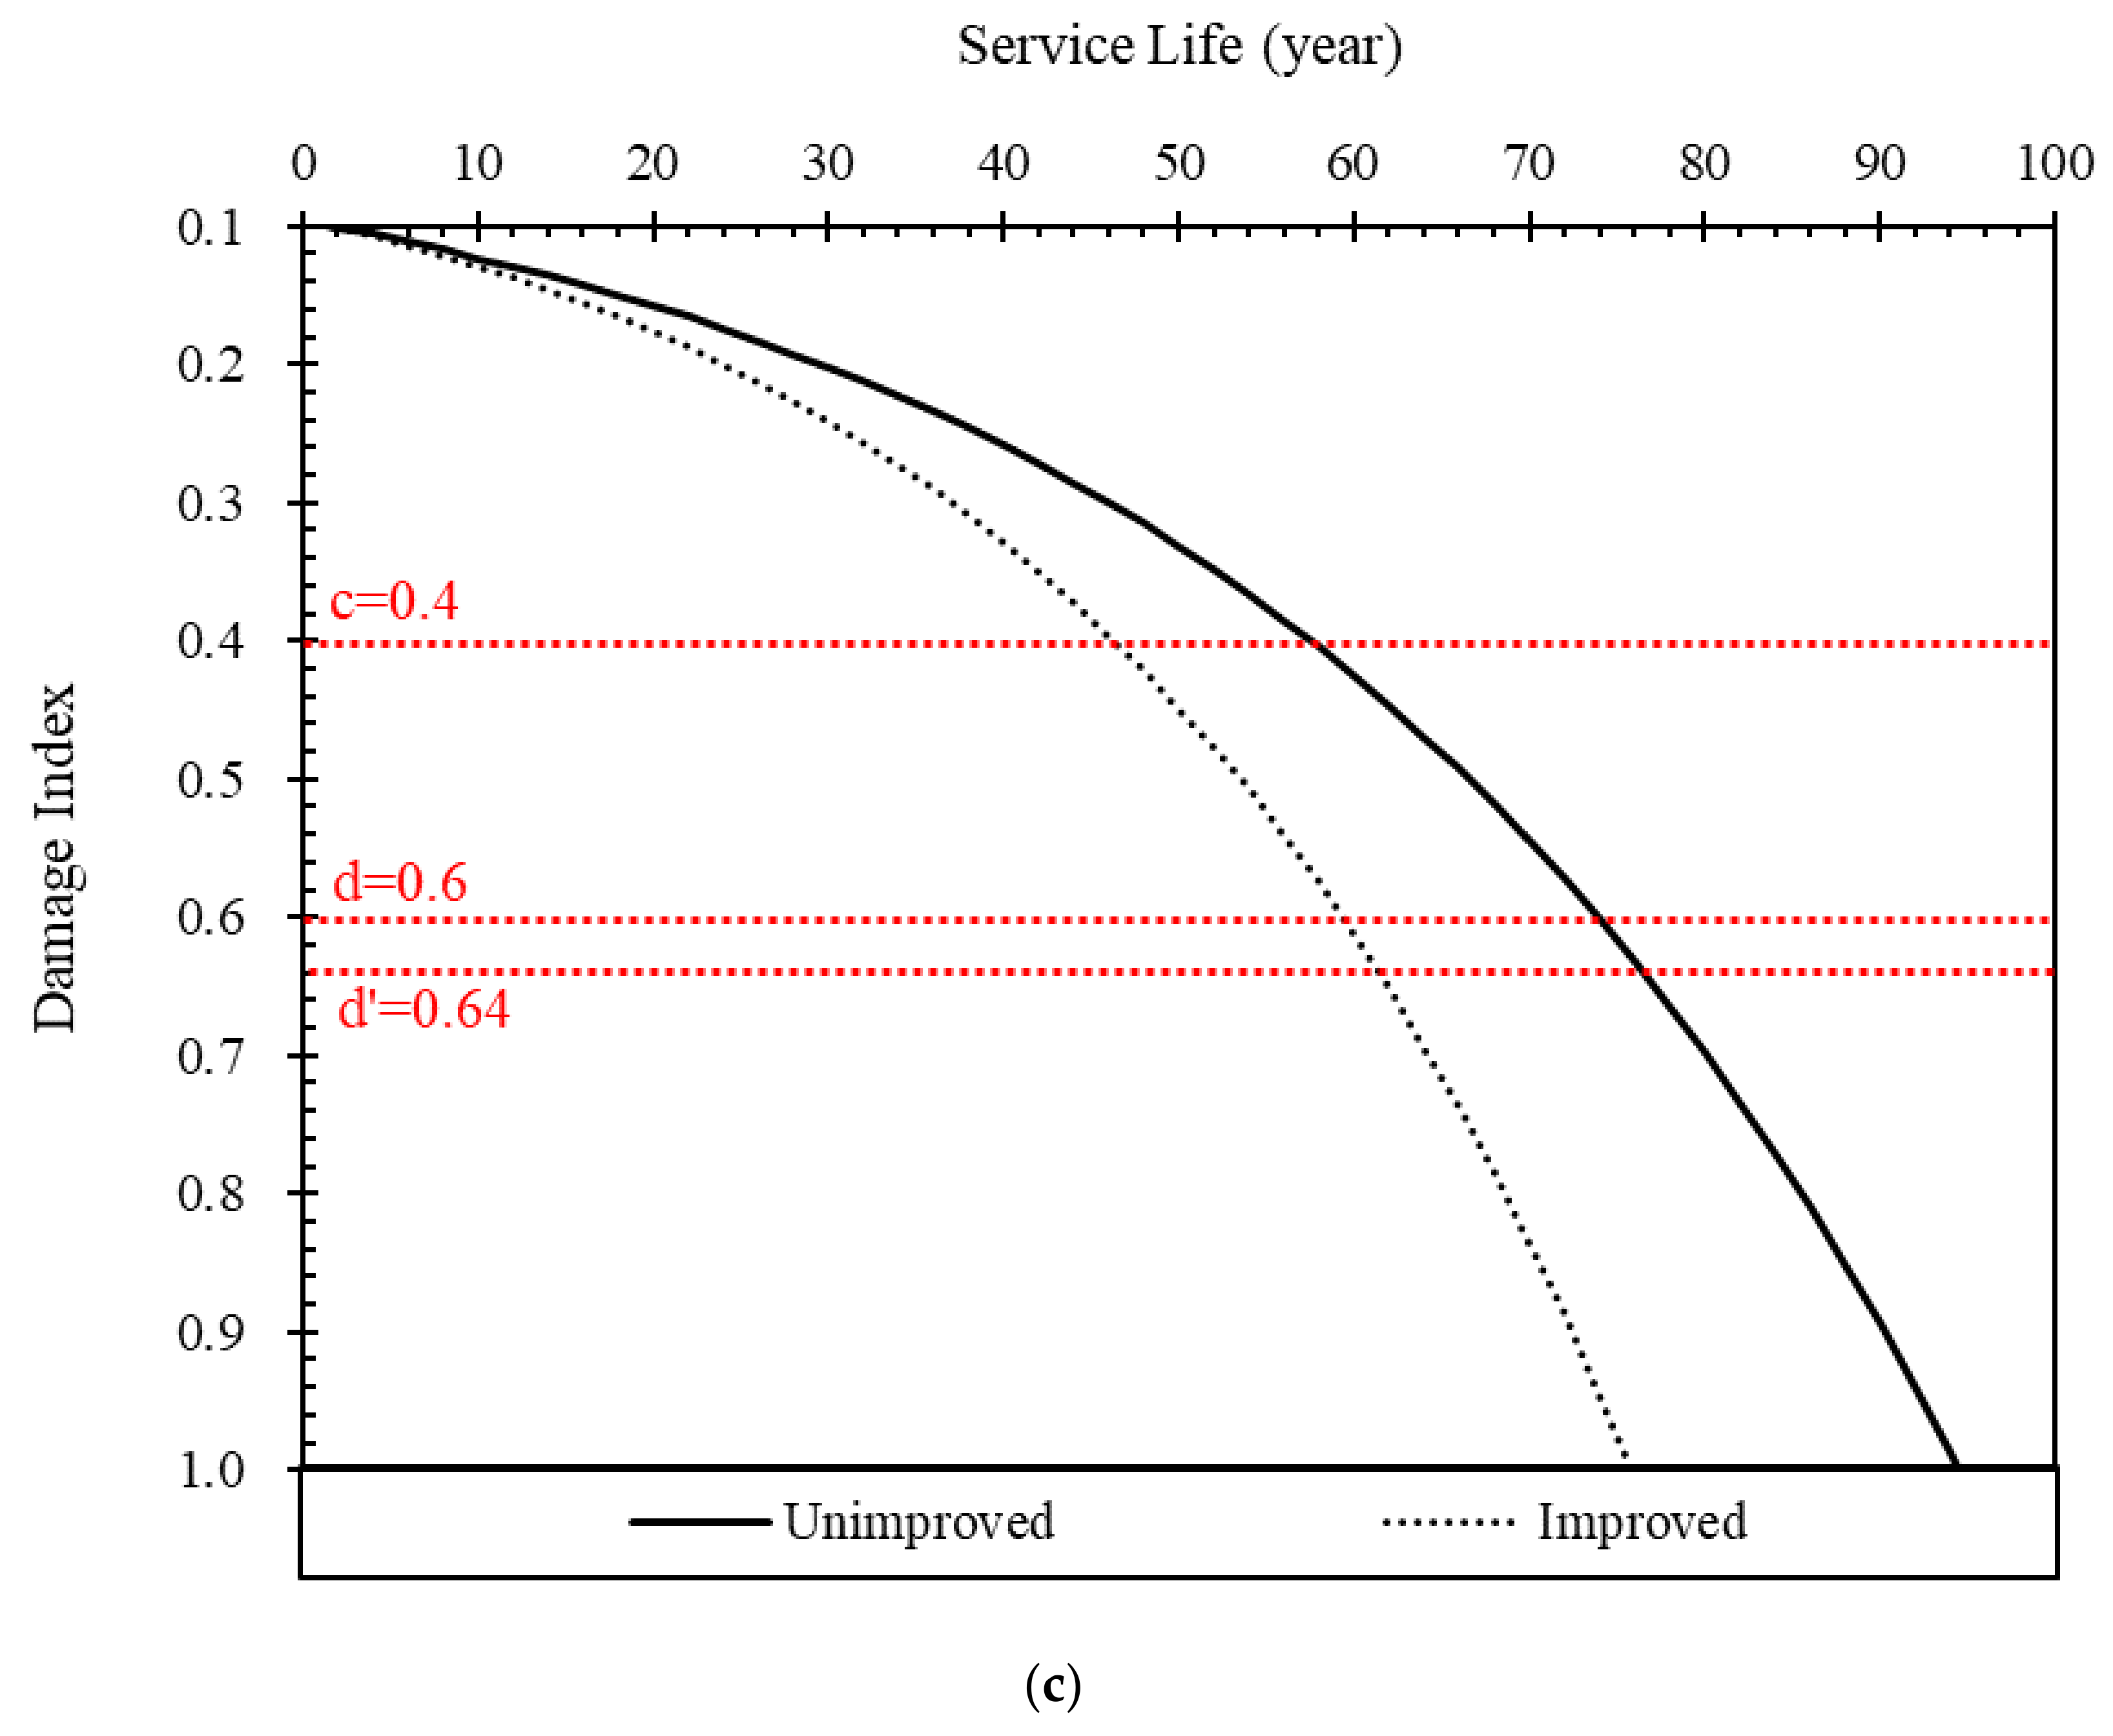
- Performance degradation curves were derived for 11 cases that considered the representative three deterioration factors, and the performance degradation of decks was examined for each deterioration factor. The differences in the remaining life according to the deicing agent exposure grade between Class 1 and 4, the pavement condition state between CS a and d, and the absence or existence of the bridge surface improvement status were 23, 41, and 16 years, respectively.
- (3)
- A new method for predicting the remaining life of bridge decks was proposed by considering certain deterioration conditions and the current age, based on more than 120,000 points of actual field data.
- (4)
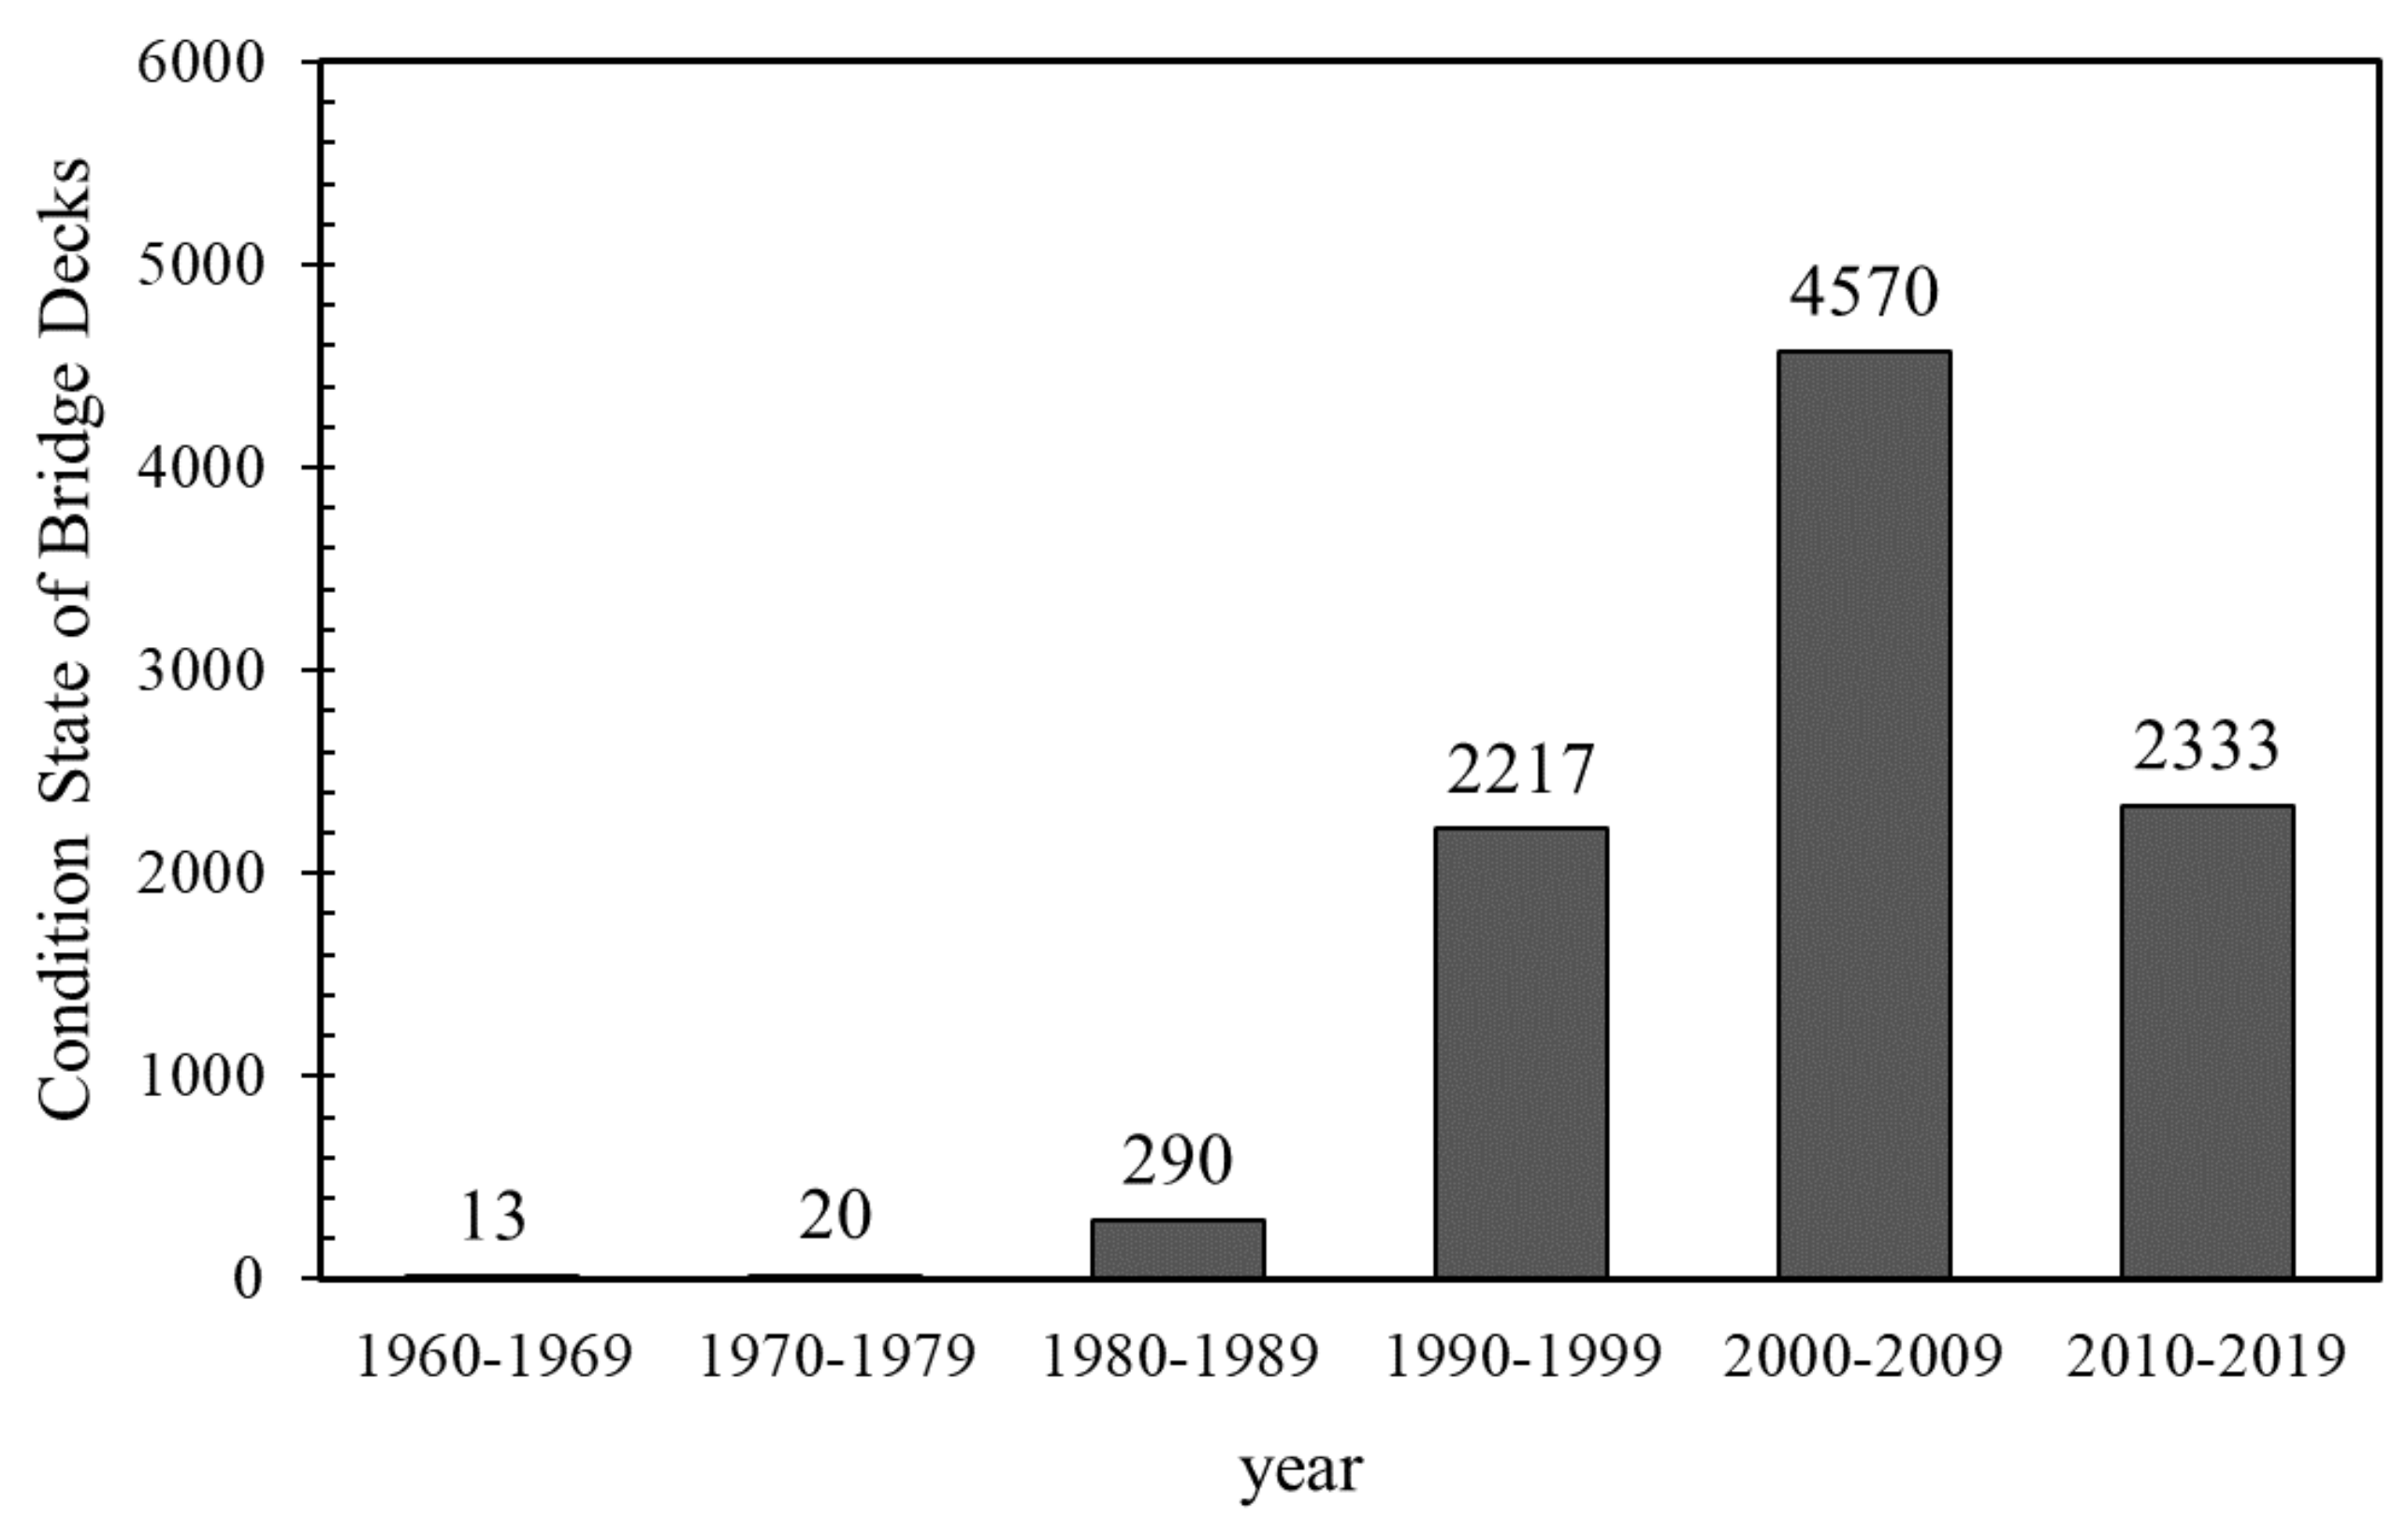
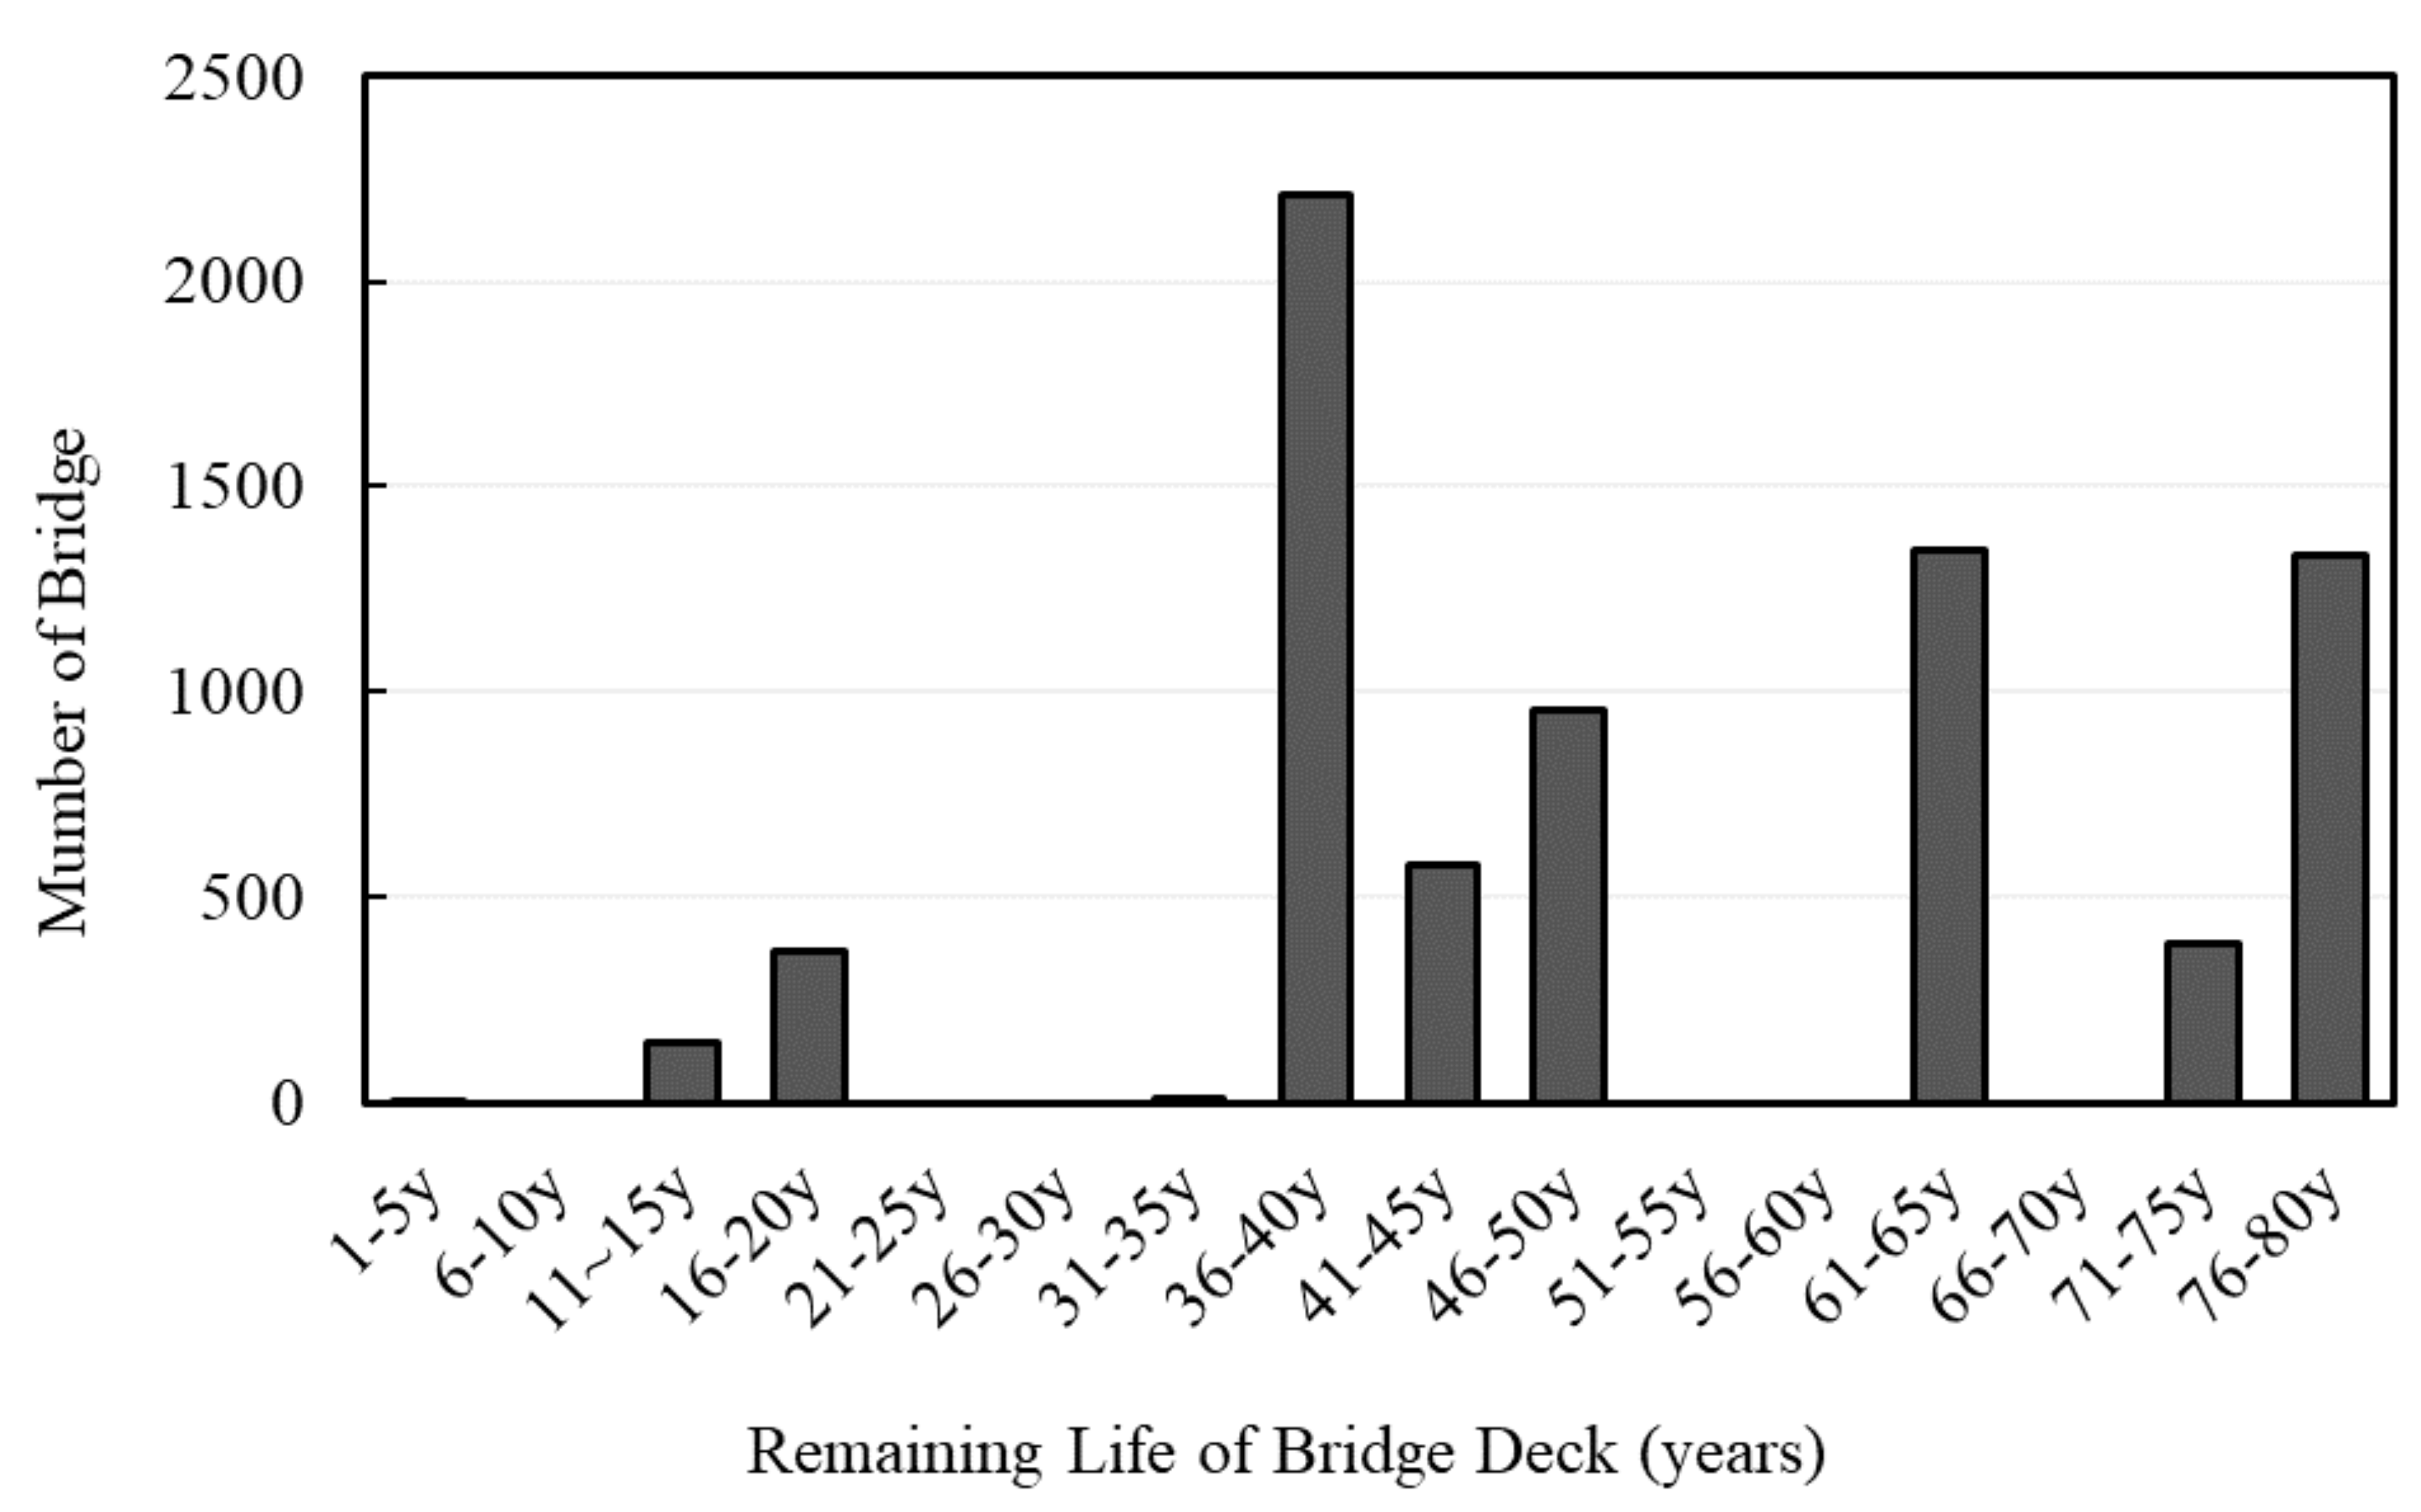
- A process to determine maintenance priorities using the current condition of highway bridges and the deterioration factors of individual bridges was proposed. The maintenance demand was predicted based on the end of deck life. The results indicated that the demand for deck replacement will sharply increase in 15 years, and that the decks of more than 2000 bridges will reach the end of their service lives in 40 years.
- (5)
- Structural characteristics of the decks make it challenging to perform maintenance at the proper time, thus preventing their efficient maintenance. The proposed process of prioritizing deck maintenance makes it possible to predict the demand for deck repair and reinforcement. By enabling maintenance personnel to derive maintenance priorities through the classification of various factors by route, region, and pavement type, the proposed process is expected to help increase the service life of decks and reduce maintenance costs.
- (6)
- By applying the prioritization process for bridge deck maintenance to the bridge deck, not only can the life of the bridge deck be extended, but also environmental pollution can be minimized. Additionally, an optimizing design for bridge decks by considering remaining life and deterioration factors can be possible. Therefore, this study expects that the sustainability of bridge decks can be accomplished.
- (7)
- In this study, an analysis was performed to extend the life of the deck, one structure member of the entire bridge. If this analysis method is applied to other structure members such as super-structure and sub-structure, the life of the entire bridge can also be extended. By securing the sustainability of the bridge, as well as the bridge deck, it will be possible to maximize the reduction in maintenance costs and environmental pollution.
- (8)
- Highway bridges in Korea were actively built in the 1990s and 2000s. As bridges built during this period have now aged for more than 30 years, safety accidents such as collapse are of concern. Improving these aging infrastructures in a sustainable manner can help to secure the safety of infrastructure users and improve the quality of life of the community.
Author Contributions
Funding
Acknowledgments
Conflicts of Interest
References
- Lee, I.K.; Kim, W.; Kang, H.T.; Seo, J.W. Analysis and Prediction of Highway Bridge Deck Slab Deterioration. J. Korea Inst. Struct. Maint. Insp. 2015, 19, 68–75. (In Korean) [Google Scholar]
- Ministry of Land, Infrastructure and Transport; Korea Infrastructure Safety and Technology Corporation. Detailed Guidelines for Safety and Maintenance of Facilities; Ministry of Land, Infrastructure and Transport: Sejong, Korea; Korea Infrastructure Safety and Technology Corporation: Jinju, Korea, 2019. (In Korean)
- Zhu, Z.; German, S.; Brilakis, I. Detection of large-scale concrete columns for automated bridge inspection. Autom. Constr. 2010, 19, 1047–1055. [Google Scholar] [CrossRef]
- Moore, W. Table 1-28: Condition of US Highway Bridges; National Transportation Statistics: Washington, DC, USA, 2011.
- Isgor, O.B.; Razaqpur, A. Finite element modeling of coupled heat transfer, moisture transport and carbonation processes in concrete structures. Cem. Concr. Compos. 2004, 26, 57–73. [Google Scholar] [CrossRef]
- Fujino, Y.; Siringoringo, D.M. Structural health monitoring of bridges in Japan: An overview of the current trend. In Proceedings of the Fourth International Conference on FRP Composites in Civil Engineering (CICE2008), Zurich, Switzerland, 22–24 July 2008. [Google Scholar]
- Koch, G.H.; Brongers, M.; Thompson, N.; Virmani, Y.; Payer, J. Corrosion Costs and Preventive Strategies in the United States; FHWA-RD-01-156 (Final Report); US Department of Transportation: Washington, DC, USA, 2002; 773p.
- Cusson, D.; Lounis, Z.; Daigle, L. Durability Monitoring for Improved Service Life Predictions of Concrete Bridge Decks in Corrosive Environments. Comput. Civ. Infrastruct. Eng. 2011, 26, 524–541. [Google Scholar] [CrossRef]
- Ishikawa, Y. A Study on The Durability Enhancement of the Japan’s Expressway Existed Bridges Dmaged by De-Icing Salt. Ph.D. Thesis, Nagaoka University of Technology, Nagaoka, Japan, 2013. (In Japanese). [Google Scholar]
- Korea Expressway Corporation. A Study on Establishment of Maintenance Strategy to Extend the Service Life of Bridge Deck Slab; Korea Expressway Corporation: Hawsung, Korea, 2019. (In Korean) [Google Scholar]
- American Concrete Institute; International Concrete Repair Institute. Concrete Repair Manual, 3rd ed.; American Concrete Institute: Farmington Hills, MI, USA; International Concrete Repair Institute: St Paul, MN, USA, 2008; Volume 1, pp. 207–338. ISBN 13-978-0-87031-262-5. [Google Scholar]
- Korea Expressway Corporation. Improvement of Condition Evaluation Method and Preservation Criterion for Bridge Deck and Overlay; Korea Expressway Corporation: Hawsung, Korea, 2014. (In Korean) [Google Scholar]
- Sun, H.; Pashoutani, S.; Zhu, J. Nondestructive Evaluation of Concrete Bridge Decks with Automated Acoustic Scanning System and Ground Penetrating Radar. Sensors 2018, 18, 1955. [Google Scholar] [CrossRef] [PubMed]
- Khalim, A.; Sagar, D.; Kumruzzaman, M.; Hasan, A. Combination of nondestructive evaluations for reliable assessment of bridge deck. Facta Univ. Ser. Arch. Civ. Eng. 2011, 9, 11–22. [Google Scholar] [CrossRef]
- Korea Expressway Corporation. A Study on Steel Reinforcement for Concrete Bridge Decks; Korea Expressway Corporation: Hawsung, Korea, 2010. [Google Scholar]
- Kim, J.K.; Jang, I.Y. Proposal of Domestic Road Bridge Deck Deterioration Models and Forecast of Replacement Demand. J. Korea Inst. Struct. Maint. Insp. 2017, 21, 61–68. (In Korean) [Google Scholar]
- Chyad, A.M.; Abudayyeh, O. Deterioration Prediction Modelling and Inspection Schedule Estimation for Concrete Bridge Decks. J. Civ. Eng. Constr. 2020, 9, 63–73. (In Korean) [Google Scholar] [CrossRef]
- Shi, X.; Li, Y.; Jungwirth, S.; Fang, Y.; Seeley, N.; Jackson, E. Identification and Laboratory Assessment if Best Practices to Protect DOT Equipment from the Corrosive Effect of Chemical Deicers; ODOT Technical Report; Oregon Department of Transportation: Salem, OR, USA, 2013.
- Huang, J.; Shaowei, W.; Chaudhari, J.; Soltesz, S.; Shi, X. Deicer Effect on Concrete Bridge Decks: Practitioners Perspective and a Method of Developing Exposure Maps. In Proceedings of the Transportation Research Board Annual Meeting, Washington, DC, USA, 13–17 January 2013. [Google Scholar]
- Ellingwood, B.R. Risk-informed condition assessment of civil infrastructure: State of practice and research issues. Struct. Infrastruct. Eng. 2005, 1, 7–18. [Google Scholar] [CrossRef]
- Darbani, B.M.; Hammad, A. Critical review of new directions in bridge management systems. In Proceedings of the ASCE International Workshop on Computing in Civil Engineering, Pittsburgh, PA, USA, 24–27 July 2007; Soibelman, L., Akinci, B., Eds.; ASCE: Reston, VA, USA, 2007; pp. 330–337. [Google Scholar]
- Frangopol, D.M.; Strauss, A.; Kim, S. Bridge reliability assessment based on monitoring. J. Bridge Eng. 2008, 13, 258–270. [Google Scholar] [CrossRef]
- Liu, M.; Frangopol, D.M.; Kim, S. Bridge system performance assessment from structural health monitoring: A case study. J. Struct. Eng. 2009, 135, 733–742. [Google Scholar] [CrossRef]
- Moon, F.L.; Laning, J.; Lowdermilk, D.S.; Chase, S.; Hooks, J.; Aktan, A.E. A pragmatic risk-based approach to prioritizing bridges. In Proceedings of the SPIE—Nondestructive Characterization for Composite Materials, Aerospace Engineering, Civil Infrastructure, and Homeland Security, San Diego, CA, USA, 9–11 March 2009; Wu, H.F., Diaz, A.A., Shull, P.J., Vogel, D.W., Eds.; SPIE: Bellingham, WA, USA, 2009; Volume 7294. [Google Scholar]
- Public Works Research Institute. Investigation on Life Cycle Cost of Concrete Bridges-Deterioration and Maintenance Cost of Concrete Bridge; Technical Memorandum of PWRI No. 3811; Public Works Research Institute: Tsukuba, Japan, 2001. (In Japanese)
- Fathalla, E.; Tanaka, Y.; Maekawa, K.; Sakurai, A. Quantitative Deterioration Assessment of Road Bridge Decks Based on Site Inspected Cracks. Appl. Sci. 2018, 8, 1197. [Google Scholar] [CrossRef]
- Matsui, S. Fatigue strength of reinforced concrete slabs of highway bridges by wheel running machine and influence of water on fatigue. Proc. JCI. 1987, 9, 627–632. (In Japanese) [Google Scholar]
- Korea Expressway Corporation. A Study on the Durability Design and Assessment of Concrete Structures by Chloride Attack under De-Icing Salt Environments; Korea Expressway Corporation: Hawsung, Korea, 2014. (In Korean) [Google Scholar]
- Rhee, J.; Kim, H.S.; Ock, C.; Choi, J. An investigation of the deterioration characteristics of concrete bridge decks with asphalt concrete in Korea. KSCE J. Civ. Eng. 2018, 22, 613–621. [Google Scholar] [CrossRef]
- Tanaka, Y.; Murakoshi, J.; Nagaya, Y. Fatigue and Corrosion in Concrete Decks with Asphalt Surfacing. In Proceedings of the 25th U.S.—JAPAN Bridge Engineering Workshop, Tsukuba, Japan, 22–23 October 2009; pp. 219–232. [Google Scholar]
- NCHRP 713. Estimating Life Expectancies of Highway Assets, Volume 1: Guidebook; The National Academies Press: Washington, DC, USA, 2012. [Google Scholar]
- Srikanth, I.; Arockiasamy, M. Deterioration models for prediction of remaining useful life of timber and concrete bridges: A review. J. Traffic Transp. Eng. 2020, 7, 152–173. [Google Scholar] [CrossRef]
- Valentine, S. Expected Service Life of Michigan Department of Transportation Reinforced Concrete Bridge Decks; University of Michigan: Ann Arbor, MI, USA, 2015. [Google Scholar]
- Hearn, G.; Xi, Y. Service Life and Cost Comparisons for Four Types of CDOT Bridge Decks; Report No. CDOT-2007-2; Colorado Department of Transportation Research Branch: Denver, CO, USA, 2007.
- Korea Expressway Corporation. Bridge Maintenance Strategies for Service Life 100 Years; Korea Expressway Corporation: Hawsung, Korea, 2015. (In Korean) [Google Scholar]
- Korkmaz, K.A.; Syal, M.; Harichandran, R.S.; Korkmaz, S. Implementation of Sustainability in Bridge Design, Construction and Maintenance; Report No. RC-1586; Michigan State University: East Lansing, MI, USA, 2012. [Google Scholar]
- Connal, J. Sustainable Bridges-300 Year Design Life for Second Gateway Bridge. In Proceedings of the 7th Austroads Bridge Conference Bridges Linking Communities, Auckland, New Zealand, 26–29 May 2009; 16p. [Google Scholar]


| Condition State | Description | Damage Index | Damage Range |
|---|---|---|---|
| A | Excellent condition | 0.1 | 0 ≤ X < 0.13 |
| B | Minor problems in secondary members Needs repair works to increase durability | 0.2 | 0.13 ≤ X < 0.26 |
| C | Minor problems in primary members and extensive problems in secondary members Needs repair works to improve performance. | 0.4 | 0.26 ≤ X < 0.49 |
| D | Extensive problems in primary members Needs reinforcement works to ensure structural safety Road closure considered | 0.7 | 0.49 ≤ X < 0.79 |
| E | Critical or failure condition. Close the bridge Needs reinforcement or rebuilding | 1.0 | 0.79 ≤ X |
| ExposureGrade | Snowfall(mm) | Target Regions [Metropolitan Cities and Provinces (Cities and Counties)] |
|---|---|---|
| Class-1 | <150 | Busan, Daegu, Ulsan, Jeonnam (Gwangyang, Yeosu, Namhae, Goheung, and Wando) Gyeongbuk (Yeongdeok, Cheongsong, Pohang, Yeongcheon, Gyeongsan, Cheongdo, Chilgok, Goryeong, and Gyeongju) Gyongnam (Changnyeong, Milyang, Euyryeong, Yangsan, Haman, Jinju, Changwon, Gimhae, Hadong, Sacheon, Goseong, Geoje, Tongyeong, Jinhae, and Masan) |
| Class-2 | 150– 300 | Incheon, Gyeonggi (Gimpo, Bucheon, Siheung, and Ganghwa), Gyeongbuk (Yeongju, Uljin, Yecheon, Andong, Yeongyang, Euyseong, Gumi, Gunwi, and Seongju) Gyeongnam (Hancheon and Sancheong), Jeonnam (Suncheon, Boseong, Jangheung, Gangjin, Haenam, and Jindo) |
| Class-3 | 300– 600 | Seoul, Daejeon, Gyeonggi (all regions except Gimpo, Bucheon, and Siheung), Gangwon (Cheolwon, Hwacheon, Yanggu, Inje, Chuncheon, Hoengseong, Wonju, Yeongwol, and Donghae), All regions in Chungnam and Chungbuk, Gyeongbuk (Bonghwa, Mungyeong, Sangju, and Kimcheon), Gyeongnam (Geochang and Hanyang) Jeonbuk (Gunsan, Iksan, Wanju, Jeonju, Jinan, Muju, and Namwon), Jeonnam (Hampyeong, Muan, Mokpo, Yeongam, Naju, Hwasun, Gokseong, Gurye, and sinan) |
| Class-4 | >600 | Gwangju, Jeonnam (Yeonggwang, Jangseong, and Damyang), Jeonbuk (Gimje, Buan, Jeongeup, Imsil, Jangsu, Gochang, and Sunchang), Gangwon (Goseong, Sokcho, Yangyang, Gangneung, Pyeongchang, Hongcheon, Jeongseon, Samcheok, and Taebaek) |
| Deterioration Factors | Analysis Cases | Case NO. |
|---|---|---|
| All Data | All | 1 |
| Deicing agent exposure grade | Class-1 | 2 |
| Class-2 | 3 | |
| Class-3 | 4 | |
| Class-4 | 5 | |
| Pavement condition state (CS) | CS a | 6 |
| CS b | 7 | |
| CS c | 8 | |
| CS d | 9 | |
| Surface improvement status | Unimproved | 10 |
| Improved | 11 |
| Exposure Grade | Class-1 | Class-2 | Class-3 | Class-4 |
|---|---|---|---|---|
| c (DI = 0.4) | 73 | 61 | 48 | 56 |
| d (DI = 0.6) | 94 | 78 | 61 | 72 |
| d′ (DI = 0.64) | 97 | 81 | 63 | 74 |
| Pavement Condition State | a | b | c | d |
|---|---|---|---|---|
| c (DI = 0.4) | 68 | 64 | 58 | 36 |
| d (DI = 0.6) | 87 | 85 | 79 | 47 |
| d′ (DI = 0.64) | 90 | 88 | 82 | 49 |
| Surface Improvement Status | unimproved | Improved |
|---|---|---|
| c (DI = 0.4) | 58 | 46 |
| d (DI = 0.6) | 74 | 59 |
| d′ (DI = 0.64) | 77 | 61 |
| All | a→End | b→End | c→End | d→End |
|---|---|---|---|---|
| Class-1 | 97 | 60 | 24 | 3 |
| Class-2 | 81 | 50 | 20 | 3 |
| Class-3 | 63 | 38 | 15 | 2 |
| Class-4 | 74 | 45 | 18 | 2 |
| Pavement CS a | 90 | 55 | 22 | 3 |
| Pavement CS b | 88 | 61 | 24 | 3 |
| Pavement CS c | 82 | 61 | 24 | 3 |
| Pavement CS d | 49 | 32 | 13 | 2 |
| Unimproved | 77 | 47 | 19 | 3 |
| Improved | 61 | 37 | 15 | 2 |
| Parameters | Deicing Agent Exposure Grade | Pavement Condition State | Improvement Status | |||||||
|---|---|---|---|---|---|---|---|---|---|---|
| Class-1 | Class-2 | Class-3 | Class-4 | CS a | CS b | CS c | CS d | Unimproved | Improved | |
| a | 0.0967 | 0.0951 | 0.0949 | 0.0948 | 0.0945 | 0.1195 | 0.1347 | 0.1107 | 0.0959 | 0.0947 |
| b | 0.0194 | 0.0236 | 0.0303 | 0.0258 | 0.0213 | 0.019 | 0.0189 | 0.0358 | 0.0248 | 0.0311 |
| Basic Info. | Remaining Life According to Deterioration Factors from Table 7 (Year) | Final Remaining Life (Year) | ||||||||
|---|---|---|---|---|---|---|---|---|---|---|
| Bridge Name | Completion Year | Service Period | Deck Condition State | Deicing Agent Exposure Grade | Pavement Condition State | Improvement Status | Deicing Agent Exposure Grade | Pavement Condition State | Improvement Status | |
| Sinyong Bridge | 1973 | 37 | c | Class-4 | b | none | 18 | 24 | 19 | 18 |
Publisher’s Note: MDPI stays neutral with regard to jurisdictional claims in published maps and institutional affiliations. |
© 2020 by the authors. Licensee MDPI, Basel, Switzerland. This article is an open access article distributed under the terms and conditions of the Creative Commons Attribution (CC BY) license (http://creativecommons.org/licenses/by/4.0/).
Share and Cite
Kim, K.H.; Nam, M.S.; Hwang, H.H.; Ann, K.Y. Prediction of Remaining Life for Bridge Decks Considering Deterioration Factors and Propose of Prioritization Process for Bridge Deck Maintenance. Sustainability 2020, 12, 10625. https://doi.org/10.3390/su122410625
Kim KH, Nam MS, Hwang HH, Ann KY. Prediction of Remaining Life for Bridge Decks Considering Deterioration Factors and Propose of Prioritization Process for Bridge Deck Maintenance. Sustainability. 2020; 12(24):10625. https://doi.org/10.3390/su122410625
Chicago/Turabian StyleKim, Ki Hwan, Moon S. Nam, Hoon Hee Hwang, and Ki Yong Ann. 2020. "Prediction of Remaining Life for Bridge Decks Considering Deterioration Factors and Propose of Prioritization Process for Bridge Deck Maintenance" Sustainability 12, no. 24: 10625. https://doi.org/10.3390/su122410625
APA StyleKim, K. H., Nam, M. S., Hwang, H. H., & Ann, K. Y. (2020). Prediction of Remaining Life for Bridge Decks Considering Deterioration Factors and Propose of Prioritization Process for Bridge Deck Maintenance. Sustainability, 12(24), 10625. https://doi.org/10.3390/su122410625