Review and Development of a Land Consumption Evaluation Method Based on the Time-Area Concept of Last Mile Delivery Using Real Delivery Trip Data
Abstract
1. Introduction
2. Literature
2.1. Discrete Formulation
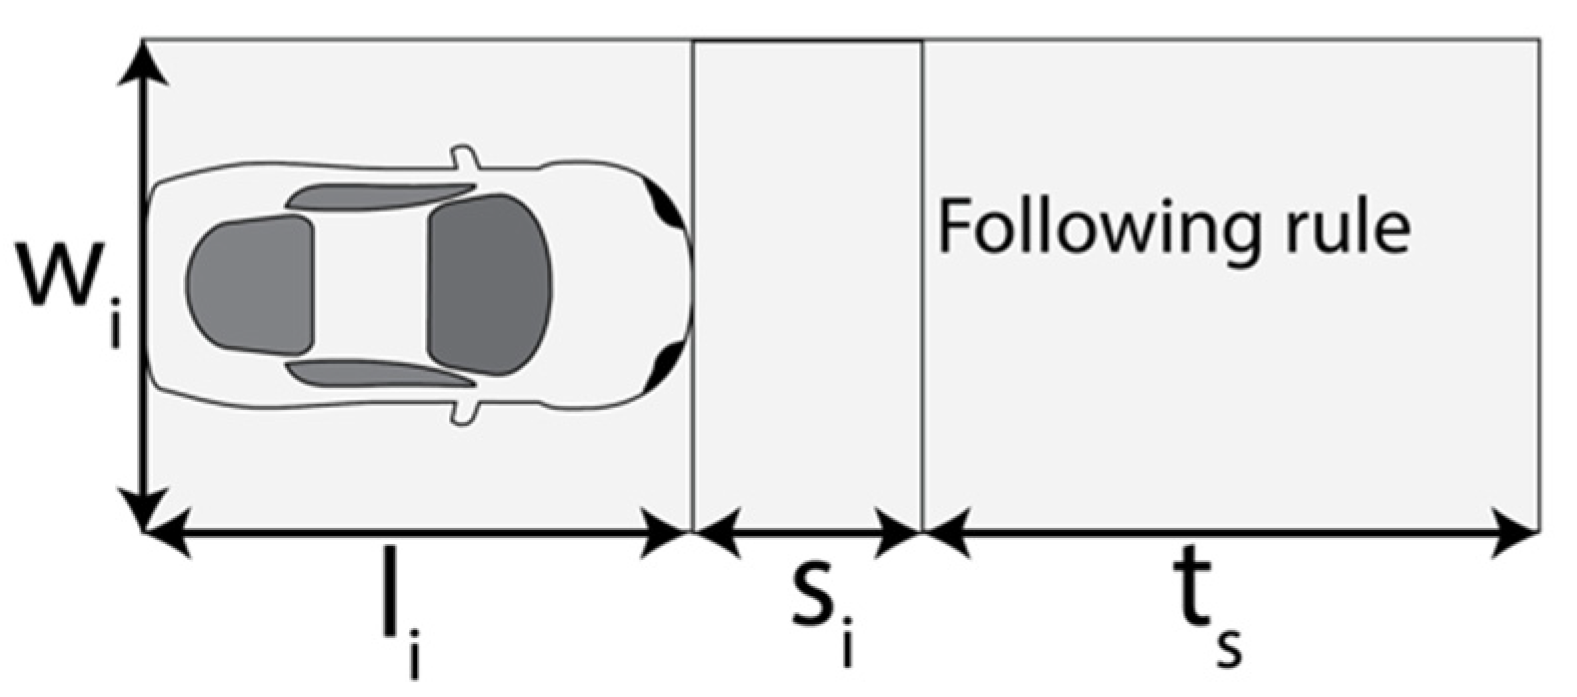
- Time-area requirements for vehicle i;
- Time-area requirements for vehicle i when entering the area;
- Time-area requirements for vehicle i when being within the area;
- Time-area requirements for vehicle i when leaving the area;
- Width of the vehicle;
- Module length (front safety buffer plus vehicle length) when vehicle is entering the area;
- Module length (front safety buffer plus vehicle length) when vehicle is within the area;
- Module length (front safety buffer plus vehicle length) when vehicle is leaving the area;
- Timepoint when vehicle is fully in the area;
- Timepoint when vehicle starts to leave the area;
- Timepoint when vehicle has left the area.
- Module length (front safety buffer plus vehicle length) when vehicle is within the area;
- Safety buffer in front of vehicle;
- Vehicle length.
- Time-area requirements for vehicle i when being within the area;
- Width of the vehicle;
- Safety buffer in front of vehicle;
- Vehicle length;
- Timepoint when vehicle is fully in the area;
- Timepoint when vehicle is within the area.
- Module length;
- Width of the right-of-way;
- Length of the vehicle and shadow;
- Length of the vehicle;
- Factor for unit consistency;
- Velocity.
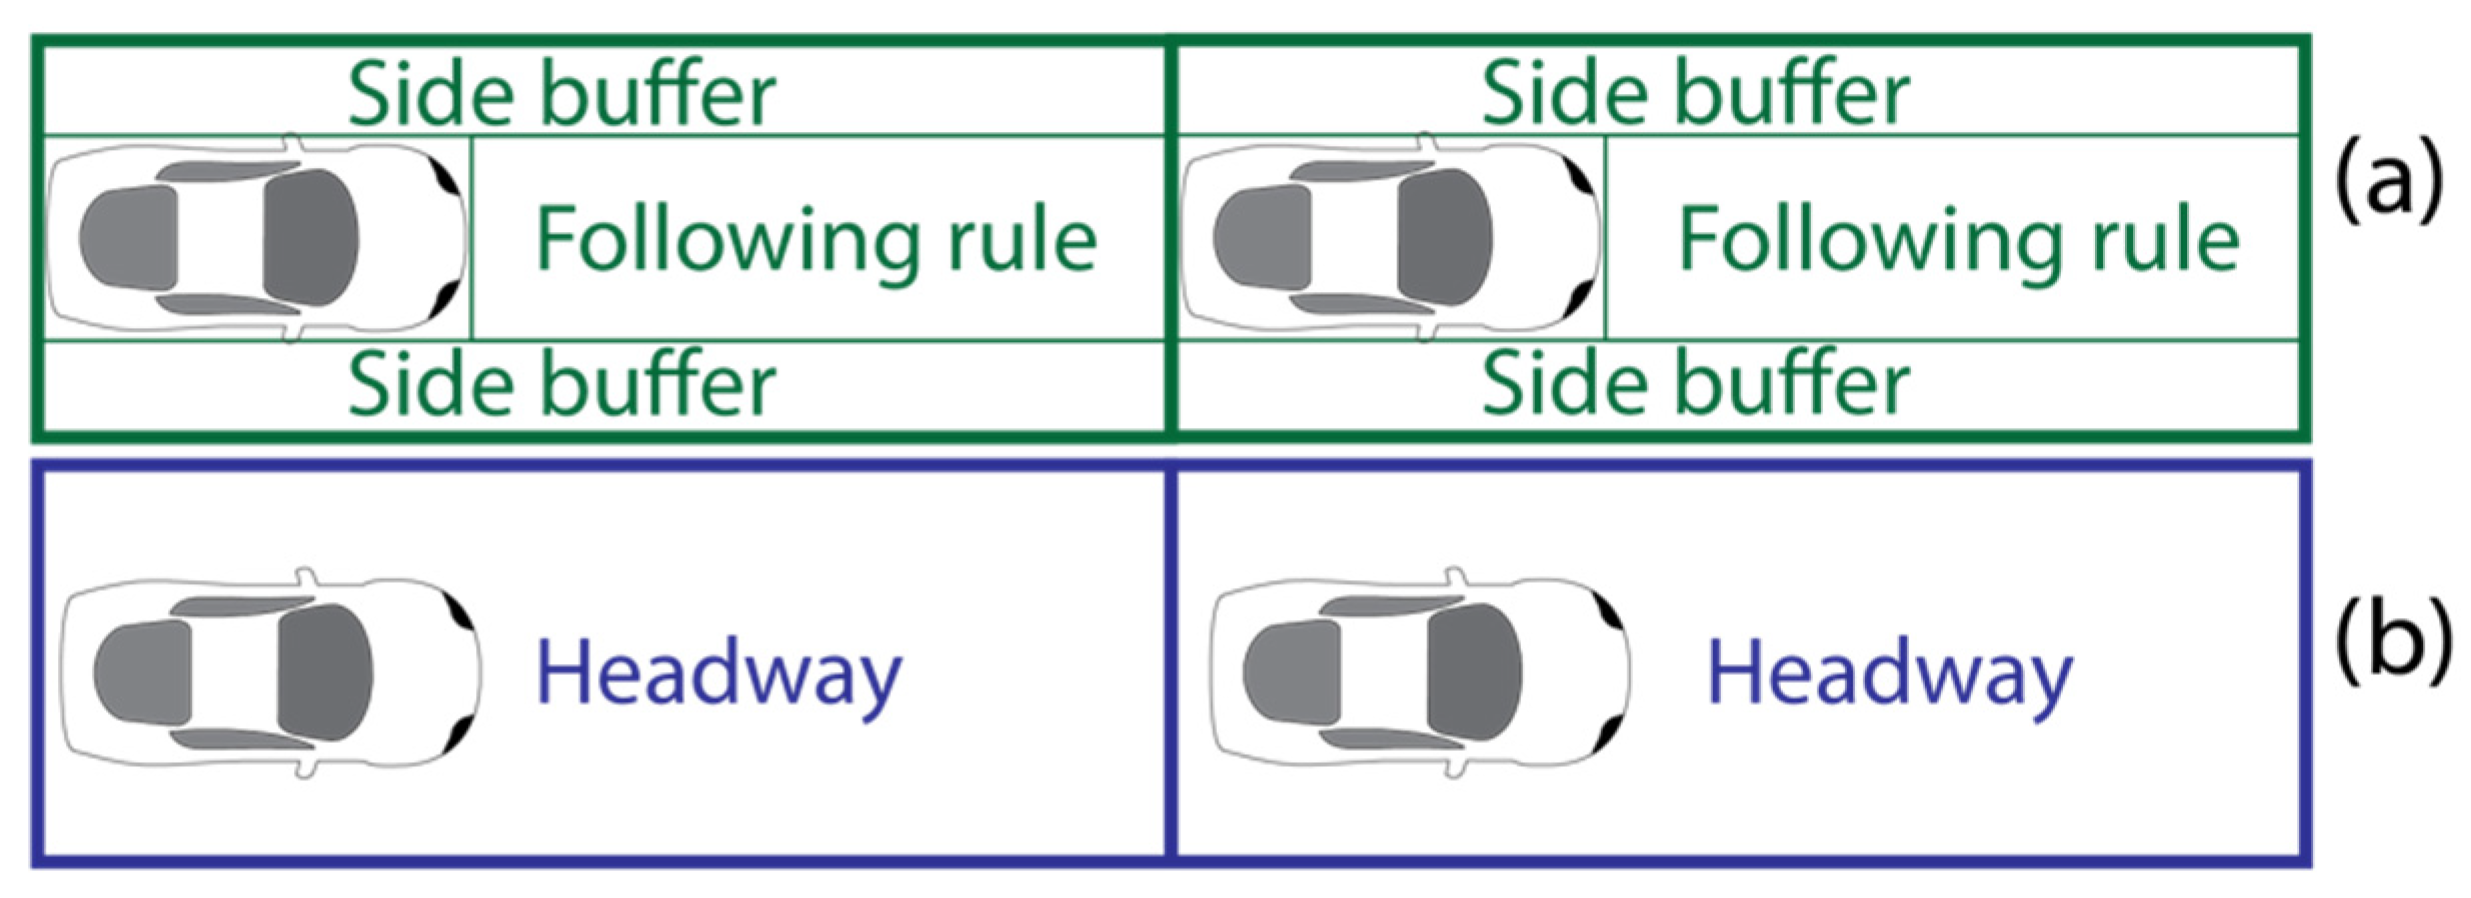
- Related traffic space demand of vehicle i in fluent traffic;
- Length of vehicle i;
- Distance to front vehicle (based on a speed-dependent approach for motorised individual transport);
- Lane width, assumed to be 3 m;
- Possible number of parallel driving vehicles in one lane (cars and busses: 1, Powered two-wheelers: 2, micro-mobility and walking: 3);
- Effective number of persons in vehicle i, based on the space offer and occupancy rate;
- Number of compared means of transport.
2.2. Continuous Formulation
- Time under consideration;
- Analysis area;
- Length of right-of-way;
- Width of the area of right of way;
- Traffic density;
- Velocity.
- Time;
- Area required;
- Width of right-of-way;
- Travel distance;
- Average occupancy of vehicles;
- Flow rate of vehicles in one lane per hour.
- Flow rate of vehicles in one lane per hour;
- Traffic density;
- Velocity.
2.3. Parking and Storage
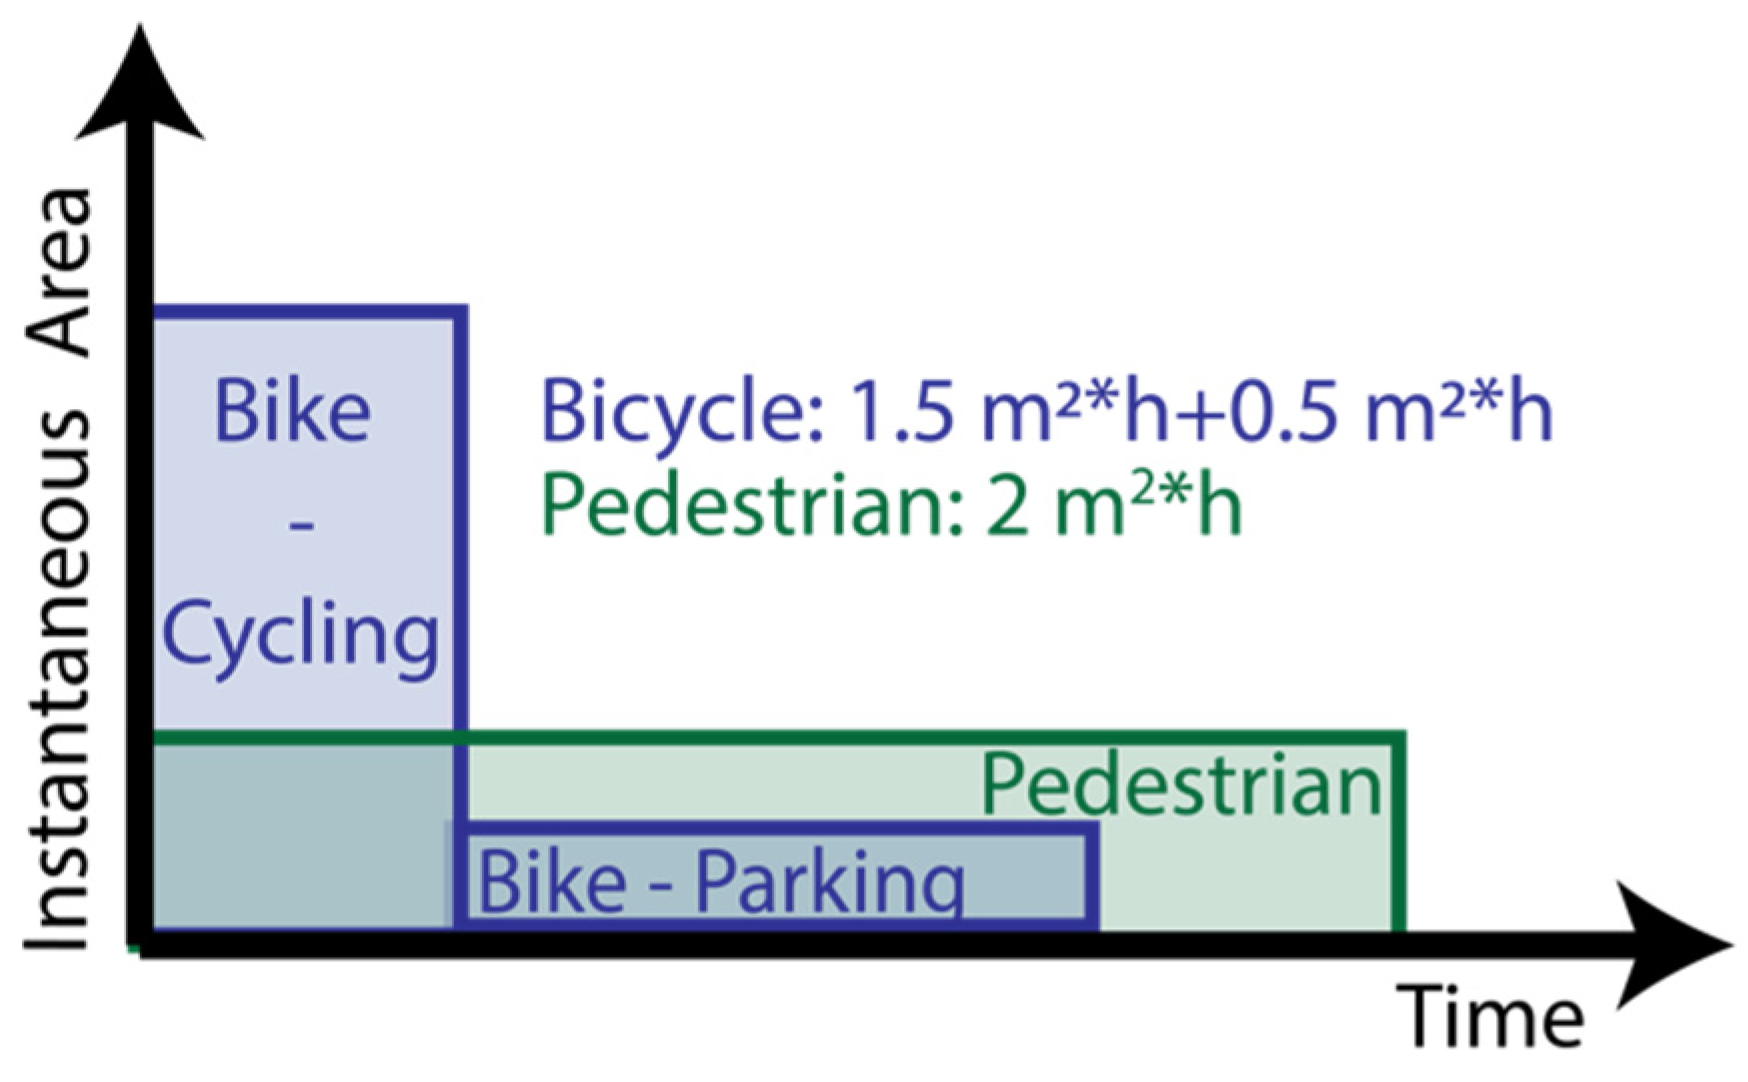
- Time under consideration;
- Analysis area;
- Effective area per vehicle (area of parking lot/number of vehicles);
- Parking time.
- Time stationary;
- Area required for stationary object;
- Average occupancy of vehicle.
- Related space demand of vehicle i while parking;
- Length of vehicle;
- Longitudinal distance to front vehicle (passenger car: 0.9 m, powered two-wheeler: 0.2 m, public transport vehicle: 2 m);
- Width of vehicle, including exterior parts;
- Required additional lateral parking space (passenger car: 0.15 m, powered two-wheeler: 0.25 m, public transport vehicle: 2 m);
- Effective number of persons in vehicle;
- Number of compared means of transport.
2.4. Instantaneous Area Requirements Published in The Literature
2.5. Safe Operation (Discrete Formulation) Vs. Provided Infrastructure (Continuous Formulation)
2.6. Value of Land
3. Methods
3.1. Formula
- Time-area required for trip;
- Length of vehicle;
- Safety distance between standing vehicles;
- Trip distance;
- Trip duration;
- Width of the lane /right-of-way;
- Following rule (usually two seconds).
- Area of the safety gap to the vehicle in the front;
- Following rule (i.e., 2s);
- Velocity at timestamp t;
- Trip duration;
- Width of the lane/right-of-way.
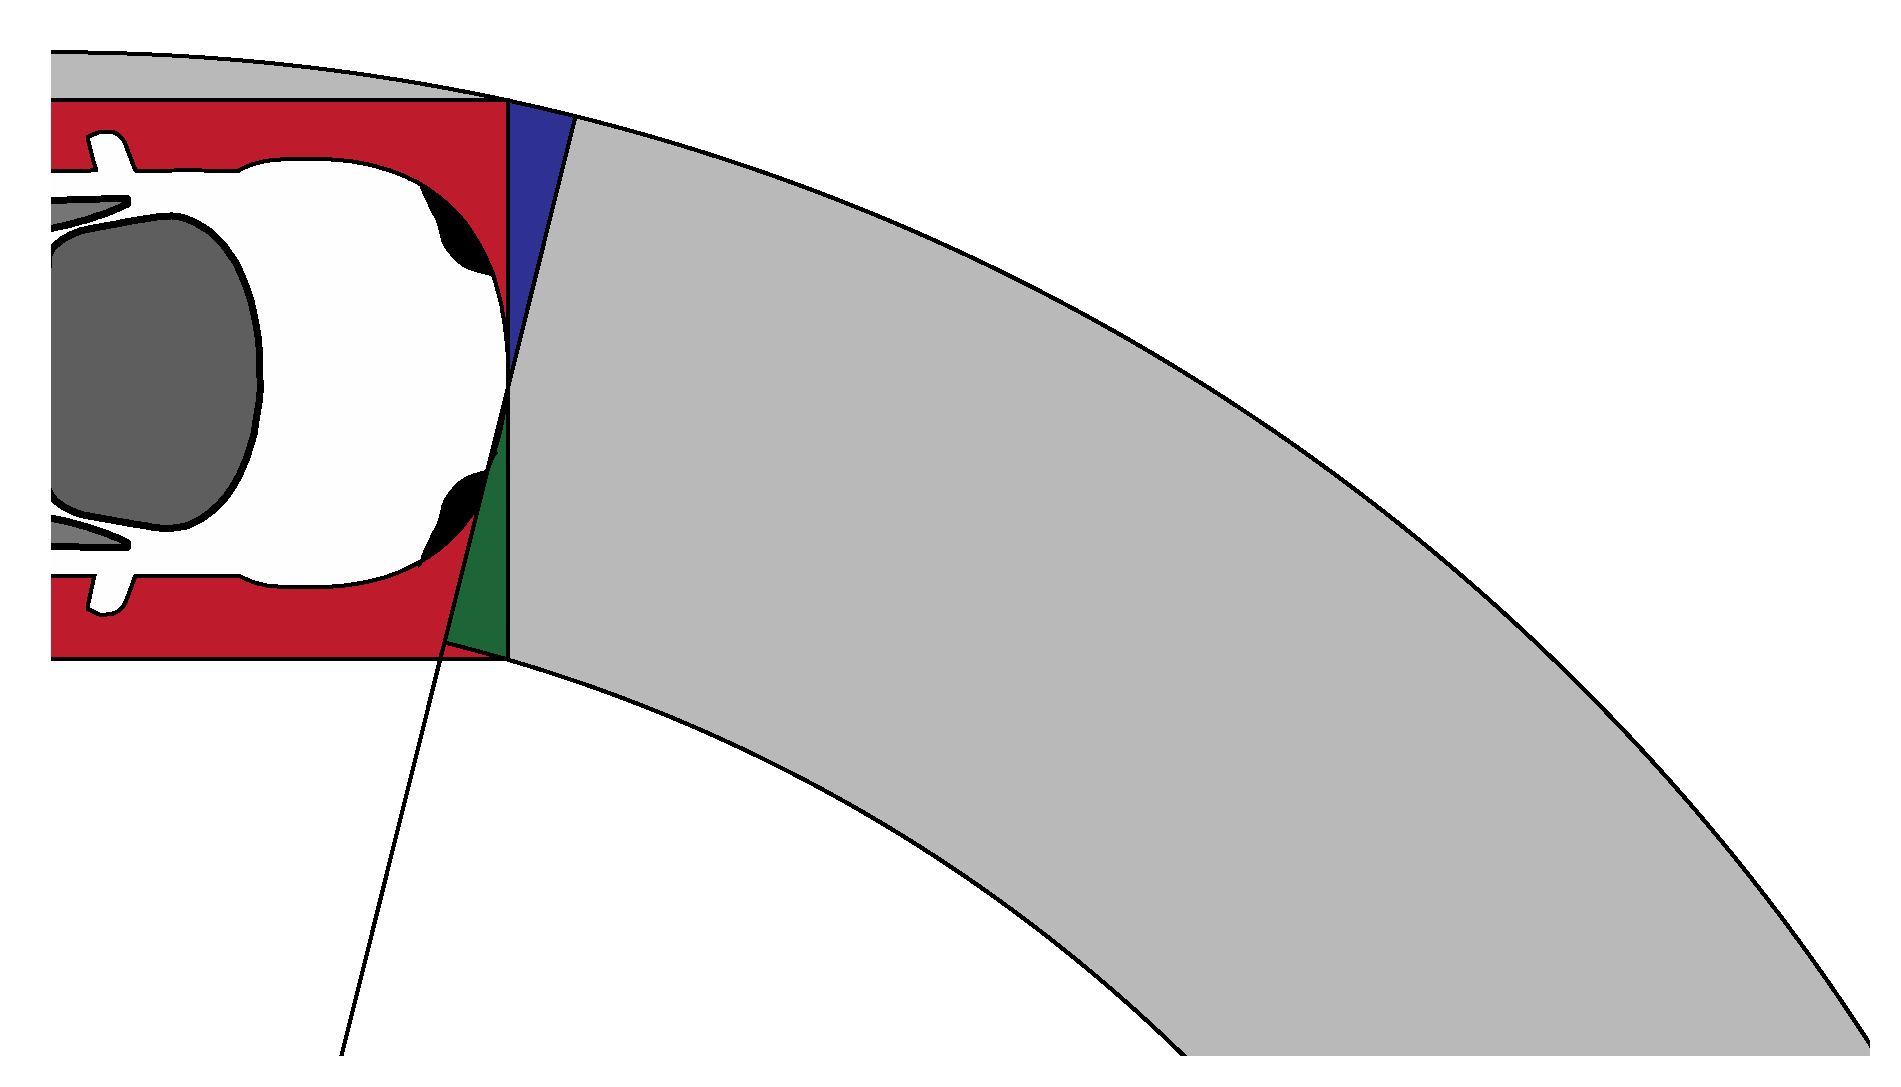
- Area of a circular ring/area of street;
- Radius;
- Width of the street;
- Length of the street/circumference.
3.2. Pedestrians
3.3. Bicycles and Cargo Bikes
3.4. Vans and Trucks
3.5. Sidewalk Automated Delivery Robots (SADRs)
3.6. Simulation Specifications
3.7. Application to Delivery Trip Data
3.8. Limitations
4. Results
4.1. Time-area Requirements
4.2. Correlations
4.3. Policy and Operating Strategy Changes
4.4. Sensitivity Analysis
5. Conclusions
Author Contributions
Funding
Acknowledgments
Conflicts of Interest
References
- Sapena, M.; Ruiz, L.A. Analysis of land use/land cover spatio-temporal metrics and population dynamics for urban growth characterization. Comput. Environ. Urban Syst. 2019, 73, 27–39. [Google Scholar] [CrossRef]
- Zitti, M.; Ferrara, C.; Perini, L.; Carlucci, M.; Salvati, L. Long-Term Urban Growth and Land Use Efficiency in Southern Europe: Implications for Sustainable Land Management. Sustainability 2015, 7, 3359–3385. [Google Scholar] [CrossRef]
- Bruun, E.C. Calculation and Evaluation of The Time-Area Parameter for Different Transportation Modes; University of Pennsylvania, ProQuest Dissertations Publishing: Philadelphia, PA, USA, 1992. [Google Scholar]
- Harvey, E.; Cardwell, R.C.; McDonald, G.W.; Van Delden, H.; VanHout, R.; Kim, J.-H.; Smith, N.J.; Forgie, V.E.; Belt, M.V.D. Developing integrated models by coupling together existing models; land use, economics, demographics and transport in Wellington, New Zealand. Comput. Environ. Urban Syst. 2019, 74, 100–113. [Google Scholar] [CrossRef]
- Schnieder, M.; West, A.A. Comparison of Time-Area Requirements of Parcel Lockers vs. Home Delivery: A Cyber-Physical System of Last Mile Delivery; Institute of Electrical and Electronics Engineers (IEEE): Piscataway, NJ, USA, 2020; pp. 298–303. [Google Scholar]
- Bruun, E.C.; Vuchic, V.R. Time-area concept: Development, meaning, and applications. Transp. Res. Rec. 1995, 1499, 95–104. [Google Scholar]
- Brunner, H.; Hirz, M.; Hirschberg, W.; Fallast, K. Evaluation of various means of transport for urban areas. Energy Sustain. Soc. 2018, 8, 9. [Google Scholar] [CrossRef]
- Shin, Y.E.; Vuchic, V.R.; Bruun, E.C. Land Consumption Impacts of a Transportation System on a City. Transp. Res. Rec. J. Transp. Res. Board 2009, 2110, 69–77. [Google Scholar] [CrossRef]
- Gartner, N.H.; Carroll, J.M.; Rathi, A. Revised Monograph on Traffic Flow Theory; TRB Special Report; US Department of Transportation: Washington, DC, USA, 1992; p. 165.
- Litman, T. Transportation Land Valuation Evaluating Policies and Practices that Affect the Amount of Land Devoted to Transportation Facilities; Report; University of Oregon: Portland, OR, USA, 2005. [Google Scholar]
- Tranter, M.; Robineau, D.; Goodman, G. National Travel Survey: England 2014; Department for Transport, Office for National Statistics: London, UK, 2015.
- Manville, M.; Shoup, D. Parking, People, and Cities. J. Urban Plan. Dev. 2005, 131, 233–245. [Google Scholar] [CrossRef]
- Shoup, D.C. The trouble with minimum parking requirements. Transp. Res. Part A Policy Pr. 1999, 33, 549–574. [Google Scholar] [CrossRef]
- Vlahogianni, E.; Kepaptsoglou, K.; Tsetsos, V.; Karlaftis, M.G. A Real-Time Parking Prediction System for Smart Cities. J. Intell. Transp. Syst. 2015, 20, 192–204. [Google Scholar] [CrossRef]
- Davis, A.Y.; Pijanowski, B.C.; Robinson, K.; Engel, B. The environmental and economic costs of sprawling parking lots in the United States. Land Use Policy 2010, 27, 255–261. [Google Scholar] [CrossRef]
- Davis, A.Y.; Pijanowski, B.C.; Robinson, K.D.; Kidwell, P.B. Estimating parking lot footprints in the Upper Great Lakes Region of the USA. Landsc. Urban Plan. 2010, 96, 68–77. [Google Scholar] [CrossRef]
- TG Road Safety. Safe Distance between Vehicles. Available online: https://www.cedr.eu/download/Publications/2010/e_Distance_between_vehicles.pdf (accessed on 8 May 2020).
- Allen, J.; Piecyk, M.; Piotrowska, M.; McLeod, F.; Cherrett, T.; Ghali, K.; Nguyen, T.; Bektas, T.; Bates, O.; Friday, A.; et al. Understanding the impact of e-commerce on last-mile light goods vehicle activity in urban areas: The case of London. Transp. Res. Part D Transp. Environ. 2018, 61, 325–338. [Google Scholar] [CrossRef]
- Department for Transport Communities and Local Government. Manual for Streets; Thomas Telford Ltd.: London, UK, 2007.
- Purdy, E.R. Transportation Research Board. In Encyclopedia of Transportation: Social Science and Policy; Sage: Thousand Oaks, CA, USA, 2014. [Google Scholar]
- Greibe, P.; Buch, T.S. Capacity and Behaviour on One-way Cycle Tracks of Different Widths. Transp. Res. Procedia 2016, 15, 122–136. [Google Scholar] [CrossRef]
- Department for Transport. Cycle Infrastructure Design Local Transport Note 2/08; TSO: London, UK, 2008.
- Schweizerische Post Factsheet Starship Delivery Robot. Available online: https://www.post.ch/-/media/post/ueber-uns/medienmitteilungen/2017/factsheet-lieferroboter.pdf?la=en (accessed on 5 May 2020).
- Greater London Authority (GLA). Key Performance Indicators of Freight Delivery Performance with Electric Vans in Central London—London Datastore. 2017. Available online: https://data.london.gov.uk/dataset/key-performance-indicators-of-demonstrator-freight-delivery-performance-with-electric-vans-in-central-london (accessed on 18 February 2019).
- Comi, A.; Schiraldi, M.M.; Buttarazzi, B. Smart urban freight transport: Tools for planning and optimising delivery operations. Simul. Model. Pr. Theory 2018, 88, 48–61. [Google Scholar] [CrossRef]
- Roca-Riu, M.; Cao, J.; Dakic, I.; Menendez, M. Designing Dynamic Delivery Parking Spots in Urban Areas to Reduce Traffic Disruptions. J. Adv. Transp. 2017, 2017, 6296720. [Google Scholar] [CrossRef]
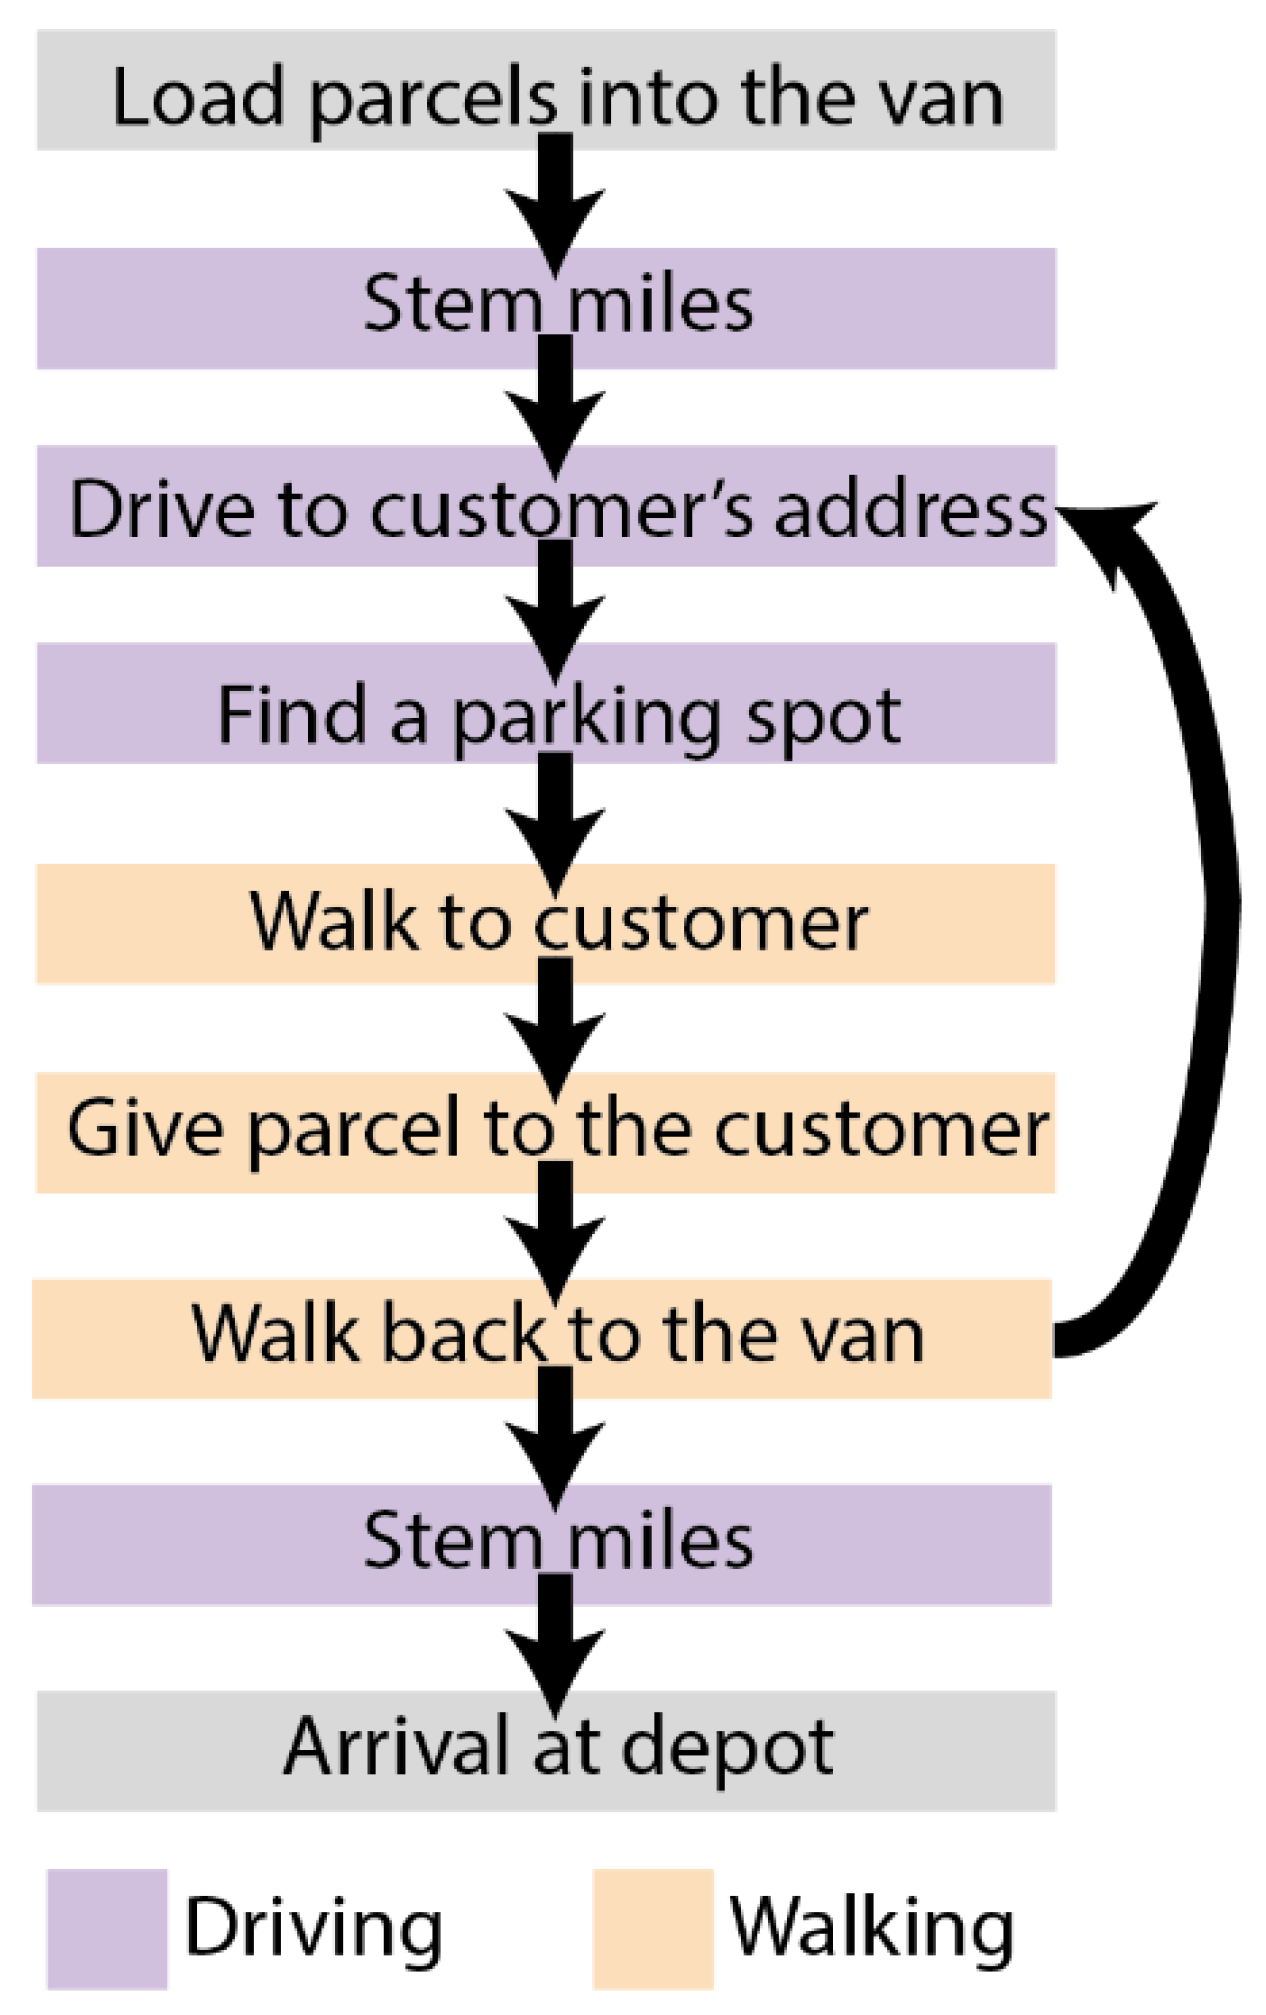

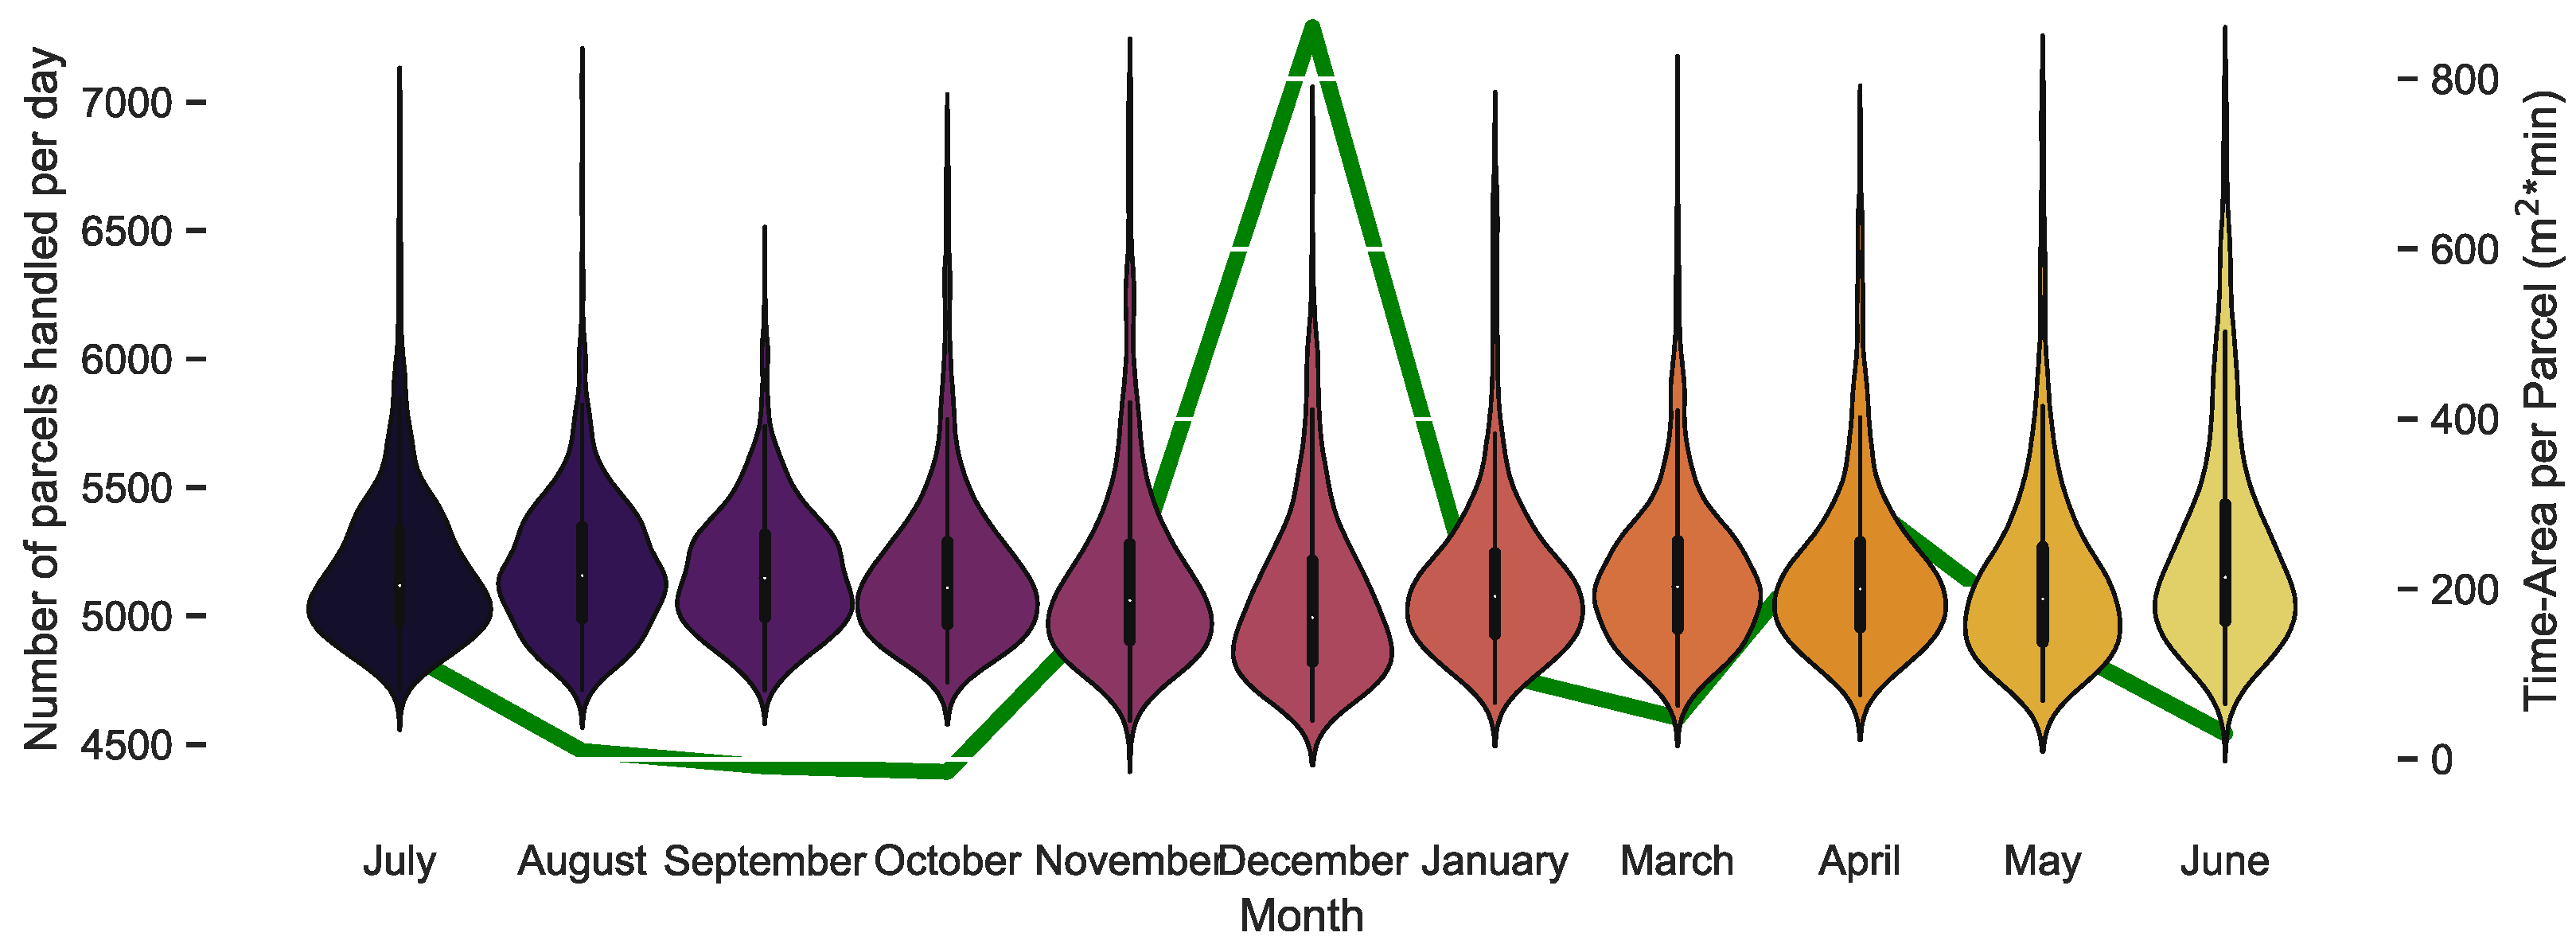
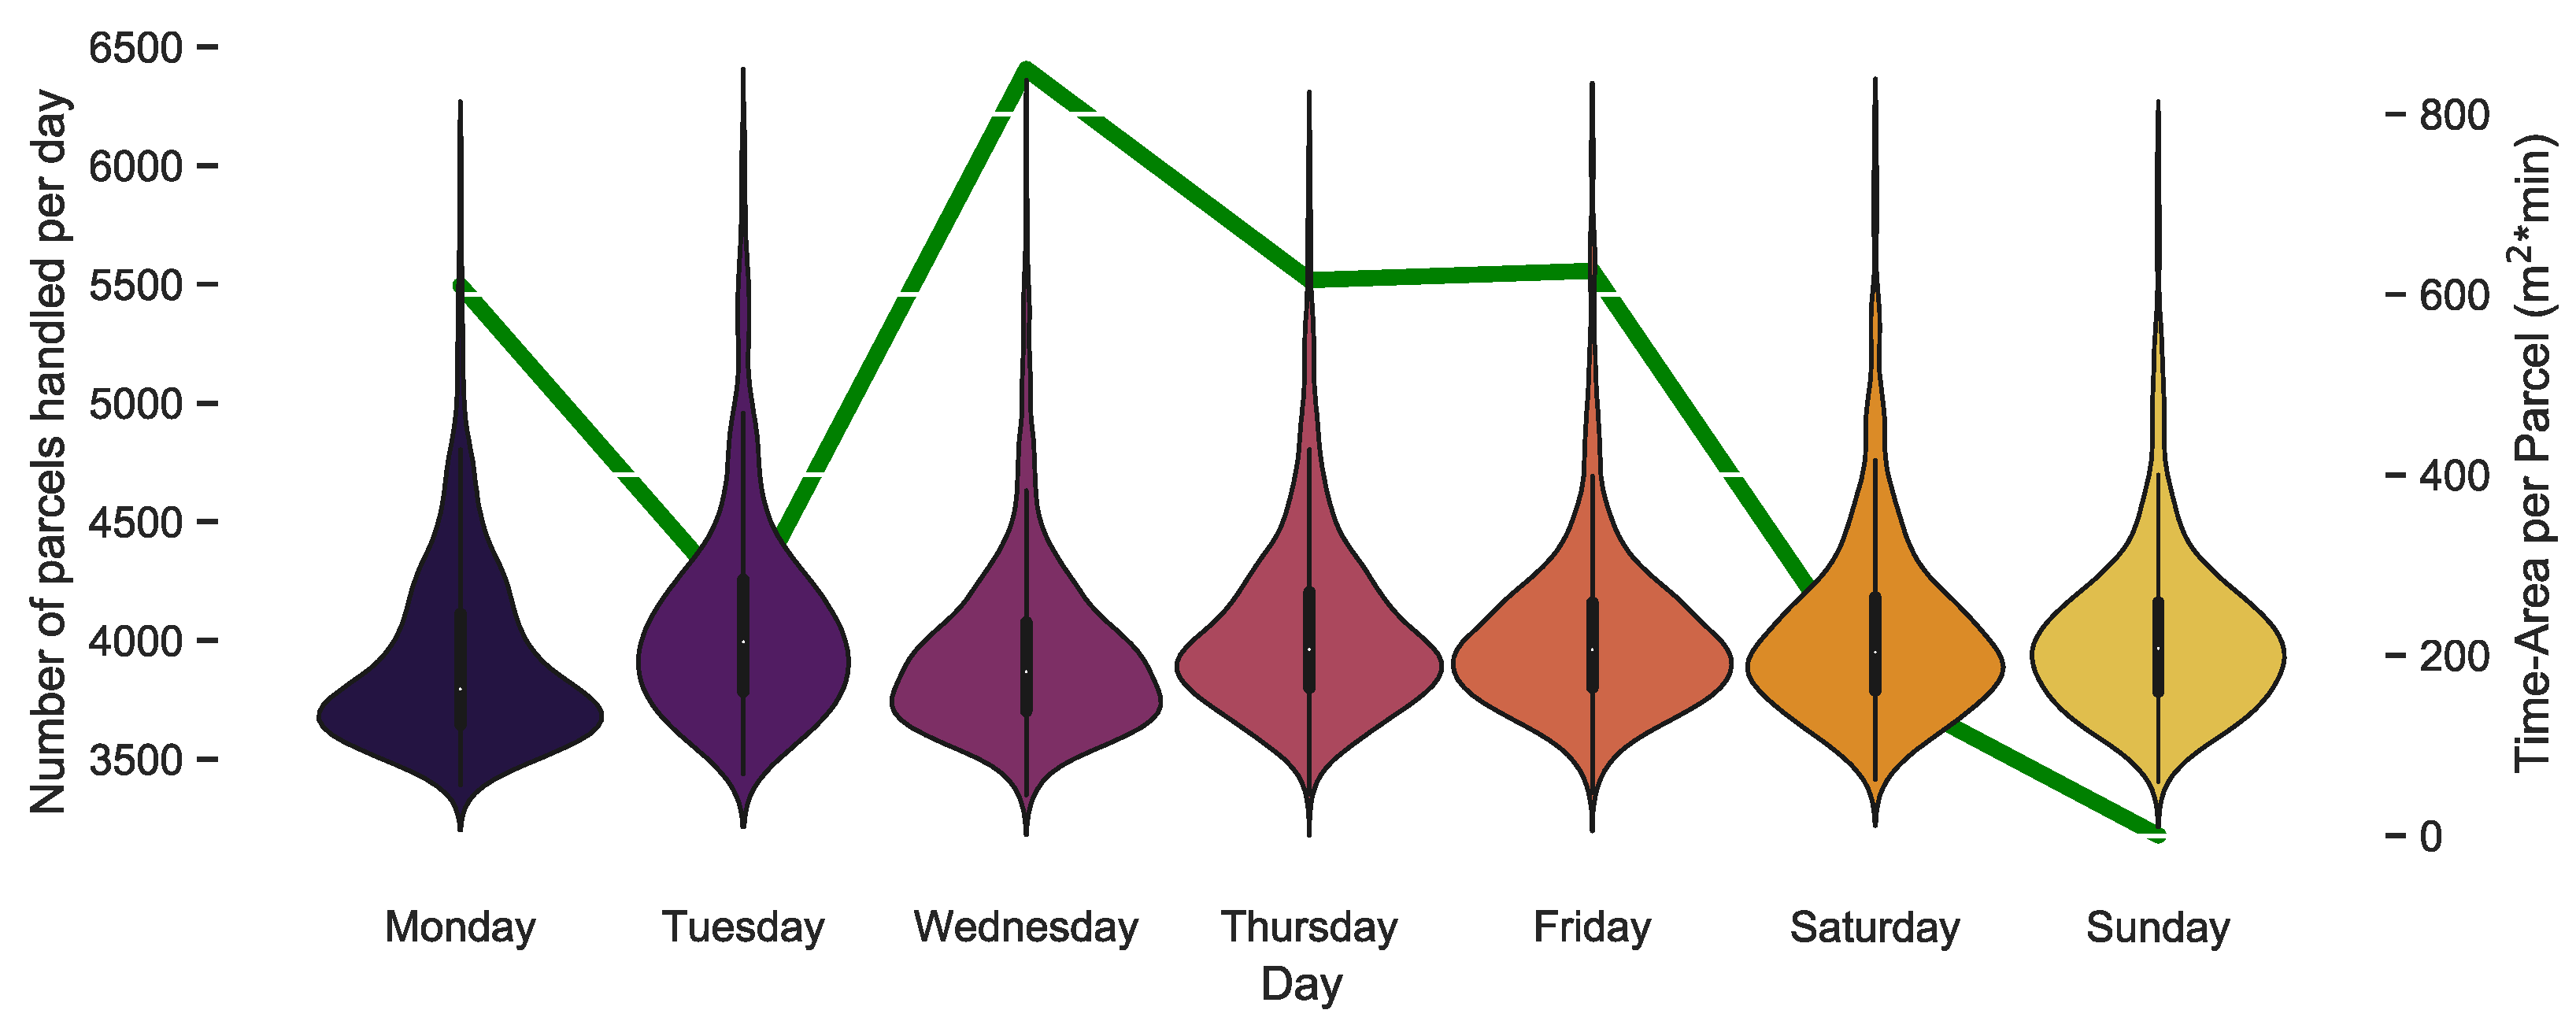
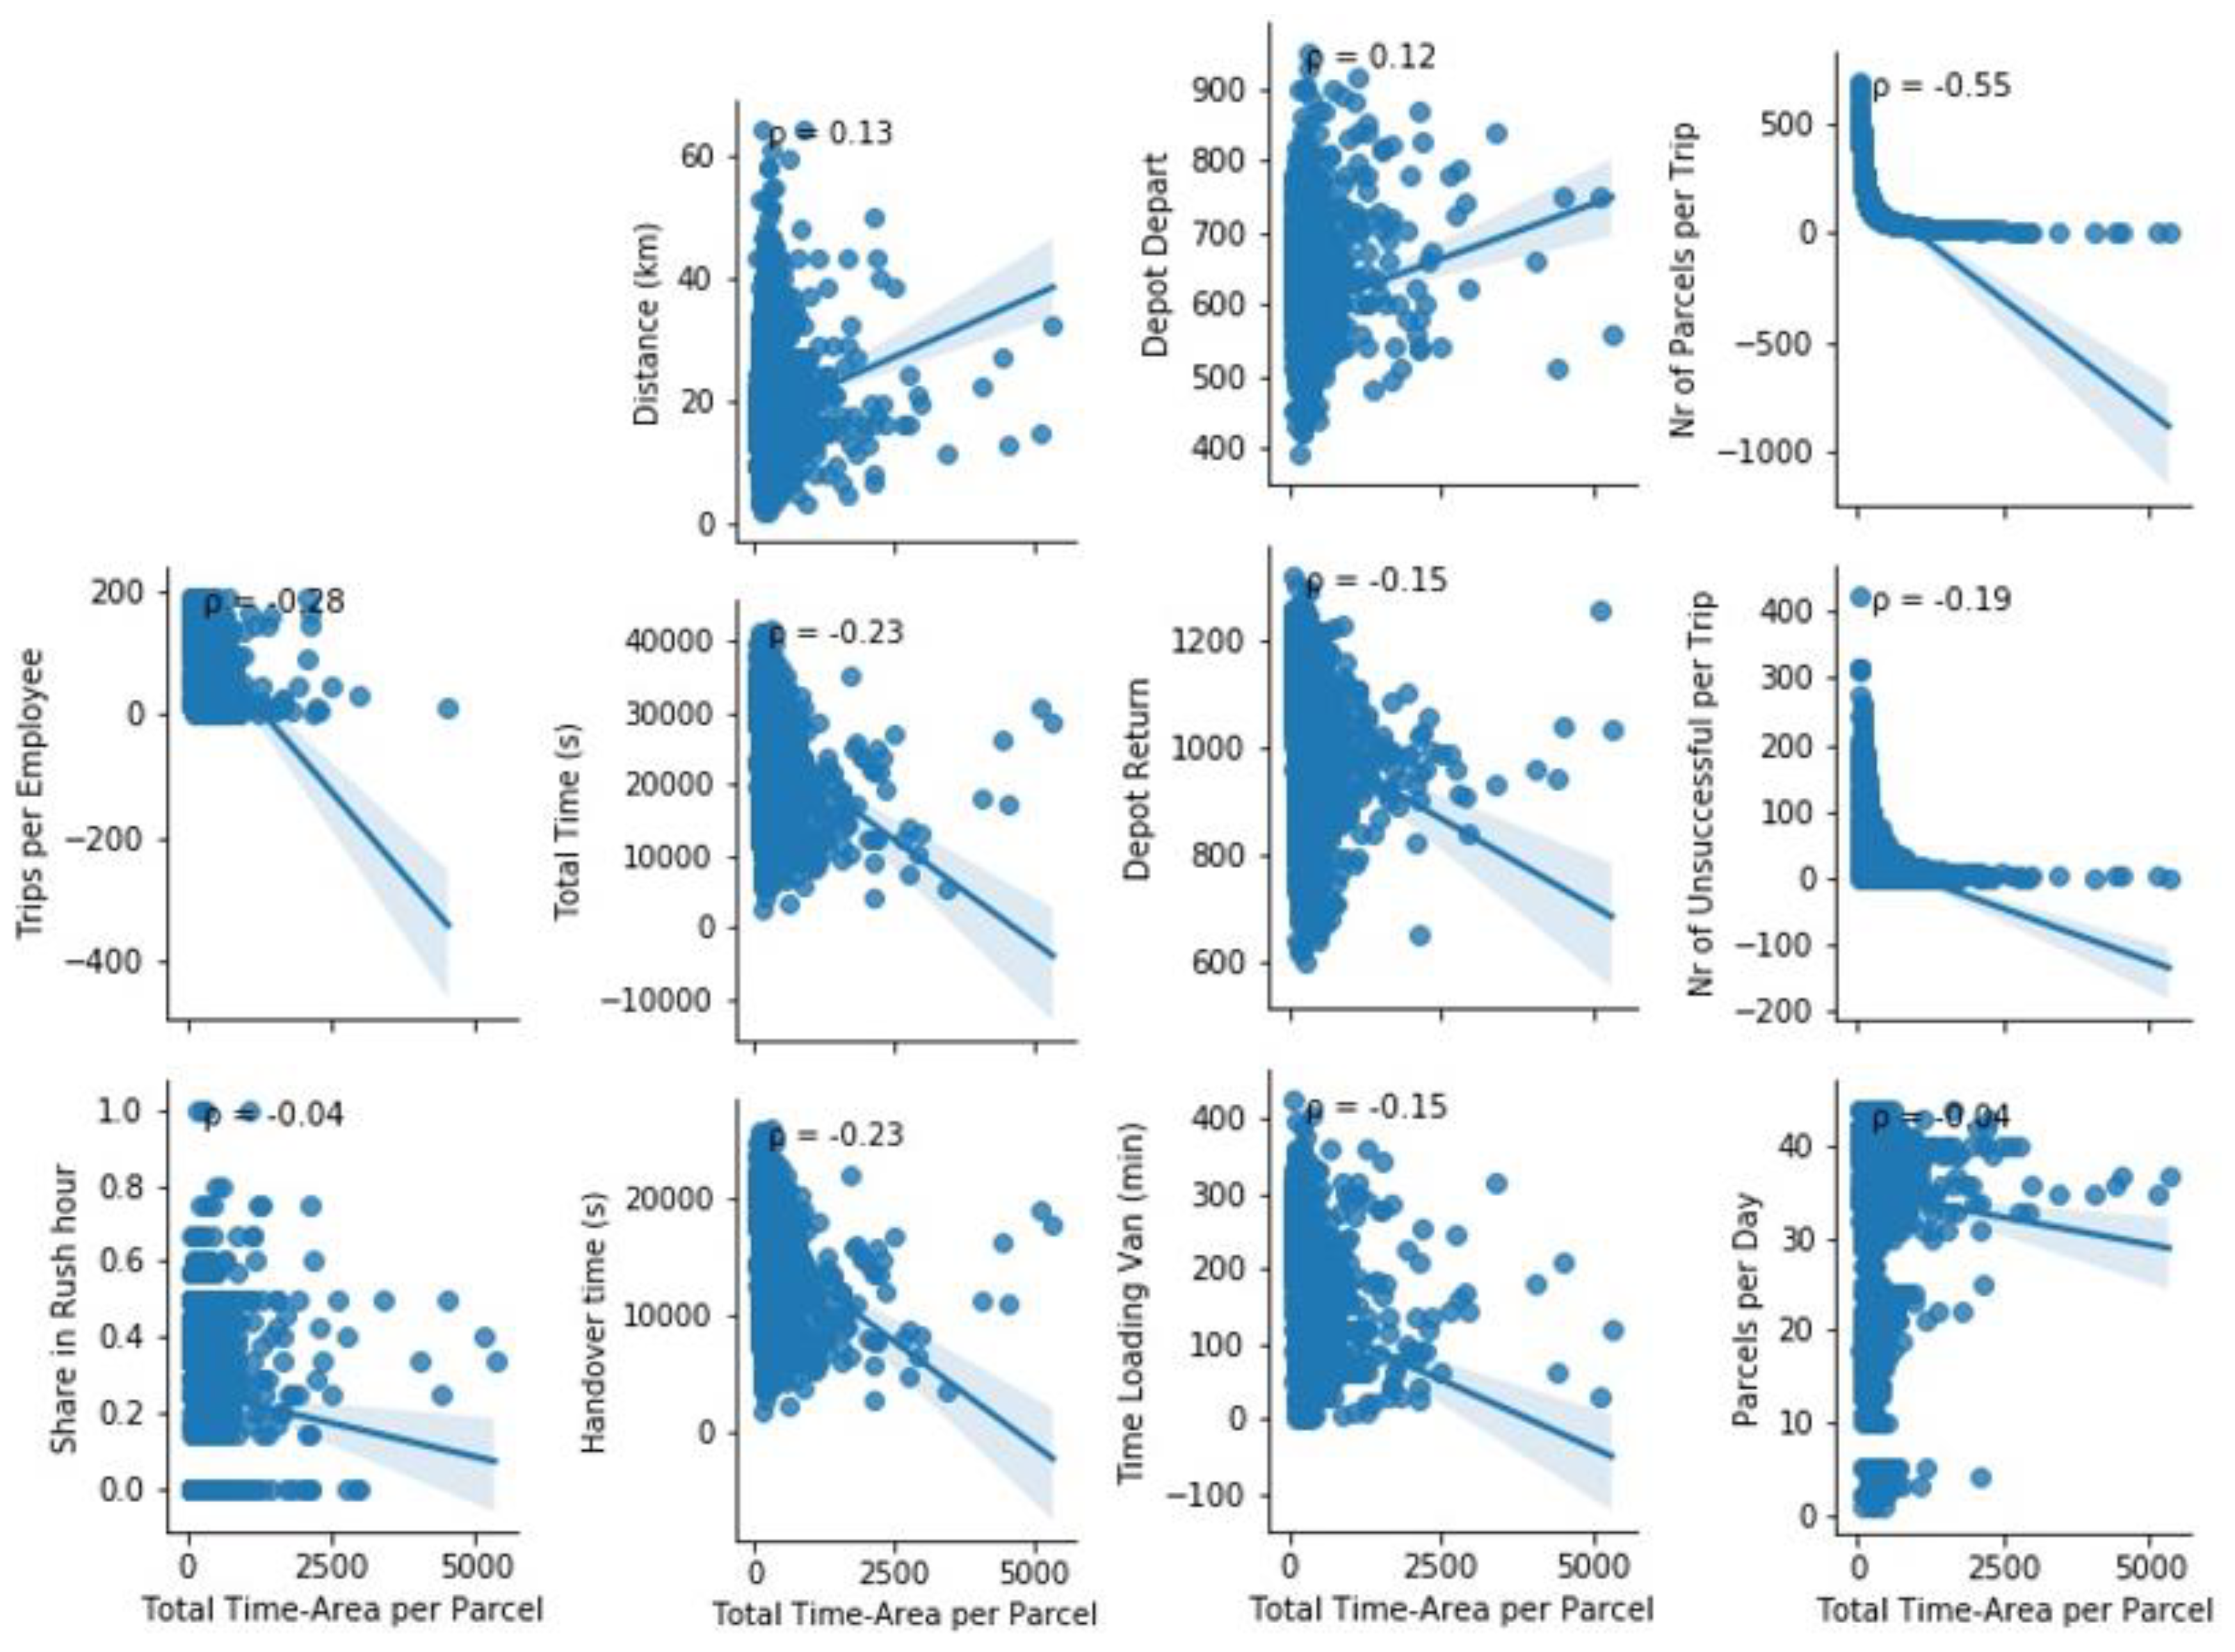

| Mode | Occupancy | Speed km/h | Parking m2 | Moving m2 | Source |
|---|---|---|---|---|---|
| Pedestrian | 1 | 5 | 0.9 | 2.8 | Litman [10] |
| Pedestrian | 1 | 4 | 0 | 2 | Brunner et al. [7] |
| Pedestrian | 1 | 4 | 0 | 1.4 | Shin et al. [8] |
| Pedestrian | 1 | 5 | - | 0.83 | Bruun et al. [6], Bruun [3] |
| Bicycle | 1 | 16 | 1.9 | 9.3 | Litman [10] |
| Bicycle | 1 | 12 | 1 | 4.4 | Brunner et al. [7] |
| eBicycle | 1 | 13 | 1 | 4.4 | Brunner et al. [7] |
| Scooter | 1.1 | 17 | 2.0 | 10.3 | Brunner et al. [7] |
| e-Scooter | 1.1 | 17 | 2.0 | 10.3 | Brunner et al. [7] |
| City Bus | 21.54 | 18 | 45.5 | 72.8 | Brunner et al. [7] |
| Articulated bus | 32.41 | 18 | 63.4 | 108.8 | Brunner et al. [7] |
| Bus on street | 40 | 12 | 0 | 96 | Shin et al. [8] |
| Bus on bus way | 60 | 20 | 0 | 132 | Shin et al. [8] |
| Bus peak | 60 | 15 | - | 61.6 | Bruun et al. [6], Bruun [3] |
| Bus off-peak | 15 | 20 | - | 67.3 | Bruun et al. [6], Bruun [3] |
| Rail rapid transit | - | 30 | - | 954 | Bruun et al. [6], Bruun [3] |
| Tram | 36.25 | 16 | 90.6 | 242.9 | Brunner et al. [7] |
| Street car | 70 | 12 | 0 | 105 | Shin et al. [8] |
| Light rail transit | 110 | 25 | 0 | 275 | Shin et al. [8] |
| Rail rapid transit | 900 | 35 | 0 | 1370.3 | Shin et al. [8] |
| Car | - | 32 | 9.2 | 27.9 | Litman [10] |
| Car | - | 97 | 18.6 | 278.9 | Litman [10] |
| Light urban electric vehicle | 1.1 | 16 | 4.3 | 22.0 | Brunner et al. [7] |
| Subcompact passenger car | 1.07 | 16 | 7.9 | 25.5 | Brunner et al. [7] |
| Subcompact electric vehicle | 1.07 | 16 | 7.9 | 25.5 | Brunner et al. [7] |
| Mid class passenger car | 1.34 | 16 | 9.8 | 27.6 | Brunner et al. [7] |
| Mid class plug-in hybrid electric vehicle | 1.34 | 16 | 9.8 | 27.6 | Brunner et al. [7] |
| Luxury passenger car (SUV) | 1.34 | 16 | 13.4 | 29.5 | Brunner et al. [7] |
| Luxury plug-in hybrid electric vehicle | 1.34 | 16 | 13.4 | 29.5 | Brunner et al. [7] |
| Car on street | 1.2 | 20 | 23, 30 | 76 | Shin et al. [8] |
| Car on freeway | 1.2 | 60 | 23, 30 | 164 | Shin et al. [8] |
| Automobile peak | 1.2 | 20 | - | 40.3 | Bruun et al. [6], Bruun [3] |
| Automobile of peak | 4.0 | 30 | - | 52.9 | Bruun et al. [6], Bruun [3] |
| Required for Safe Operation (Discrete Formulation) | Provided Infrastructure (Continuous Flow Formulation) | |
|---|---|---|
| Transport Activity | + Estimates the minimum legal requirement which can be reached if the infrastructure is used at full capacity + Can be used when multiple modes share the same right-of-way - People might keep larger distances than required - Underestimates the time-area requirements given that unused space is not considered even if it cannot be used for anything else | + More accurate representation of the provided infrastructure - Punishes transport systems that do not run at a high capacity but could run at a higher capacity without additional infrastructure. Thus, it assesses the provision of infrastructure, not the vehicle itself. - Difficult to estimate when multiple modes of transport share the same right-of-way |
| Parking | + Estimates the minimum which can be reached if the infrastructure is used at full capacity - Underestimates the fact that most cities provide multiple parking spots per car | + Accounts for the entire provided infrastructure - Overestimates demand if parking is not utilised at full capacity, e.g., due to a planning error - Difficult to estimate when a parking spot is used by multiple vehicles during a day - The number of available parking spots is difficult to estimate due to on-street parking |
| km/h | 0.0 | 1.8 | 3.6 | 5.4 | 7.2 |
| Pedestrian (m2) | 0.8 | 1.2 | 1.6 | 2.1 | 2.5 |
| Pedestrian with bag (m2) | 1.5 | 2.0 | 2.4 | 2.8 | 3.3 |
| km/h | 0.0 | 3.6 | 7.2 | 11 | 14 | 18 | 22 | 25 | 29 | 32 |
| m2 | 2.7 | 5.7 | 8.7 | 12 | 15 | 18 | 21 | 24 | 27 | 30 |
| km/h | 0.0 | 3.6 | 7.2 | 11 | 14 | 18 | 22 | 25 | 29 | 32 |
| m2 | 4.7 | 9.4 | 14 | 19 | 23 | 28 | 33 | 37 | 42 | 47 |
| Speed (km/h) | 0 | 7.2 | 14 | 22 | 29 | 36 | 50 | 65 |
| Small van (m2) | 15 | 26 | 37 | 48 | 59 | 70 | 92 | 114 |
| Medium van (m2) | 16 | 27 | 38 | 49 | 60 | 71 | 93 | 115 |
| 3.5 t van (m2) | 19 | 30 | 41 | 52 | 63 | 74 | 96 | 118 |
| 7.5 t lorry (m2) | 27 | 46 | 65 | 84 | 104 | 123 | 161 | 200 |
| km/h | 0 | 7 | 14 | 22 | 29 | 36 | 43 | 50 | 58 | 65 |
| All vans (m) | 1 | 5 | 9 | 13 | 17 | 21 | 25 | 29 | 33 | 37 |
| 7.5 t lorry (m) | 3 | 10 | 17 | 24 | 31 | 38 | 45 | 52 | 59 | 66 |
| km/h | 0.0 | 1.8 | 3.6 | 5.4 | 7.2 |
| m2 | 0.8 | 1.2 | 1.6 | 2.1 | 2.5 |
| Mode | OSRM Speed Profile | Safety Distance | Width | Following Rule | |
|---|---|---|---|---|---|
| Pedestrian | Pedestrian | 0.875 | 0 | 0.875 | 1 |
| Pedestrian with bag | Pedestrian | 1.75 | 0 | 0.875 | 1 |
| Bicycle | Bicycle | 1.8 | 0 | 1.5 | 2 |
| Cargo bike | Bicycle | 2.6 | 0 | 1.8 | 2 |
| Small van | Car | 4.4 | 1 | 2.75 | 2 |
| Medium van | Car | 4.9 | 1 | 2.75 | 2 |
| 3.5 Tonne van | Car | 5.9 | 1 | 2.75 | 2 |
| 7.5 Tonne lorry | Car | 6.7 | 3 | 2.75 | 6 |
| SADR | Pedestrian | 0.678 | 0.197 | 0.875 | 1 |
Publisher’s Note: MDPI stays neutral with regard to jurisdictional claims in published maps and institutional affiliations. |
© 2020 by the authors. Licensee MDPI, Basel, Switzerland. This article is an open access article distributed under the terms and conditions of the Creative Commons Attribution (CC BY) license (http://creativecommons.org/licenses/by/4.0/).
Share and Cite
Schnieder, M.; Hinde, C.; West, A. Review and Development of a Land Consumption Evaluation Method Based on the Time-Area Concept of Last Mile Delivery Using Real Delivery Trip Data. Sustainability 2020, 12, 10626. https://doi.org/10.3390/su122410626
Schnieder M, Hinde C, West A. Review and Development of a Land Consumption Evaluation Method Based on the Time-Area Concept of Last Mile Delivery Using Real Delivery Trip Data. Sustainability. 2020; 12(24):10626. https://doi.org/10.3390/su122410626
Chicago/Turabian StyleSchnieder, Maren, Chris Hinde, and Andrew West. 2020. "Review and Development of a Land Consumption Evaluation Method Based on the Time-Area Concept of Last Mile Delivery Using Real Delivery Trip Data" Sustainability 12, no. 24: 10626. https://doi.org/10.3390/su122410626
APA StyleSchnieder, M., Hinde, C., & West, A. (2020). Review and Development of a Land Consumption Evaluation Method Based on the Time-Area Concept of Last Mile Delivery Using Real Delivery Trip Data. Sustainability, 12(24), 10626. https://doi.org/10.3390/su122410626


