Article

How Late Does Your Flight Depart? A Quantile Regression Approach for a Chinese Case Study

1
National Key Laboratory of Air Traffic Flow Management, Nanjing University of Aeronautics and Astronautics, Nanjing 211106, China
2
Department of Civil, Materials and Environmental Engineering, University of Illinois at Chicago, Chicago, IL 60607, USA
3
Department of Aviation and Technology, San Jose State University, San Jose, CA 95192, USA
*
Author to whom correspondence should be addressed.
Sustainability 2020, 12(24), 10553; https://doi.org/10.3390/su122410553
Submission received: 11 October 2020 / Revised: 12 December 2020 / Accepted: 13 December 2020 / Published: 17 December 2020
(This article belongs to the Section Sustainable Transportation)

Abstract

:
Flight departure delays cost airlines and airports millions of dollars and become a systematic problem. The on-time performance at an airport is connected to and easily affected by delay propagation from previous operations of flights using the airport. In this paper, we employ both Ordinary Least Square (OLS) and quantile regressions to investigate the impact of various influencing factors on flight departure delay. By using historical flight records and weather information, the impacts of delay propagation-related and other factors are quantified to study the correlations between the explanatory and response variables. Three variables, including previous arrival delay, turnaround buffer time, and the first order of a day, are used to examine the propagation effects. We find that aircraft type, flying on a weekday, and being the first flight of a day have significant impacts on short departure delays. Ground buffer is conducive to mitigating delay propagation. For long delays, however, ground buffer cannot work in an efficient way, and the previous arrival effect is more important. Convective weather and aircraft type are the crucial factors in this situation. Interestingly, flying on a weekday suddenly becomes one of the main components under extreme delays. Meanwhile, propagated delay and airport congestion remain significantly impactful on the on-time performance.

1. Introduction

With an eightfold increase in global air traffic between 1978 and 2017 [1], flight delay has become a major problem for many air transportation systems worldwide, costing airlines and passengers billions of dollars each year [2,3,4,5,6]. This is especially the case for China, which has one of the largest and fastest-growing air transportation systems in the world. In 2017, passenger throughput in China exceeded 1.1 billion, or a 12.9% increase from the previous year, with total aircraft operations across airports reaching 102.49 million nationwide. With the fast-paced growth of air traffic, the Chinese civilian airspace—both near terminals and en route—is under increasing stress, with flight delays a common phenomenon at many locations in the system [7,8]. In response, the Civil Aviation Administration of China (CAAC) has introduced a series of new regulations on flight delays. For example, China’s Civil Aviation Regulations for the on-time performance impose penalties, such as schedule cancelation and a fine up to 30,000 RMB if a flight has serious delays. Besides financial losses due to regulatory penalty as well as increased operating cost, flight delays also result in complaints about airline service quality and consequently reputation damage to airlines.
The first step to mitigating the negative impacts of flight delay is to understand them. Due to the limited resources (time and space) that can be allocated to a flight’s departure, hefty regulatory penalties, and the cascading effect on the on-time performance of downstream flights [9], minimizing flight departure delay is especially critical in airline operations. To this end, this paper focuses on investigating factors influencing flight departure delay using historic records at Shanghai Pudong International Airport (PVG), one of the busiest airports in China. The influencing factors are classified into two groups, depending on whether a factor is delay propagation-related or not. An econometric analysis using both Ordinary Least Square (OLS) and Quantile Regression (QR) models is performed to estimate the impact of various factors on flight departure delay. While OLS regression focuses on the average effect of influencing factors on the response variable, QR models extend mean regression to conditional quantiles of the response variable. In this regard, QR provides a more comprehensive picture by considering the covariate of flight departure delay with independent variables over the entire distribution, not merely the average effect.
This paper makes two major contributions. Firstly, a QR method is constructed with estimation of several QR models to quantify the impact of various factors on different quantiles of flight departure delay, based on which the contributing factors to either short or long delay are identified. According to the finding, airlines can adopt more specific strategies to reduce flight delays. Secondly, the influencing factors are classified into the two categories depending on their propagation, which is beneficial to investigating how delay propagation-related effect vary when the quantiles of departure delay are different.
The remainder of this paper is organized as follows. In Section 2, a literature review is conducted regarding the delay propagation-related and the other factors in flight delay. In Section 3, the distribution and composition of departure delay at PVG are described. Section 4 presents a descriptive analysis of the plausible factors influencing flight departure delay. The data used for estimating the econometric models are presented in Section 5. The estimation results are reported and discussed in Section 6. In Section 7, conclusions of this paper are drawn and directions for further research are suggested.

2. Literature Review

Research on flight delay propagation has been ongoing for almost two decades. As flight operations are inherently connected, delay to one flight is likely to affect not only that flight itself but connected flights, particularly downstream flights flown by the same aircraft. This phenomenon is flight delay propagation. To mitigate this, it has become routine practice that airlines deliberately place buffer time, i.e., some extra time beyond the minimum unimpeded flight time, into published flight schedules [10,11], so that flight schedules are most robust to unexpected delays. Buffer time is also inserted during flight turnaround, i.e., between the scheduled arrival of a previous flight and the scheduled departure of its subsequent flight, as a means to reduce delay propagation [12,13]. For example, buffer time for flight connection is taken into consideration in [14] as a significant variable in the estimation of flight departure delay. A probabilistic model is developed by Tu et al. [15] to predict the distribution of departure delay, by taking into account seasonal trends, daily propagation delay patterns, and random residuals. The delay distribution is estimated, with Denver International Airport chosen as a case study airport. Attempts have also been made to categorize flight delays into original delay, also known as new formed delay, and propagated delay [9,16,17]. The first flight flown by an aircraft in a day is considered to be merely impacted by the original delay, while other flights can both engender original delay and receive delay propagated from upstream flights.
Empirical modeling and analysis have been performed to explore the impact of various factors on flight departure delay. Airlines tend to show a significant difference in their preferences and reactions to Ground Delay Program (GDP) design as well as turnaround time. In the United States, airlines negotiate their GDP with the authorities, which may affect whether an airline’s flights are released on time or subject to delay on the ground [18]. Lubbe and Victor discover a significant relationship between severe delays (more than 15 min), day-of-week and period-of-day [19]. The authors find out that in South Africa, Wednesday, Thursday, and Friday are more likely to be affected by severe delays in the week, with Wednesday hit the hardest. In addition, the two rush-hour periods, 5–9 a.m. and 3–7 p.m., have the highest number of delayed flights. Other research has further explored the impact of meteorological factors on flight departure delay by incorporating weather conditions. The models use the historical airport performance and actual weather/scheduled traffic data, which are identified as having correlation with National Airspace System (NAS) delays [20,21].
While the above review shows that flight delay propagation has been statistically modeled in the existing literature, the distribution characteristics of flight delays have not been considered. In this paper, an econometric analysis is performed to investigate the influence of various factors exerted by the distribution of flight departure delay. The results from estimating the econometric models contribute to better understanding how much time passengers need to spend waiting while a departing flight is delayed, and in which situation a wide range of delays would occur. In addition, the results can assist airlines with flight schedule adjustment under different delay circumstances.

3. Departure Delay at PVG

This paper uses flight operation data in August of 2016 at Shanghai Pudong International Airport (PVG), the second busiest airport in China in both flight and passenger traffic. We analyze flight departure delay at gate, which is calculated as follows:
D D = A D P T S D P T
where D D denotes departure delay at gate; A D P T denotes Actual Departure Time; A D P T denotes Scheduled Departure Time. It is noteworthy that the negative departure delay means that a flight departs at an earlier time than scheduled.
By applying Equation (1), the calculated departure delay of each departing flight from PVG can be obtained. Figure 1 shows the distribution of flight departure delays in 2016 at PVG. Delays are divided into short delays (less than 15 min) and long delays (greater than 65 min) [4]. Based on this, delays over 240 min are defined as extreme delays in this paper, which amount to the top 1% in our dataset. Therefore, four categories are presented in Figure 1a. Cumulative probability plot (Figure 1b) is used to present more detailed informations of departure delays. It can be seen that more than 30% of the flights are affected by departure delays. However, the average delay remains quite large, at 18.7 min across all delayed and non-delayed flights. More than 10% of flights are delayed by more than one hour. In particular, the average delay per flight amounts to 180 min among the flights with a delay of over two hours. Although the flights with severe delays, over 4 h, account for as low as roughly 1%, they entail a substantial amount of costs to airlines. In fact, these flights, despite making up only 1% of the total number of flights, account for as much as 12% of the total departure delay minutes at PVG. The longer the delay, the more detrimental to the integration of airline operations and service quality.

4. Model Specification

To analyze delay propagation-related and other factors regarding their impact on departure delay, we specify the base econometric model as Equation (2). The specific variables considered in the model specifications are listed in Table 1.
Departure Delay = f(Delay propagation-related factors, other factors)

4.1. Delay Propagation-Related Factors

The departure delay of a flight is influenced by a number of factors. Among them, three factors relate to delay propagation: (1) arrival delay of the previous flight of the same aircraft; (2) aircraft turnaround prior to departure; and (3) whether the flight is the first one flown by an aircraft. The hypotheses associated with the three factors are that, everything else being equal:
  • The longer the arrival delay of the previous flight, the more likely that the arrival delay of that flight will propagate to the flight under study;
  • The larger the amount of ground buffer prior to departure, the greater the capability of the ground buffer to absorb the arrival delay of the previous flight and any new delay that occurs during ground operations. Consequently, delays are less likely to propagate to the departure of the flight under study;
  • If a flight is the first one flown by an aircraft in a day, then the flight departure is unlikely to receive propagated delay from earlier operations (which would be from the previous day). Consequently, the flight’s departure is less likely to suffer delay (as shown in Table 2)
The first and third factors are easy to quantify. Characterizing the second factor is less intuitive, as it involves the measure of ground buffer. In principle, the buffer is measured as the difference in the amounts of time that are scheduled and needed if operating unimpeded [5,22]. Accordingly, ground buffer is calculated as the scheduled turnaround time, i.e., the difference between the scheduled departure time of the flight under study and the scheduled arrival time of the previous flight, minus the Minimum Connection Time (MCT). In China, MCT is given by the CAAC, and varies by airport and aircraft size [23]. Table 3, below, provides the MCT values for different aircraft sizes at PVG. If the difference is negative, we consider that ground buffer is zero.
The distribution of the calculated ground buffer based on MCT (thus by aircraft size) is shown as boxplots in Figure 2 (as there were no flights with 40-min MCT in our records, only three categories are presented in the Figure 2). As a larger MCT is associated with a larger aircraft size, we observe a negative relationship between aircraft size and ground buffer. This implies that all else being equal, a flight with a larger aircraft would be more vulnerable to delay propagation than a flight with a smaller aircraft size.

4.2. Other Factors

Flight departure delay is not only affected by factors affecting vulnerability to delay propagation, but also by other, factors related to the macroscopic flying environment and flight-specific characteristics. As our focus is in flights departing from one airport (PVG), the macroscopic flying environment is mainly captured by the level of congestion, weather conditions, and time of flight departure at the airport. For flight-specific characteristics, we include indicators of the airline to which the flight under study belongs and the aircraft type. We detail these factors below.

4.2.1. Airport Congestion

The overall level of airport congestion affects the probability of a flight’s ability to depart on time. In this paper, we introduce an airport congestion variable, which is defined as the total departure delay of flights whose scheduled departure time is within 60 min prior to the scheduled departure time for the flight under study. Figure 3 presents boxplots of the airport congestion variable, by dividing airport congestion into four groups: less than 300 min, between 300 and 600 min, between 600 and 900 min, and greater than 900 min. As presented in Figure 3, the 25th, 50th and 75th quantiles of each boxplot increase with airport congestion accumulating. This means that the more severe the airport congestion, the more delays flights will suffer.

4.2.2. Weather Conditions

Weather complications and frequent changes significantly impact flight operations. According to China’s civil aviation regulations, take-off is prohibited in case of convective weather, which refers to thunderstorms with heavy rain, as it has a potential to cause severe flight delays. Convective weather could even affect the clearance separation, thus leading to widespread traffic jams and flight delays. Due to the serious threat posed to in-flight safety, the more severe the thunderstorms and heavy rain, the longer the separation between flights for departure, which could end up resulting in grounding aircrafts in very severe conditions. This leaves many flights waiting for departure and causes ground delay as a consequence.
Weather conditions play a significant role in flight operations at PVG. In this paper, our focus is placed primarily on thunderstorms. There were four thunderstorm periods at PVG in August 2016, obtained by METAR. From Table 4, it can be seen that the majority of flights scheduled for these periods suffered long delays, especially the second period, which resulted in an average delay of nearly two hours.

4.2.3. Time Effects

Two variables are introduced to capture the time of flight departure. First, we consider a binary variable indicating whether the scheduled departure is within the daytime (taking value one), which is defined as between 6 a.m. and 8 p.m. Generally, a higher density and complexity of flight operations at an airport occurs during the daytime, resulting in a greater propensity for flight demand to exceed airport capacity and thus delay when a flight departs from the airport.
The second variable is also binary, indicating whether the day of scheduled departure is a weekday (taking value one) or not. Again, weekdays are characterized by more flights and thus more air traffic congestion in the macroscopic environment. Therefore, a flight flying on a weekday is expected to suffer more departure delay than a flight during the weekend.

4.2.4. Airline and Aircraft Effects

Many airlines have flights flying out of PVG. These airlines employ different operation strategies, resulting in differences in the management of flight delays. For example, CAAC, ATM, PVG, and airlines with a base in PVG establish a committee for cooperative management of flight on-time performance [24]. More particularly, we conjecture that if an airline is headquartered in the city where the airport is located (in our case, Shanghai), then the airline may receive better ground services from their hub airports and support from ATC which can be conductive to reducing flight departure delay [25]. This effect, on the other hand, may be at the expense of the lower priority given to flights not based in PVG and thus greater delays of those flights. In our study, the China Eastern group (China Eastern Airlines, Shanghai Airlines, and China United Airlines), Spring Airlines, and Juneyao Airlines have their headquarters at PVG.
Besides the airline effect, other effects may come from aircraft size. Flights flown by larger aircrafts have more passengers onboard, suggesting greater importance especially when on-time performance of passengers is concerned. In addition, wake turbulence separation is another important reason to distinguish wide body aircrafts from other aircraft types. To this end, an aircraft dummy, WideBody, is introduced, taking value one if the aircraft of the flight under study has a wide body. Aircraft types with twin-aisle, such as A310, A330, A340, A380, B747, B767, B777, and B787, fall into this category. For other aircraft types, the dummy variable takes value zero.

5. Data

5.1. Data Source

Domestic flight data were collected from the CAAC for August 2016 in PVG. The dataset includes detailed daily operation information for each flight. In order to analyze how convective weather conditions impact on the departure delay, weather records in August were referenced to conduct this research. As for weather conditions, weather records from METAR (Meteorological Terminal Aviation Routine Weather Report) were used to conduct research on the occurrence of thunderstorms near the airport. As for the frequent thunderstorms in August at PVG, this analysis is effective in determining whether the apparent positive trend observed in departure delays in the summer is associated with the convective weather conditions.
Based on the aircraft model information acquired from the Civil Aviation Aircraft Database of China, two aircraft types, narrow-body and wide-body, are taken into consideration in this paper. The aircraft type and weather information are then merged into the flight operation dataset by matching aircraft tail numbers. With the merged dataset applied, the ground turnaround time and departure delays in the previous one hour are calculated for each flight.

5.2. Data Filtering

To ensure the reliability of data for model estimation, data filtration is required to eliminate erroneous recording, such as missing or inconsistent historical flight data and meteorological data. These abnormal data could hinder the regression analysis and thus should be removed from the dataset. The detailed filtering process involves two steps as follows:
Step 1: Missing data filtering. The original data contain incomplete information, which is possibly related to the approach to data collection, means of transmission, and transmission path. The missing data could also result from abnormalities caused by different coding modes of the same data by multi-processors. For example, flights for which the actual arrival time is empty in the dataset are treated as canceled flights and are deleted in this paper. Some of the crucial attributes of data in such original databases as Actual Departure Time, Actual Arrival Time, Actual Departure Airport, Actual Arrival Airport, Aircraft Registration Number, etc. are either missing or incorrect. Such data are deleted.
Step 2: Inconsistent data filtering. It is possible for inconsistent data generation, resulting in recording errors. Though such records in the dataset are complete, they are neither reasonable nor consistent. For example, a flight’s departure time was earlier than the arrival time of its previous flight leg. The canceled and diverted flights are further removed due to the possibility that these records are subject to inconsistent recording. These records are also treated as noise for deletion.
After the filtering process, the dataset for model estimation contains 10,081 flight operation records. The total number of aircraft from more than eleven carriers is 1531. The descriptive statistics of the variables are presented in Table 5.

6. Estimation and Discussion

6.1. Estimation Method

Considering the irregular distribution of the response variables, the quantile regression method is applied to model the departure delay on different percentiles of departure delay, while OLS regression is taken as a benchmark. The resulting coefficients yield elasticities with regard to the continuous explanatory variables. The OLS model equation is represented as follows:
Y = b 0 + b 1 A r r D e l a y _ P r e F l t + b 2 D i f _ T T + b 3 F i r s t F l i g h t + b 4 C u m D e p D e l a y + b 5 C o n v e c W e a t h e r + b 6 D a y t i m e + b 7 W e e k d a y + b 8 A i r l i n e B a s e + b 9 W i d e B o d y + ε
The QR model equation is represented as:
Y p = b 0 p + b 1 p A r r D e l a y _ P r e F l t + b 2 p D i f _ T T + b 3 p F i r s t F l i g h t + b 4 p C u m D e p D e l a y + b 5 p C o n v e c W e a t h e r + b 6 p D a y t i m e + b 7 p W e e k d a y + b 8 p A i r l i n e B a s e + b 9 p W i d e B o d y + ε p
where Y represents flight departure delay; b 0 indicates the intercept; b 1 , , b 9 denote the slopes of the covariates; and ε refers to the error term. In the QR model specification, p denotes the p th quantile. Equation (3) gives one coefficient for each variable. In OLS regression, ε is assumed to be Identical Independent Distributed (IID) across observations with a zero mean and constant variance. Our preliminary investigation, by performing the White test, suggests that error heteroskedasticity could be present. To mitigate this issue, OLS was performed together with the White heteroskedasticity consistent estimator [26]. For Equation (4), a separate equation was specified and estimated for each quantile. Considering that severe delays always result in a large amount of costs to the civil aviation industry, three quantiles were added above the 90th quantile to investigate how severe a delay can be caused. Therefore, twelve quantiles are taken into consideration in the paper: 10th, 20th, 30th, 40th, 50th, 60th, 70th, 80th, 90th, 93rd, 96th, and 99th percentiles.
In this paper, quantile regression is adopted to capture the tail features of the distribution, which is a significant characteristic and represents a serious problem in airline operations. Compared to OLS regression, the QR estimator is regarded as a consistent estimator in the presence of heteroskedasticity or non-normally distributed errors. Therefore, QR can be used to analyze the change in coefficients with quantiles even in the skewed tails.

6.2. OLS Estimation Results

The estimation results are shown in Table 6. Over the course of estimating the departure delay model as specified below, the coefficients obtained from the OLS model invariably manifested the anticipated signs and were of statistical significance. 
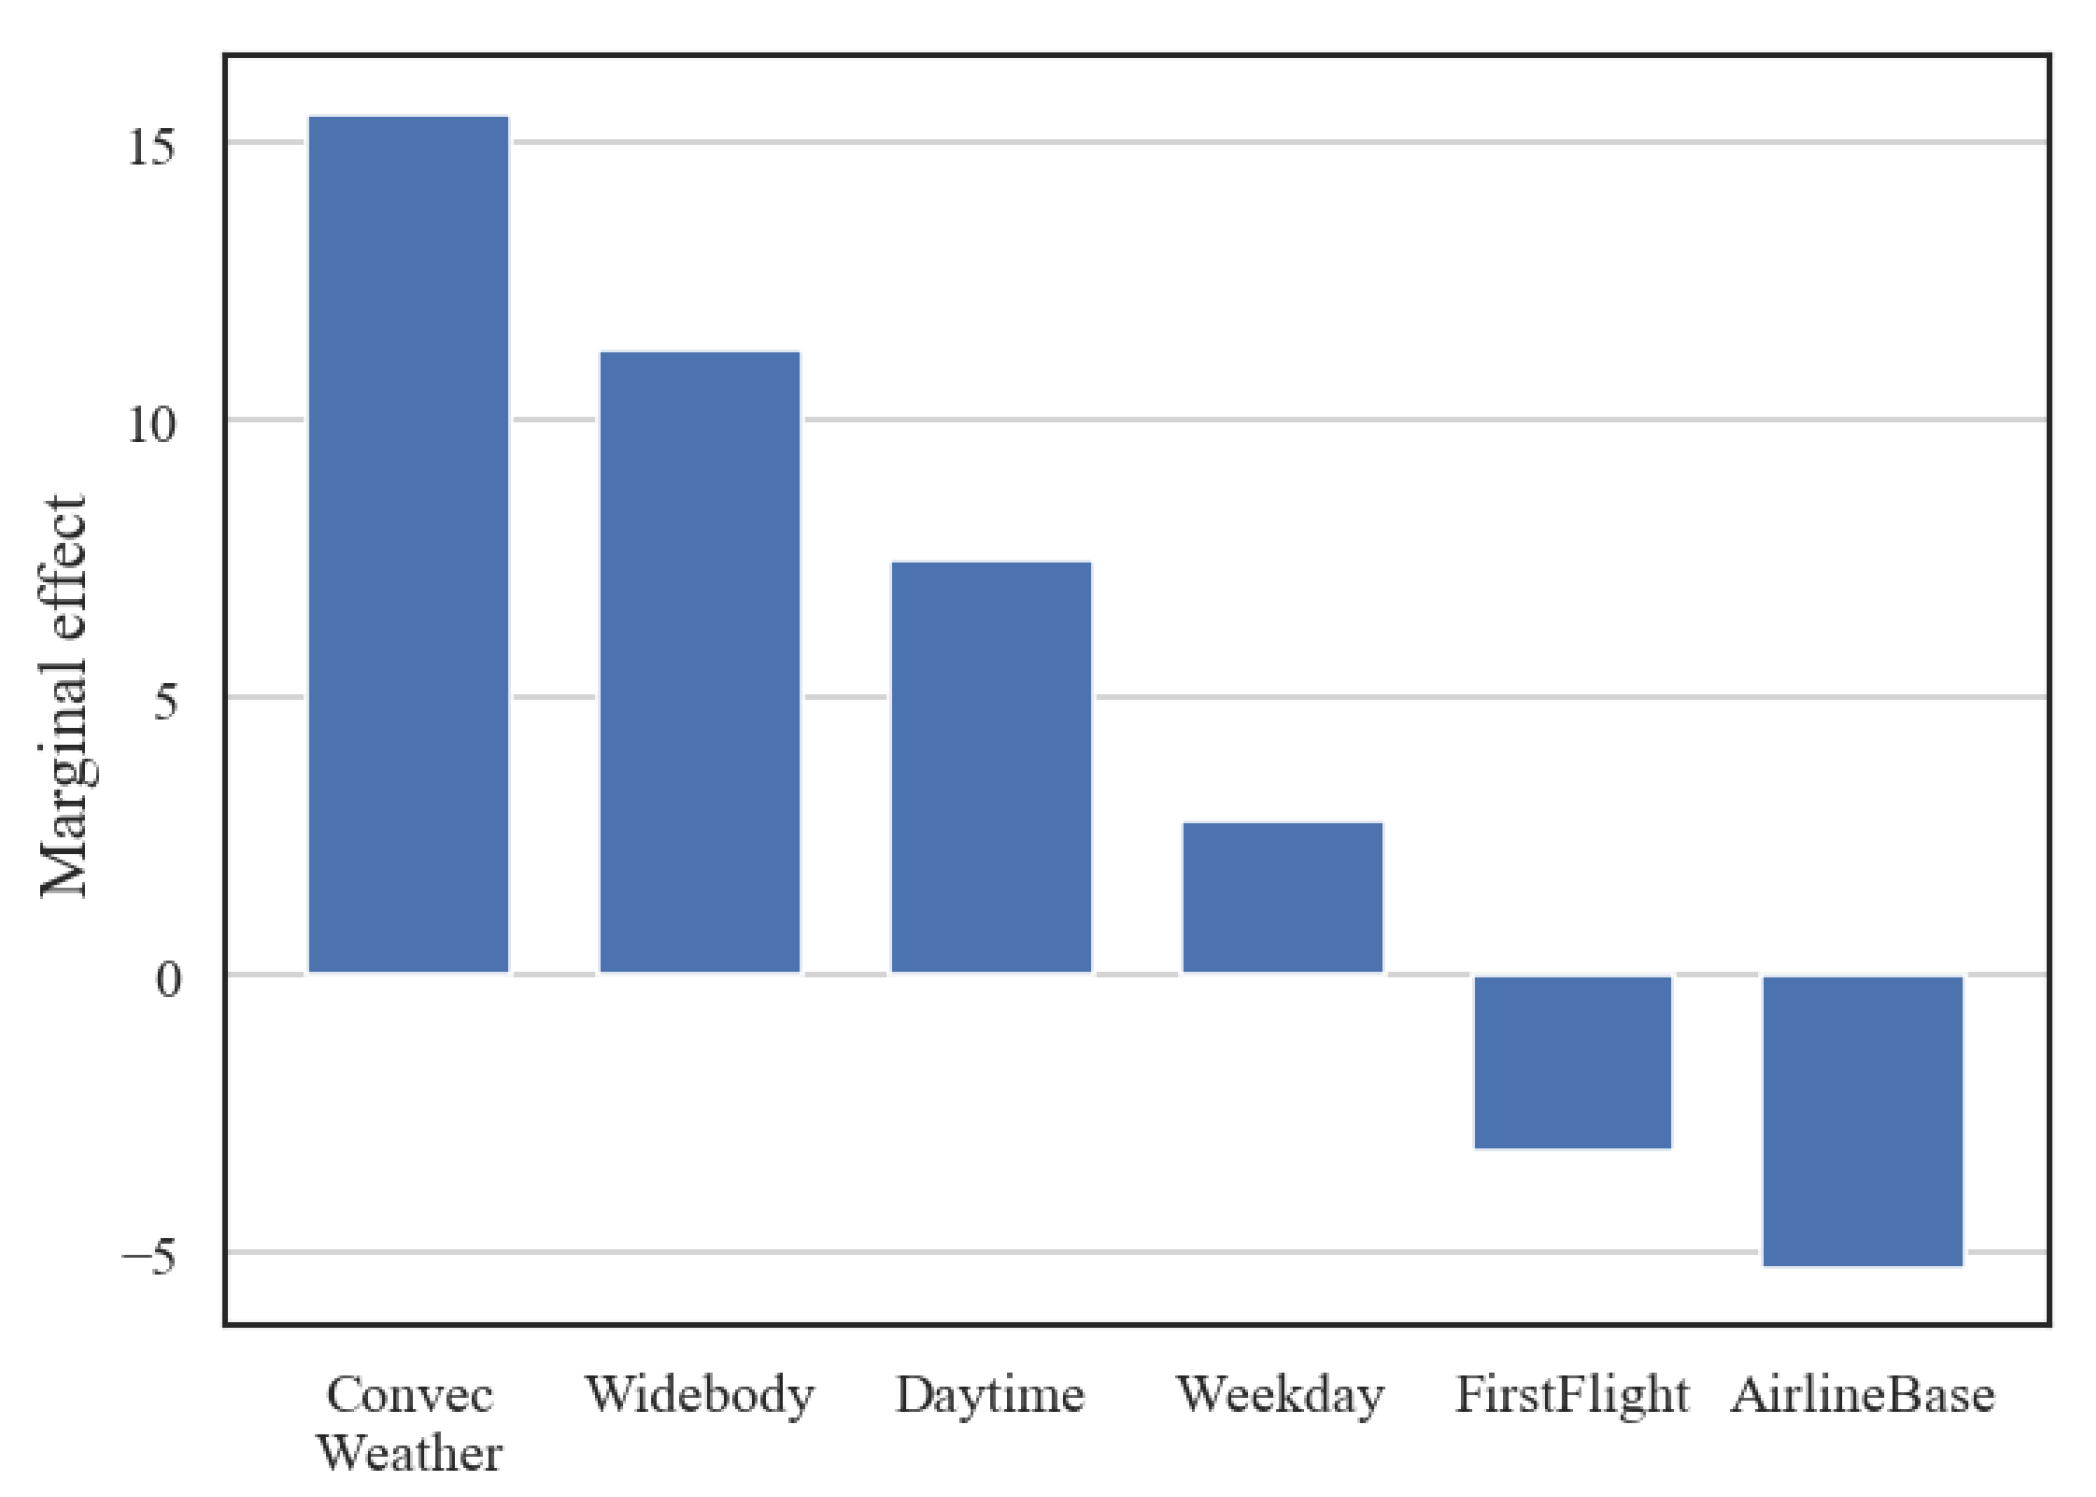
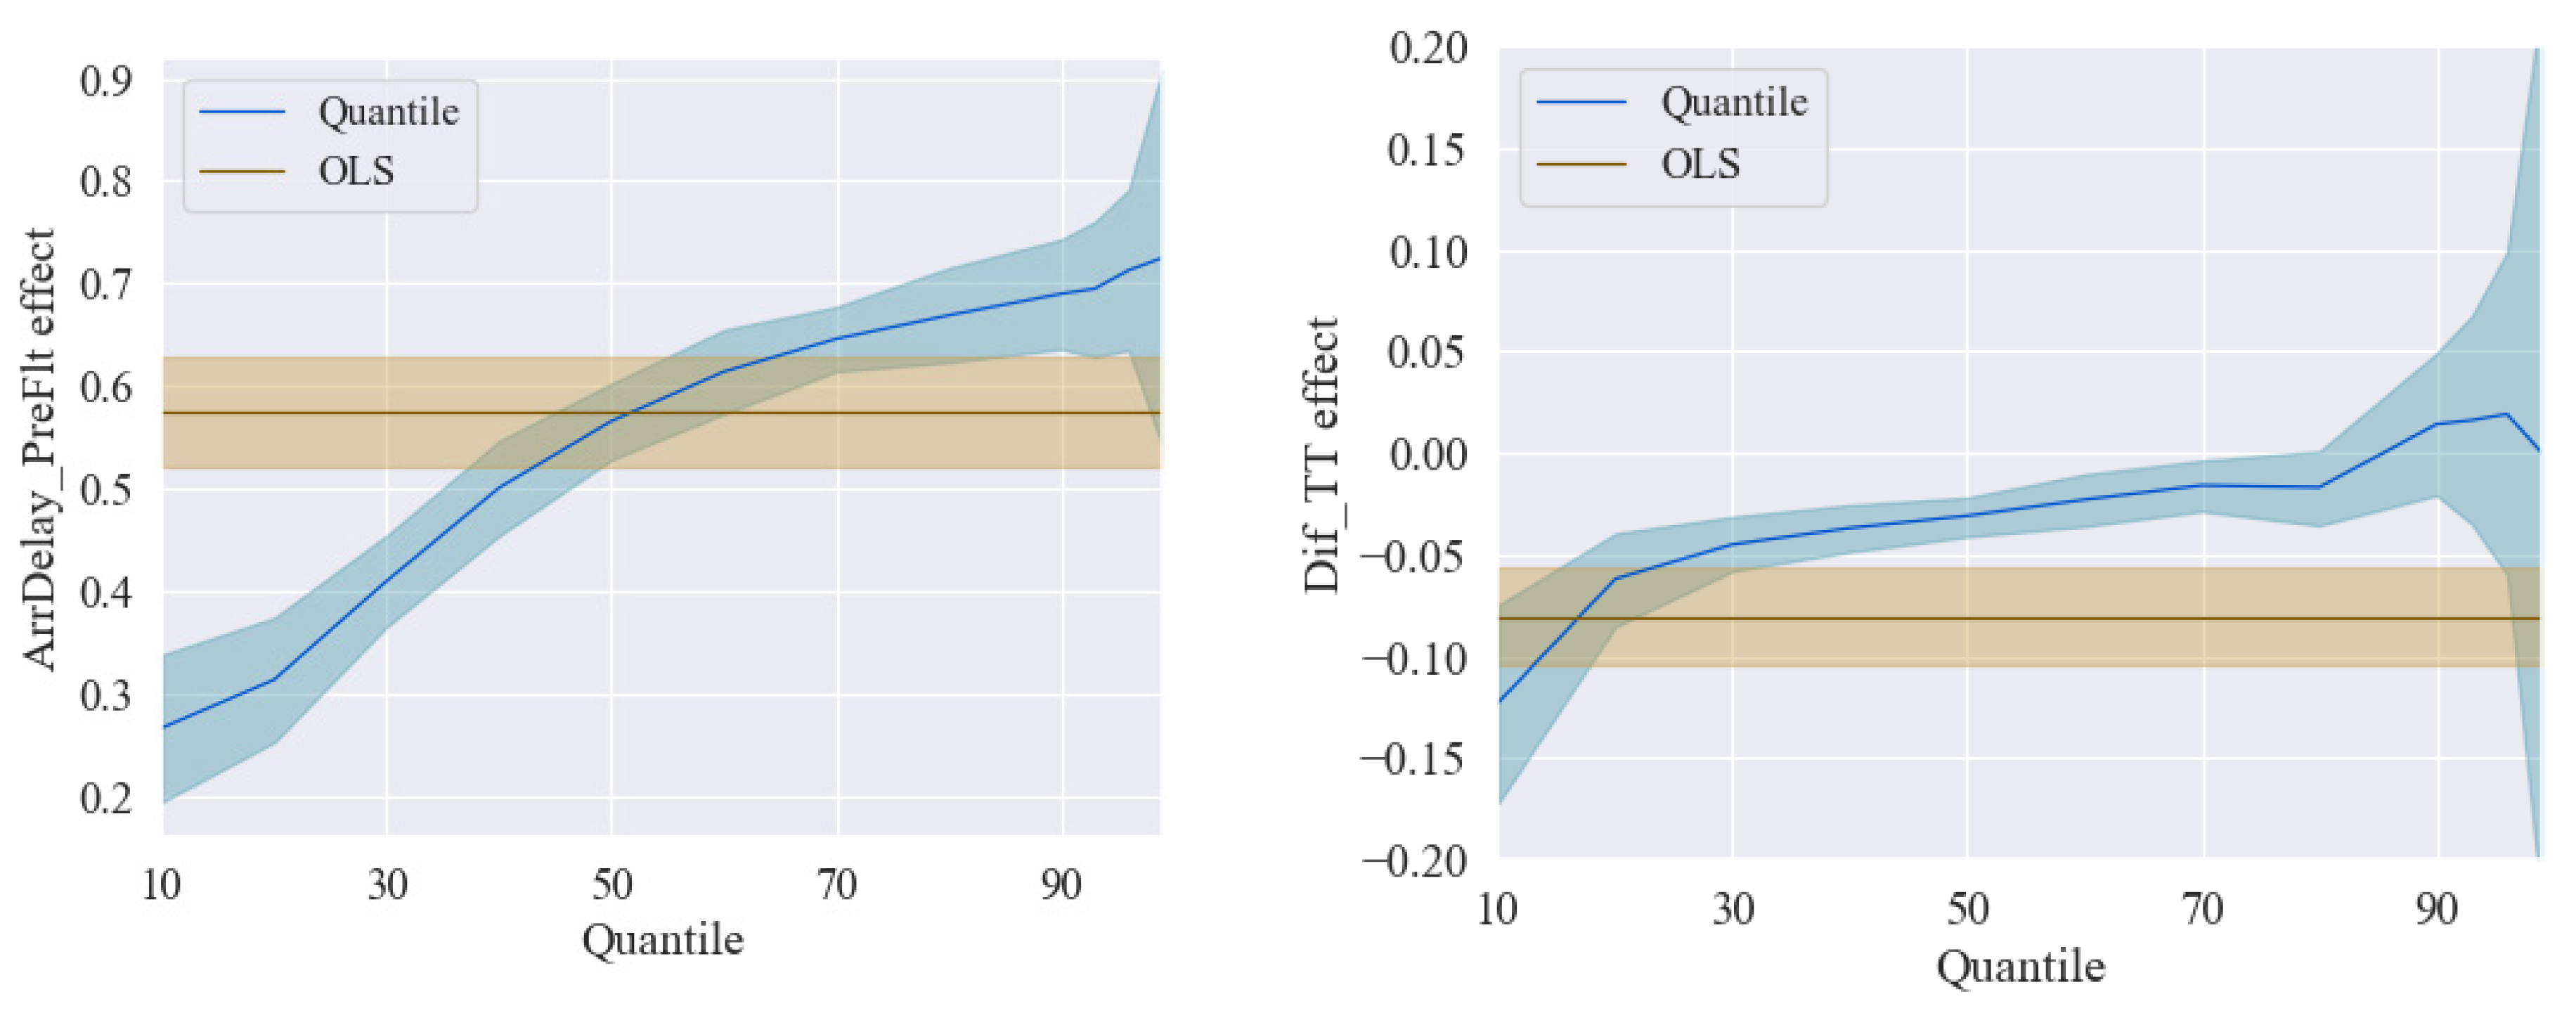
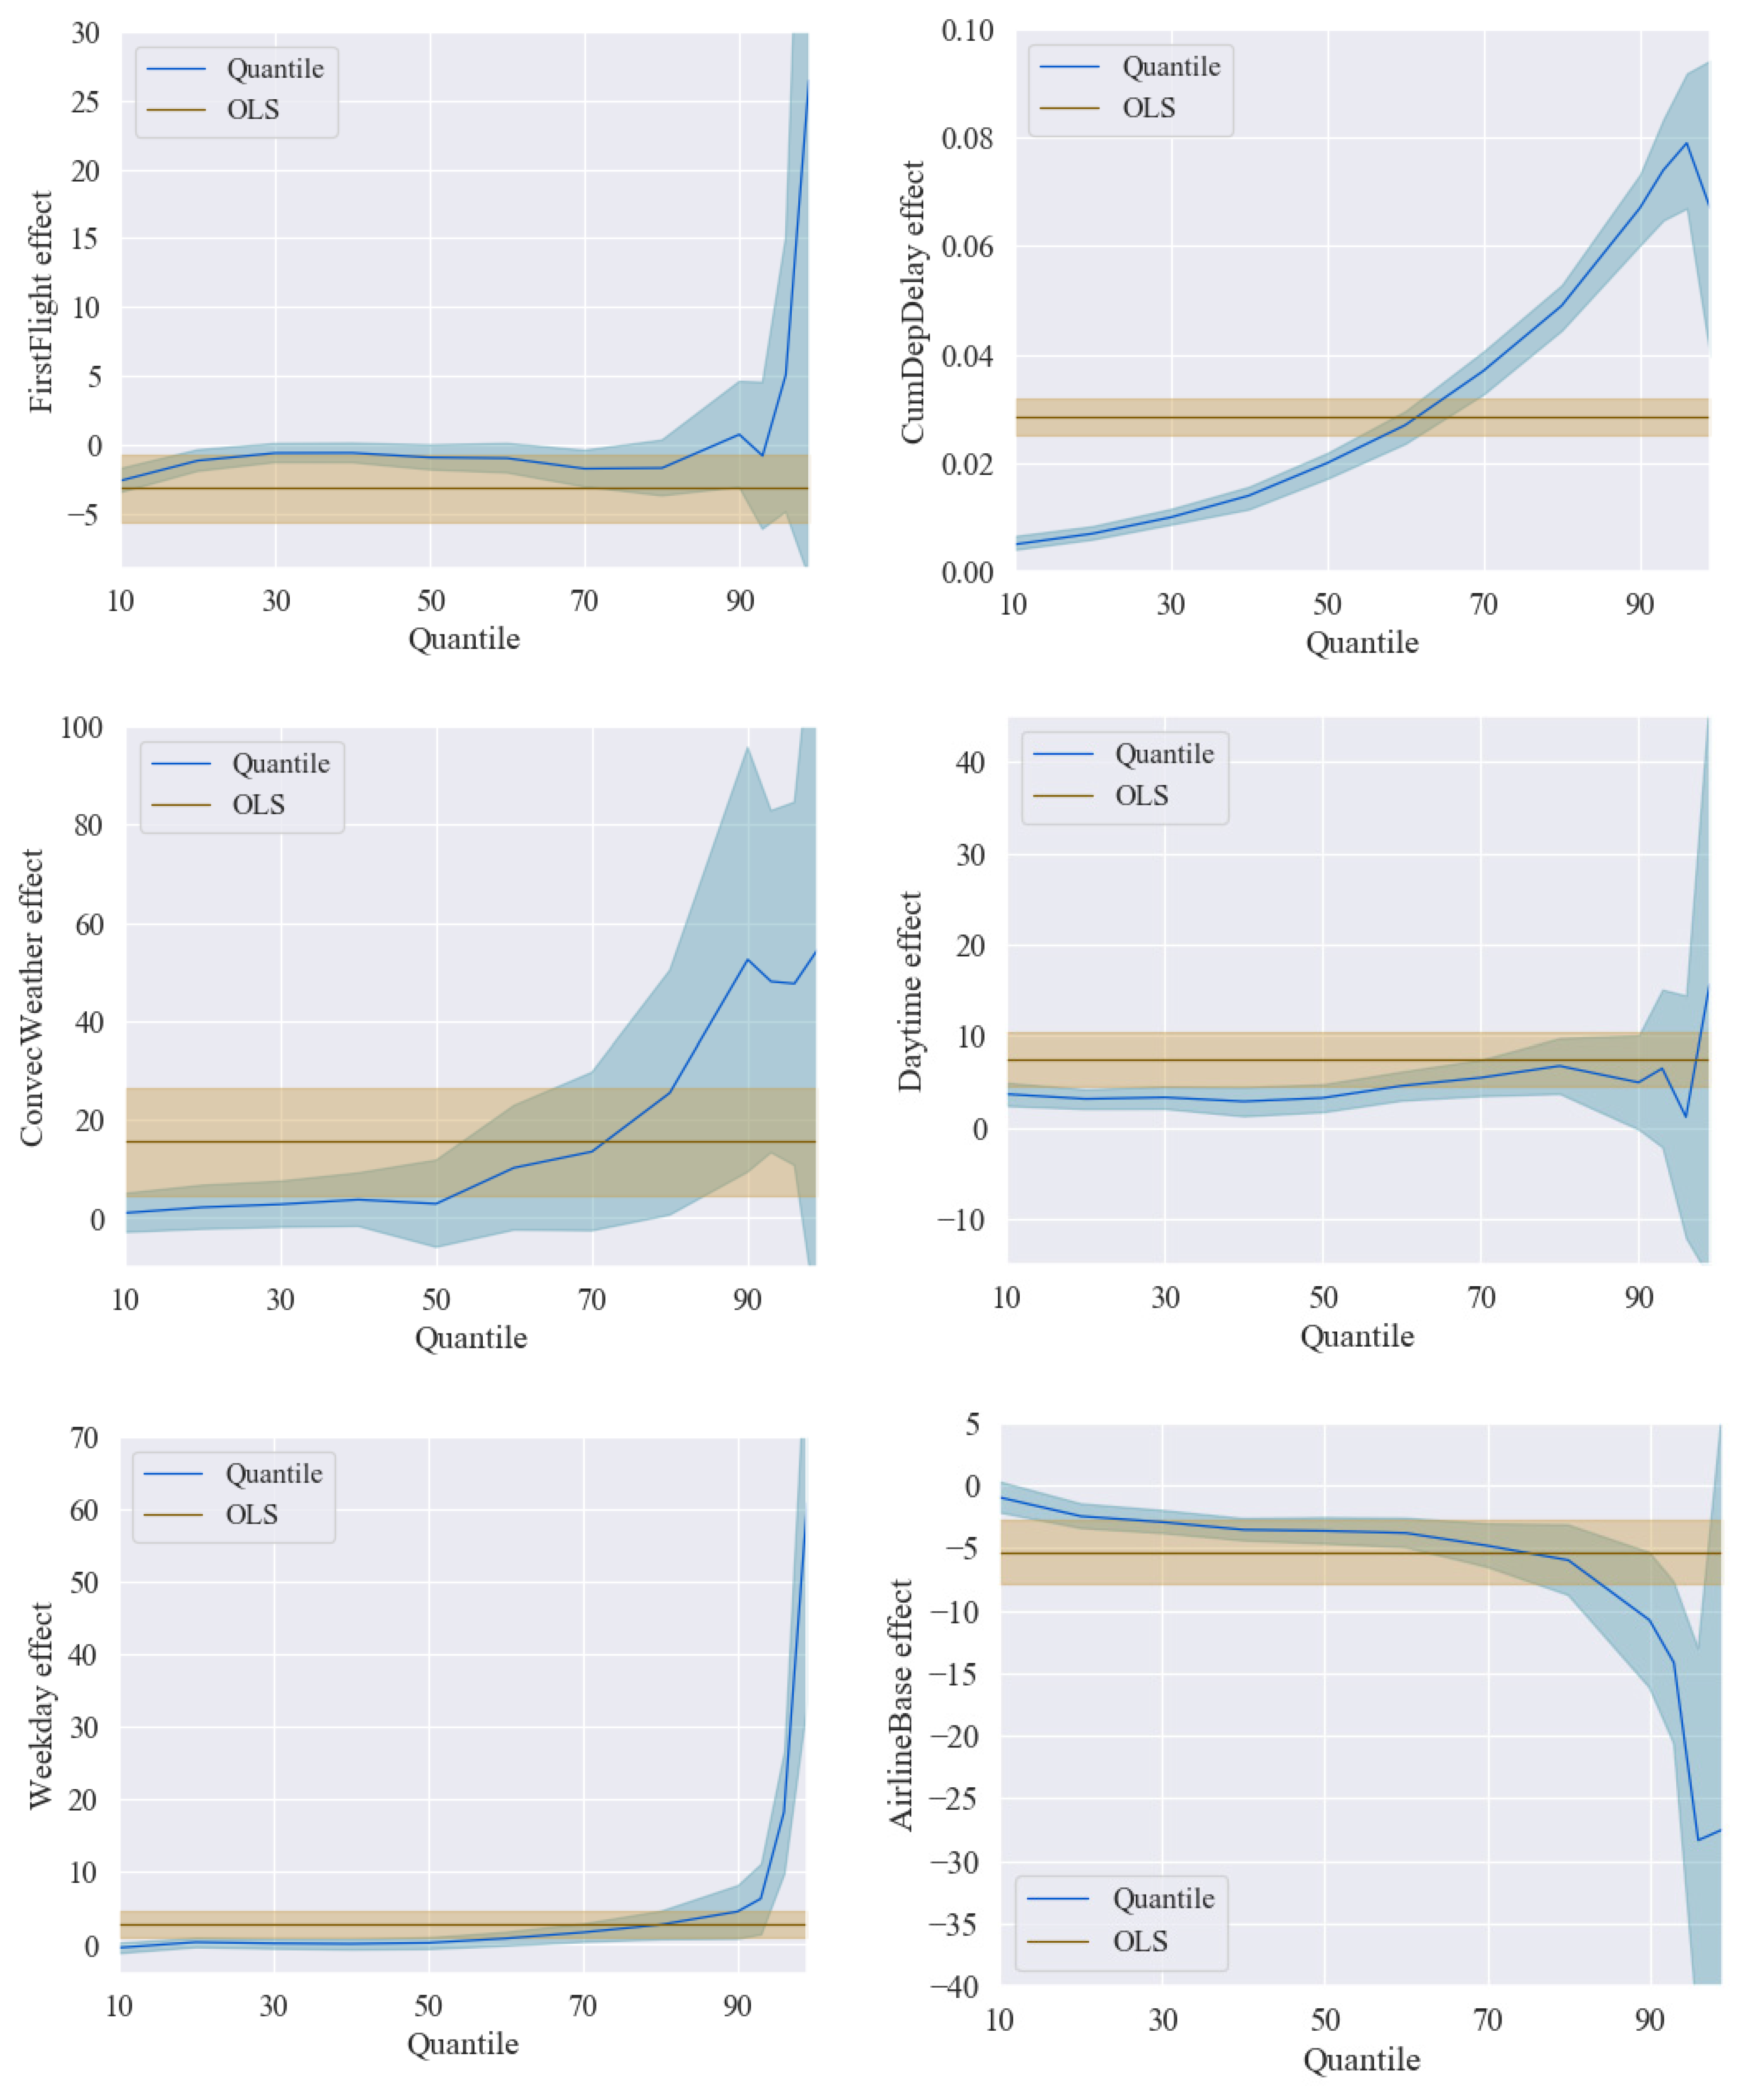
Figure 4 shows the impact of all the dummy variables. The signs of coefficients were expected for these variables.
A variety of delay propagation-related factors, including ArrDelay_PreFlt, Dif_TT and FirstFlight, demonstrate the impact of the previous flight due to the chain effect. There is a possibility that the previous arrival delay of an aircraft might propagate to the next flight leg if the turnaround time is limited. As shown by the result in Table 6, a minute of ArrDelay_PreFlt will lead to 0.575 min (p < 0.01) of departure delay, which suggests that a 100-min arrival delays tend to cause the next departure to suffer a 1-hour delay. There is another crucial delay propagation-related factor, that is, ground buffer time—or Dif_TT, in this paper. It explains how the previous arrival delay of an aircraft is absorbed during the turnaround time. In addition to the MCT of each flight, the buffer time will be applied to recover some previous arrival delays. One minute of buffer time will lead to the reduction of 0.081 min (p < 0.01) of the departure delay. If a flight is allowed an hour of buffer time, only a 4.8-min departure delay can be reduced, on average. Supposing that a flight is in the first order of a day, it will suffer no previous arrival delays. In the absence of delay propagation-related effects, a flight is more likely to be punctual. The estimation shows that flights in the first order will take 3.178 min less on average.
CumDepDelay variable is used to capture airport congestion for departure delays. The accumulated departure delays at an airport for the previous hour might also to propagate to a scheduled flight. Despite not being operated by a single aircraft, these flights share the same airport and terminal areas. It is likely that a more congested airport means a longer queue for flights to take off. As revealed by the estimation result, CumDepDelay will lead to 0.029 min (p < 0.01) of departure delay per minute of airport accumulated delay, which implies that if there are 100 min of CumDepDelay, a flight will face 2.9 min of departure delay. According to the CAAC rules, flights are prohibited from take-off when facing convective weather conditions. As shown in Table 6, the anticipated result is listed for ConvecWeather effect. It causes an additional 15.519 min (p < 0.01) of departure delay and is the dominant variable in all the dummies, which is consistent with the strict requirements of the CAAC.
The daytime variable is used to determine whether a flight scheduled for departures in the daytime, since operating in the busy period, could suffer more delays. It is observed that each flight carried out in the daytime has an extra 7.479 min of delay (p < 0.01) on average. Human behavior is one of the reasons for people to choose flights operating during daytime, due to their business. Another time variable, weekday, also causes 2.776 min (p < 0.01) of departure delay. One potential reason for weekday to cause more delays is that the higher demand for people to deal with their business on weekdays leads to more severe airspace congestions.
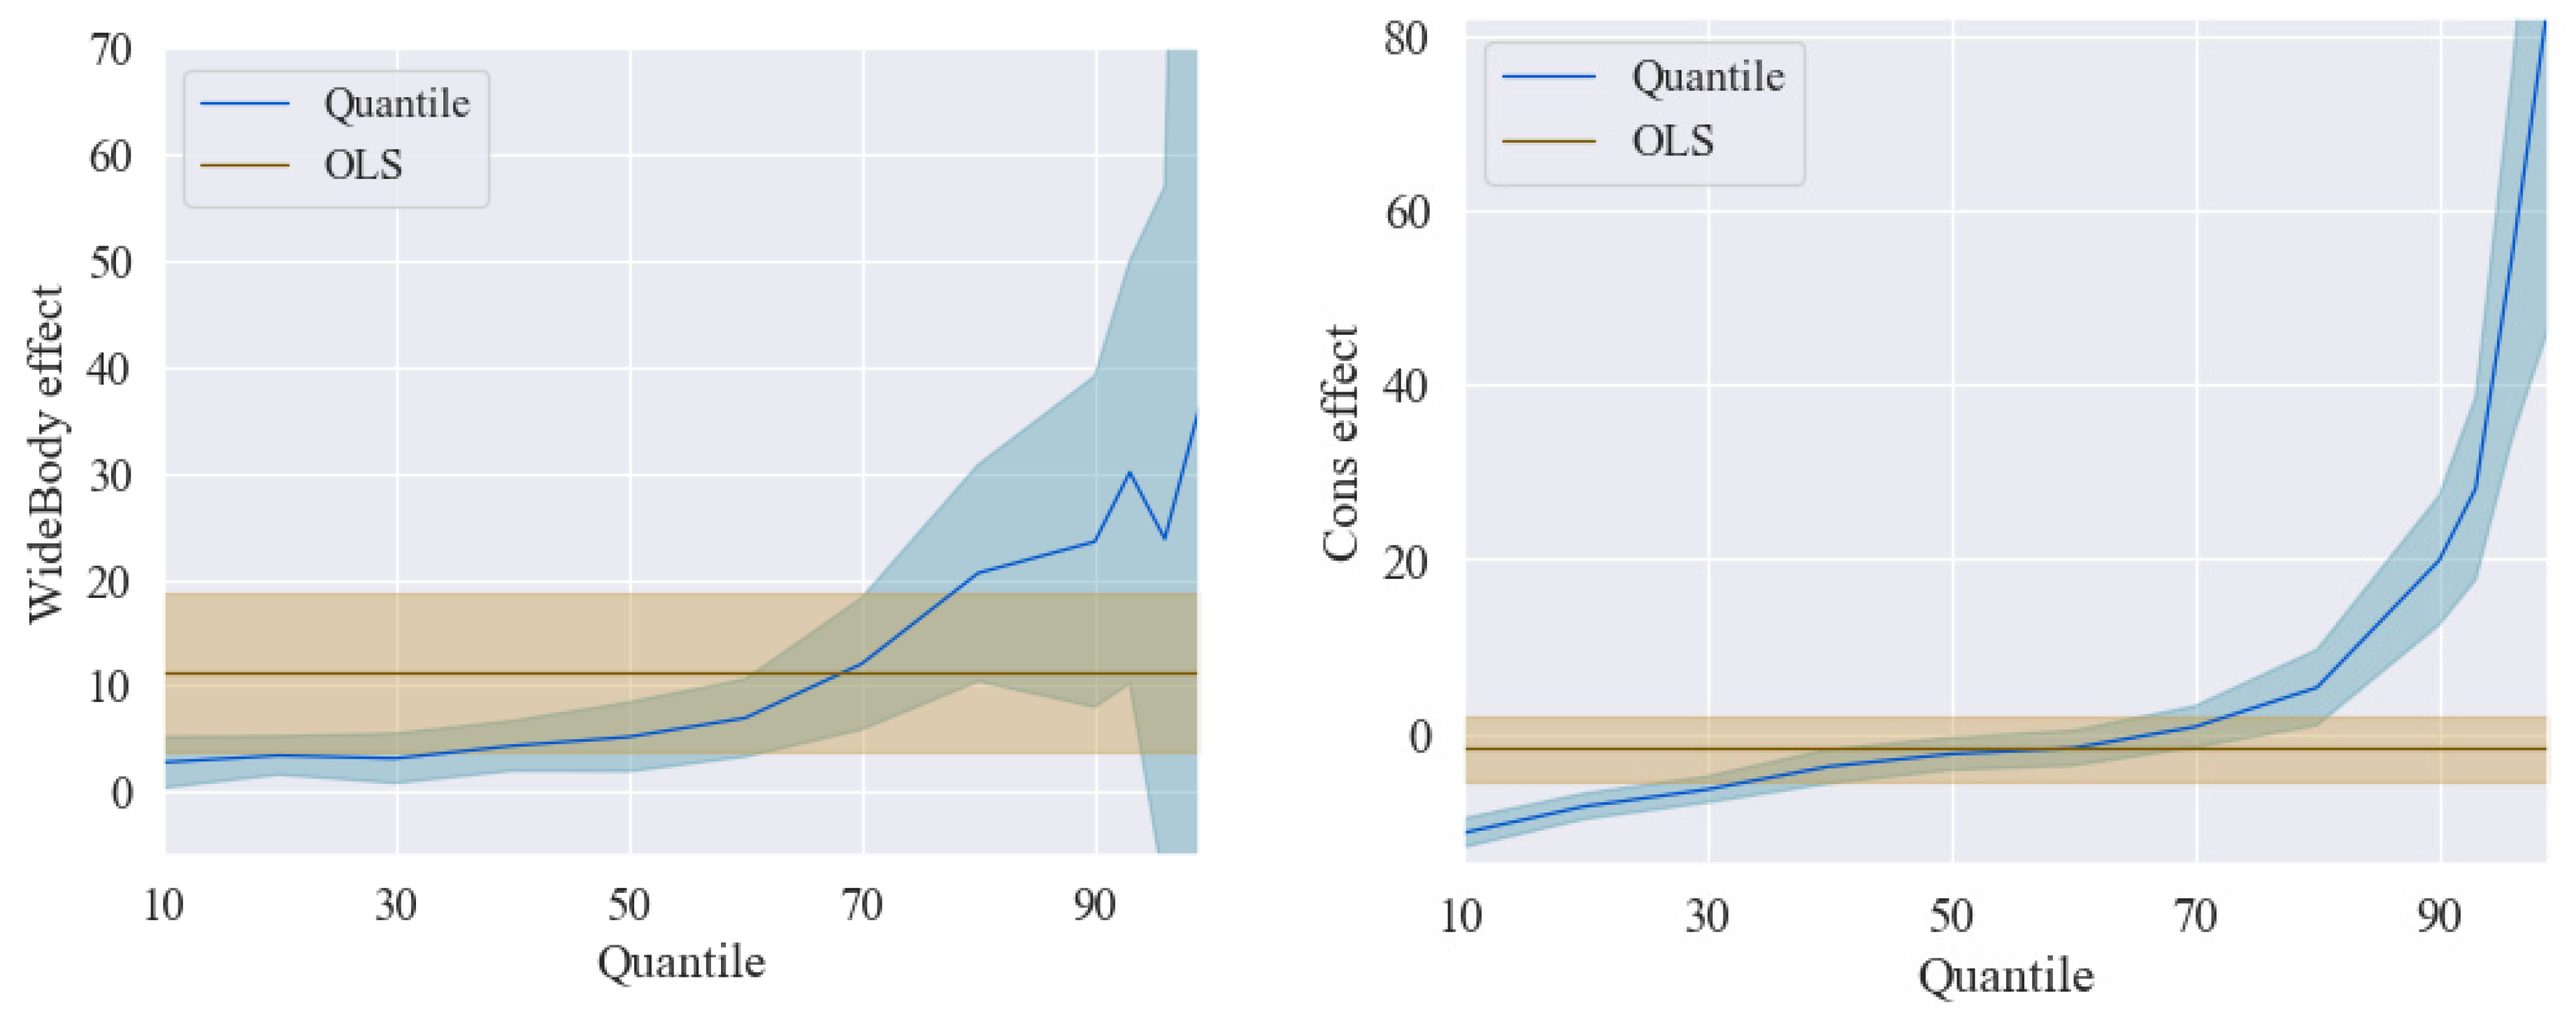
The coefficient of the AirlineBase confirms the view that having a base in an airport could reduce departure delay on average, which implies that airlines with the airport as the base have a shorter departure delay of 5.285 min on average. Wide-body aircrafts experience a longer departure delay—of 11.281 min, on average—than narrow-body aircrafts. Besides, they requires more services offered on ground, and have a larger number of passengers on board, which may extend the delay.

6.3. QR Estimation Results

QR represents an extension to the linear model, for the purpose of estimating rates of change in all parts of the distribution of a response variable. In this paper, an analysis is conducted on the departure delay distribution from the 10th percentile to the 99th percentile. A total of four quantiles are set in the long delays (from 90th to 99th), since understanding the factors that affect extreme delays is important to the prevention of such extreme situations. Table 7 presents quantile regression estimation for each of the twelve quantile models considered in this paper. According to Table 7, the changes in coefficients with quantiles are shown in Figure 5.
In this paper, quantile regression is performed by R Language [27]. In each plot of Figure 5, the regression coefficient at a given quantile indicates the effect on departure delay of a unit change in that variable, assuming that all the other variables are fixed, with 95% confidence interval bands.
Figure 5 presents a summary of quantile regression results for departure delay. For each of the nine factors, 12 distinct quantile regressions are estimated for p ranging from 0.10 to 0.99 as the solid curve with filled dots. For every single covariate, it is possible for these point estimates to be interpreted as the impact of a one-unit change of the covariate on departure delay, with other covariates remaining unchanged. Thus, each of the plots is assigned a horizontal quantile in delays to indicate the covariate effect. The orange line in each plot indicates the OLS estimation of the conditional mean effect, while the orange shadow part represents conventional 95% confidence intervals. The covariate changes with quantile, as shown in the blue line. As in OLS estimation, the blue shadow part indicates a 95% pointwise confidence band for the QR estimates.

6.4. Results Comparison

The quantile regression estimation results are listed in Table 7. Three delay propagation-related variables listed in Table 7 show different tendencies. ArrDelay_PreFlt effect continues an upward trend, but at a slower pace, especially after the average effect. It reaches the maximum at 70% marginal effect on departure delay after the 80th quantile of the response variable. Moreover, ArrDelay_PreFlt represents a statistically significant factor for the whole quantile models (p < 0.01), indicating that previous arrival delays can affect departure delay through all parts of the distribution. Dif_TT is typically significant at 10% level below or equal the 80th quantile (p < 0.1). Nevertheless, the delay reduction effect is mitigated with the increase of quantile. Notably, the Buffer effect enters an area with a positive sign in the right tail. Moreover, the coefficients after the 90th quantile are made insignificant, suggesting that more buffers are incapable of taking delay recoveries better for long delays. Therefore, it is not regarded as an effective way to allocate more buffers to improve on-time performance for flights facing long delays. FirstFlight overweighs relative to short and median delays, with significant estimations from the 10th to the 80th quantile (p < 0.01, p < 0.05 or p < 0.1 respectively). The significant part matches the common sense, and the negative effect is shown, which indicates that the first-order flights suffer less delays.
Turning now to other variable impacts, airport congestion is represented by CumDepDelay. Severe delays at an airport are speculated to bear relation to some unexpected situations, such as airspace congestion, terminal area congestion, or air traffic management procedures. Furthermore, the significance of all QR estimations reveal that flights are easily affected by the state of airport traffic (p < 0.01). After the cross of two type of regression curves, the impact of CumDepDelay increases at a faster pace, except for the extreme delay.
Convective weather makes a huge impact from the 70th to the 96th percentile, reaching the mean effect between the 70th and the 80th quantile. Thunderstorms contribute almost an hour (52.5 min, p < 0.05) to flight departure delay at the 90th percentile of the conditional distribution, thus reaching its maximum effect. However, ConvecWeather effect is found insignificant before the 70th quantile. This conforms to our expectations that convective weather has a higher likelihood to contribute to severe delays. It is noteworthy that the estimation at the 99th quantile is not significant, indicating that convective weather is not a contributing factor for extreme delay. One possible explanation for this situation is that some of the other unobserved factors, such as equipment malfunction or military activities, could be contributory to the extreme delay as well.
With respect to the temporal characteristics, DayTime variable is involved to characterize flights operation in the daytime (from 6 a.m. to 8 p.m.). The coefficients exhibit all positive effect, but no significant variation for all quantiles. On the other hand, the weekday effect shows a significant increase on weekdays after the 90th quantile, and even the efforts in the models are made much more moderate compared to other variables for short delays (statistically insignificant). It is worth noting that this effect is significantly enhanced and tends to be one of the major causes of an extreme delay (at the 99th quantile).
AirlineBase determines whether a flight can be obtained with better ground service. As anticipated, Airl effect bears a negative association with a continuous decrease trend on the departure delay in all quantiles (p < 0.01), except for the insignificant estimation at the 10th and 99th quantiles. Meanwhile, the coefficients in the right-tail show a steep decrease, which conforms to the fact that setting an airline base at an airport will be beneficial for airlines to reduce risks when emergencies occur. WideBody effect also exhibits an increasing trend from 2.8 min to 30 min (p < 0.01 or p < 0.05, respectively), although no statistical significance was found for the extreme delays, as demonstrated by the factor of airline base.
With QR analysis, variables that affect departure delay in different quantiles can be analyzed, which helps airlines study how these cause impact departure delay specifically. Moreover, it provides airlines with a different perspective to prevent flight delays. For short delays (less than 15 min), delay propagation-related factors play an important role from the 10th to the 60th quantile. Daytime, AirlineBase, and WideBody are also non-negligible factors in delays. All variables show the significances from the 70th to the 80th quantile. Convective weather and aircraft type begin to present much more influence. Flight buffer and FirstFlight are not efficient anymore when facing long delays (above 65 min). Besides, weekday impact grows increasingly, while daytime is almost insignificant.

7. Conclusions

Understanding the influencing factors and their impact on flight delay is very important, considering the high levels of flight delay in the past decade and the projected growth in air traffic. In this paper, an empirical investigation is conducted on the effect of both delay propagation-related and other factors for flight departure delay, using flight data at Shanghai Pudong International Airport in China. The major contribution of the paper is that the effects of different factors on various levels of departure delay are analyzed and compared. Considering the distribution of departure delay, this paper specifies and estimates both ordinary least square and quantile regression models to quantify the relationship between flight departure delay at PVG and many of its important determinants, including delay propagation-related and other factors. A number of diagrams are generated to indicate the sensitivity of the impact made by various factors on the delay quantiles. To improve the flight on-time performance, airlines can adjust some of these factors, such as changing the day-of-week for departure or the aircraft type, to prevent extreme delays. The estimation results provide a clearer picture of how delay propagation-related and other factors could affect flight departure delays. The drivers of flight departure delay are distinct in various quantiles, compared to the results from previous studies in which no quantiles are considered.
Future research can be extended in a few directions. First, limited to our dataset, only one-month flight records at PVG are used in the paper. Efforts may be made to construct a larger amount of data covering more airports throughout the air traffic network in China in a year. By doing so, results would provide a broader perspective on how delay propagation-related or other factors impact flight departure delays, both spatially and temporally. Second, other factors, such as complexity network and season variables, will be introduced to our study when the system-wide air traffic records become available. Further efforts can be directed to collecting information which will improve the goodness-of-fit and interpretability of the estimated models.

Author Contributions

Conceptualization, W.W. and B.Z.; methodology, Z.Z. and B.Z.; software, Z.Z.; validation, Z.Z. and B.Z.; formal analysis, Z.Z. and B.Z.; investigation, Z.Z.; resources, M.H.; data curation, Z.Z. and M.H.; writing—original draft preparation, Z.Z. and B.Z.; writing—review and editing, Z.Z. and B.Z.; visualization, Z.Z.; supervision, W.W.; project administration, Z.Z.; funding acquisition, M.H. and Z.Z. All authors have read and agreed to the published version of the manuscript.

Funding

This research was funded by National Natural Science Foundation of China (grant number 71971112) and China Scholarship Council (grant number 201806830077).

Acknowledgments

We would like to extend our gratitude to Washington Yotto Ochieng, FREng from the Centre for Transport Studies at Imperial College London, whose constructive comments have helped us substantially improve the quality of the paper.

Conflicts of Interest

The authors declare no conflict of interest.

References

  1. World Bank. Air Transport, Passenger Carried. Available online: http://data.worldbank.org/indicator/IS.AIR.PSGR (accessed on 10 May 2018).
  2. Ball, M.; Barnhart, C.; Dresner, M.; Hansen, M.; Neels, K.; Odoni, A.; Peterson, E.; Sherry, L.; Trani, A.; Zou, B. Total Delay Impact Study: A Comprehensive Assessment of the Costs and Impacts of Flight Delay in the United States, Research Report for the U.S.; Federal Aviation Administration: Washington, DC, USA, 2010.
  3. Joint Economic Committee (JEC). Your Flight has Been Delayed Again: Flight Delays Cost Passengers, Airlines, and the US Economy Billions. Available online: https://www.jec.senate.gov/public/index.cfm/democrats/2008/5/your-flight-has-been-delayed-again_1539 (accessed on 9 October 2020).
  4. Cook, A.; Tanner, G.; Anderson, S. Evaluating the True Cost to Airlines of One Minute of Airborne or Ground Delay; Performance Review Unit; University of Westminster: Westminster, UK, 2004. [Google Scholar]
  5. Zou, B.; Hansen, M. Impact of operational performance on air carrier cost structure: Evidence from US airlines. Transp. Res. Part E Logist. Transp. Rev. 2012, 48, 1032–1048. [Google Scholar] [CrossRef]
  6. Hansen, M.; Zou, B. Airport operational performance and its impact on airline cost. In Modelling and Managing Airport Performance; John Wiley & Sons: Chichester, UK, 2013; pp. 119–143. [Google Scholar]
  7. Zanin, M.; Belkoura, S.; Zhu, Y. Network analysis of Chinese air transport delay propagation. Chin. J. Aeronaut. 2017, 30, 491–499. [Google Scholar] [CrossRef]
  8. Yang, L.; Yin, S.; Han, K.; Haddad, J.; Hu, M. Fundamental diagrams of airport surface traffic: Models and applications. Transp. Res. Part B Methodol. 2017, 106, 29–51. [Google Scholar] [CrossRef]
  9. Kafle, N.; Zou, B. Modeling flight delay propagation: A new analytical-econometric approach. Transp. Res. Part B Methodol. 2016, 93, 520–542. [Google Scholar] [CrossRef]
  10. Boswell, S.B.; Evans, J.E. Analysis of Downstream Impacts of Air Traffic Delay; Lincoln Laboratory, Massachusetts Institute of Technology: Lexington, MA, USA, 1997. [Google Scholar]
  11. Beatty, R.; Hsu, R.; Berry, L.; Rome, J. Preliminary evaluation of flight delay propagation through an airline schedule. Air Traffic Control Q. 1999, 7, 259–270. [Google Scholar] [CrossRef]
  12. AhmadBeygi, S.; Cohn, A.; Guan, Y.; Belobaba, P. Analysis of the potential for delay propagation in passenger airline networks. J. Air Transp. Manag. 2008, 14, 221–236. [Google Scholar] [CrossRef] [Green Version]
  13. Fricke, H.; Schultz, M. Delays Impacts onto Turnaround Performance Optimal Time Buffering for Minimizing Delay Propagation. 2009. Available online: http://www.atmseminar.org/seminarContent/seminar8/papers/p_153_AO.pdf (accessed on 10 November 2020).
  14. Wong, J.T.; Tsai, S.C. A survival model for flight delay propagation. J. Air Transp. Manag. 2012, 23, 5–11. [Google Scholar] [CrossRef]
  15. Tu, Y.; Ball, M.O.; Jank, W.S. Estimating flight departure delay distributions—A statistical approach with long-term trend and short-term pattern. J. Am. Stat. Assoc. 2008, 103, 112–125. [Google Scholar] [CrossRef]
  16. Churchill, A.; Lovell, D.; Ball, M. Flight delay propagation impact on strategic air traffic flow management. Transp. Res. Rec. J. Transp. Res. Board 2010, 2177, 105–113. [Google Scholar] [CrossRef]
  17. Welman, S.; Williams, A.; Hechtman, D. Calculating Delay Propagation Multipliers for Cost-Benefit Analysis; Center for Advanced Aviation System Development and MITRE MP; FAA: Washington, DC, USA, 2010.
  18. Yan, C.; Vaze, V.; Barnhart, C. Airline-driven ground delay programs: A benefits assessment. Transp. Res. Part C Emerg. Technol. 2018, 89, 268–288. [Google Scholar] [CrossRef]
  19. Lubbe, B.; Victor, C. Flight delays: Towards measuring the cost to corporations. J. Air Transp. Manag. 2012, 19, 9–12. [Google Scholar] [CrossRef] [Green Version]
  20. Klein, A.; Craun, C.; Lee, R.S. Airport delay prediction using weather-impacted traffic index (WITI) model. In Proceedings of the 29th Digital Avionics Systems Conference, Salt Lake City, UT, USA, 3–7 October 2010; p. 2-B. [Google Scholar]
  21. Chatterji, G.; Sridhar, B. National airspace system delay estimation using weather weighted traffic counts. In AIAA Guidance, Navigation, and Control Conference and Exhibit; AIAA: San Francisco, CA, USA, 2005. [Google Scholar]
  22. Britto, R.; Dresner, M.; Voltes, A. The impact of flight delays on passenger demand and societal welfare. Transport. Res. Part E Logist. Transport. Rev. 2012, 48, 460–469. [Google Scholar] [CrossRef]
  23. CAAC. Notice to Print and Distribute the On-Time Performance Statistical Methods for Civil Aviation Flights; CAAC: Beijing, China, 2012. [Google Scholar]
  24. SAA. Shanghai Airport: Resource-Oriented Construction for Flight On-time Performance Platform. Available online: https://www.shairport.com/cn/jcjt/info_53589_itemid_223343109.html (accessed on 9 October 2020).
  25. Liu, K.; Zheng, Z.; Zou, B.; Hansen, M. How Fast You Can Actually Fly: A Comparative Investigation of Flight Airborne Time in China and the US. arXiv 2020, arXiv:2001.07646. [Google Scholar] [CrossRef] [Green Version]
  26. Greene, W.H. Econometric Analysis, 7th ed.; Pearson Education: London, UK, 2012. [Google Scholar]
  27. Koenker, R. Quantile Regression in R: A Vignette. Available online: https://cran.r-project.org/web/packages/quantreg/vignettes/rq.pdf (accessed on 9 October 2020).
Figure 1. Distribution of total flights into delay category.
Sustainability 12 10553 g001
Figure 2. Boxplots of aircraft ground buffer by the minimum connection time (MCT).
Sustainability 12 10553 g002
Figure 3. Boxplots of total airport departure delay among flights whose scheduled departure time is within 60 min prior to the scheduled departure of the flight under study.
Sustainability 12 10553 g003
Figure 4. Coefficient weight of dummy variables.
Sustainability 12 10553 g004
Figure 5. Quantile regression for flight departure delay.
Sustainability 12 10553 g005aSustainability 12 10553 g005bSustainability 12 10553 g005c
Table 1. Description of variables.
VariablesDefinition
Dependent
DepDelayFlight departure delay
Explanatory
Delay propagation-relatedArrDelay_PreFltArrival delay of the previous flight
Dif_TTDifference of the scheduled turnaround time and minimum turnaround time
FirstFlightDummy, equal to 1 if a flight is not the first flight of a day
OtherCumDepDelayCumulated departure delay in the past hour of the airport under study
ConvecWeatherDummy, equal to 1 if a flight is in the convective weather at the departure airport
DaytimeDummy, equal to 1 if a flight scheduled departs in the day (6 a.m.–8 p.m.)
WeekdayDummy, equal to 1 if a flight operates in weekdays
AirlineBaseDummy, equal to 1 if the departure airport is a base of the airline to which the flight under study belongs
WideBodyDummy, equal to 1 if a flight is associated with a wide body aircraft
Table 2. The impact of the first order on flight departure delays.
Flight CategoryMean (min)Std. (min)N
First order flight8.8057.802971
Non-first order flight26.4656.807110
Table 3. Minimum Connection Time for flights of different aircraft types at Shanghai Pudong International Airport (PVG).
Aircraft Size (Number of Seats)Minimum Connection Time (min)
Fewer than 6040
Between 61 and 15050
Between 151 and 25060
Between 251 and 50075
Table 4. The impact of thunderstorms on flight departure delays.
NoDateTime IntervalScheduled FlightsDelayed FlightsAverage Delays (min)
12 August 201610:30 a.m.–11:00 a.m.12324.92
22 August 201608:00 p.m.–10:00 p.m.4442110.64
33 August 201608:00 p.m.–10:00 p.m.464182.07
419 August 201609:30 p.m.–10:30 p.m.251316.84
Table 5. Descriptive statistics for variables in the departure delay model (N = 10,081).
VariableMeanStd. Dev.Min.Max.
DepDelay21.2558.08−634726
ArrDelay_PreFlt14.2444.10−253662
Dif_TT26.7359.630440
FirstFlight0.290.4601
CumDepDelay456.81492.4404141
ConvecWeather0.010.0901
Daytime0.850.3601
Weekday0.710.4601
AirlineBase0.770.4201
WideBody0.030.1801
Table 6. Estimation results of the OLS model for flight departure delay (N = 10,081).
VariableEst.Robust Std. Err.T-Stat
ArrDelay_PreFlt0.575 ***0.02820.81
Dif_TT−0.081 ***0.012−6.60
FirstFlight−3.178 ***1.237−2.57
CumDepDelay0.029 ***0.00216.53
ConvecWeather15.519 ***5.6592.74
Daytime7.479 ***1.4645.11
Weekday2.776 ***0.9492.93
AirlineBase−5.285 ***1.322−4.00
WideBody11.281 ***3.8432.94
Const−1.6831.945−0.87
R square 0.317
*** p < 0.01, ** p < 0.05, * p < 0.10.
Table 7. Estimation results of QR models for flight departure delay (N = 10,081).
0.10.20.30.40.50.6
ArrDelay_PreFlt0.267 ***0.314 ***0.410 ***0.501 ***0.566 ***0.614 ***
Dif_TT−0.123 ***−0.062 ***−0.045 ***−0.037 ***−0.031 ***−0.023 ***
FirstFlight−2.624 ***−1.164 ***−0.615 *−0.604 *−0.931 **−0.988 *
CumDepDelay0.005 ***0.007 ***0.010 ***0.014 ***0.020 ***0.027 ***
ConvecWeather1.0292.1892.7943.7392.90710.226
Daytime3.661 ***3.136 ***3.300 ***2.859 ***3.239 ***4.564 ***
Weekday−0.4140.3400.1740.1090.2470.860 *
AirlineBase−0.952−2.455 ***−2.918 ***−3.534 ***−3.622 ***−3.794 ***
WideBody2.801 **3.454 ***3.181 ***4.352 ***5.191 ***6.975 ***
Cons.−11.376 ***−8.309 ***−6.385 ***−3.748 ***−2.304 **−1.642
R square0.0470.0630.0930.1300.1730.218
0.70.80.90.930.960.99
ArrDelay_PreFlt0.646 ***0.669 ***0.690 ***0.695 ***0.713 ***0.725 ***
Dif_TT−0.016 **−0.017 *0.0140.0160.0190.000
FirstFlight−1.748 ***−1.701 *0.736−0.8135.07026.467
CumDepDelay0.037 ***0.049 ***0.067 ***0.074 ***0.079 ***0.067 ***
ConvecWeather13.515 *25.474 **52.518 **48.054 ***47.621 *54.622
Daytime5.451 ***6.741 ***4.938 *6.4681.15315.615
Weekday1.692 ***2.743 ***4.564 ***6.335 **18.279 ***60.870 ***
AirlineBase−4.801 ***−5.964 ***−10.757 ***−14.152 ***−28.349 ***−27.486
WideBody12.067 ***20.604 ***23.552 ***30.080 ***23.80936.268
Cons.0.8025.305 **19.849 ***28.108 ***54.848 ***84.314 ***
R square0.2620.3020.3290.3310.3220.272
*** p < 0.01, ** p < 0.05, * p < 0.10.
Publisher’s Note: MDPI stays neutral with regard to jurisdictional claims in published maps and institutional affiliations.

