Article

Through Sport to Innovation: Sustainable Socio-Economic Development in European Countries

1
Department of Child and Adolescent Health, Institute of Mother and Child, Kasprzaka Str. 17A, 01-211 Warsaw, Poland
2
Department of Business Economics, Collegium of World Economy, SGH Warsaw School of Economics, al. Niepodległości 162, 02-554 Warsaw, Poland
3
Collegium of World Economy, SGH Warsaw School of Economics, al. Niepodległości 162, 02-554 Warsaw, Poland
4
Tourism Economy Research Unit, Collegium of World Economy, SGH Warsaw School of Economics, al. Niepodległości 162, 02-554 Warsaw, Poland
*
Author to whom correspondence should be addressed.
Sustainability 2020, 12(24), 10489; https://doi.org/10.3390/su122410489
Submission received: 15 November 2020 / Revised: 8 December 2020 / Accepted: 10 December 2020 / Published: 15 December 2020
(This article belongs to the Special Issue Social Capital and Sustainability: Spatial Evidence)

Abstract

:
Using clustering and principal component analysis, we demonstrate that—at the national level in Europe—innovativeness correlates strongly to both social capital and participation in sport. In this aspect, countries such as the Scandinavian countries and the countries of Central and Eastern Europe differ visibly. Referring to prior empirical research, we claim that a causal relation between sports, through social capital, and innovativeness can be established. In the context of social capital accumulation, we further discuss the role of sports clubs, often perceived as a socially intensive form of participation in sport, but most likely diminishing in this respect lately.

1. Introduction

Depending on the level of professionalism or discipline, sport can serve social functions (pro-health, development of volitional features, socialisation, education and integration) [1,2]. It is therefore an excellent platform for building social capital (SC). This fact is indicated by numerous reports [3,4,5,6,7,8] which prove the coexistence of high levels of sports activity (SA) and SC among the population of both children and adolescents, as well as adults. Involvement with sport is also positively connected with building SC in neglected and special needs environments—e.g., those with a low socio-economic status, with a criminal past, in national and religious minorities, among unassimilated immigrants or those brought up in orphanages—by fostering social integration and community development [9].
Skrok et al. [10] claim that generating SC through SA is particularly related to the relational character of social capital, including, among others, the creation of social networks. These networks may constitute a channel (apart from the effect of health status or skill level) through which positive effects may occur, e.g., on the labour market. The aforementioned relationship between the SC and the labour market constitutes nowadays an important research field, especially in the context of searching for key reasons for differences in the level of development of individual countries. Classical production factors proposed, among others, by Smith [11], i.e., land, labour and physical capital, no longer explain economic growth sufficiently. It is necessary to supplement them with the measures of human creativity and the innovations developed thanks to it [12].
One of the best known indicators of creativity is technology, talent, tolerance (3Ts) developed by Florida [13]. It is defined by the notion of a two-layer creative class. The first layer (super creative) includes scientists, university professors, engineers, designers, architects, poets, novelists, artists, writers, editors, people of culture, researchers and analysts. The second layer (creative professionals) includes the people working in knowledge-based, high-tech and financial service sectors, as well as legal, healthcare and business management professionals. Studies show that in 2015, countries such as Denmark, Finland, Iceland and the Netherlands achieved the highest scores of this very indicator among all EU countries [14]. It is noteworthy that, among the countries in the top 40, the creative class represented over 40% of the workforce.
The 3Ts index was used by S. Yum [15] to develop its innovative version—creative class, creative infrastructure, culture (3Cs). It took into account the cultural and infrastructural aspects of creativity, which were omitted from the original and are increasingly important. The comparison of both indicators is presented in Table 1.
Innovation is the key process that shapes economic development. This concept was used for the first time by Schumpeter [16], who emphasised the importance of new products and solutions. He interpreted innovation as the introduction of a novel product or its novel variety, the implementation of a new production process, the opening or creation of a new market, the use of new materials or the application of a new production organisation. A sine qua non condition to consider a given solution as an innovation is its commercialisation [17].
The most common innovation indicators include the following: Innovation Union Scoreboard, Global Innovation Index and Global Competitiveness Report. The research conducted to date, for example, by Olejniczuk-Merta [18], shows that—despite it being a long period after the political transformation (over 30 years) and continuous central co-financing of innovation—Poland still has a low position in these rankings: according to the Global Competitiveness Report (2019) [19], out of 141 examined economies, it ranks 37th; according to the Global Innovation Index (2019) [20], out of 129 economies—41st; and, according to the European Innovation Scoreboard (2019) [21], out of 35 economies (including 27 EU countries)—last but four.
The results of the pan-European innovation rankings cited above, as well as a scarce research combining sports activity, social capital and economic indicators with innovation, have led us to follow the modern approach, that the effective and efficient development of an innovative economy requires investment in human and social capital [15,22].
Therefore, we decided to explore more widely, and in the international context, the findings from the National Bank of Poland (NBP) 2016 Report [23]. The NBP report reveals that the most innovative countries, such as Switzerland and the Scandinavian countries, perform much better than Poland—both in terms of general interpersonal trust and trust in the parliament and the legal system, as well as in terms of the analysed involvement with sports/recreational organisations. This statement has become a direct inspiration to conduct this in-depth research of a confirmatory character, because the conclusions of NBP 2016 suggested a positive relationship between SC, SA and innovation. This is due to the general trust (including interpersonal trust, trust in social standards, trust in institutions), which fosters innovation and technology diffusion, and translates directly into the total productivity of classical, previously mentioned, production factors [23].
By making a hypothesis concerning the direct or indirect relationship between SA and innovation, the authors of this paper attempted a multidimensional analysis of the relationship between SA and SC and innovation among European countries.
We perceive our research as a contribution to the previously unexplored dimension of co-variability and the multidimensional relationship between sport activity, social capital and innovation. This will allow greater insight and better understanding of the social determinants of economic mechanisms and indicators.
The aim of this analysis is to verify the observations of the National Bank of Poland (NBP)—is SA, at a country level, positively related not only to the level of SC, but also to the level of innovation? The work was carried out within the framework of the National Science Centre grant No. 2017/27/B/HS4/00427 and constitutes a summary of the results of the work carried out within its scope. The interpretation of the obtained results is embedded in the context of previous analyses.

2. Materials and Methods

This paper refers to a broad definition of innovation, according to the Oslo Methodology [24]:
An innovation is a new or improved product or process (or combination thereof) that differs significantly from the unit’s previous products or processes and that has been made available to potential users (product) or brought into use by the unit (process) (op cit. page 60). Innovation is more than a new idea or an invention. An innovation requires implementation, either by being put into active use or by being made available for use by other parties, firms, individuals or organisations. The economic and social impacts of inventions and ideas depend on the diffusion and uptake of related innovations. Furthermore, innovation is a dynamic and pervasive activity that occurs in all sectors of an economy; it is not the sole prerogative of the Business enterprise sector. Other types of organisations, as well as individuals, frequently make changes to products or processes and produce, collect, and distribute new knowledge of relevance to innovation (op cit. page 44).
Therefore, the analysis incorporates a set of innovation indicators that describe private sector inputs (business expenditure on research and development—BERD, number of research and development personnel), outputs (European Patent Office (EPO) patent applications) and social context (attitude to creativity as an important feature). It was decided to omit the inputs of the public sector as, on the one hand, they are dependent on national policies and, on the other, on the condition of the state budget.
Due to the fact that the survey was conducted at the level of EU countries (including the UK), the analysed variables were of a relative character (related to e.g., gross domestic product—GDP or population size), or took the form of an average for a surveyed characteristic in a given country.

2.1. Data

The following sources of data at an aggregate country level were used in the analysis:
-
Eurobarometer 412 [25] as a source of information about sports activity and the people participating in sport in clubs in 2013;
-
European Social Survey (ESS) (2012) and (2014) as a source of data on SC and social attitudes [26,27];
-
Eurostat [28] as a source of data on innovation, GDP, population size and working conditions.
The following variables were used as measures of innovation:
-
share of business enterprise R&D expenditure in GDP (BERD);
-
number of patent applications to the European Patent Office per capita—EPO;
-
number of researchers employed in the business sector per capita—RDp;
-
seeing creativity as an important value—CR.
Except for the last point, the data source was Eurostat. In the case of CR, an average was calculated (using the weights included in the ESS database) to answer the question of to what extent, on a six-point scale, respondents agreed that “Thinking up new ideas and being creative is important to them. They like to do things in their own original way”.
The answers to two questions from Eurobarometer 412 were used to devise sports activity indicators. The first question, “By ‘exercise’ we mean any form of physical activity which you do in a sports context or sport-related setting, such as swimming, training in a fitness centre or a sports club, running in the park, etc. How often do you exercise or play sport?”, enabled us to determine the total percentage of the people responding: “A few times a week” or “Almost daily” (other options: “Occasionally” or “Never”) and thus determine the “sports activity” indicator—SA. The second question, “Are you a member of any of the following clubs where you participate in sport or recreational physical activity?” allowed for the construction of the “sports club” indicator—SClub.
SC was measured using a set of variables calculated using the weights defined in the ESS database as:
-
averages for the questions in which the respondents assessed the importance of their values or life attitudes on a six-degree scale, or on a 10-degree scale—the level of their confidence in other people or institutions;
-
groups of the population that responded affirmatively or in a certain way to other questions, e.g., about being a member of a political party or a trade union.
Detailed definitions of the indicators based on ESS, including the wording of the original questions, are provided in Table S1 in the Supplementary Materials.
Data provided by Eurostat were used as indicators to describe working conditions—which may affect the availability of leisure time and thus the possibility of engaging in sports activity. In particular, they were based on the following:
-
EU Labour Force Survey (LFS)—i.e., the percentage of commuters within the same NUTS2 region and the average working time of those in managerial, specialists and technical roles;
-
European Working Conditions Survey (EWCS) [29]—i.e., average commuting time.
GDP per capita (in thousands of euros) was used as a variable describing the economic development.
Due to the lack of an ideal match between the periods of the above-mentioned research, it was necessary to adjust the time structure. This was particularly true for the ESS data, which were based on average values for 2012 and 2014 (if available). For the average commuting time (EWCS), data from 2015 were used.
The availability of data accounted for the fact that 22 European countries were eventually analysed. These were the following: Austria, Belgium, Bulgaria, Cyprus, the Czech Republic, Denmark, Estonia, Finland, France, Germany, Hungary, Ireland, Italy, Lithuania, Poland, Portugal, Slovakia, Slovenia, Spain, Sweden, the Netherlands and the UK.

2.2. Method

Due to the number of the SC measures, their high degree of correlation and the general nature of the interdependencies analysed, principal component analysis (PCA; [30]) was used first to devise the SC indicators (based on 23 variables from the ESS) and labour market relations (based on seven variables from Eurostat). In each case, the PCA was carried out independently, and the first principal component for each of them was used in further analysis. In the case of the SC index, this component accounted for 50% of the total variance, and in the case of labour market relations, for 44%.
The SC index was interpreted as a negative measure of “anti-community”. This was influenced by two aspects. The first is the negative impact of the variables measuring: trust in people and institutions, participation in elections, unionisation, openness to others, life satisfaction. The second is the positive impact of variables such as: perceiving it important to be admired (in connection with one’s own skills) or respected by others. The impact of particular variables is presented in Figure S1 in the Supplementary Materials.
The indicator for the relations on the labour market was interpreted as a measure of “concentration on primary work” (WP)—due to negative impact of the prevalence of having a second job and the average commuting time, and also due to the positive impact of average working time. The impact of particular variables is presented in Figure S2 in the Supplementary Materials.
Next, the indicators calculated in the previous step, i.e., SC and WP, as well as the measures of sports activity (share of people active in sports—SA, share of people exercising in sports clubs—SClub), measures of innovation (BERD, patent applications to the European Patent Office per capita—EPO, researchers employed in the business sector per capita—RDp, perception of creativity as an important value—CR) and GDP per capita (GDP) were used to cluster countries using the k-means method, using the Euclidean distance and standardisation of variables [31]. The aim of the analysis was to identify groups of countries that were as similar as possible with regard to the studied dimensions (within clusters) and those that were different from each other in this respect.
A correlation table is presented for the variables used in clustering (for Pearson’s r coefficient).
The presentation of the results (in Figure 1) in a two-dimensional system required limiting the number of dimensions (again, using PCA). After verifying different sets of parameters (the verification included an assessment of the separability of clusters and the assumption that each of them consists of at least two elements, i.e., countries), results for four clusters were presented. Figure 1 also shows the average values of the variables used in clustering for individual groups of countries. The impact of particular variables is presented in Figure S3 in the Supplementary Materials. In order to assess the feasibility of the clustering analysis, we calculated the Hopkins statistic [32]. The Hopkins statistic tests the spatial randomness of the data. We conducted the Hopkins statistic test iteratively by get_clust_tendency in R, using 0.5 as the threshold to reject the alternative hypothesis. That is, if H < 0.5, then it is unlikely that dataset has statistically significant clusters. The Hopkins statistic for our dataset is 0.64, which means that observations within the dataset are clusterable (the H value = 0.64 which is above the threshold 0.5).
The analysis was conducted using the R environment [33] and the factoextra package [34]. Results were based on 25 random initial configurations.

3. Results

The analysis of the data from the years 2012–2015 allowed us to distinguish four clusters, which reveal patterns of interrelation between the described nine indicators in the examined areas: SA, innovation and SC, in European countries. The Supplementary Materials contain Table S2, showing the values of nine indicators for particular countries.
Cluster I contains: Denmark, Finland, Sweden and the Netherlands, and cluster II: Cyprus, Italy, Slovakia and Spain. The third cluster consisted of seven countries: Austria, Belgium, France, Germany, Ireland, Slovenia and the UK, and cluster IV: Bulgaria, the Czech Republic, Estonia, Lithuania, Hungary, Poland, Portugal. These results are illustrated in Figure 1.
Clusters are evenly distributed in pairs. Countries belonging to cluster I are the countries with the highest SA indicators (from 58% in the Netherlands to 70% in Sweden). They stand out from other countries (from other clusters) with a high share in SClub (from 12% in Finland to 27% in the Netherlands) and a high level of innovation indicators (EPO—from 200 submitted applications in the Netherlands to 339 in Sweden; BERD—from 1% in the Netherlands to 2.3% in Sweden; CR—from 2.7 in Finland to 2.4 in Denmark; RDp—from 6.8 in the Netherlands to 8 in Finland) and social capital (SC—from −3.4 in the Netherlands to −6.9 in Denmark; WP—from −0.8 in Finland to −4.8 in the Netherlands). The GDP ratio (GDP per capita) is the highest in these countries.
In the countries belonging to cluster II, the SA indicator is almost half as low as in the first cluster (from 30% in Italy to 46% in Spain). On average, 7% of adults train in sports clubs (SClub). The EPO innovation indicator decreases to two- and one-digit values (from nine submitted applications in Slovakia and Cyprus to 72 in Italy). R&D expenditure (BERD) is only 0.4% of the Slovak budget and 0.7% of the Italian budget. The CR indicator (2.5) remains on average at the same level as in cluster I countries. The R&D personnel indicator is the lowest among all surveyed countries (from 0.5 in Cyprus to 1.9 in Spain). Similarly, the values of social capital measures are very low (SC—from 3.8 in Slovakia to −0.3 in Spain; WP—from 2.4 in Slovakia to 0.9 in Italy). The level of GDP is low, however, not the lowest (which is the case in cluster 4).
Cluster III is characterised by quite high sports activity indicators (SA—from 43% in France to 52% in Ireland; SClub—from 11% in the UK to 24% in Germany), high SC indicators (SC—from 2.9 in Slovenia to -2.2 in Belgium; WP—from 1.3 in Ireland to 0.6 in Germany) and innovation (EPO—ranging from 62 in Slovenia to 261 in Germany; BERD—from 1% in the UK to 2% in Austria; CR—from 2.6 in Belgium to 2.4 in Germany; RDp—from 4 in Slovenia to 5.9 in Austria) and high GDP.
Cluster IV includes the countries with the lowest sports activity indicators (SA—from 11% in Bulgaria to 39% in Estonia; SClub—from 2% in Bulgaria to 12% in Estonia), very low innovativeness (EPO—from 5 in Bulgaria to 24 in the Czech Republic; BERD—from 0.2 in Lithuania to 1 in the Czech Republic; CR—from 3.4 in Bulgaria to 2.8 in Portugal; RDp—from 0.7 in Bulgaria to 3 in Lithuania) and low SC (WP—from 2.3 in Bulgaria to −1.3 in Estonia), especially in the SC area (from 5.19 in Bulgaria to −0.28 in Estonia). This cluster includes the countries with the lowest (of all the examined countries, except Slovakia) GDP. Slovakia, with an income at a level of 13.7, was included in cluster II.
Moreover, we conducted robustness analysis of our results, presented in Figure 1. The first additional cluster analysis is available in Figure S4 in the Supplementary Materials. Figure S4 illustrates cluster analysis of eight variables (SA, CR, BERD, RDp, EPO, SC, WP, GDP). The one missing variable compared with Figure 1 is SClub. However, the results of analysis of these eight indicators lead to the same clustering of countries as the results presented in Figure 1. Similarly, Figure S5 in the Supplementary Materials shows that removing both variables related to sports (SClub and SA), does not change the outcome. In addition, we provided another cluster analysis of 10 variables (SA, CR, BERD, RDp, EPO, SC, WP, GDP and an additional one for general health). The results are available in Figure S6 in the Supplementary Materials. Once again, this analysis illustrated the same cluster construction as Figure 1. Figure S7 in the Supplementary Materials presents results of analysis in which additional measures of social capital and working conditions have been used. In this case, most countries from Eastern and Southern Europe are clustered together, but outcomes for Northern and Western European countries do not change, emphasizing that this geographical split is crucial. This division is also visible within the results of an alternative, hierarchical clustering method (Figure S8 in Supplementary Materials). The validation of clustering was performed by those two sensitivity analyses combined with the Hopkins statistic (H = 0.64) as a clusterability measurement.
The correlation analysis for Pearson’s r coefficient carried out based on the variables used in clustering demonstrated that all the indicators in question are interrelated (Table 2). This fact is not surprising, as all indicators are positively related to the level of economic development, measured by the value of GDP per capita. Since differences in economic development can be both the cause and the effect of other international differences (in other aspects), GDP can account for positive correlations between these other aspects.

4. Discussion

This paper concludes the wider research concerning the role of sports activity in building social capital. To date, the profile of adults engaged in sports has been analysed, with the use of a multi-level social and environmental approach [35]. The key demographic and socio-economic characteristics and the interactions occurring between them have been demonstrated, which accounted for the differences between practising and not practising sport [36,37]. The relationship between sports activity and social capital at an individual level has been assessed, as well as the impact of sports activity on the health, beliefs and social status of adults [10]. A question on how sports activity can contribute to the accumulation of social capital in a country where its level is low has also been investigated [38].
The final stage of the research, the results of which are contained in this paper, is a multidimensional analysis of the relationship between sports activity and social capital and innovation in European countries. The data clustering analysis carried out with the use of the k-means method has revealed that all these examined variables, characteristic of particular societies/economies, are positively correlated with each other (including the level of economic development—GDP per capita). However, it should be noted that they are less related to labour market organisation. We endeavor to show in this article that high innovation in European countries such as Sweden, Finland, Denmark and the Netherlands is accompanied by high SA (especially in clubs) and high SC, which translates into high GDP. This is also confirmed by the pan-European innovation rankings mentioned in the introduction to this paper.
At the national level, social capital, sports activity and innovativeness seem to correlate strongly—at least indirectly (e.g., in connection to the level of economic development). While the relation observed between innovativeness and sports (even treated or understood as social activity) at the national level can be considered a spurious one (e.g., resulting from economic development level), we think that specific mechanisms that go from engagement in sports (especially when it is embedded in a social setting), through selected dimensions of social capital, to innovativeness can be identified.
Firstly, the impact of engagement in sports activity on social capital is often implied. The mechanisms behind this are synthetically presented by Pawlowski and Schüttoff [39]. The research by Felfe, Lechner and Steinmayr and Schüttoff et al. [40,41] show empirically that sport can be a tool that fosters the development of SC among children and youths or reduces social problems. The same is true for adults. Di Bartolomeo and Papa [42] describe an experiment (with the participation of students) proving that physical activity itself, even in the short term, promotes trust and cooperation with other people.
Our recently published research at an individual level, using a radius matching method [10], provides arguments in line with the pre-existing empirical results (i.e., Felfe, Lechner and Steinmayr and Schüttoff et al. [40,41]—engagement in sports activity (or involvement with sport clubs) can contribute to the accumulation of social capital, but only within its selected dimensions. In particular, thanks to the application of the results of a rich longitudinal study on social profiles of people living in Poland, Social Diagnosis [43], we show that—for some groups (women over 40)—a positive impact of sports activity on social involvement is substantial and broad in terms of the types of involvement (including work for the benefit of local society). At the same time, for others (in particular, for younger women and men), it contributes mainly to the extension or deepening of social networks and to the development of a more positive and proactive attitude towards life and work.
Secondly, the relationship between SC and innovation—although understood generally and intuitively, and often only mentioned—is heterogeneous and complex. This was demonstrated by Echebarria and Barrutia [44] in their review of the empirical literature and their own quantitative analysis. According to their reports, SC can foster innovation, e.g., by lowering transaction costs (both transactions and knowledge sharing take place with a higher level of trust), or by increasing the knowledge base (by expanding social networks). However, the empirical analyses they refer to show that bridging social capital and weak ties, as well as associational activity, are crucial in this respect, and not necessarily—for instance—trust or deepened relationships in a narrow social environment. At the same time, Echebarria and Barrutia [44] observe a non-monotonous relationship between SC and innovation. They demonstrate that maintaining too high SC (defined broadly, measured by an aggregate index and based on the European Values Survey) is so costly that it limits innovation. It should be noted that our observation regarding the relation between sports activity and the extension of social networks, stipulated by Skrok et al. [10], is consistent with the observations concerning the relation of social capital and innovation mentioned above.
Furthermore, social capital is found to be related to pro-innovative attitudes. For example, as presented in Asteria et al.’s [45] gender equality studies, the network and social capital of the community are related to women’s proactivity. In Perry-Smith and Shalley [46], social relations and their translation into creativity were analysed. The authors “go beyond the idea that communication and interaction in general facilitate creativity by describing the dynamic interplay between social networks and creativity” (op. cit., pp. 100) and through multilevel analysis proved that “the social relationships may facilitate creativity, and in some special conditions may actually constrain creativity” (op. cit., pp. 100). They claim that increased communication and increased interaction are helpful in supporting creativity at the organisational level, and Gong et al. [47] confirmed this relation at the individual level.
In this context, it should be noted that the role of engagement in sports activity could be especially important when it takes place in a manner allowing for transgressing boundaries of narrow, hitherto existing social groups to which a given person belongs. One of the key questions in this respect is whether organised, long-lasting forms of sports activity—training in sports clubs—are particularly conductive to such effects. Indeed, the literature often analyses the role of sport clubs in the context of the relationship between sports and social capital. Therefore, it arises from the findings presented by Seippel [4] that being a member of sports clubs may be connected to a higher level of trust, however, Downward, Pawlowski and Rasciute [48] suggest that the cause and effect dependency is the reverse. The meaning of sport clubs might be more complex, however. Sillen [49] argues that the success of sport clubs depends on their inclusiveness and ability to settle themselves in local societies. Brown [50] shows that members of sports or recreation community organisations in Lund (Sweden) and Ballarat (Australia), in comparison with the members of other organisations, had higher scores in some measures of social capital (higher trust in government, greater tolerance and better relations with neighbours) and not worse scores in other measures.
Sports clubs often bring together people from different backgrounds and even from different cultures, which can contribute to fostering SC in compassionate, multicultural societies [51].
Remarkably, members of sport clubs in those countries characterised by a high level of both social capital and involvement with sports clubs are often shown to be driven by different motives than the people involved in more flexible forms of sports activity. In particular, for the Netherlands, Deelen, Ettema and Kamphuis [52] found that both social recognition and image and social affiliation and skill development are more often the goals of the former group than of the latter. On the other hand, with respect to engagement in settings other than sports clubs, health orientation plays a greater role. In other words, not only is social involvement more directly related to clubs, but so is the willingness to make progress. These traits, in turn, can be linked to—respectively—accumulation of social capital and innovativeness, understood as a process of improvement. This phenomenon is mirrored in the fact that sports activity and exercising in sports club are studied separately at the EU level (see Special Eurobarometer 412, 427).
We achieved results consistent with the observations presented above in another of our analyses [38]. Namely, at the aggregate, regional level (NUTS 4), we employed the instrumental variables method (using data on sports infrastructure, detailed in terms of the types of infrastructure, as the source of instruments) to analyse the impact of membership of sport clubs on social capital. The supplementary character of these findings results from the fact that some dimensions of social capital can be only measured at an aggregate level, e.g., the propensity of local societies to create organisations. Our main finding is that, while there is no apparent relationship between membership of sports clubs and civic involvement (measured by participation in general elections) or donorship (measured by tax deductions resulting from donations), a positive relationship between the number of associations or other organisations and social goals can be identified. In other words, at the societal level, higher involvement with sport clubs coincides with a higher propensity not only to follow pro-social goals, but also to plan activities towards fulfilling them. The latter might be interpreted as a willingness to sustain and systematise these efforts, and not treat them as ad hoc or temporary tendencies. Therefore, we argue that social activity and organised sports activity can create a virtuous cycle that, in the long run, could also lead to other socio-economic benefits, such as innovativeness.
There are, however, arguments against the “special role” that sports clubs might play in stimulating the accumulation of social capital (as opposed to sports activity in general, not in comparison with other associations). In particular, returning to the analysis at the level of the countries presented in this article, SA is associated with the measures of innovation no worse than SClub. This is also confirmed by the results of the correlation analysis.
Explanations of the above result can be found in the literature. It proves, on the one hand, that membership of a sports club gives more diverse benefits than recreational physical activity (e.g., in individual disciplines, it has no social effect) [53], that it has a strong influence on general physical activity [54] and that it plays a pivotal role in social integration [55]. On the other hand, more and more researchers [56,57] consider it a myth that organised sport offers a developmental benefit for everyone. Indeed, since the 1990s, there has been an increased involvement with non-organised, informal sport [58]. Eime et al. [53] argue that this involvement has increased significantly over the last decade. According to Borgers et al. [59] this is due to institutional changes, which are the consequence of cultural and social changes, as well as changing values, habits and attitudes of people. Today’s participants in sports do not want to be dependent on formal structures such as membership obligations, opening hours and the availability of specific sports facilities [58]. They want to avoid the stress (competition, losing, dissatisfaction) that is inherent in organised sport [55] (often accessible only to small, privileged groups of people [60]). They seek greater flexibility and a greater sense of autonomy. Research shows that self-organised SA can also have positive psychological and social effects (among others, it can promote general life skills and pro-social behaviour) [61]. For example, lifestyle sports can offer young people the opportunity to learn social skills such as: independence, self-control, cooperation, problem solving [62]. According to Säfvenbom, Wheaton and Agans [63], such contexts may produce thriving young people, not in spite of, but because of involvement in contexts with no strict rules, no formal leaders and no a priori competence or performance goals. In addition, researchers argue that the element of fun, inherent in self-organised SA, is more likely to foster creativity, identity building and self-actualisation [63]. Fun is the result of internal motivation and can therefore be seen as an important factor in experiencing personal activity, pleasure, autonomy, self-determination, competence development and self-esteem [64]. Furthermore, Deelen, Ettema and Kamphuis [52] point to the perceived minimum skill level as a potential limitation in the general openness of sports clubs towards society. One can argue that under such conditions, clubs would rather lead to the accumulation of bonding, but not bridging social capital. Once again, however, the social aspect of membership of sports clubs should be considered as dynamic and country specific [65]. In particular, with respect to the Netherlands, Bovens and Trappenburg [66], Elling and Claringbould [67] and van Haaften [68] show that sports clubs can even become exclusionary, segregating or self-segregating. In the case of Germany, Burrmann, Braun and Mutz [69] show that, while in 2001 the members of sports clubs were more pro-socially oriented than non-members, no such difference could be observed in 2017/2018. Scheerder et al. [70] show that, while in 1979 the members of the middle class, and even more so of the upper class, were more likely to be involved in club participation than the members of the lower class, no significant impact of social class was observed either in 1989 or in 1999. For the non-organised participation, however, the results were the reverse (i.e., nonsignificant in 1979 and significant, increasing with social class, in later years). For commercial gyms in Germany, Cardone [71] argues that, while the behaviour of the members can be inward-orientated and exclusionary, it can also transgress cultural differences.
The contemporary nature of engagement in sports activity described above, not necessarily dependent on involvement with sports clubs, is reflected in another of our articles [36]. We showed that two of the three (apart from the age) most important factors accounting for engagement in sports activity in Poland are of a social nature. One describes a narrow group, to which a given person belongs, the other, adults in a household. Namely, the more other members of the latter engage in sports activity, the greater the probability that a given person does as well. Secondly, a key variable describes whether a given person goes to restaurants, bars or pubs. This suggests that, without judging causality, openness to going out and using market services instead of traditional household production is relevant. Once again, it is consistent with the conclusion on the social nature of sports activity and the tendency of the latter and social capital to reciprocally reinforce one another. Moreover, it should be noted that the greater propensity to engage in sports demonstrated by the adults who organise their lives in a modern, market-based way is consistent with the previously described observations set out by Florida [14] on the creative class.
To conclude, our previous studies (Skrok et al. [10]; Biernat et al. [38]; Biernat, et al. [35]) indicate a positive direction of mutual dependencies between SA or SClub and SC. In light of these results, the actions taken in Europe since the 1990s focusing on raising the profile of sports and physical activity and the implementation of the so-called European model of sport by the European Commission go well beyond their original objective—health. Therefore, they are of pivotal importance for supporting the sustainable development of EU countries, in line with the UN’s sustainable developmental goals (SDGs) [72,73].
However, given the diversity of forms and structures that characterise the field of sport in particular Member States, the development of a universal model and a completely uniform organisational structure cannot be an objective of the EU’s actions. In line with the European dimension of sport, a local sports club plays a key role in the overall organisational structure of sport in the EU [74], although, as we have pointed out, the literature on this subject has raised questions in this respect in recent years. Due to its multidimensional nature and cross-sectoral links, it is one of the factors supporting sustainable development of individuals and local communities. However, there are countries, such as Poland, where sports clubs function poorly in terms of public awareness and their activity does not translate into the popularisation of sport [75]. This is confirmed by Heinemann [76], Tuyckom and Scheerder [77] and Breuer et al. [78], who point to the geographical, social and organisational diversity of sports activity in the EU. Therefore, on the basis of strategic documents (e.g., White Paper on Sport, European Dimension in Sport or Global action plan on physical activity 2018-2030), Member States create their own legal grounds and implement internal policies while preserving their national character [79,80,81].
Our study is subject to limitations. Only 22 countries—all being EU members during the period covered by the analysis—limits possibilities to generalise the conclusions. This is further reinforced by the fact that the majority of empirical research included in the discussion was based on selected European countries. Furthermore, only selected measures of innovativeness were available—even though they cover different facets of this process, it is, undoubtedly, significantly more complex. For example, the EPO procedure is only one of the elements of patenting strategies at the disposal of potential intellectual property owners. In broad sense, innovativeness is not only restricted to R&D recorded within official statistics on personnel and expenditure. Thirdly, the available measure of sports activity was based on information that included the frequency, but not intensity, of it. Neither was information on the social aspects of this activity available—even in individual disciplines, like running or cycling, which one can engage in in solitude or alongside other people. The same could be said of sport clubs—as discussed, their organisational culture might matter for the accumulation of social capital, and this character varies internationally.
In light of the described limitations, one should emphasise the need for further research. We consider ours as one of the first steps in the analysis of a non-obvious relationship between sports, social capital and innovativeness. Certainly, whether it is possible to the replicate the observation outside Europe would be an interesting question.
Secondly, further evidence on possible causal relations between involvement in sports, sport clubs and particular dimensions of social capital and innovativeness both on personal (e.g., through creative approach) and societal (e.g., through creation of productive social networks) aspects should not only be of great value, but also possible in future, especially with increasing availability of microdata.

5. Conclusions

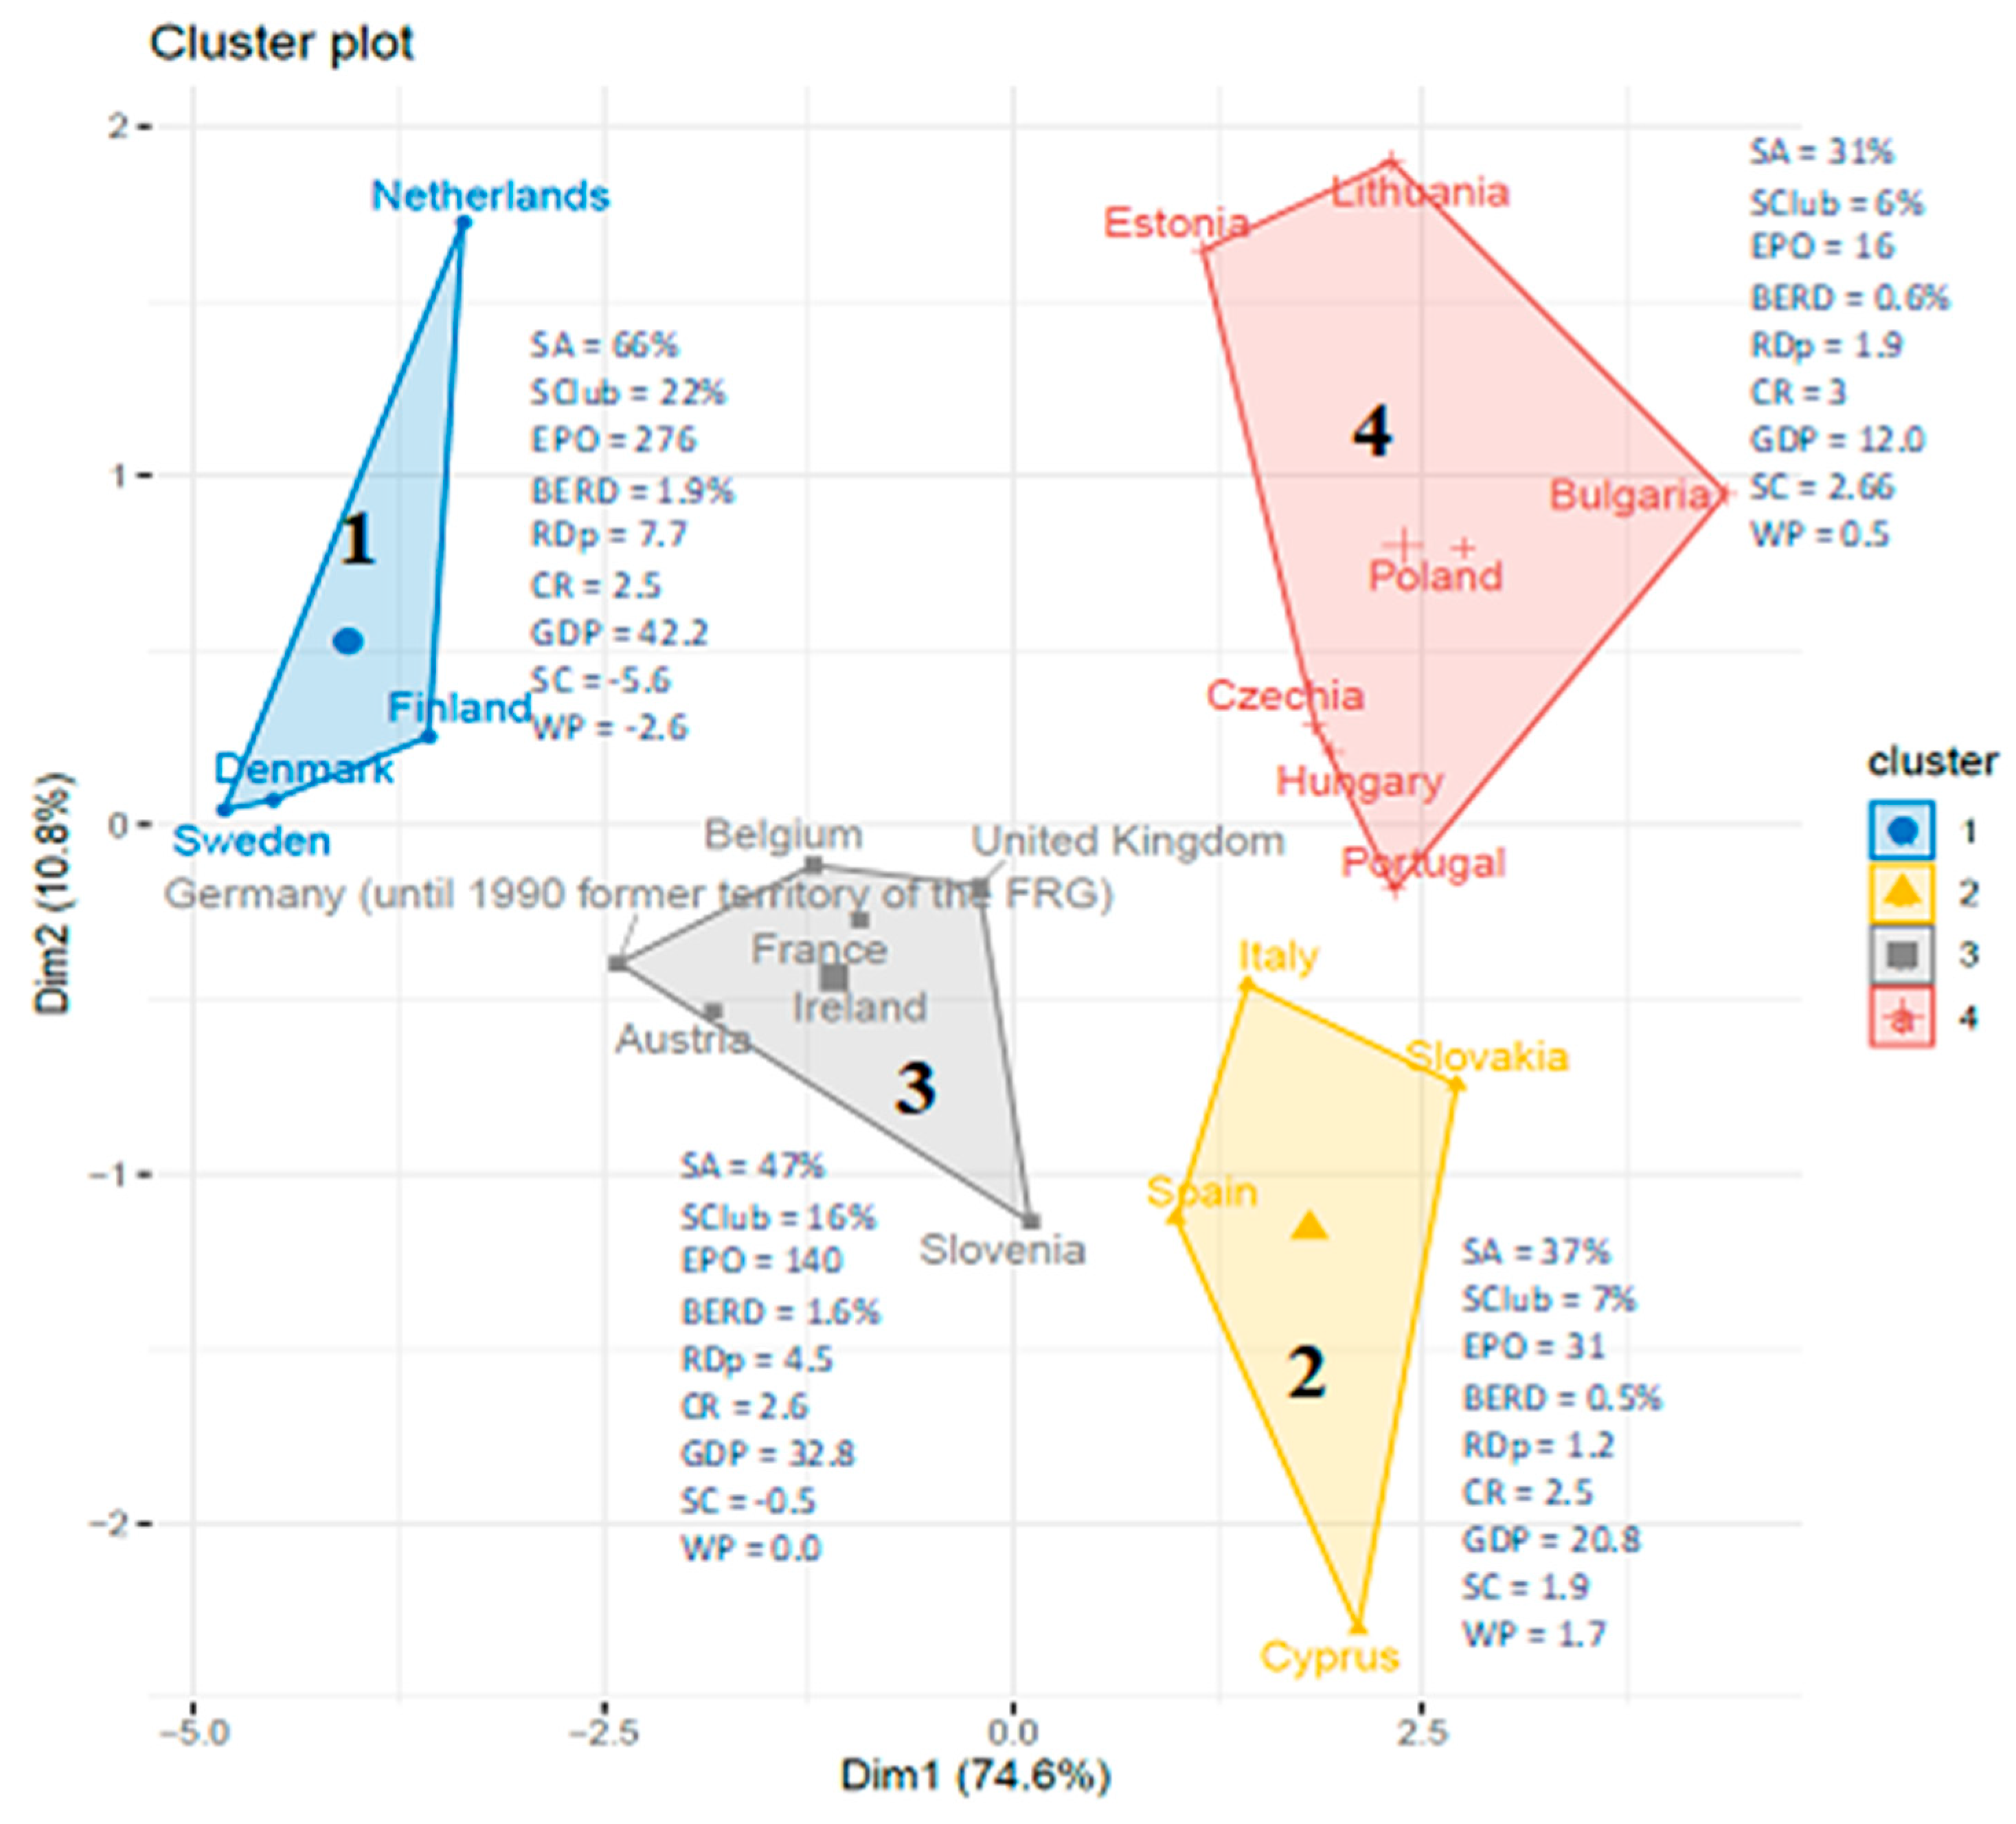
  • The analysis of European countries in terms of their level of innovation, sports activity and social capital allowed us to distinguish four clusters. In the countries with high innovation, such as Sweden, Finland, Denmark and the Netherlands, high sports activity and high social capital were observed.
  • The majority of Central and Eastern European countries belong to the cluster with the lowest sports activity indicators, very low innovativeness and low SC (especially in the SC area).
  • Sports activity (in the long term) can, through its socialising character, have the potential to foster innovation.
  • Investment in European countries in the development of sport can contribute to their sustainable development and SDG achievement, going beyond the original objectives and contributing to economic development. In particular, this process can take place by supporting the building of social capital, including entrenching social networks and promoting associations.

Supplementary Materials

The following are available online at https://www.mdpi.com/2071-1050/12/24/10489/s1, Table S1. Calculation of variables based on European Social Survey, Figure S1. The impact of variables on the anti-community index (SC—Dim1), Figure S2. The impact of variables on the index of concentration on primary work (WP—Dim1), Figure S3. The impact of variables and values of particular countries in the PCA presented in Figure 1. Table S2. Cluster analysis values and averages for individual countries and the resulting clusters. Figure S4. Cluster plot for 8 indicators (SClub excluded) and 22 countries. Figure S5. Cluster plot for 7 indicators (SA and SClub excluded) and 22 countries. Figure S6. Cluster plot for 10 indicators (additional health variable included) and 22 countries. Figure S7. Cluster plot for 11 indicators (second principal components for social capital and working conditions included) and 22 countries. Figure S8. Clustering dendrogram for 9 indicators and 22 countries.

Author Contributions

Conceptualisation, H.N., Ł.S. and E.B.; methodology, Ł.S. and D.M.; software, does not apply; validation, Ł.S. and D.M.; formal analysis, Ł.S. and D.M.; investigation, Ł.S. and D.M.; resources, Ł.S. and D.M.; data curation, Ł.S. and D.M.; writing—original draft preparation, H.N., Ł.S., D.M. and E.B.; writing—review and editing, H.N., Ł.S., D.M. and E.B.; visualisation, H.N., Ł.S., D.M. and E.B.; supervision, E.B.; project administration, E.B.; funding acquisition, E.B. All authors have read and agreed to the published version of the manuscript.

Funding

The study was conducted as part of the project No. 2017/27/B/HS4/00427 “The role of sports activity in building social capital in Poland” funded by the National Science Centre, Poland, and conducted in the Warsaw School of Economics.

Conflicts of Interest

The authors declare that they have no competing interests.

References

  1. Waśkowski, Z.; Jasiulewicz, A. The role of sport and physical recreation in shaping the social capital of the region’s inhabitant. Intern. Trade 2017, 4, 279–289. [Google Scholar]
  2. Mutter, F.; Pawlowski, T. Role models in sports—Can success in professional sports increase the demand for amateur sport participation? Sport Manag. Rev. 2014, 17, 324–336. [Google Scholar] [CrossRef]
  3. Davison, K.K.; Nishi, A.; Kranz, S.; Wyckoff, L.; May, J.J.; Earle-Richardson, G.B.; Strogatz, D.S.; Jenkins, P.L. Associations among social capital, parenting for active lifestyles, and youth physical activity in rural families living in upstate New York. Soc. Sci. Med. 2012, 75, 1488–1496. [Google Scholar] [CrossRef] [PubMed]
  4. Seippel, Ø. Sport and Social Capital. Acta Sociol. 2016. [Google Scholar] [CrossRef]
  5. Lechner, M.; Downward, P. Heterogeneous sports participation and labour market outcomes in England. Appl. Econ. 2017, 49, 335–348. [Google Scholar] [CrossRef]
  6. Legh-Jones, H.; Moore, S. Network social capital, social participation, and physical inactivity in an urban adult population. Soc. Sci. Med. 2012, 74, 1362–1367. [Google Scholar] [CrossRef]
  7. Ball, K.; Cleland, V.J.; Timperio, A.F.; Salmon, J.; Giles-Corti, B.; Crawford, D.A. Love thy neighbour? Associations of social capital and crime with physical activity amongst women. Soc. Sci. Med. 2010, 71, 807–814. [Google Scholar] [CrossRef]
  8. Gerlach, E.; Brettschneider, W.-D. Aufwachsen mit Sport: Befunde einer 10-jährigen Längsschnittstudie zwischen Kindheit und Adoleszenz; Meyer & Meyer Verlag: Aachen, Germany, 2013; ISBN 978-3-8403-0858-1. [Google Scholar]
  9. Skinner, J.; Zakus, D.H.; Cowell, J. Development through Sport: Building Social Capital in Disadvantaged Communities. Sport Manag. Rev. 2008, 11, 253–275. [Google Scholar] [CrossRef] [Green Version]
  10. Skrok, Ł.; Majcherek, D.; Nałęcz, H.; Biernat, E. Impact of sports activity on Polish adults: Self-reported health, social capital & attitudes. PLoS ONE 2019, 14, e0226812. [Google Scholar] [CrossRef]
  11. Smith, A. An Inquiry into the Nature and Causes of the Wealth of Nations; McMaster University Archive for the History of Economic Thought: Hamilton, ON, Canada, 1776. [Google Scholar]
  12. Kopel, A. Creative Class as a factor in urban development. Sci. J. Humanit. Coll. Manag. Mark. 2007, 1, 55–58. [Google Scholar]
  13. Florida, R. Cities and the Creative Class. City Community 2003, 2, 3–19. [Google Scholar] [CrossRef]
  14. Florida, R.; Mellander, C.; King, K. The Global Creativity Index 2015; Martin Prosperity Institute: Toronto, ON, Canada, 2015; p. 68. [Google Scholar]
  15. Yum, S. The Effect of Creativity on Urban Economy in the U.S. a New Creativity Index 3Ci (Creative Class, Creative Infrastructure, and Culture). Ph.D. Thesis, University of Florida, Gainesville, FL, USA, 2015. [Google Scholar]
  16. Schumpeter, J.A. Business Cycles: A Theoretical, Historical, and Statistical Analysis of the Capitalist Process. 2 Vol. Set; McGraw-Hill Book Company: New York, NY, USA, 1939. [Google Scholar]
  17. Carlino, G.; Kerr, W.R. Agglomeration and Innovation; Working Paper Series; National Bureau of Economic Research: Cambridge, MA, USA, 2014. [Google Scholar]
  18. Olejniczuk-Merta, A. From Consumer Innovativeness to Innovative Economy. Domest. Trade 2018, 17, 252–267. [Google Scholar]
  19. Schwab, K. Global Competitiveness Report 2019; World Economic Forum: Geneva, Switzerland, 2019; p. 466. [Google Scholar]
  20. Dutta, S.; Lanvin, B.; Wunsch-Vincent, S. Global Innovation Index 2019: Creating Healthy Lives—The Future of Medical Innovation; Cornell University, INSEAD, and the World Intellectual Property Organization: Ithaca, NY, USA, 2019; ISBN 979-10-95870-14-2. [Google Scholar]
  21. Hollanders, H.; Es-Sadki, N. European Innovation Scoreboard 2019; Publication Office of the European Union: Luxembourg, 2019. [Google Scholar]
  22. Yunus, M. Building Social Business: The New Kind of Capitalism that Serves Humanity’s Most Pressing Needs; Public Affairs: New York, NY, USA, 2010. [Google Scholar]
  23. National Bank of Poland. Potencjał Innowacyjny Gospodarki [Innovation Potential of the Economy]; National Bank of Poland: Warsaw, Poland, 2016. [Google Scholar]
  24. OECD. Eurostat Oslo Manual 2018: Guidelines for Collecting, Reporting and Using Data on Innovation, 4th ed.; The Measurement of Scientific, Technological and Innovation Activities; OECD: Paris, France, 2018; ISBN 978-92-64-30455-0. [Google Scholar]
  25. European Union. Special Eurobarometer 412 “Sport and Physical Activity”; Publications Office of the European Union: Brussels, Belgium, 2014. [Google Scholar]
  26. European Social Survey (ESS) ESS Round 6: European Social Survey Round 6 Data (2012). Data file edition 2.4. NSD—Norwegian Centre for Research Data, Norway—Data Archive and distributor of ESS data for ESS ERIC. Available online: https://www.europeansocialsurvey.org/data/download.html?r=6 (accessed on 24 August 2020).
  27. European Social Survey (ESS) European Social Survey Cumulative File, ESS 1-8 (2018). Data file edition 1.0. NSD—Norwegian Centre for Research Data, Norway—Data Archive and distributor of ESS data for ESS REIC. ESS Round 7: European Social Survey Round 7 Data (2014). Data file edition 2.2. NSD—Norwegian Centre for Research Data, Norway—Data Archive and distributor of ESS data for ESS ERIC. Available online: https://www.europeansocialsurvey.org/data/download.html?r=7 (accessed on 24 August 2020).
  28. Eurostat Eurostat Portal. Available online: https://ec.europa.eu/eurostat/ (accessed on 27 August 2020).
  29. Parent-Thirion, A.; Biletta, I.; Cabrita, J.; Llave Vargas, O.; Vermeylen, G.; Wilczynska, A.; Wilkens, M. 6th European Working Conditions Survey: Overview Report; EF; 2017 update; Publications Office of the European Union: Luxembourg, 2017; ISBN 978-92-897-1596-6. [Google Scholar]
  30. Jolliffe, I.T. Principal Component Analysis, 2nd ed.; Springer Series in Statistics; Springer-Verlag: New York, NY, USA, 2002; ISBN 978-0-387-95442-4. [Google Scholar]
  31. Hartigan, J.A.; Wong, M.A. Algorithm AS 136: A K-Means Clustering Algorithm. J. R. Stat. Soc. Ser. C 1979, 28, 100–108. [Google Scholar] [CrossRef]
  32. Lawson, R.G.; Jurs, P.C. New index for clustering tendency and its application to chemical problems. J. Chem. Inf. Comput. Sci. 1990, 30, 36–41. [Google Scholar] [CrossRef]
  33. R Core Team. R: A Language and Environment for Statistical Computing; R Foundation for Statistical Computing: Vienna, Austria, 2019. [Google Scholar]
  34. Kassambara, A.; Mundt, F. Factoextra: Extract and Visualize the Results of Multivariate Data Analyses; R Foundation for Statistical Computing: Vienna, Austria, 2020. [Google Scholar]
  35. Biernat, E.; Skrok, Ł.; Majcherek, D.; Nałęcz, H. Socioecological Profile of Active Adults. Sport as a Whole-life Choice. Phys. Cult. Sport Stud. Res. 2020, 85, 59–76. [Google Scholar] [CrossRef] [Green Version]
  36. Biernat, E.; Majcherek, D.; Skrok, Ł. Socio-ecological profiles of participants in sports activity in Poland: Random tree-based analysis. Acta Kinesiol. 2020. under review. [Google Scholar]
  37. Biernat, E.; Skrok, Ł.; Krzepota, J. Short-Term and Medium-Term Impact of Retirement on Sport Activity, Self-Reported Health, and Social Activity of Women and Men in Poland. Biomed. Res. Int. 2019, 1–12. [Google Scholar] [CrossRef]
  38. Biernat, E.; Nałęcz, H.; Skrok, Ł.; Majcherek, D. Do Sports Clubs Contribute to the Accumulation of Regional Social Capital? Int. J. Environ. Res. Public Health 2020, 17, 5257. [Google Scholar] [CrossRef]
  39. Pawlowski, T.; Schüttoff, U. Sport and Social Capital Formation. In The SAGE Handbook of Sports Economics; SAGE Publications: London, UK, 2019. [Google Scholar]
  40. Felfe, C.; Lechner, M.; Steinmayr, A. Sports and Child Development. PLoS ONE 2016, 11, e0151729. [Google Scholar] [CrossRef] [Green Version]
  41. Schüttoff, U.; Pawlowski, T.; Downward, P.; Lechner, M. Sports Participation and Social Capital Formation During Adolescence. Soc. Sci. Q. 2018, 99, 683–698. [Google Scholar] [CrossRef]
  42. Di Bartolomeo, G.; Papa, S. The Effects of Physical Activity on Social Interactions: The Case of Trust and Trustworthiness. J. Sports Econ. 2019, 20, 50–71. [Google Scholar] [CrossRef]
  43. Czapiński, J.; Panek, T. Social diagnosis—Objective and Subjective Quality of Life in Poland. Available online: http://www.diagnoza.com/ (accessed on 5 October 2019).
  44. Echebarria, C.; Barrutia, J.M. Limits of Social Capital as a Driver of Innovation: An Empirical Analysis in the Context of European Regions. Reg. Stud. 2013, 47, 1001–1017. [Google Scholar] [CrossRef]
  45. Asteria, D.; Halimatussadiah, A.; Budidarmono; Utari, D.; Handayani, R.D. Relation of Social Capital to Women’s Proactive Participation in the Community for Sustainability of River in Urban Areas. E3s Web Conf. 2018, 73, 03003. [Google Scholar] [CrossRef] [Green Version]
  46. Perry-Smith, J.E.; Shalley, C.E. The Social Side of Creativity: A Static and Dynamic Social Network Perspective. AMR 2003, 28, 89–106. [Google Scholar] [CrossRef] [Green Version]
  47. Gong, Y.; Kim, T.-Y.; Liu, Z. Diversity of social ties and creativity: Creative self-efficacy as mediator and tie strength as moderator. Hum. Relat. 2019, 0018726719866001. [Google Scholar] [CrossRef]
  48. Downward, P.; Pawlowski, T.; Rasciute, S. Does Associational Behavior Raise Social Capital? A Cross-Country Analysis of Trust. East. Econ. J. 2014, 40, 150–165. [Google Scholar] [CrossRef]
  49. Sillen, D. Social capital in sport clubs. In Sports, Culture and Society; University of Amsterdam: Amsterdam, The Netherlands, 2015; p. 17. [Google Scholar]
  50. Brown, K. Community Sport/Recreation Members and Social Capital Measures in Sweden and Australia. In Sport and Social Capital; Butterworth-Heinemann: Oxford, UK, 2008; pp. 164–188. ISBN 978-1-136-36503-4. [Google Scholar]
  51. Janssens, J.; Verweel, P. The significance of sports clubs within multicultural society. On the accumulation of social capital by migrants in culturally “mixed” and “separate” sports clubs. Eur. J. Sport Soc. 2014, 11, 35–58. [Google Scholar] [CrossRef]
  52. Deelen, I.; Ettema, D.; Kamphuis, C.B.M. Sports participation in sport clubs, gyms or public spaces: How users of different sports settings differ in their motivations, goals, and sports frequency. PLoS ONE 2018, 13, e0205198. [Google Scholar] [CrossRef] [Green Version]
  53. Eime, R.M.; Sawyer, N.; Harvey, J.T.; Casey, M.M.; Westerbeek, H.; Payne, W.R. Integrating public health and sport management: Sport participation trends 2001–2010. Sport Manag. Rev. 2015, 18, 207–217. [Google Scholar] [CrossRef] [Green Version]
  54. Zimmermann-Sloutskis, D.; Wanner, M.; Zimmermann, E.; Martin, B.W. Physical activity levels and determinants of change in young adults: A longitudinal panel study. Int. J. Behav. Nutr. Phys. Act. 2010, 7, 2. [Google Scholar] [CrossRef] [Green Version]
  55. Støckel, J.T.; Strandbu, Å.; Solenes, O.; Jørgensen, P.; Fransson, K. Sport for Children and Youth in the Scandinavian Countries. Cult. Sport Soc. 2010, 13, 625–642. [Google Scholar] [CrossRef]
  56. Säfvenbom, R.; Geldhof, G.J.; Haugen, T. Sports clubs as accessible developmental assets for all? Adolescents’ assessment of egalitarianism vs. elitism in sport clubs vs. school. Int. J. Sport Policy Politics 2014, 6, 443–457. [Google Scholar] [CrossRef]
  57. Jarvie, G. Sport, Social Division and Social Inequality. Sport Sci. Rev. 2011, 20, 95–109. [Google Scholar] [CrossRef]
  58. Borgers, J.; Thibaut, E.; Vandermeerschen, H.; Vanreusel, B.; Vos, S.; Scheerder, J. Sports participation styles revisited: A time-trend study in Belgium from the 1970s to the 2000s. Int. Rev. Sociol. Sport 2013. [Google Scholar] [CrossRef]
  59. Borgers, J.; Pilgaard, M.; Vanreusel, B.; Scheerder, J. Can we consider changes in sports participation as institutional change? A conceptual framework. Int. Rev. Sociol. Sport 2018, 53, 84–100. [Google Scholar] [CrossRef] [Green Version]
  60. Gilchrist, P.; Wheaton, B. The social benefits of informal and lifestyle sports: A research agenda. Int. J. Sport Policy Politics 2017, 9, 1–10. [Google Scholar] [CrossRef]
  61. Wiium, N.; Säfvenbom, R. Participation in Organized Sports and Self-Organized Physical Activity: Associations with Developmental Factors. Int. J. Environ. Res. Public Health 2019, 16. [Google Scholar] [CrossRef] [PubMed] [Green Version]
  62. Säfvenbom, R.; Wheaton, B.; Agans, J. ‘How can you enjoy sports if you are under control by others?’ Self-organized lifestyle sports and youth development. Cult. Sport Soc. 2018, 21, 1990–2009. [Google Scholar] [CrossRef]
  63. Wheaton, B. Introducing the consumption and representation of lifestyle sports. Sport Soc. 2010, 13, 1057–1081. [Google Scholar] [CrossRef]
  64. Caldwell, L.L.; Smith, E.A. Leisure as a Context for Youth Development and Delinquency Prevention: Aust. N. Z. J. Criminol. 2006. [Google Scholar] [CrossRef]
  65. Nagel, S.; Elmose-Østerlund, K.; Ibsen, B.; Scheerder, J. Functions of Sports Clubs in European Societies; Springer: Berlin, Germany, 2020. [Google Scholar]
  66. Trappenburg, M.J.; Bovens, M.A.P. Segration through Anti-Discrimination: How the Netherlands Got Divided again. In Clumsy Solutions for a Complex World; Palgrave Macmillan: Hampshire, UK, 2006; pp. 86–104. ISBN 9780230002302. [Google Scholar]
  67. Elling, A.; Claringbould, I. Mechanisms of Inclusion and Exclusion in the Dutch Sports Landscape: Who Can and Wants to Belong? Soc. Sport J. 2005, 22, 498–515. [Google Scholar] [CrossRef]
  68. van Haaften, A.F. Do birds of a feather play football together? A study on ethnic segregation in Dutch amateur football. Eur. J. Sport Soc. 2019, 16, 146–163. [Google Scholar] [CrossRef]
  69. Burrmann, U.; Braun, S.; Mutz, M. Playing together or bowling alone? Social capital-related attitudes of sports club members and non-members in Germany in 2001 and 2018. Eur. J. Sport Soc. 2019, 16, 164–186. [Google Scholar] [CrossRef]
  70. Scheerder, J.; Vanreusel, B.; Taks, M. Stratification Patterns of Active Sport Involvement among Adults: Social Change and Persistence. Int. Rev. Sociol. Sport 2016. [Google Scholar] [CrossRef]
  71. Cardone, P. The gym as intercultural meeting point? Binding effects and boundaries in gym interaction. Eur. J. Sport Soc. 2019, 16, 111–127. [Google Scholar] [CrossRef]
  72. Pawlowski, T.; Schüttoff, U.; Downward, P.; Lechner, M. Can Sport Really Help to Meet the Millennium Development Goals? Evidence from Children in Peru: J. Sports Econ. 2016. [Google Scholar] [CrossRef] [Green Version]
  73. United Nations The 17 Sustainable Development Goals. Available online: https://sdgs.un.org/goals (accessed on 28 August 2020).
  74. Siekmann, R.; Soek, J. Models of Sport Governance in the European Union: The Relationship between State and Sport Authorities. Int. Sports Law J. 2010, 2010, 93. [Google Scholar]
  75. Gołdys, A.; Podziemski, M.; Włoch, R. Sport and Recreation: National Survey of Poles; Social Project Team: Warsaw, Poland, 2012. [Google Scholar]
  76. Heinemann, K. Sport Clubs in Various European Countries; Schattauer Verlag: Stuttgart, Germany, 1999; ISBN 978-3-7945-2038-1. [Google Scholar]
  77. Tuyckom, C.V.; Scheerder, J. Sport for All? Insight into stratification and compensation mechanisms of sporting activity in the 27 European Union member states. Sport Educ. Soc. 2010, 15, 495–512. [Google Scholar] [CrossRef] [Green Version]
  78. Breuer, C.; Hoekman, R.; Nagel, S.; van der Werff, H. (Eds.) Sport Clubs in Europe: A Cross-National Comparative Perspective; Sports Economics, Management and Policy; Springer International Publishing: Cham, Switzerland, 2015; Volume 12, ISBN 978-3-319-17634-5. [Google Scholar]
  79. European Commission. White Paper on Sport (COM(2007) 391); European Commission: Brussels, Belgium, 2007. [Google Scholar]
  80. European Parliament. European Parliament Resolution of 2 February 2012 on the European Dimension in Sport OJ C 267; Publications Office of the European Union: Brussels, Belgium, 2012. [Google Scholar]
  81. World Health Organization. Global Action Plan on Physical Activity 2018–2030: More Active People for a Healthier World /cWorld Health Organization; World Health Organization: Geneva, Switzerland, 2018; ISBN 978-92-4-151418-7. [Google Scholar]
Figure 1. Cluster plot for nine indicators and 22 countries with mean values for clusters. Note: SClub—sporting activity in sports clubs; SA—sporting activity; CR—perception of creativity as an important feature (negative indicator); BERD—corporate R&D expenditure; RDp—R&D personnel; EPO—patent applications submitted per capita; SC—negative anti-community indicator; WP—concentration on the primary job (negative indicator); GDP—gross domestic product (GDP). BSS/TSS ratio = 75.9%, average silhouette = 0.283, Dunn index = 0.343, minimum average dissimilarity between two clusters to maximum average within cluster dissimilarity ratio = 1.108.
Sustainability 12 10489 g001
Table 1. Two creativity indexes: technology, talent, tolerance (3Ts) by Florida vs. creative class, creative infrastructure, culture (3Cs) by Yum.
Creativity IndexFlorida’s 3Ts Creativity Index (2002)
DimensionCategoryContent
Talent Creative class
Human capital index
Proportion of creative class
Proportion of university degrees holders
Technology High-tech innovation
Innovation index
The amount of high-tech production
Proportion of patents owners
Tolerance Bohemian index
Melting pot index
Gay index
Proportion of artists
Proportion of foreigners
Proportion of gay people
Creativity IndexYum 3Cs Creativity index (2015)
DimensionCategoryContent
Creative class Creative class Proportion of creative class in general population
Creative infrastructureStudy infrastructures
Rest infrastructures
People
The number of universities, creative industries (including R&D)
Number of cafes, restaurants, parks
Proportion of foreign-born people in general population
CulturePlaces
Buildings
Areas of historic preservation, number of libraries and museums
Note: Own compilation based on Florida (2002) and Yum (2015).
Table 2. Pearson’s r correlation matrix for 22 countries.
Sport Activity IndicatorsCreativity IndicatorsSocial Capital IndicatorsSocioeconomic Situation
SClubSACRBERDRDpEPOSCWPGDP
Sport activity indicatorsSClub10.79 ***−0.44 *0.67 ***0.79 ***0.75 ***−0.79 ***−0.74 ***0.83 ***
SA0.79 ***1−0.57 **0.77 ***0.87 ***0.8 ***−0.89 ***−0.66 ***0.83 ***
Creativity indicatorsCR−0.44 *−0.57 **1−0.41−0.41−0.45 *0.44 *0.09−0.64 **
BERD0.67 ***0.77 ***−0.4110.87 ***0.86 ***−0.73 ***−0.420.73 ***
RDp0.79 ***0.87 ***−0.410.87 ***10.9 ***−0.87 ***−0.67 ***0.85 ***
EPO0.75 ***0.8 ***−0.45 *0.86 ***0.9 ***1−0.88 ***−0.63 **0.85 ***
Social capital indicatorsSC−0.79 ***−0.89 ***0.44 *−0.73 ***−0.87 ***−0.88 ***10.73 ***−0.88 ***
WP−0.74 ***−0.66 ***0.09−0.42−0.67 ***−0.63 **0.73 ***1−0.62 **
Socioeconomic situationGDP0.83 ***0.83 ***−0.64 **0.73 ***0.85 ***0.85 ***−0.88 ***−0.62 **1
Note: SClub—sporting activity in sports clubs; SA—sporting activity; CR—perception of creativity as an important feature (negative indicator); BERD—corporate R&D expenditure; RDp—R&D personnel; EPO—patent applications submitted per capita; SC—social capital (negative anti-community indicator); WP—concentration on the primary job (negative indicator); GDP—gross domestic product. Significance: *** <0.001, ** <0.01, * <0.05. Normality assumption is rejected at p = 0.0013 for EPO, at p = 0.0519 for RDp and at p = 0.0966 for GDP). The values of Spearman’s rank correlation (not reported) are close to reported Pearson’s coefficients.
Publisher’s Note: MDPI stays neutral with regard to jurisdictional claims in published maps and institutional affiliations.

