Article

Can Aquaculture Ponds Be Managed as Foraging Habitats for Overwintering Water Birds? An Experimental Approach

1
Department of Ecology and Environmental Resources, National University of Tainan, Tainan 700, Taiwan
2
Taijiang National Park Headquarters, No.118, Sicao Blvd., Annan Dist., Tainan City 70955, Taiwan
*
Author to whom correspondence should be addressed.
Sustainability 2020, 12(24), 10335; https://doi.org/10.3390/su122410335
Submission received: 16 November 2020 / Revised: 7 December 2020 / Accepted: 7 December 2020 / Published: 10 December 2020
(This article belongs to the Section Sustainability, Biodiversity and Conservation)

Abstract

:
Coastal wetlands have been gradually developed by aquaculture and other anthropogenic infrastructure, reducing the habitat for water birds. The traditional operation of shallow-pond milkfish (Chanos chanos) aquaculture in Taiwan may provide a model for aquaculture production that operates in harmony with overwintering water birds. The goal of this study was to test whether experimental water drawdown of aquaculture ponds, following the seasonal, traditional milkfish aquaculture, can create resource pulses that attract water birds in Tainan City in southern Taiwan. This experiment tested four types of aquaculture with potential for application: wild fish, no-feed tilapia, milkfish, and tilapia with feed. Ponds were surveyed every other day for water depth and water birds at least 37 times in four winters after water drawdown. In general, drawdown ponds created resource pulses that attracted higher feeding bird densities and numbers of species than control ponds in all aquaculture types. Milkfish ponds often had higher water birds in each year. Deep waders were sometimes the most abundant guild in the control, whereas shorebirds, shallow and deep waders were often higher in the drawdown treatment. Bird densities and numbers of species were correlated with water level, benthic biomass and water Chl a, but not with tilapia biomass. Species, such as Black-faced Spoonbills (Platalea minor), responded to water levels with the exception of Little Egrets (Egretta garzetta). The operation of seasonal, traditional shallow-pond milkfish aquaculture is suitable for foraging of water birds during the winter migratory bird season.

1. Introduction

Coastal development, including aquaculture and mariculture development, has significantly changed wetland ecosystems around the world, consequently reducing habitats and affecting biotic communities [1,2,3,4]. Migratory water birds, relying on coastal wetlands, are among the most vulnerable groups of organisms in coastal areas and have continuously declined in numbers of species on the East Asian—Australasian Flyway [5,6]. To resolve conflicts between food production and biodiversity, the Convention of Biological Diversity declared that Satoyama landscapes are effective for keeping production in harmony with nature [7]. Many examples of traditional agriculture systems around the world not only provide food products but also maintain diverse landscapes and biodiversity [8,9]. Few examples, however, are present in the coastal aquacultural areas [10]. To facilitate the harmony between aquaculture and water birds, we need to find traditional and/or innovative solutions before formulating conservation policy.
In Southeast Asia, the alternate timing of fish cultivation and non-cultivation periods of traditional shallow-pond milkfish (Chanos chanos) aquaculture may help conserve migratory overwintering water birds. This 400-year traditional approach in Taiwan is gradually being replaced by either deep-pond aquaculture or common orient clam (Meretrix lusoria) aquaculture [11,12]. Traditionally, milkfish is cultivated from April through October because it is a tropical fish [13]. From November through the next March, the overwintering period of migratory water birds, ponds are exposed to drying and re-watering cycles in Taiwan [13]. During the drying phase, water birds can access these ponds and feed. About half the population of the endangered Black-faced Spoonbill (Platalea minor) [14] overwinters in Tainan city and its surroundings on the East Asian—Australasian Flyway [12,15]. This traditional operation of shallow ponds by milkfish aquaculture may serve as a conservation approach for migratory water birds, such as Black-faced Spoonbills, and can be used to restore a Satoumi aquaculture landscape (a coastal Satoyama) [16]. Experimental evidence of this operation, however, was lacking. This experiment adopted seasonality and operation of traditional milkfish aquaculture as guidelines to apply on different types of aquaculture.
Water bird usage of aquaculture ponds may be different from their usage in natural wetlands. In wetlands, size, water depth, and isolation are important factors affecting water bird usage of wetlands [17,18,19]. Shallow water depth usually attracts more species [17,20], whereas larger sized wetlands can have more types of species and higher densities [19,20]. Aquaculture ponds differ from wetlands in feed supply, topography, human activity and vegetation management. Whether the aforementioned factors are applicable to aquaculture ponds is not clear because there are few studies focusing on the ecology of water birds in aquaculture ponds. Abandoned aquaculture ponds, however, may be more similar to natural wetlands than production aquaculture, and may have similar usage of water birds to natural wetlands.
Food abundance also affects the habitat usage of water birds [21]. When reduced water in dry seasons forces concentrated prey densities as observed in the Everglades swamp (USA), these abundant accessible foods attract feeding of water birds [22]. This phenomenon, called resource pulse, is important to nutrition and reproduction of water birds [23,24]. Drawdown of aquaculture ponds may also create a resource pulse [25] because it can concentrate prey and make prey more vulnerable to predation, as in the natural wetlands. This resource pulse is an important food source for water birds in the Florida Everglades [22,26] and may also be an important food source for overwintering migratory water birds in coastal areas of Taiwan and adjacent regions. However, few studies have tested whether resource pulses created by water drawdown can attract water birds in different types of aquaculture.
With increasing demand for aquaculture production [27], reduced habitats in coastal areas are envisioned for water birds, especially migrants. Thus, we applied the operational seasonality of traditional shallow-pond milkfish aquaculture as a guideline for this aquaculture experiment. We tested the following hypotheses: (1) whether experimental water drawdown of aquaculture ponds that created a resource pulse of food concentration could increase feeding usage of water birds; (2) whether water birds responded differently to different types of aquaculture; (3) whether the usage patterns of water birds are related to food abundance. We also examined responses of guilds of water birds in abundance and numbers of species and evaluated the relationships between water depths and bird guilds and selected bird species. We predicted that water drawdown would increase water bird densities and the numbers of different species because prey would be concentrated and become more vulnerable to predation, which is a resource pulse that attracts usage by water birds. We also predicted that guilds of water birds would respond differently in control and drawdown because of the different requirements of water birds. In addition, water birds would positively respond to food abundance in general. Results of this study may demonstrate that the operation of aquaculture ponds following this seasonality can serve as a way to conserve migratory water birds in subtropical/tropical regions while maintaining fish production.

2. Materials and Methods

2.1. Study Area

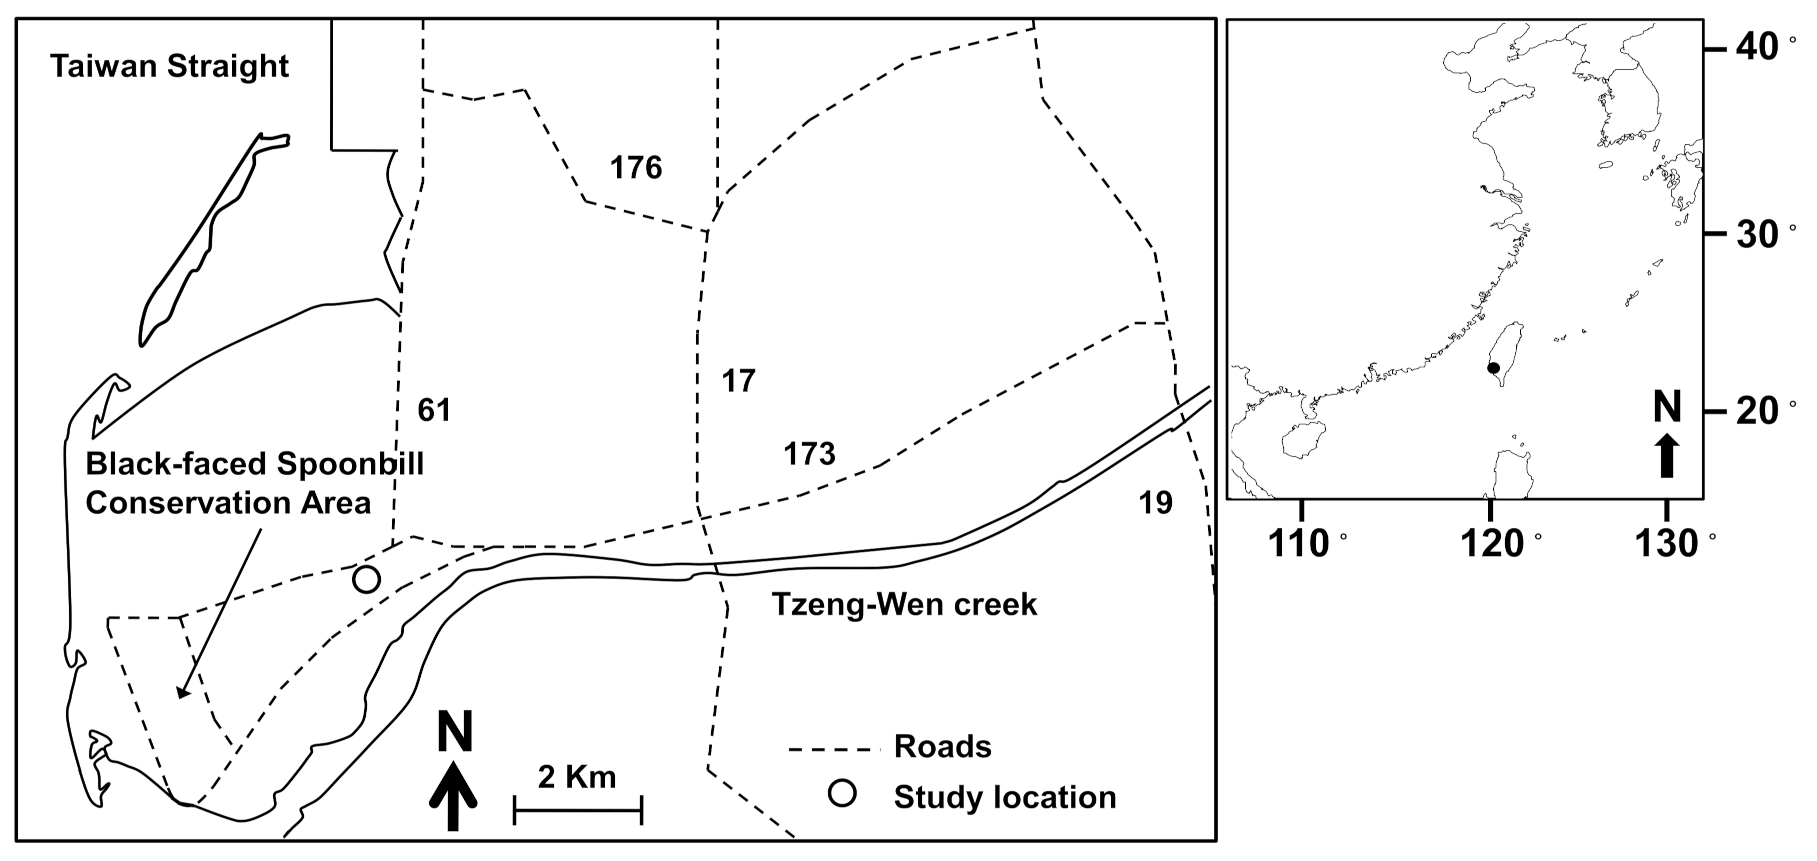
The study area is located in the Cigu region of Tainan City, southern Taiwan. This area harbors the estuary of Tzeng-Wen creek and the Black-faced Spoonbill protection area (Figure 1). The regional weather is subtropical. The average monthly temperature is highest in July (27.8 ± 0.6 °C; 2011–2016 data of the Cigu weather station of the Central Weather Bureau of Taiwan) and the lowest is in January (17.1 ± 0.9 °C). The wet season usually lasts from April through September in this part of Taiwan, whereas the dry season extends from October to March. The study area is on the East Asia-Australasian migratory flyway [28]. Migratory birds, including Black-faced Spoonbill, Pied avocet (Recurvirostra avosetta), Red-necked Stint (Calidris ruficollis) and Eurasian Wigeon (Anas penelope), overwinter in this area from September through the next April [29].
The studied aquaculture ponds are in the western section of the Cigu campus of the National University of Tainan. The western section of the Cigu campus at about 80 ha is mostly wetlands that were restored from aquaculture ponds by removing banks and reconnecting ponds to tidal canals. The studied aquaculture ponds had relatively intact earthen banks and were rehabilitated for aquaculture functions before this experiment. The water sources of these ponds were from the tidal canals and rainfall. The water in tidal canals had to be pumped into aquaculture ponds because these ponds were disconnected to canals by banks.

2.2. Experiments

In this experiment, we controlled for 2 variables: water-level manipulation and aquaculture type. The experiment had four types of aquaculture: abandoned pond with wild fish (type A), no-feed tilapia (type B), milk fish with feed (type C) and tilapia with feed (type D). The two ponds in each group were side-by-side and similar in size. The areas of ponds A1, A2, B1, B2, C1, C2, D1 and D2 were 5.09, 4.95, 5.47, 5.09, 14.35, 18.6, 7.56 and 7.82 ha, respectively. Abandoned ponds, which are scattered in the region, have the potential to cultivate wild fish or tilapia for water bird usage and to serve as a roosting habitat. Invasive tilapia, which is widely cultivated in this region, is prevalent in canals of this region [30]. Though feeding water birds with tilapia is an aggressive conservation method, this may be necessary when conserved populations are under a major threat [31]. Shallow pan milk fish ponds often have large areas in this region. Following the seasonality of shallow-pond milkfish cultivation, we cultivated these four types of aquaculture ponds, but only harvested milkfish around the end of October. Fish feed contained only grain protein and had no protein from the ocean bottom trawl. This experiment was conducted from October to January during the years 2012 to 2015. After milk fish harvest, we started the water-level manipulation, which involved drawdown and control.
The number of tilapia and benthic organisms in ponds, which are food sources for water birds, were estimated before drawdown. Tilapia populations were estimated by using mark-recapture. Captured tilapia were weighed and measured in length. Population estimation used the bias-adjusted Lincoln–Peterson estimator [32]. The number of benthic organisms, including fish, shrimps, snails and crabs, was estimated with a bottom trawl. This trawl had a trawling width of 2.6 m and a mesh size of 0.7 cm. We pulled the trawl net for 10 m to make a sampling area of 26 m2. We separated organisms into fish, shrimp and crab as well as snail groups, absorbed their water with towels and weighed them. We then estimated the total benthic animal biomass in each pond based on the trawling data and the area ratio (pond area/trawl area).
After the milkfish harvest, we left the remaining organisms in ponds. We started drawdown for only 1 pond in each type. When the average water level of the pond reached 20 cm, we stopped drawdown. The 2nd pond usually had a water depth of above 60 cm. Water in ponds would gradually dry out depending on weather conditions, such as rain, wind and humidity. After the 1st drawdown, we waited at least 20 days before the 2nd drawdown of the 2nd pond to a 20 cm depth because the evaporation rate was around 1 cm per day. Water meters were set-up at the positions of average depths in ponds, usually close to the center of ponds. The shape of each pond was like a shallow dish with a relatively flat bottom and gradually elevating ground around edges. Depths of ponds were calculated from measurements along X-shaped transects for each pond before drawdown. Water depth of each ponds was recorded to the nearest 5 cm mark during every bird survey.
The bird survey for each pond was conducted every other day after drawdown began. The survey started at about 6 a.m. and lasted 2 to 3 h. Ponds were generally not affected by tides because banks were large and were much higher than high tide flows. We recorded numbers and species of water birds inside banks of each pond. The number of surveys was 37 times for 2012, 50 times for 2013 and 2014 and 40 times for 2015. The survey durations were from November to the next January.

2.3. Data Analysis

Foraging guilds of water bird were assigned in accordance with Ma et al. [18] and our observations [30] (Table 1). Common Greenshank (Tringa nebularia), Common Redshank (Tringa tetanus) and Marsh Sandpiper (Tringa stagnatilis), commonly assigned as shorebirds, were classified as shallow waders because they use shallow water rather than mudflats in our observations. We separated long-legged waders from waders as deep waders because they were often observed in deeper waters. Based on the evaluation of the International Union for Conservation of Nature, the Red-necked Stint is near threatened and the Black-faced Spoonbill is endangered.
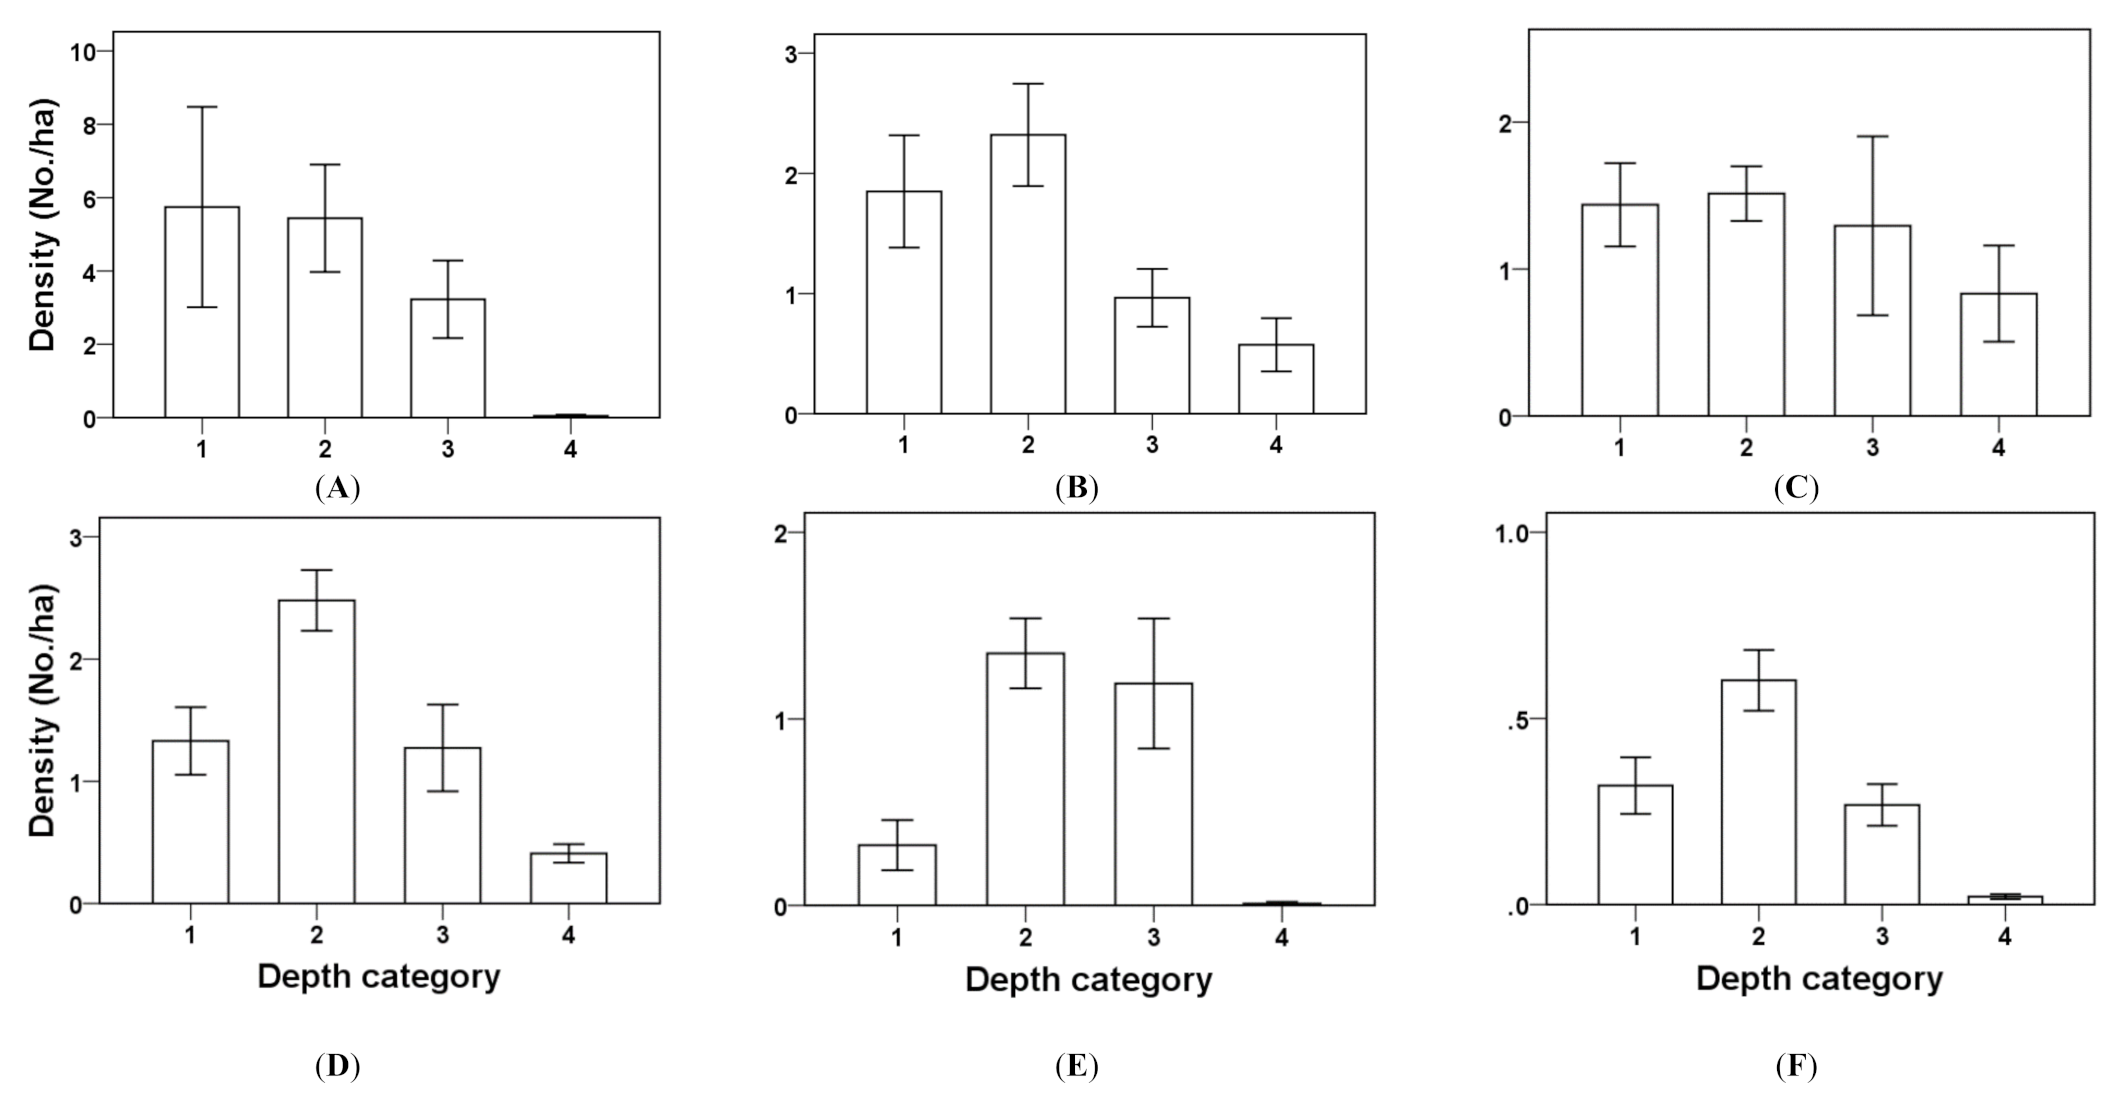
We evaluated foraging guilds by comparing densities and the number of species in each foraging guild in different water depth ranges (≤5, >5 to ≤20, >20 to ≤40 and >40 cm) with one-way analysis of variance (ANOVA) in each aquaculture type. These data were from this experiment and were log-transformed to reach normality. For all cases, the assumption of homogeneity of variance of variables was violated; therefore, Welch’s statistics were adopted [33]. When ANOVA reached significance using Welch’s statistics, we used the Games-Howell multiple comparison to separate groups of means [33]. For statistical analyses, we used SPSS 21.0 (IBMTM, Armonk, NY, USA).
To compare the effects of drawdown, aquaculture type as well as the year on density and number of species, we used three-way ANOVA to test these variables and interactions among them with 4-year data. We used Duncan tests for post-hoc analyses. These water bird data were from 10 consecutive surveys after the water level of the drawdown ponds reached 20 cm. We used data from this period because it represented higher usage by water birds. For results with interaction effects, we first analyzed effects of the aquaculture type and water level on densities and the numbers of species for each year with two-way ANOVA. Then, we compared densities and numbers of species of different types in the control and drawdown separately in each year with one-way ANOVA. Additionally, we analyzed effects of water level treatment for each aquaculture type in each year with one-way ANOVA. Densities were log(x + 1) transformed.
To assess responses of guilds to water-level and aquaculture types, we also used 3-way ANOVA to test the effects of guild, aquaculture type and water levels on density and the number of species in the data for each year. We also used Duncan tests for post-hoc analyses. For results with interaction effects, we first analyzed the effects of guilds and water levels on densities and numbers of species for each aquaculture types in each year with two-way ANOVA. Then, we compared densities and numbers of species of different guilds in the control and drawdown separately for each aquaculture type with one-way ANOVA. Additionally, we analyzed the effects of water level treatment in each bird guild for each aquaculture type with one-way ANOVA.
To understand factors related to bird density and number of species, we examined correlations among density, the number of species, bird guild, trawl biomass (including fish, shrimp and crab as well as snail separately) and pond area with Spearman rank analysis. Data of bird density and number of species were also from the same 10 consecutive surveys, because this period of concentrated usage may have a higher potential to respond to associated factors.
In addition, we compared densities of selected species among water depth ranges with one-way ANOVA. The selected species were Black-faced Spoonbills, Great Egrets, Little Egrets, Black-winged Stilts, Dunlins and Kentish Plovers, which represented the deep wader, shallow wader and shorebird guilds and had higher abundance than others in their respective guilds.

3. Results

3.1. Water Bird Guilds among Water Depths

Over the 4 years, densities and numbers of species of shorebirds, shallow, deep waders and ducks differed among water depth ranges in different aquaculture types, whereas other water birds were higher in water depth ranges >5 cm, but only in milkfish ponds (Table 2). Shorebirds, shallows and deep waders generally were higher in depth ranges of ≤40 cm, whereas ducks were higher in depth ranges of >5 cm.

3.2. Effects of Water-Level, Aquaculture Type, Year, and Guild on Water Bird Densities and Numbers of Species

Over 4 years, drawdown treatment had higher densities of water birds, and the 4th year (2015) had the highest densities (Table 3). All interactions, however, were significant except for the year and aquaculture type. Further examinations showed that aquaculture types differed in bird densities in the control except in year 2 and year 4 and differed in bird densities in the drawdown treatment in 4 years, with milk fish as the consistent higher type except in year 2 (Appendix A). Compared to the control, bird densities of aquaculture types in the drawdown treatment were higher over the 4 years except no-feed tilapia in the 1st year and milk fish in the 4th year. Statistical results for the number of species were very similar to densities, and thus are not described again.
The 1st year results showed that shallow and deep waders, milkfish ponds and drawdown ponds had higher densities than other treatments in their respective variables (Table 4). All interactions, however, were significant. Further examinations showed that guild and drawdown had significant interactions in all aquaculture types except for wild fish (Appendix B). Densities of bird guilds differed in all aquaculture types in the control except for tilapia with feed and differed across all types in the drawdown treatment. Deep waders were often the most abundant among guilds in the control, whereas shallow and deep waders were often more abundant among guilds in the drawdown treatment. Bird guilds varied in their responses to the water-level variable in aquaculture types. Shallow and deep waders often significantly increased, whereas ducks did not differ in any aquaculture type.
The 2nd year results showed that shorebirds, shallow and deep waders, wild fish and tilapia with feed types as well as drawdown treatment had higher densities than other treatments in their respective variables (Table 4). All interactions, however, were significant. Further examinations showed that the guild and water-level had significant interactions with all aquaculture types except for wild fish. Bird guilds did not differ in aquaculture types in the control but differed across all types in the drawdown treatment. Shorebirds, as well as shallow and deep waders were often higher in the drawdown treatment. Responses of bird guilds varied in the water-level variable in aquaculture types. Responses of bird guilds differed in the water-level variable. Shorebirds had significant responses to the water-level variable involving no-feed tilapia and milkfish, whereas shallow and deep waders responded more to no-feed tilapia and tilapia with feed.
The 3rd year results showed that shallow and deep waders and drawdown ponds had higher densities than other treatments in their respective variables (Table 4). All interactions were significant except for guild and aquaculture types. Further examinations showed that guild and drawdown had significant interactions with all of the aquaculture types except for tilapia with feed. Bird guilds in the control did not differ for any aquaculture types except for tilapia with feed, but did differ for all types in the drawdown treatment. Shorebirds as well as shallow and deep waders were generally higher in the drawdown treatment in aquaculture types. Responses of bird guilds varied with the water-level variable in aquaculture types. Densities of shorebirds were significant in aquaculture types in the water-level variable, whereas shallow and deep waders also responded to different aquaculture types except for tilapia with feed.
The 4th year results showed that shallow and deep waders, wild fish and milkfish types and drawdown ponds had higher densities than other treatments in their respective variables (Table 4). Guild and water level and all 3 factors had significant interactions. Further examinations showed that the guild and water-level had significant interactions with all of the aquaculture types except for tilapia with feed. Bird guilds in the control differed for milkfish and no-feed tilapia, and also differed in the drawdown treatment of all types. Deep waders were more abundant in the control, whereas shallow and deep waders were generally more abundant in the drawdown treatment in aquaculture types. Responses of the bird guilds varied with the water-level variable in aquaculture types. Densities of shorebirds were only significant in milkfish ponds in the water-level variable. Shallow waders increased in response to the drawdown treatment involving all aquaculture types, whereas deep waders and ducks responded to all types except for tilapia with feed.

3.3. Food Abundance and Water Birds

Bird densities were significantly correlated with snail biomass, trawled biomass and estimated pond biomass based on trawl (Table 5), but were not correlated with estimated tilapia biomass or pond areas. Bird densities were also correlated with shallow waders, deep waders, ducks and other guild densities. Numbers of bird species were significantly correlated with snail biomass, trawled biomass, estimated pond biomass based on trawl, water Chl a and pond area, and were negatively correlated with estimated tilapia biomass. Numbers of species were correlated with densities of deep wader and shorebird and bird densities. Deep wader densities were correlated with snail biomass, trawled fish biomass, trawled biomass and estimated pond biomass based on trawl, while shallow wader and shorebird densities had similar correlations. Polychaete densities were not correlated with any variables. In addition, pond Chl a was correlated with trawled shrimp and crab biomass, trawled snail biomass, trawled biomass and estimated pond biomass based on trawl, but were negatively correlated with estimated tilapia biomass.

3.4. Densities of Selected Species among Water Depths

Bird species generally responded to water levels (Figure 2). The densities of Great Egrets, Black-winged Stilts, Black-faced Spoonbills, Dunlins and Kentish Plovers were higher at lower water levels (Welch F3,681 = 5.5, p = 0.001; Welch F3,580 = 24.4, p < 0.001; Welch F3,521 = 8.9, p < 0.001; Welch F3,524 = 22.6, p < 0.001; Welch F3,530 = 27.8, p < 0.001; respectively). However, the densities of Little Egret did not differ among depth ranges (Welch F3,641 = 1.1, p = 0.341).

4. Discussion

4.1. Water Bird Usage of Drawdown Aquaculture Ponds

Wintering migratory water birds responded to water drawdown of aquaculture ponds. Overall, drawdown aquaculture ponds attracted higher densities and numbers of species during 4 years of the experiments. The study ponds had once harbored 18% (454 (the max. no. of 2015)/2511 (the population number from a 2015 global survey [34])) of the Black-faced Spoonbill global population during this experiment. Shorebirds, shallow waders and deep waders commonly responded to the lowered water levels, but ducks and other water birds had a much smaller response. In wetlands, Taft, Colwell, Isola and Safran [17] also showed increases of water bird densities and species richness after drawdown. Among the few examples in aquaculture, Navedo et al. [25] showed that shorebirds took advantage of water-level manipulation after harvests to feed in shrimp ponds in Mexico. On the other hand, flooding can increase species richness and densities of water birds in rice fields [35,36] that would otherwise be completely dry under regular operation during winter. These water level manipulation experiments show that water depth is the main factor that can provide habitats for water birds in aquaculture ponds and agriculture fields [18].
Drawdown of aquaculture ponds can easily attract large numbers of feeding water birds because of the following reasons. Firstly, lower water levels in aquaculture ponds can concentrate fish and shrimps into smaller volumes of water, making them visible and accessible to predation by waders. This resource pulse can be vital for survival and breeding of water birds because their breeding season starts after returning north [21,37]. Secondly, high food abundance and no vegetation cover in aquaculture ponds may lead to a high rate of foraging success, which can attract water birds. These circumstances can also lengthen the stays of water birds, thus making them easily observable by surveyors [38]. In addition, exposed mudflats with ample food can also attract feeding shorebirds.
Drawdown ponds benefited shallow and deep-water waders and shorebirds more than ducks and other water birds. These waders were sensitive to water levels and often appeared in aquaculture ponds where suitable water-levels were reached or abundant foods were observed. Little egrets can play the role of being food scouts for other waders (personal observations). Ponds with aggregations of little egrets would attract other waders, such as the Black-faced Spoonbills. Deep waders sometimes were more commonly found at the control water-level because of their long legs. Shorebirds also responded to our water-level manipulations. When water was drawn down in ponds, patches of mud flat gradually emerged around the periphery because of its higher ground. Shorebirds used these mud flats for feeding in this experiment. In aquaculture ponds, the topography of periphery may affect the environmental usage of water birds, as shown by different aquaculture types. Milkfish ponds often attracted shorebirds because they had mild slopes around their periphery. When water was further lowered to make the dry area, more mud flats were exposed for use by shorebirds. Feaga, Vilella, Kaminski and Davis [39] reported that shorebirds are sensitive to water levels in the Americas. Navedo et al. [25] also found that shorebirds grasped the opportunity of mud flat exposure for feeding in shrimp ponds.
Ducks were adapting to aquaculture operations in this aquaculture area. They are quite sensitive to human activities, and thus preferred wild fish ponds or ponds with less human disturbance [40]. These ponds were not in operation for the short term or are no longer in operation and usually had more vegetation [41]. In this study, duck densities were higher in the drawdown treatment in the 4th year. Ducks, however, got used to utilizing aquaculture ponds after cultivation periods.
Bird densities and numbers of species were related to benthic biomass of aquaculture ponds. Similarly, Gawlik [21] and Herring, Gawlik, Cook and Beerens [37] showed that water birds are sensitive to food densities. Water birds, however, were more sensitive to trawled estimated biomass than Tilapia biomass in this study. There are three possible reasons for this. Firstly, trawled biomass may be a good indicator of overall productivity in these semi-intensive ponds because organic matter eventually deposits in benthic environments and provides food for benthic organisms. Secondly, trawled organisms including snails, shrimps, crabs and gobies are food for both waders and shorebirds, which were higher in densities and compositions among guilds. Thirdly, tilapia was lower in numbers compared to trawled organisms, and their high biomass was contributed to by their relative higher body sizes. Water birds might respond more to high numbers of benthic organisms rather than to those of tilapia. Despite these relationships, drawdown still have strong effects on water birds because lower water depths can constrain food organisms and make them more accessible for water birds.

4.2. Waterbird Conservation

Black-faced Spoonbills may serve as an umbrella species to protect overwintering water birds. Iconic species, such as Black-faced Spoonbills, may attract attention from the public and funding from government agencies [42]. Once a water depth is suitable for Black-faced Spoonbills, it is also suitable for shallow- and deep-water waders. If mud flats are exposed, then shorebirds can benefit too. In this experiment, we could not restrict food access by other birds; Black-faced Spoonbills still needed to compete with other birds for food. As the population of Black-faced Spoonbills recovers [43], it expands its range searching for food and new habitats. Preserving food sources of Black-faced Spoonbills may be necessary, which may also provide food and habitats for many co-occurring water bird species.
The seasonality of traditional shallow-pond milkfish aquaculture can serve as a general guideline for migratory water bird friendly aquaculture, as revealed by results for different types of aquaculture. Conservation policies can have 2 directions to follow this seasonality. The 1st is to sustain a shallow-pond milkfish aquaculture, which can naturally share food with water birds. This approach needs to provide economic incentives to invite farmers to preserve the operation of a shallow-pond milkfish aquaculture. Currently, shallow-pond milkfish aquaculture cultivates fry or smaller fish for angling rather than larger fish because the former provides more economic benefits [44]. Shallow milkfish ponds have been gradually converted into deep-water aquaculture, involving fish types such as grouper and tilapia; these ponds cultivate fish throughout the winter [11,12]. Most milkfish in the market are produced in smaller deep ponds, which also cultivate milkfish all-year round [44]. Economical profitability is essential for these aquaculture farmers [44]. The associated economic incentives may include the secured purchase price and contract or operation subsidy to sustain farmers that are joining this shallow-pond milkfish aquaculture policy approach. An easement approach may also be feasible, with successful examples of the Wetland Reserve Program in the US [45]. When the incomes of these farmers are secured, shallow-pond milkfish aquaculture may be more strongly sustained.
The 2nd approach is to apply this seasonality to other types of aquaculture such as common orient clams. This application involves only lowering the water for a certain period of time rather than ceasing cultivation during the winter migratory water bird period, which is not economically acceptable for many farmers. Aquaculture ponds often have high productivity and abundant food. When the water level is lowered below 20 cm, many organisms become accessible to bird feeding. Proper compensation or subsidy is required for this policy. This policy may also be applied to abandoned ponds, which are good roosting sites for water birds. It is also important to preserve abandoned ponds to avoid them changing into other aquaculture or land use types.
In addition, a public awareness campaign is necessary to promote societal understandings of the risks of water birds on the East Asian - Australasian Flyway [5,6]. Successful communication with aquaculture farmers is essential because they are key stakeholders in pond management. Their understanding and join of conservation programs is a basic stepping stone towards developing a Satoumi landscape. Understanding of this conservation issue by consumers and the actions of consumers are also essential to support these conservation programs. When consumers actively buy Black-faced Spoonbill or water bird friendly products [46,47], more farmers may realize the benefits of conservation programs and obtain additional incentives to join them.

4.3. Recommendations for Operations of Aquaculture Ponds

Water level manipulation of these aquaculture ponds provides accessible feeding habitats for water birds. Our experiences may offer basic guidelines for subtropical and tropical aquaculture regions that are intending to promote coexistence between wintering migratory water birds and aquaculture. We suggest the following operations for aquaculture ponds:
  • The mean water level in ponds may be drawn down to 15 to 20 cm in October or November (after harvest). After reaching the designated water-level, the remaining water will dry out naturally through evaporation. This operational period may provide food energy to arrival wintering migratory birds to balance their expenditure during flight [48,49]. This water manipulation may favor primarily shorebirds and waders. This way, the water level gradually lowers, giving water birds ample time to find and feed on live organisms.
  • After ponds dry out in February, adding water into ponds to a water level from 5 to 15 cm may continue facilitating roosting and feeding habitats for water birds. When no cultivation work was present, water birds may roost in and around ponds without much human interference (As noted by Wang’s personal observation). Adding water from tidal canals into ponds may supply shrimps, crabs, fish and worms as new food sources. These operations may sustain migratory water bird populations through the spring.
  • Overwintering water birds may need to store energy in the spring before flying back. To provide more food for water birds during spring, ponds may sustain a high water-level during winter, then drawdown around March. Aquatic organisms, however, that are overwintering through March may have the risk of death because of low temperatures. This timing of drawdown can balance the need for water bird feeding and the time requirement for pond preparation before cultivation. This way, farmers can start cultivating fish in April or May, which leaves enough time for fish growth in the warm seasons.

5. Conclusions

This study provides results of benefits of the seasonality of shallow-pond milkfish aquaculture for winter migratory water birds on the East Asian—Australasian Flyway. All types of aquaculture, densities and numbers of species of waders and shorebirds were much higher in these shallow drawdown ponds than in the control ponds. Densities and numbers of species of water birds increased with trawled estimated benthic biomass. The numbers for most selected waterbird species, such as Black-faced Spoonbills, also increased with lower water depths. Other areas may deserve further investigations. These include the effects of drawdown speeds on usage of water birds, waterbird usage of drawdown ponds in different seasons and whether maintaining constant low water levels can maximize Black-faced Spoonbill usage of ponds.
The results of our study provide a potential direction for managing a coastal landscape with harmony between aquaculture and water birds [7]. We suggest the seasonality of shallow-pond milkfish aquaculture as a guideline for achieving this goal. Conservation policies and programs may use economic incentives to sustain water bird-friendly aquaculture. The involvement of stakeholder farmers is essential for creating a Satoumi landscape. Lastly, a public awareness campaign to encourage consumer involvement is also important.

Author Contributions

Y.-K.W. contributed to the conceptualization, methodology, project administration, data analysis and writing of this manuscript. C.-C.L. contributed to the methodology and investigation. K.-Y.H. and C.-C.T. contributed to the conceptualization, supervision, resources and project administration. All authors have read and agreed to the published version of the manuscript.

Funding

This research was funded by the Taijiang National Park Headquarter.

Acknowledgments

We thank funding support by the Taijiang National Park Headquarters. We thank Chilin Chen, Kuoshin Wang, Yungfong Huang for bird surveys and Reylin Guo, Ronkai Su, Tinhow Guo, Chiatse Li, Zusheng Huang, Yuneping Yang, Yishiang Lin, Tzeyun Lin, Shanen Peng, Mingyi Han and Hsianghow Chiu for field and lab assistance. We also thank Hans U. Dahms and Cara Lin Bridgman for the comments they provided.

Conflicts of Interest

The authors declare no conflict of interest.

Appendix A

Table A1. Results of statistical analyses for understanding three-way interactions of year, aquaculture type, and water-level on water bird densities.
VariablesYear 1Year 2Year 3Year 4
FpFpFpFp
Aquaculture type1.980.1251.260.2930.630.62.970.038
Water-level15.58<0.001107.47<0.001110.57<0.00165.11<0.001
Aquaculture type * Water-level13.20<0.0011.680.1796.93<0.0013.540.019
Water-level
Water-level = control
Aquaculture type6.410.0010.860.4722.310.0933.400.028
Water-level = drawdown
Aquaculture type8.53<0.0011.600.2076.870.0013.060.04
Aquaculture type
Type = Wild fish
Water-level10.560.00419.68<0.00114.690.00135.53<0.001
Type = No feed tilapia
Water-level0.700.41585.92<0.00134.99<0.00127.81<0.001
Type = Milkfish
Water-level32.63<0.00111.930.00387.03<0.0012.440.136
Type = Tilapia with feed
Water-level10.160.00527.19<0.0015.800.02718.70<0.001
Two-way ANOVA d.f. = 3 (type), 1 (water-level), 3 (type X water-level), 72 (error); water-level d.f. = 3 (type), 36; aquaculture type d.f. = 1 (water-level), 18. * indicates an interaction effect; for example, Guild * Water-level represents the interaction between guild and water-level.
Table A2. Results of statistical analyses for understanding three-way interactions of year, aquaculture type, and water-level on numbers of species.
VariablesYear 1Year 2Year 3Year 4
FpFpFpFp
Aquaculture type5.270.0020.510.6786.010.0016.090.001
Water-level49.35<0.00125.68<0.00179.17<0.00163.10<0.001
Aquaculture type * Water-level2.920.046.420.00111.09<0.0011.970.125
Water-level
Water-level = control
Aquaculture type0.860.476.390.0018.23<0.0011.450.245
Water-level = drawdown
Aquaculture type4.850.0061.700.1848.66<0.0015.440.003
Aquaculture type
Type = Wild fish
Water-level13.310.0020.760.39555.81<0.00118.29<0.001
Type = No feed tilapia
Water-level2.220.15451.27<0.00122.18<0.00118.47<0.001
Type = Milkfish
Water-level21.39<0.0017.520.01335.66<0.00123.48<0.001
Type = Tilapia with feed
Water-level17.090.00114.640.0010.160.6945.440.032
Two-way ANOVA d.f. = 3 (type), 1 (water-level), 3 (type X water-level), 72 (error); water-level d.f. = 3 (type), 36; aquaculture type d.f. = 1 (water-level), 18. * indicates an interaction effect.

Appendix B

Table A3. Results of statistical analyses for understanding three-way interactions of year, guild, and water-level on water bird densities.
VariablesWild FishNo-feed TilapiaMilk FishTilapia with Feed
FpFpFpFp
Year 1
Guild4.250.00310.82<0.0016.64<0.0018.18<0.001
Water-level13.79<0.0012.920.09143.76<0.00124.61<0.001
Guild * Water-level2.250.072.890.0273.190.0173.60.009
Water-level
Water-level = Control
Guild3.140.0236.74<0.0014.790.0032.280.075
Water-level = Water-level
Guild3.280.0196.92<0.0014.930.0027.05<0.001
Guild
Guild = Shorebirds
Water-level2.160.159NA 21.07<0.0012.330.144
Guild = Shallow waders
Water-level7.540.0130.110.91914.130.00110.330.005
Guild = Deep waders
Water-level4.230.0549.890.0068.520.00911.270.004
Guild = Ducks
Water-level3.830.066NA 4.20.05510.331
Guild = Other
Water-level3.60.0740.020.8891.740.2045.980.025
Year 2
Guild3.910.0067.88<0.0015.71<0.0017.77<0.001
Water-level0.590.44640.29<0.0019.950.00225.6<0.001
Guild * Water-level1.330.2677.61<0.0015.460.0018.23<0.001
Water-level
Water-level = Control
Guild2.160.08810.4180.550.70210.418
Water-level = Water-level
Guild3.080.0257.96<0.0016.4<0.0018.18<0.001
Guild
Guild = Shorebirds
Water-level1.650.2158.050.01112.60.0020.40.535
Guild = Shallow waders
Water-level0.540.47371.26<0.0010.970.33718.56<0.001
Guild = Deep waders
Water-level0.370.5510.110.0050.750.39711.70.003
Guild = Ducks
Water-level3.570.075NA 10.331NA
Guild = Other NA NA
Water-level10.331 NA
Year 3
Guild18.69<0.0018.38<0.00110.8<0.00123.25<0.001
Water-level34.33<0.00132.13<0.00169.41<0.0014.490.037
Guild * Water-level6.69<0.0015.070.0017.68<0.0011.410.237
Water-level split
Water-level = Control
Guild2.430.0611.610.1891.810.14439.54<0.001
Water-level = Water-level
Guild19.62<0.0018.22<0.00110.16<0.0017.04<0.001
Guild split
Guild = Shorebirds
Water-level5.160.03615.830.00118.69<0.0017.470.014
Guild = Shallow waders
Water-level12.170.00313.340.00233.33<0.0010.890.359
Guild = Deep waders
Water-level15.150.0014.880.0418.81<0.00100.987
Guild = Ducks
Water-levelNA NA 10.33110.331
Guild = Other
Water-level2.250.1510.610.4452.870.1070.090.763
Year 4
Guild9.85<0.00111.03<0.0011.840.1283.480.011
Water-level31.03<0.00131.99<0.00112.290.0017.050.009
Guild * Water-level7.27<0.0015.450.0019.37<0.0011.670.164
Water-level split
Water-level = Control
Guild2.40.0642.60.0483.960.0080.660.623
Water-level = Water-level
Guild10.31<0.00110.74<0.0016.88<0.0013.440.016
Guild split
Guild = Shorebirds
Water-level10.3312.150.1637.15<0.00100.987
Guild = Shallow waders
Water-level13.310.0029.730.00613.290.0028.860.008
Guild = Deep waders
Water-level15.150.00111.050.0046.430.0212.90.106
Guild = Ducks
Water-level11.390.00316.660.0017.520.0130.80.384
Guild = Other
Water-level2.290.14810.3311.010.3280.050.83
Year d.f. = 4, 1, 4, 90; Water-level d.f. = 4, 45; Guild d.f. = 1, 18. * indicates an interaction effect.
Table A4. Results of statistical analyses for understanding three-way interactions of year, guild, and water-level on numbers of species.
VariablesWild FishNo-feed TilapiaMilk FishTilapia with Feed
FpFpFpFp
Year 1
Guild7.98<0.0017.74<0.00110.1<0.00110.77<0.001
Water-level17.21<0.0013.480.06531.43<0.00123.92<0.001
Guild * Water-level4.090.0042.760.0323.550.0104.130.004
Water-level
Water-level = Control
Guild3.320.0184.870.0026.47<0.0013.220.021
Water-level = Water-level
Guild6.48<0.0015.380.0016.93<0.0018.99<0.001
Guild
Guild = Shorebirds
Water-level2.250.151 NA21.6<0.0013.270.087
Guild = Shallow waders
Water-level8.020.0110.570.45912.590.00211.560.003
Guild = Deep waders
Water-level6.690.0198.710.0093.270.0875.890.026
Guild = Ducks
Water-level3.270.087 NA2.420.13710.331
Guild = Other
Water-level3.860.0650.600.4491.980.1776.230.022
Year 2
Guild5.68<0.0019.81<0.0015.360.00110.58<0.001
Water-level1.260.26545.51<0.00111.570.00123.56<0.001
Guild * Water-level0.550.6999.10<0.0014.070.00411.39<0.001
Water-level
Water-level = Control
Guild2.090.0981.000.4180.790.5351.000.418
Water-level = Water-level
Guild4.880.0029.91<0.0016.16<0.00111.41<0.001
Guild
Guild = Shorebirds
Water-level1.710.2077.580.01312.810.0020.401.000
Guild = Shallow waders
Water-level0.001.00040.09<0.0011.250.27916.160.001
Guild = Deep waders
Water-level0.1060.7499.930.0062.420.13710.760.004
Guild = Ducks
Water-level3.860.065 NA1.000.331 NA
Guild = Other
Water-level1.000.331 NA NA NA
Year 3
Guild20.39<0.0018.51<0.00116.61<0.00130.99<0.001
Water-level43.11<0.00127.53<0.00151.99<0.0010.230.632
Guild * Water-level7.21<0.0015.460.00111.02<0.0013.240.016
Water-level
Water-level = Control
Guild3.090.0251.460.2312.540.05331.07<0.001
Water-level = Water-level
Guild18.71<0.0017.97<0.00117.01<0.00110.41<0.001
Guild
Guild = Shorebirds
Water-level4.370.05111.170.00414.880.0017.230.015
Guild = Shallow waders
Water-level23.04<0.00115.350.00130.76<0.0010.240.630
Guild = Deep waders
Water-level17.310.0013.130.0945.740.0283.900.064
Guild = Ducks
Water-level NA NA1.000.3311.000.331
Guild = Other
Water-level2.250.1510.360.5562.460.1350.001.000
Year 4
Guild13.49<0.00114.04<0.00110.760.0017.46<0.001
Water-level24.65<0.00128.49<0.00128.94<0.0017.730.007
Guild * Water-level6.42<0.0015.290.00110.89<0.0013.280.015
Water-level
Water-level = Control
Guild3.110.0242.710.0422.830.0351.520.214
Water-level = Water-level
Guild11.62<0.00113.52<0.00115.32<0.0017.59<0.001
Guild
Guild = Shorebirds
Water-level1.000.3312.250.15132.11<0.0010.001.000
Guild = Shallow waders
Water-level9.520.0067.570.01321.69<0.00112.600.002
Guild = Deep waders
Water-level17.310.00117.890.0014.130.0570.760.395
Guild = Ducks
Water-level10.760.00414.880.0017.580.0131.200.288
Guild = Other
Water-level0.600.4491.000.3310.950.3420.001.000
Year d.f. = 4, 1, 4, 90; Water-level d.f. = 4, 45; Guild d.f. = 1, 18. * indicates an interaction effect.

References

  1. De Silva, S. Aquaculture: A newly emergent food production sector—And perspectives of its impacts on biodiversity and conservation. Biodivers. Conserv. 2012, 21, 3187–3220. [Google Scholar] [CrossRef]
  2. Hamilton, S. Assessing the role of commercial aquaculture in displacing mangrove forest. Bull. Mar. Sci. 2013, 89, 585–601. [Google Scholar] [CrossRef]
  3. He, Q.; Bertness, M.D.; Bruno, J.F.; Li, B.; Chen, G.; Coverdale, T.C.; Altieri, A.H.; Bai, J.; Sun, T.; Pennings, S.C.; et al. Economic development and coastal ecosystem change in China. Sci. Rep. 2015, 4, srep05995. [Google Scholar] [CrossRef] [PubMed]
  4. Bino, G.; Kingsford, R.T.; Brandis, K.J. Australia’s wetlands—Learning from the past to manage for the future. Pac. Conserv. Biol. 2016, 22, 116–129. [Google Scholar] [CrossRef]
  5. Murray, N.J.; Clemens, R.S.; Phinn, S.R.; Possingham, H.P.; Fuller, R.A. Tracking the rapid loss of tidal wetlands in the Yellow Sea. Front. Ecol. Environ. 2014, 12, 267–272. [Google Scholar] [CrossRef] [Green Version]
  6. Piersma, T.; Lok, T.; Chen, Y.; Hassell, C.J.; Yang, H.-Y.; Boyle, A.; Slaymaker, M.; Chan, Y.-C.; Melville, D.S.; Zhang, Z.-W.; et al. Simultaneous declines in summer survival of three shorebird species signals a flyway at risk. J. Appl. Ecol. 2016, 53, 479–490. [Google Scholar] [CrossRef]
  7. Takeuchi, K. Rebuilding the relationship between people and nature: The Satoyama Initiative. Ecol. Res. 2010, 25, 891–897. [Google Scholar] [CrossRef] [Green Version]
  8. Berglund, B.E.; Kitagawa, J.; Lagerås, P.; Nakamura, K.; Sasaki, N.; Yasuda, Y. Traditional Farming Landscapes for Sustainable Living in Scandinavia and Japan: Global Revival through the Satoyama Initiative. Ambio 2014, 43, 559–578. [Google Scholar] [CrossRef] [Green Version]
  9. Takeuchi, K.; Ichikawa, K.; Elmqvist, T. Satoyama landscape as social–ecological system: Historical changes and future perspective. Curr. Opin. Environ. Sustain. 2016, 19, 30–39. [Google Scholar] [CrossRef]
  10. Walton, M.; Vilas, C.; Cañavate, J.P.; González-Ortegón, E.; Prieto, A.; Van Bergeijk, S.; Green, A.; Librero, M.; Mazuelos, N.; Le Vay, L. A model for the future: Ecosystem services provided by the aquaculture activities of Veta la Palma, Southern Spain. Aquaculture 2015, 448, 382–390. [Google Scholar] [CrossRef] [Green Version]
  11. Tsai, C.-C. The Effect of fish farm types on distribution and habitat use of Black-Faced Spoonbills (Platalea minor) in Tainan. Unpublished Thesis, National Pingtung University of Science and Technology, Pingtung County, Taiwan, 2009. [Google Scholar]
  12. Chen, K.-N. Spatiotemporal dynamics of ecological variation affect an endangered migratory bird Black-faced Spoonbill (Platalea minor) in southwestern coast of Taiwan. Open J. Ecol. 2014, 4, 87–97. [Google Scholar] [CrossRef] [Green Version]
  13. Lee, C.S.; Gordon, M.S.; Watanabe, W.O. (Eds.) Aquaculture of Milkfish: State of the Art; Oceanic Institute: Waimanalo Beach, HI, USA, 1986. [Google Scholar]
  14. BirdLife International. Platalea minor. The IUCN Red List of Threatened Species 2017: E.T22697568A119347801; BirdLife International: Cambridge, UK, 2017. [Google Scholar] [CrossRef]
  15. Ueta, M.; Melville, D.S.; Wang, Y.; Ozaki, K.; Kanai, Y.; Leader, P.J.; Wang, C.-C.; Kuo, C. Discovery of the breeding sites and migration routes of Black-faced Spoonbills Platalea minor. Ibis 2002, 144, 340–343. [Google Scholar] [CrossRef]
  16. Sakurai, R.; Ota, T.; Uehara, T. Sense of place and attitudes towards future generations for conservation of coastal areas in the Satoumi of Japan. Biol. Conserv. 2017, 209, 332–340. [Google Scholar] [CrossRef]
  17. Taft, O.W.; Colwell, M.A.; Isola, C.R.; Safran, R.J. Waterbird responses to experimental drawdown: Implications for the multispecies management of wetland mosaics. J. Appl. Ecol. 2002, 39, 987–1001. [Google Scholar] [CrossRef] [Green Version]
  18. Ma, Z.; Cai, Y.; Li, B.; Chen, J. Managing wetland habitats for waterbirds: An international perspective. Wetlands 2009, 30, 15–27. [Google Scholar] [CrossRef]
  19. Sebastián-González, E.; Green, A.J. Habitat use by waterbirds in relation to pond size, water depth, and isolation: Lessons from a restoration in Southern Spain. Restor. Ecol. 2013, 22, 311–318. [Google Scholar] [CrossRef]
  20. Colwell, M.A.; Taft, O.W. Waterbird communities in managed wetlands varying in depth. Waterbirds 2000, 23, 45–55. [Google Scholar]
  21. Gawlik, D.E. The effects of prey availability on the numerical response of wading birds. Ecol. Monog. 2002, 72, 329–346. [Google Scholar] [CrossRef]
  22. Botson, B.A.; Gawlik, D.E.; Trexler, J.C. Mechanisms that generate resource pulses in a fluctuating wetland. PLoS ONE 2016, 11, e0158864. [Google Scholar] [CrossRef]
  23. Yang, L.H.; Bastow, J.L.; Spence, K.O.; Wright, A.N. What can we learn from resource pulses? Ecology 2008, 89, 621–634. [Google Scholar] [CrossRef]
  24. Armstrong, J.B.; Takimoto, G.T.; Schindler, D.E.; Hayes, M.M.; Kauffman, M.J. Resource waves: Phenological diversity enhances foraging opportunities for mobile consumers. Ecology 2016, 97, 1099–1122. [Google Scholar] [CrossRef] [PubMed]
  25. Navedo, J.G.; Fernández, G.; Valdivia, N.; Drever, M.C.; Masero, J.A. Identifying management actions to increase foraging opportunities for shorebirds at semi-intensive shrimp farms. J. Appl. Ecol. 2016, 54, 567–576. [Google Scholar] [CrossRef]
  26. Yurek, S.; DeAngelis, D.L. Resource concentration mechanisms facilitate foraging success in simulations of a pulsed oligotrophic wetland. Landsc. Ecol. 2019, 34, 583–601. [Google Scholar] [CrossRef]
  27. Food and Agriculture Organization (FAO). The State of World Fisheries and Aquaculture 2016; Food and Agriculture Organization of the United Nations: Rome, Italy, 2016. [Google Scholar]
  28. Milton, D. Threatened shorebird species of the East Asian–Australasian Flyway: Significance for Australian wader study groups. Wader Study Group Bull. 2003, 100, 105–110. [Google Scholar]
  29. Li, Z.W.D.; Bloem, A.; Delany, S.; Martakis, G.; Quintero, J.O. Status of Waterbirds in Asia—Results of the Asian Waterbird Census: 1987–2007; Wetlands International: Kuala Lumpur, Malaysia, 2009. [Google Scholar]
  30. Wang, Y.-K. An Eco-Aquaculture Project that Ensuring Food Sources of Black-Faced Spoonbills; Taijian National Park Headquarter: Tainan City, Taiwan, 2012. (In Chinese) [Google Scholar]
  31. Ewen, J.G.; Walker, L.; Canessa, S.; Groombridge, J.J. Improving supplementary feeding in species conservation. Conserv. Biol. 2014, 29, 341–349. [Google Scholar] [CrossRef] [PubMed] [Green Version]
  32. Williams, B.K.; Nichols, J.D.; Conroy, M.J. Analysis and Management of Animal Populations; Academic Press: Orlando, FL, USA, 2002. [Google Scholar]
  33. Field, A. Discovering Statistics Using SPSS, 3rd ed.; Sage Publications Ltd.: London, UK, 2009. [Google Scholar]
  34. Mundkur, T.; Langendoen, T.; Watkins, D. The Asian Waterbird Census 2008–2015: Results of Coordinated Counts in Asia and Australasia; Wetlands International: LZ Ede, The Netherlands, 2017. [Google Scholar]
  35. Elphick, C.S.; Oring, L.W. Winter management of Californian rice fields for waterbirds. J. Appl. Ecol. 1998, 35, 95–108. [Google Scholar] [CrossRef]
  36. Fujioka, M.; Lee, S.D.; Kurechi, M.; Yoshida, H. Bird use of Rice Fields in Korea and Japan. Waterbirds 2010, 33, 8–29. [Google Scholar] [CrossRef]
  37. Herring, G.; Gawlik, D.E.; Cook, M.I.; Beerens, J.M. Sensitivity of Nesting Great Egrets (Ardea alba) and White Ibises (Eudocimus albus) to Reduced Prey Availability. Auk 2010, 127, 660–670. [Google Scholar] [CrossRef]
  38. Amano, T.; Katayama, N. Hierarchical movement decisions in predators: Effects of foraging experience at more than one spatial and temporal scale. Ecology 2009, 90, 3536–3545. [Google Scholar] [CrossRef]
  39. Feaga, J.S.; Vilella, F.J.; Kaminski, R.M.; Davis, J.B. Waterbird Use of Catfish Ponds and Migratory Bird Habitat Initiative Wetlands in Mississippi. Waterbirds 2015, 38, 269–281. [Google Scholar] [CrossRef]
  40. Blanc, R.; Guillemain, M.; Mouronval, J.B.; Desmonts, D.; Fritz, H. Effects of non-consumptive leisure disturbance to wildlife. Rev. Ecol. 2006, 61, 117–133. [Google Scholar]
  41. Pease, M.L.; Rose, R.K.; Butler, M.J. Effects of human disturbances on the behavior of wintering ducks. Wildl. Soc. Bull. 2005, 33, 103–112. [Google Scholar] [CrossRef] [Green Version]
  42. Small, E. The new Noah’s Ark: Beautiful and useful species only. Part 1. Biodiversity conservation issues and priorities. Biodiversity 2011, 12, 232–247. [Google Scholar] [CrossRef]
  43. Sung, Y.-H.; Tse, I.W.-L.; Yu, Y.-T. Population trends of the Black-faced Spoonbill Platalea minor: Analysis of data from international synchronised censuses. Bird Conserv. Int. 2017, 28, 157–167. [Google Scholar] [CrossRef]
  44. Wu, S.-H.; Cheng, F.-C. The Preservation and Outreach Project for the Humanistic Asset of Taijiang Area: A Survey of Aquaculture Industry with Emphasis on Milkfish; Taijiang National Park Service: Tainan City, Taiwan, 2013. (In Chinese) [Google Scholar]
  45. Duffy, W.G.; Kahara, S.N. Wetland ecosystem services in California’s Central Valley and implications for the Wetland Reserve Program. Ecol. Appl. 2011, 21, S18–S30. [Google Scholar] [CrossRef]
  46. Costanza, R.; de Groot, R.; Sutton, P.; van der Ploeg, S.; Anderson, S.J.; Kubiszewski, I.; Faber, S.; Turner, R.K. Changes in the global value of ecosystem services. Global Env. Chang. 2014, 26, 152–158. [Google Scholar] [CrossRef]
  47. Tuanmu, M.-N.; Viña, A.; Yang, W.; Chen, X.; Shortridge, A.M.; Liu, J. Effects of payments for ecosystem services on wildlife habitat recovery. Conserv. Biol. 2016, 30, 827–835. [Google Scholar] [CrossRef]
  48. Kersten, M.; Piersma, T. High Levels of Energy Expenditure in Shorebirds; Metabolic Adaptations to an Energetically Expensive Way of Life. Ardea 2002, 38–90, 175–187. [Google Scholar] [CrossRef] [Green Version]
  49. Klaassen, M. Metabolic constraints on long-distance migration in birds. J. Exp. Biol. 1996, 199, 57–64. [Google Scholar]
Figure 1. The study location is in the Cigu region of Tainan City, Taiwan.
Sustainability 12 10335 g001
Figure 2. Densities of (A) Black-faced spoonbills, (B) Great egrets, (C) Little egrets, (D) Black-winged stilts, (E) Dunlins and (F) Kentish plovers in different water depth categories in four years of the experiment. Bars represent mean, and upper and lower lines indicate 1 SE. Depth category 1 is ≤5 cm, category 2 is >5 to ≤20 cm, category 3 is >20 to ≤40 cm, and category 4 is >40 cm.
Sustainability 12 10335 g002
Table 1. Water bird species recorded in the experiment and guild assignments.
ShorebirdsShallow WadersDeep WadersDucksOther Water Birds
Ixobrychus cinnamomeus (Cinnamon Bittern)Mesophoyx intermedia (Intermediate Egret)Ardea cinereal (Grey Heron)Anas acuta (Northern Pintail)Alcedo atthis (Common Kingfisher)
Ixobrychus sinensis (Yellow Bittern)Egretta garzetta (Little Egret)Ardea purpurea (Purple Heron)Anas clypeata (Northern Shoveler)Chlidonias hybrida (Whiskered Tern)
Nycticorax nycticora (Black-crowned Night-Heron)Recurvirostra avosetta (Pied Avocet)Ardea alba (Great Egret)Anas crecca (Green-winged Teal)Sternula albifrons (Little Tern)
Charadrius alexandrines (Kentish Plover)Tringa tetanus (Common Redshank)Himantopus himantopus (Black-winged Stilt)Anas penelope (Eurasian Wigeon)Chlidonias leucopterus (White-winged Tern)
Charadrius dubius (Little Ringed Plover)Tringa nebularia (Common Greenshank) Anas platyrhynchos (Mallard)Tachybaptus ruficollis (Little Grebe)
Pluvialis fulva (Pacific Golden-Plover)Tringa stagnatilis (Marsh Sandpiper) Gallinula chloropus (Eurasian Moorhen)
Actitis hypoleucos (Common Sandpiper)Threskiornis aethiopicus(Sacred Ibis) Fulica atra (Eurasian Coot)
Calidris alpine (Dunlin)Platalea minor (Black-faced Spoonbill)
Calidris ruficollis (Red-necked Stint)
Tringa glareola (Wood Sandpiper)
Table 2. Densities and numbers of species of water bird guilds in different ranges of water depths in different aquaculture types.
TypesGuildsdfWelch FpWater Depth (cm)
≤5>5–≤20>20–≤40>40
Wild fish ponds
Density (No./ha)
Shorebird3132.16.61<0.0010.00 ± 0.00 b0.30 ± 0.08 a0.70 ± 0.40 ab0.04 ± 0.04 b
Shallow3112.35.00.00321.95 ± 14.52 ab7.90 ± 2.00 a1.51 ± 0.25 b0.90 ± 0.33 b
Deep3120.38.81<0.0016.18 ± 1.89 ab7.17 ± 1.14 a2.24 ± 0.53 b1.17 ± 0.55 b
Duck3146.86.120.0010.11 ± 0.11 b3.22 ± 0.84 a0.91 ± 0.32 ab0.41 ± 0.41 b
Other3132.710.3940.16 ± 0.160.32 ± 0.210.24 ± 0170.72 ± 0.28
No. of species
Shorebird3143.94.150.0070.03 ± 0.03 ab0.12 ± 0.03 a0.15 ± 0.04 a0.02 ± 0.02 b
Shallow3110.716.62<0.0011.17 ± 0.24 a1.15 ± 0.09 a0.54 ± 0.07 b0.32 ± 0.09 b
Deep3109.917.86<0.0010.89 ± 0.16 a1.03 ± 0.07 a0.49 ± 0.07 b0.30 ± 0.09 b
Duck3140.25.030.0020.03 ± 0.03 b0.15 ± 0.03 a0.10 ± 0.03 ab0.02 ± 0.02 b
Other3108.91.870.1380.03 ± 0.030.05 ± 0.020.05 ± 0.020.18 ± 0.06
No feed Tilapia
Density (No./ha)
Shorebird3189.95.920.0011.36 ± 0.43 a0.58 ± 0.19 a0.04 ± 0.03 bShorebird
Shallow3183.24.830.0038.73 ± 3.14 ab15.85 ± 4.86 a1.29 ± 0.22 bShallow
Deep3179.09.89<0.0013.20 ± 0.91 a3.86 ± 0.96 a1.44 ± 0.24 a0.41 ± 0.10 b
Duck3153.13.610.0150.10 ± 0.07 b2.98 ± 1.05 a1.24 ± 0.68 a0.00 ± 0.00 b
Other3158.52.30.0790.10 ± 0.070.31 ± 0.120.49 ± 0.160.33 ± 0.14
No. of species
Shorebird3188.39.25<0.0010.28 ± 0.06 a0.17 ± 0.04 a0.03 ± 0.02 b0.02 ± 0.02 b
Shallow3168.012.5<0.0011.37 ± 0.14 a1.28 ± 0.11 a0.60 ± 0.09 b0.67 ± 0.14 b
Deep3168.78.74<0.0010.62 ± 0.10 ab0.90 ± 0.08 a0.69 ± 0.11 a0.31 ± 0.09 b
Duck3172.53.420.0190.02 ± 0.02 b0.11 ± 0.03 a0.09 ± 0.04 ab0.00 ± 0.00 b
Other3143.86.120.0010.02 ± 0.02 b0.10 ± 0.03 ab0.21 ± 0.05 a0.15 ± 0.06 ab
Milkfish
Density (No./ha)
Shorebird3104.224.3<0.0013.61 ± 2.27 ab10.77 ± 1.39 a5.57 ± 1.44 a0.16 ± 0.07 b
Shallow3105.811.5<0.0013.03 ± 1.39 b12.43 ± 2.56 a14.95 ± 4.16 a0.74 ± 0.16 b
Deep3114.48.1<0.0011.55 ± 0.53 b8.31 ± 1.57 a4.15 ± 1.93 ab1.00 ± 0.16 b
Duck3173.83.580.0150.00 ± 0.00 b0.20 ± 0.10 ab0.34 ± 0.26 ab2.61 ± 1.18 a
Other3173.87.42<0.0010.00 ± 0.00 b0.74 ± 0.28 a1.24 ± 0.43 a0.50 ± 0.19 a
No. of species
Shorebird3116.655.46<0.0010.50 ± 0.15 bc1.52 ± 0.11 a0.69 ± 0.09 b0.12 ± 0.03 c
Shallow3126.224.24<0.0011.37 ± 0.24 ab2.09 ± 0.17 a1.31 ± 0.16 b0.57 ± 0.08 c
Deep3138.48.85<0.0010.71 ± 0.15 b1.32 ± 0.11 a0.93 ± 0.11 ab0.64 ± 0.08 b
Duck3177.51.760.1560.00 ± 0.000.07 ± 0.030.06 ± 0.030.13 ± 0.04
Other3180.550.0020.00 ± 0.00 b0.14 ± 0.04 ab0.19 ± 0.05 a0.15 ± 0.04 a
Tilapia with feed
Density (No./ha)
Shorebird3141.68.72<0.0010.59 ± 0.31 b2.28 ± 0.52 a0.301 ± 0.11 b0.04 ± 0.04 b
Shallow3132.77.75<0.0019.32 ± 4.40 a4.70 ± 0.83 ab5.71 ± 3.85 ab1.00 ± 0.19 b
Deep3141.814.9<0.0014.52 ± 1.16 a3.90 ± 0.50 a2.83 ± 0.90 ab0.76 ± 0.19 b
Duck3129.93.260.0240.10 ± 0.10 b0.48 ± 0.20 b1.83 ± 1.05 a0.00 ± 0.00 b
Other3172.40.830.4780.15 ± 0.100.31 ± 0.100.57 ± 0.330.32 ± 0.16
No. of species
Shorebird3139.913.41<0.0010.18 ± 0.06 ab0.35 ± 0.06 a0.11 ± 0.04 b0.01 ± 0.01 b
Shallow3163.019.84<0.0011.40 ± 0.16 a1.22 ± 0.10 ab0.86 ± 0.13 b0.43 ± 0.07 c
Deep3172.121.11<0.0010.94 ± 0.10 a0.95 ± 0.09 a0.62 ± 0.09 b0.26 ± 0.06 c
Duck3163.93.250.0230.02 ± 0.02 b0.08 ± 0.03 ab0.11 ± 0.04 a0.00 ± 0.00 b
Other3176.90.440.7230.06 ± 0.040.12 ± 0.030.11 ± 0.040.08 ± 0.03
a, b, and c indicate grouping results of post-hoc comparisons. ab indicates that it belongs to both a and b groups.
Table 3. Results of three-way ANOVA on drawdown, aquaculture type and year on water bird density and number of species. Error d.f. s= 288.
VariablesDegree of FreedomDensityNo. of Species
FpFp
Year311.4<0.00119.7<0.001
Type32.30.07813.0<0.001
Drawdown1293.1<0.001214.5<0.001
Year × Type91.80.0762.40.13
Year × Drawdown36.4<0.0015.90.001
Type × Drawdown37.0<0.0018.0<0.001
Year x Type × Drawdown96.4<0.0014.4<0.001
Table 4. Results of 3-way ANOVA on guild, aquaculture type and drawdown on water bird density and the number of species in different years.
VariablesYear 1Year 2Year 3Year 4
FpFpFpFp
Density
Guild20.4<0.00114.4<0.00152.2<0.00120.0<0.001
Type5.90.0014.60.0042.00.1073.40.017
Drawdown77.9<0.00129.3<0.001129.2<0.00170.7<0.001
Guild × Type2.20.0132.50.0031.40.1741.20.303
Guild × Drawdown5.00.0017.5<0.00115.0<0.00110.5<0.001
Type × Drawdown7.2<0.0018.0<0.0019.8<0.0011.90.13
Guild × Type × Drawdown2.20.0113.1<0.0012.50.0044.8<0.001
No. of species
Guild32.5<0.00123.9<0.00165.5<0.00141.6<0.001
Type7.6<0.0010.80.5227.8<0.0018.3<0.001
Drawdown71.0<0.00138.0<0.001102.7<0.00185.5<0.001
Guild × Type1.60.0831.90.0321.90.0351.30.2
Guild × Drawdown10.0<0.00110.3<0.00119.1<0.00118.6<0.001
Type × Drawdown4.20.0069.5<0.00114.4<0.0012.70.047
Guild × Type × Drawdown1.50.1203.7<0.0014.1<0.0013.3<0.001
Guild d.f. = 4, type d.f. = 3, drawdown d.f. = 1, Error d.f. = 360.
Table 5. Spearman rank correlations among food abundance and water bird variables.
VariablesDensityNo. SpeciesShorebirdShallow WaderDeep WaderDuckOther GuildAreaTrawled Shrimp and CrabTrawled SnailTrawled BiomassTrawl Estimated TotalEstimated Tilapia BiomassPolychaete Density
No. species0.56 **
Shorebird 0.59 **
Shallow wader0.87 ***
Deep wader0.62 **0.53 **
Duck0.49 *
Other guild0.54 ** 0.60 **
Area 0.42 *
Trawled shrimp and crab −0.44 * 0.58 **
Trawled snail0.60 **0.49 * 0.47 *
Trawled biomass0.59 **0.49 * 0.54 **0.68 ** 0.48 * 0.99 ***
Trawled estimated total0.58 **0.58 ** 0.52 *0.63 ** 0.43 * 0.93 ***0.95 ***
Estimated Tilapia biomass −0.41 * −0.491 *
Chl a 0.48 * 0.50 *0.66 **0.50 *0.56 **0.67 **−0.48 *−0.48 *
* denotes p < 0.05; ** denotes p < 0.001; *** denotes p < 0.001.
Publisher’s Note: MDPI stays neutral with regard to jurisdictional claims in published maps and institutional affiliations.

