The Effects of Macroeconomic Factors on Road Traffic Safety: A Study Based on the ARDL-ECM Model


Abstract
1. Introduction
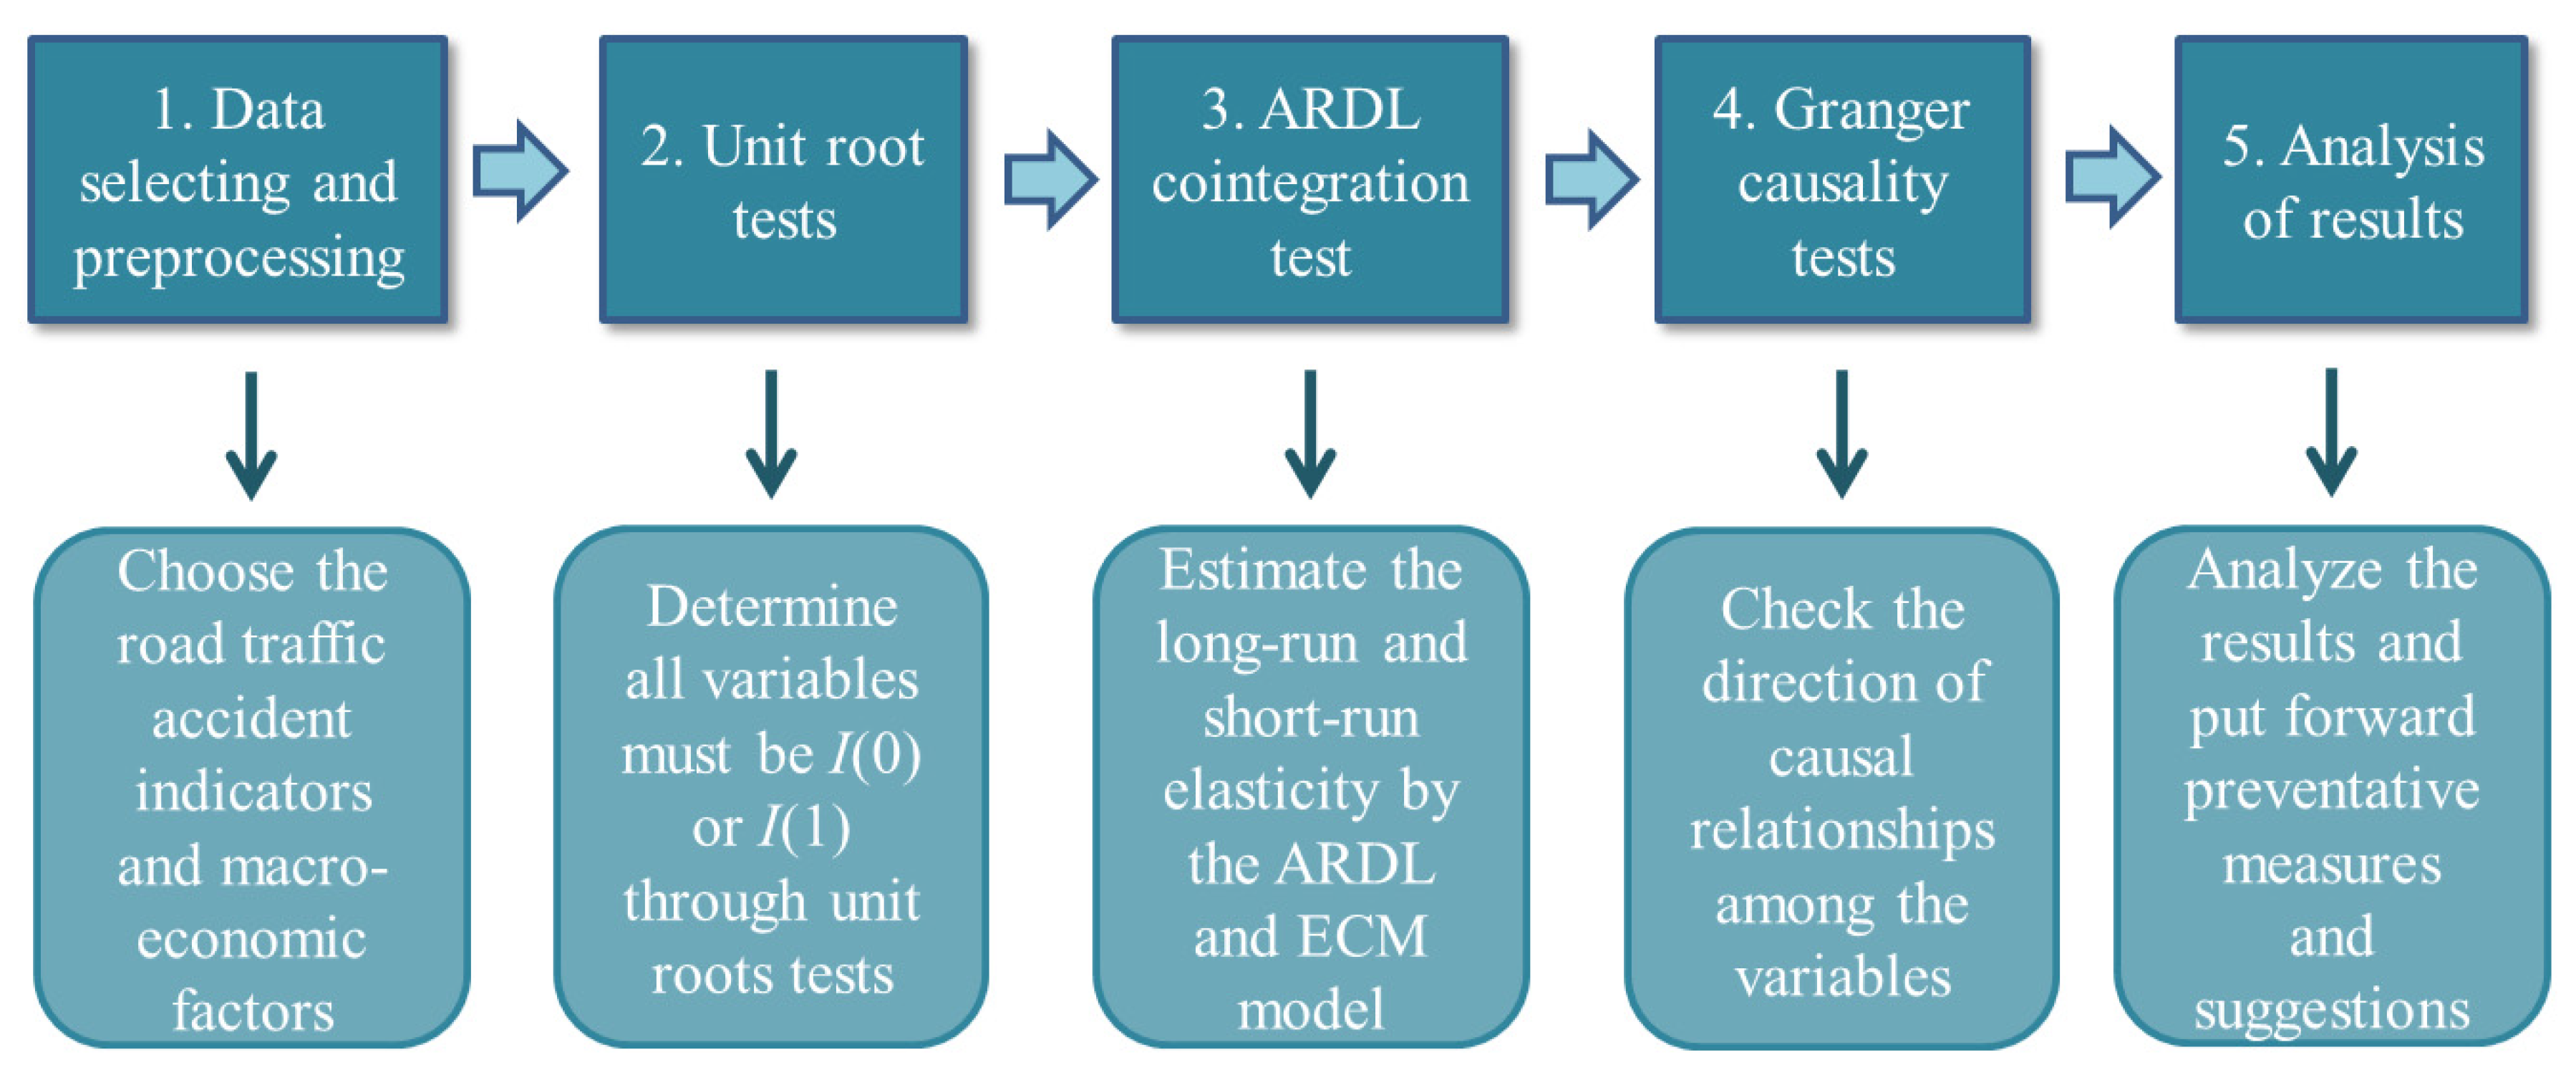
2. Data Selection
3. Empirical Analysis
4. Results and Discussion
4.1. Unit Root Tests
4.2. ARDL Bound Cointegration Test
4.3. Estimation of Long- and Short-Run Dynamics
4.4. Granger Causality Tests within the VECM Framework
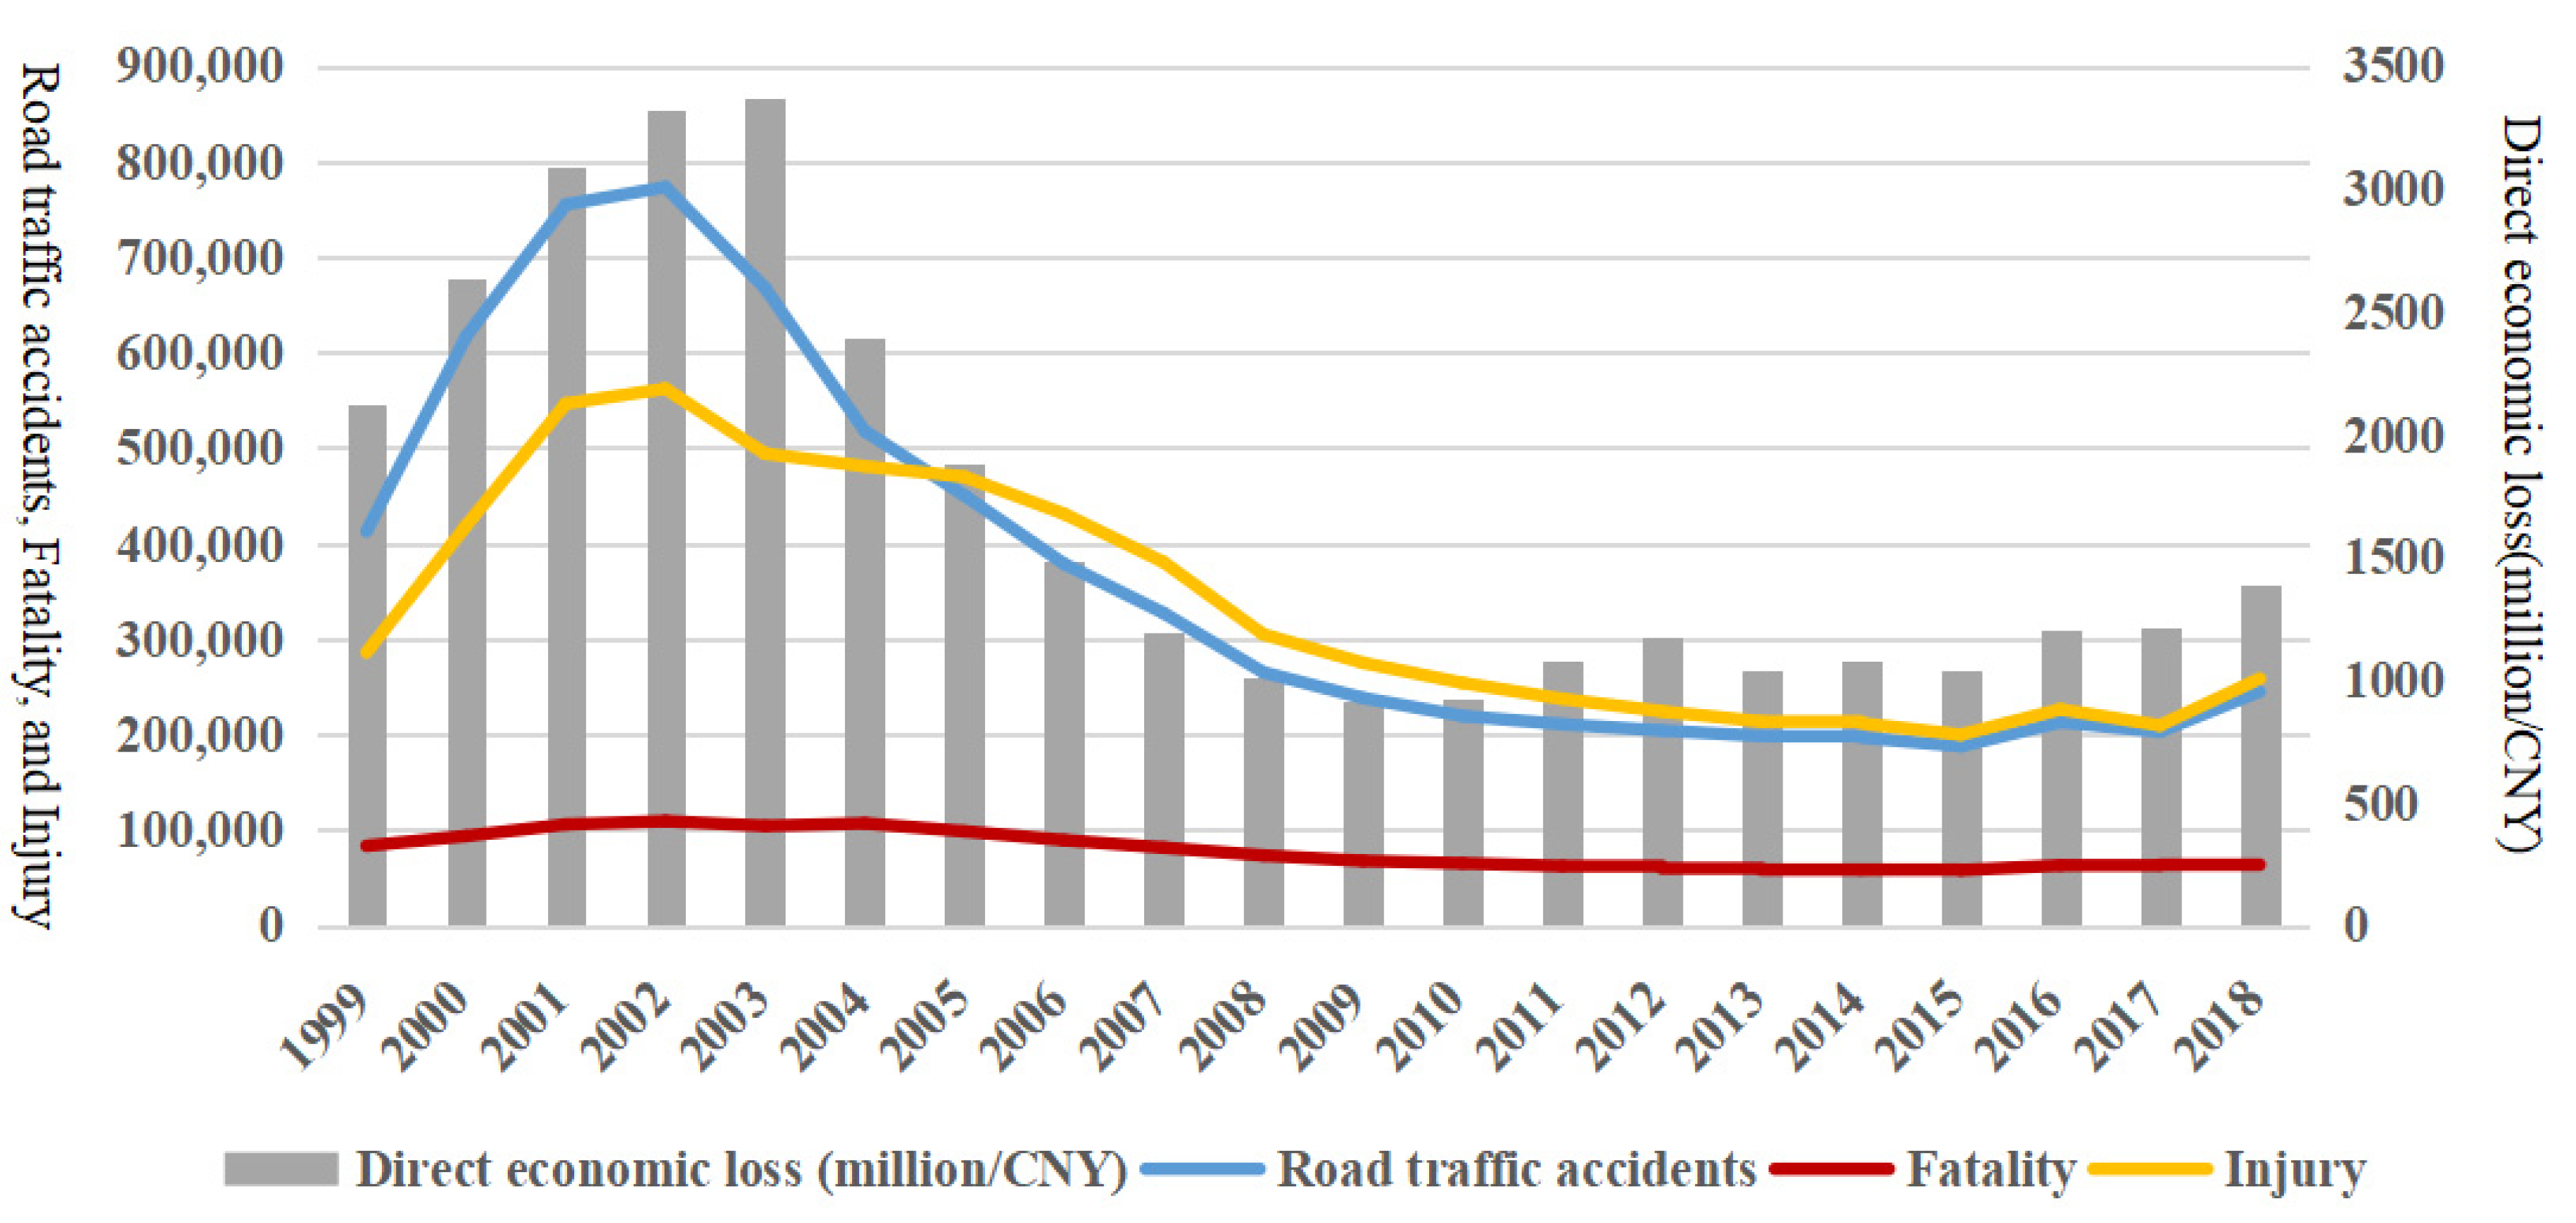
- There is a short-run single directional causality from EM to IN at 5% significance level. Consistent with the short-term estimates, an increase in the number of employed persons leads to a rise in injuries caused by road traffic accidents. Studies show that economic volatility causes changes in drivers’ behaviors [41], and risky driving behaviors tend to increase during times of economic growth [42], thereby leading to a rise in accident injuries. Furthermore, drivers are more inclined to have inattentive behaviors when traveling along familiar road sections [43]; an increase in the number of employed persons brings forth noticeable commuting peaks and highly congested urban traffic; monotonous and repeated commuting routes, as well as inattentive drivers, are more likely to induce accidents predominated by injuries [44]. As shown in Figure 2a, the rise of socioeconomic levels in China over recent years has been accompanied not only by enhanced awareness of environmental protection, but also by the share of commuting via non-motorized vehicles thanks to the designated lanes for shared bikes and non-motorized vehicles, resulting in a significant increase in injuries caused by non-motorized vehicle accidents.
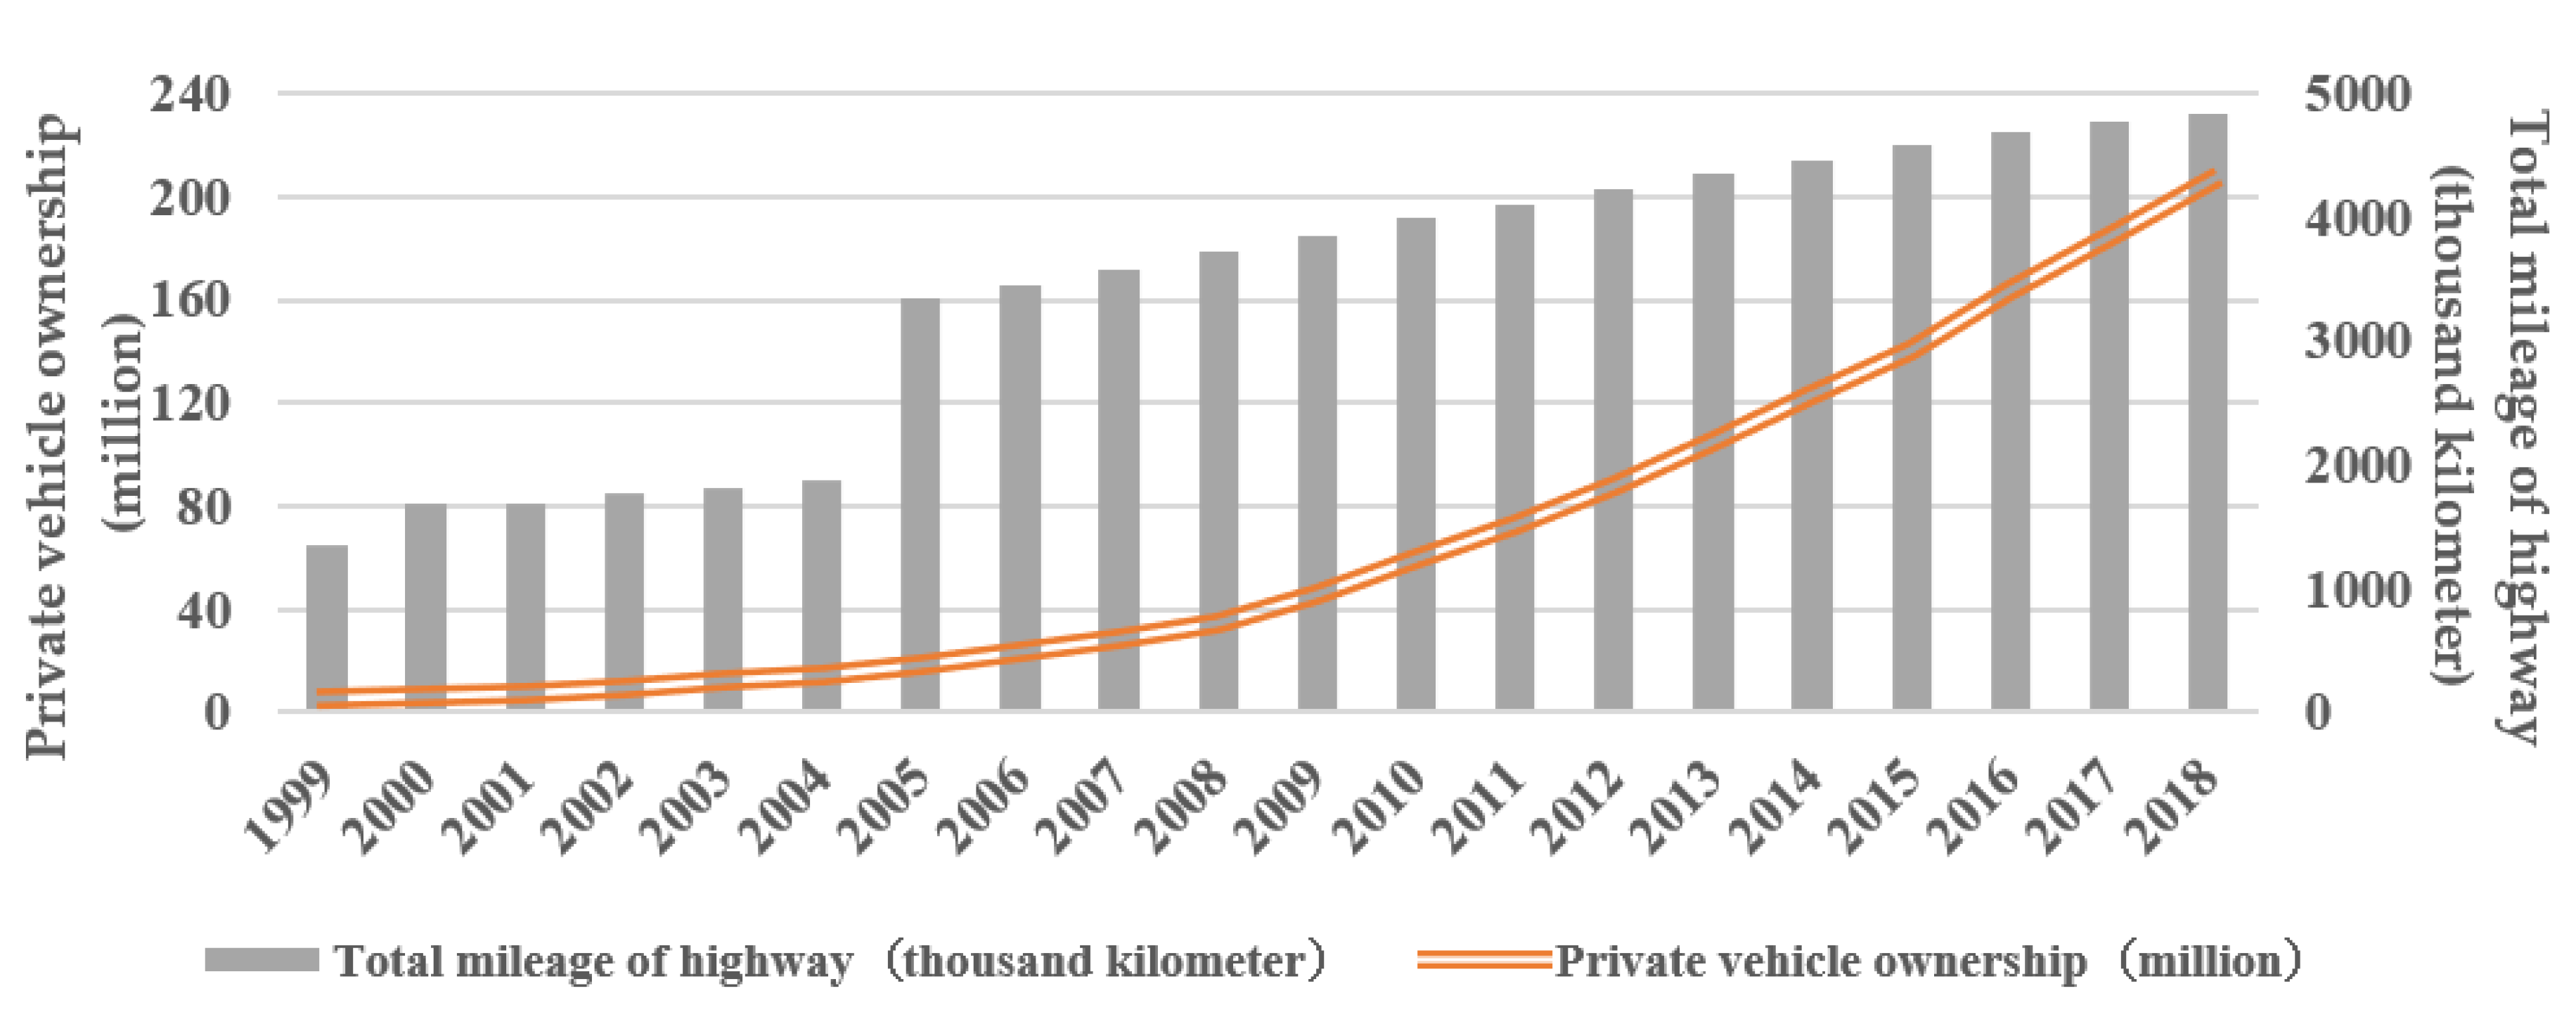
- There is evidence of supporting a short-run single directional causality from PVO to FA. The result of the Granger causality test shows that, over the short term, an increase in private vehicle ownership leads to a rise in fatalities from road traffic accidents at 10% significance level. As shown in Figure 2b, the share of fatalities caused by motorized vehicle accidents over the past 20 years, which represent the major type of fatal accident in the country, rose to 75% in 2018 from 60% in 1999. This further confirms that increased motorized vehicle ownership leads to a year-over-year increase in fatalities from road traffic accidents. With the increase in private vehicle ownership, more people have obtained driver’s licenses, and the entry of novice drivers onto roads constitutes one of the most important factors causing the rise in accident fatalities [45].
- In the short term, a single directional causality relationship is found from RTA, IN, and FA to TMH. Over the short term, the volatility in road traffic accidents will affect changes in the total length of highway, indicating that road traffic safety is an important premise for the development of road traffic; the increase in the number of road traffic accidents, the number of fatalities and injuries will exert an influence on road traffic planning and decision-making by management authorities, thereby inhibiting the growth in the total length of highway over the short term.
5. Conclusions
5.1. Employment and Road Traffic Safety
5.2. Total Mileage of Highway and Road Traffic Safety
5.3. Private Vehicle Ownership and Road Traffic Safety
Author Contributions
Funding
Conflicts of Interest
References
- Stojanová, H.; Blašková, V. Cost benefit study of a safety campaign’s impact on road safety. Accid. Anal. Prev. 2018, 117, 205–215. [Google Scholar] [CrossRef] [PubMed]
- World Health Organisation. Global Status Report on Road Safety. 2018. Available online: https://www.who.int/publications/i/item/9789241565684 (accessed on 7 December 2020).
- Sánchez González, M.P.; Tejada Ponce, Á.; Escribano Sotos, F. Interregional inequality and road accident rates in Spain. Accid. Anal. Prev. 2020, 135, 105347. [Google Scholar] [CrossRef] [PubMed]
- Sakhapov, R.; Nikolaeva, R. Economic aspects of traffic safety administration. Transp. Res. Procedia 2017, 20, 578–583. [Google Scholar] [CrossRef]
- Bougueroua, M.; Carnis, L. Economic development, mobility and traffic accidents in Algeria. Accid. Anal. Prev. 2016, 92, 168–174. [Google Scholar] [CrossRef] [PubMed]
- Yannis, G.; Papadimitriou, E.; Folla, K. Effect of GDP changes on road traffic fatalities. Saf. Sci. 2014, 63, 42–49. [Google Scholar] [CrossRef]
- Wiebe, D.J.; Ray, S.; Maswabi, T.; Kgathi, C.; Branas, C.C. Economic development and road traffic fatalities in two neighbouring African nations. Afr. J. Emerg. Med. 2016, 6, 80–86. [Google Scholar] [CrossRef]
- Dadgar, I.; Norström, T. Short-term and long-term effects of GDP on traffic deaths in 18 OECD countries, 1960–2011. J. Epidemiol. Commun. Health 2017, 71, 146–153. [Google Scholar] [CrossRef]
- Rodríguez-López, J.; Marrero, G.A.; González, R.M.; Leal-Linares, T. Road accidents and business cycles in Spain. Accid. Anal. Prev. 2016, 96, 46–55. [Google Scholar] [CrossRef][Green Version]
- Antoniou, C.; Yannis, G.; Papadimitriou, E.; Lassarre, S. Relating traffic fatalities to GDP in Europe on the long term. Accid. Anal. Prev. 2016, 92, 89–96. [Google Scholar] [CrossRef]
- Nghiem, S.; Commandeur, J.J.F.; Connelly, L.B. Determinants of road traffic safety: New evidence from Australia using state-space analysis. Accid. Anal. Prev. 2016, 94, 65–72. [Google Scholar] [CrossRef]
- Kweon, Y.J. What affects annual changes in traffic safety? A macroscopic perspective in Virginia. J. Saf. Res. 2015, 53, 17–21. [Google Scholar] [CrossRef] [PubMed]
- Castillo-Manzano, J.I.; Castro-Nuno, M.; Lopez-Valpuesta, L.; Boby, J. Looking for traces of the Troika’s intervention in European road safety. Accid. Anal. Prev. 2020, 137, 105461. [Google Scholar] [CrossRef] [PubMed]
- Nghiem, H.S.; Connelly, L.B.; Gargett, S. Are road traffic crash fatality rates converging among OECD countries? Accid. Anal. Prev. 2013, 52, 162–170. [Google Scholar] [CrossRef] [PubMed]
- Law, T.H.; Noland, R.B.; Evans, A.W. The sources of the Kuznets relationship between road fatalities and economic growth. J. Transp. Geogr. 2011, 19, 355–365. [Google Scholar] [CrossRef]
- Strukcinskiene, B.; Martinkenas, A.; Towner, E.; Janson, S.; Andersson, R. Traffic injury mortality in children in transitional Lithuania—A longitudinal analysis from 1971 to 2005. Acta. Paediatr. 2008, 97, 358–361. [Google Scholar] [CrossRef]
- Law, T.H. Factors associated with the relationship between non-fatal road injuries and economic growth. Transp. Policy 2015, 42, 166–172. [Google Scholar] [CrossRef]
- Jusuf, A.; Nurprasetio, I.P.; Prihutama, A. Macro data analysis of traffic accidents in Indonesia. J. Eng. Technol. Sci. 2017, 49, 132–143. [Google Scholar] [CrossRef]
- Rojo, M.; Gonzalo-Orden, H.; Linares, A.; Dell’Olio, L. Impact of a lower conservation budget on road safety Indices. J. Adv. Transp. 2018, 2018, 1–9. [Google Scholar] [CrossRef]
- Sun, L.; Liu, D.; Chen, T.; He, M. Analysis on the accident casualties influenced by several economic factors based on the traffic-related data in China from 2004 to 2016. Chin. J. Traumatol. 2019, 22, 75–79. [Google Scholar] [CrossRef] [PubMed]
- Saar, I. Do alcohol excise taxes affect traffic accidents? Evidence from Estonia. Traffic. Inj. Prev. 2015, 16, 213–218. [Google Scholar] [CrossRef] [PubMed]
- Krüger, N.A. Fatal connections−socioeconomic determinants of road accident risk and drunk driving in Sweden. J. Saf. Res. 2013, 46, 59–65. [Google Scholar] [CrossRef]
- Traynor, T.L. The impact of state level behavioral regulations on traffic fatality rates. J. Saf. Res. 2009, 40, 421–426. [Google Scholar] [CrossRef]
- Mamčic, S.; Sivilevičius, H. The analysis of traffic accidents on Lithuanian regional gravel roads. Transp. Vilnius 2013, 28, 108–115. [Google Scholar] [CrossRef]
- World Health Organisation. Global Status Report on Road Safety. 2015. Available online: http://www.who.int/violence_injury_prevention/road_safety_status/2015/en/ (accessed on 7 December 2020).
- Wang, X.; Zhou, Q.; Yang, J.; You, S.; Song, Y.; Xue, M. Macro-level traffic safety analysis in Shanghai, China. Accid. Anal. Prev. 2019, 125, 249–256. [Google Scholar] [CrossRef]
- National Bureau of Statisitics. Available online: http://www.stats.gov.cn/ (accessed on 7 December 2020).
- Engle, R.F.; Granger, C.W. Co-integration and error correction: Representation, estimation, and testing. Econom. J. Econom. Soc. 1987, 55, 251–276. [Google Scholar] [CrossRef]
- Johnsen, S. Statistical analysis of cointegration vectors. J. Econ. Dyn. Control 1988, 2–3, 231–254. [Google Scholar] [CrossRef]
- Pesaran, M.H.; Shin, Y.C.; Smith, R.J. Bounds testing approaches to the analysis of level relationships. J. Appl. Econ. 2001, 16, 289–326. [Google Scholar] [CrossRef]
- Johansen, S. Estimation and hypothesis testing of cointegration vectors in Gaussian vector autoregressive models. Econom. J. Econ. Soc. 1991, 59, 1551–1580. [Google Scholar] [CrossRef]
- Granger, C.W. Investigating causal relations by econometric models and cross-spectral methods. Econometrica 1969, 3, 424–438. [Google Scholar] [CrossRef]
- Dickey, D.A.; Fuller, W.A. Likelihood ratio statistics for autoregressive time series with unit root. Econometrica 1981, 4, 1057–1072. [Google Scholar] [CrossRef]
- Phillips, P.B.; Perron, P. Testing for a unit root in time series regression. Biometrika 1988, 2, 335–346. [Google Scholar] [CrossRef]
- Brueggemann, R.; Luetkepohl, H.; Saikkonen, P. Residual autocorrelation testing for vector error correction models. J. Econom. 2006, 134, 579–604. [Google Scholar] [CrossRef]
- Li, X.; Wu, L.; Yang, X. Exploring the impact of social economic variables on traffic safety performance in Hong Kong: A time series analysis. Saf. Sci. 2018, 109, 67–75. [Google Scholar] [CrossRef]
- Ying, Y.; Wu, C.; Chang, K. The effectiveness of drinking and driving policies for different alcohol-related fatalities: A quantile regression analysis. Int. J. Environ. Res. Pub. Health 2013, 10, 4628–4644. [Google Scholar] [CrossRef] [PubMed]
- de la Fuente, V.S.; López, M.A.C.; González, I.F.; Alcántara, O.J.G.; Ritzel, D.O. The impact of the economic crisis on occupational injuries. J. Saf. Res. 2014, 48, 77–85. [Google Scholar] [CrossRef]
- Ritter, N.; Vance, C. Do fewer people mean fewer cars? Population decline and car ownership in Germany. Transp. Res Pol. Pract. 2013, 50, 74–85. [Google Scholar] [CrossRef]
- Ahangari, H.; Outlaw, J.; Atkinson-Palombo, C.; Garrick, N.W. Investigation into impact of fluctuations in gasoline prices and macroeconomic conditions on road safety in developed countries. Transp. Res. Rec. 2014, 2465, 48–56. [Google Scholar] [CrossRef]
- De Oña, J.; de Oña, R.; Eboli, L.; Forciniti, C.; Machado, J.L.; Mazzulla, G. Analysing the relationship Among accident severity, drivers’ behaviour and their socio-economic characteristics in different territorial contexts. Procedia Soc. Behav. Sci. 2014, 160, 74–83. [Google Scholar] [CrossRef]
- Lloyd, L.; Wallbank, C.; Broughton, J. A collection of evidence for the impact of the economic recession on road fatalities in Great Britain. Accid. Anal. Prev. 2015, 80, 274–285. [Google Scholar] [CrossRef]
- Colonna, P.; Intini, P.; Berloco, N.; Ranieri, V. The influence of memory on driving behavior: How route familiarity is related to speed choice. An on-road study. Saf. Sci. 2016, 82, 456–468. [Google Scholar] [CrossRef]
- Gray, R.C.; Quddus, M.A.; Evans, A. Injury severity analysis of accidents involving young male drivers in Great Britain. J. Saf. Res. 2008, 39, 483–495. [Google Scholar] [CrossRef] [PubMed]
- Walton, D.; Jenkins, D.; Thoreau, R.; Kingham, S.; Keall, M. Why is the rate of annual road fatalities increasing? A unit record analysis of New Zealand data (2010–2017). J. Saf. Res. 2020, 72, 67–74. [Google Scholar] [CrossRef] [PubMed]
- Noland, R.B.; Adediji, Y. Are estimates of crash modification factors mis-specified? Accident. Anal. Prev. 2018, 118, 29–37. [Google Scholar] [CrossRef] [PubMed]
- Naevestad, T.; Bjornskau, T. How Can the safety culture perspective be applied to road traffic? Transp. Rev. 2012, 32, 139–154. [Google Scholar] [CrossRef]
- Butans, Z.; Gross, K.A.; Gridnevs, A.; Karzubova, E. Road safety barriers, the need and influence on road traffic accidents. In Proceedings of the IOP Conference Series-Materials Science and Engineering, International Conference on Innovative Materials, Structures and Technologies, Riga, Latvia, 30 September–2 October 2015; Volume 96. [Google Scholar]
- Bates, L.; Rodwell, D.; Matthews, S. Young driver enforcement within graduated driver licensing systems: A scoping review. Crime Prev. Community Saf. 2019, 21, 116–135. [Google Scholar] [CrossRef]
- Choudhary, P.; Velaga, N.R. Effects of phone use on driving performance: A comparative analysis of young and professional drivers. Saf. Sci. 2019, 111, 179–187. [Google Scholar] [CrossRef]


| Variable | Description | Abbreviations | |
|---|---|---|---|
| Road traffic accident indicators | Road traffic accidents | Total road traffic accidents | RTA |
| Injuries | Total number of injuries caused by road traffic accidents | IN | |
| Fatalities | Total number of deaths caused by road traffic accidents | FA | |
| Direct economic losses | Expenses incurred in connection with personal injuries and deaths caused by road traffic accidents and post-accident treatment, as well as the value of damaged properties, including expenses paid for personal injuries and deaths, post-accident treatment, and property losses | DEL | |
| Potential relevant macroeconomic factors | Average salaries | Average monetary salary per employed worker during a certain period of time | AS |
| Employment | Total employed persons within the region | EM | |
| Unemployment | Total unemployed persons within the region | UE | |
| Total mileage of highway | Including inter-city, urban-rural, and rural public roads allowing motorized vehicles to travel, the total length of highway running through urban streets, the lengths of highway bridges and tunnels, and the width of ferry lanes | TMH | |
| Private vehicle ownership | The number of vehicles registered with the traffic management authorities under public security bureaus and assigned with local private vehicle number plates | PVO | |
| Year | RTA | FA | IN | DEL (Million/CNY) | EM (Million) | UE (Million) | AS (CNY) | TMH (Thousand Kilometer) | PVO (Million) |
|---|---|---|---|---|---|---|---|---|---|
| 1999 | 412,860 | 83,529 | 286,080 | 2124.02 | 713.94 | 5.75 | 8524 | 1351.7 | 5.3388 |
| 2000 | 616,971 | 93,853 | 418,721 | 2632.9 | 720.85 | 5.95 | 9333 | 1679.8 | 6.2533 |
| 2001 | 754,919 | 105,930 | 546,485 | 3087.87 | 727.97 | 6.81 | 10,834 | 1698 | 7.7078 |
| 2002 | 773,137 | 109,381 | 562,074 | 3324.38 | 732.8 | 7.7 | 12,373 | 1765.2 | 9.6898 |
| 2003 | 667,507 | 104,372 | 494,174 | 3369.15 | 737.36 | 8 | 13,969 | 1809.8 | 12.1923 |
| 2004 | 517,889 | 107,077 | 480,864 | 2391.41 | 742.64 | 8.27 | 15,920 | 1870.7 | 14.8166 |
| 2005 | 450,254 | 98,738 | 469,911 | 1884.01 | 746.47 | 8.39 | 18,200 | 3345.2 | 18.4807 |
| 2006 | 378,781 | 89,455 | 431,139 | 1489.56 | 749.78 | 8.47 | 20,856 | 3457 | 23.3332 |
| 2007 | 327,209 | 81,649 | 380,442 | 1198.78 | 753.21 | 8.3 | 24,721 | 3583.7 | 28.7622 |
| 2008 | 265,204 | 73,484 | 304,919 | 1009.72 | 755.64 | 8.86 | 28,898 | 3730.2 | 35.0139 |
| 2009 | 238,351 | 67,759 | 275,125 | 914.37 | 758.28 | 9.21 | 32,244 | 3860.8 | 45.7491 |
| 2010 | 219,521 | 65,225 | 254,075 | 926.34 | 761.05 | 9.08 | 36,539 | 4008.2 | 59.3871 |
| 2011 | 210,812 | 62,387 | 237,421 | 1078.73 | 764.2 | 9.22 | 41,799 | 4106.4 | 73.2679 |
| 2012 | 204,196 | 59,997 | 224,327 | 1174.9 | 767.04 | 9.17 | 46,769 | 4237.5 | 88.386 |
| 2013 | 198,394 | 58,539 | 213,724 | 1038.97 | 769.77 | 9.26 | 51,483 | 4356.2 | 105.0168 |
| 2014 | 196,812 | 58,523 | 211,882 | 1075.43 | 772.53 | 9.52 | 56,360 | 4463.9 | 123.3936 |
| 2015 | 187,781 | 58,022 | 199,880 | 1036.92 | 774.51 | 9.66 | 62,029 | 4577.3 | 140.991 |
| 2016 | 212,846 | 63,093 | 226,430 | 1207.6 | 776.03 | 9.82 | 67,569 | 4696.3 | 163.3022 |
| 2017 | 203,049 | 63,772 | 209,654 | 1213.11 | 776.4 | 9.72 | 74,318 | 4773.5 | 185.1511 |
| 2018 | 244,937 | 63,194 | 258,532 | 1384.56 | 775.86 | 9.74 | 82,413 | 4846.5 | 205.7493 |
| Variable | ADF Test | PP Test | ||||||||||
|---|---|---|---|---|---|---|---|---|---|---|---|---|
| Level | First Difference | Level | First Difference | |||||||||
| t-Value | p | I(0) | t-Value | p | I(1) | t-Value | p | I(0) | t-Value | p | I(1) | |
| RTA | −5.9871 | 0.0002 | YES | −2.7375 | 0.0112 | YES | −0.5854 | 0.4503 | NO | −3.0986 | 0.0040 | YES |
| IN | −5.0755 | 0.0022 | YES | −809.0152 | 0.0001 | YES | −3.2998 | 0.0963 | NO | −3.3711 | 0.0021 | YES |
| FA | −0.9856 | 0.2781 | NO | −2.9305 | 0.0059 | YES | −2.3419 | 0.3943 | NO | −2.8792 | 0.0066 | YES |
| DEL | −3.0905 | 0.0466 | YES | −2.6530 | 0.0111 | YES | −0.4987 | 0.4866 | NO | −2.6783 | 0.0105 | YES |
| EM | −2.1425 | 0.2325 | NO | −7.8469 | 0.0004 | YES | 4.7709 | 1 | NO | −3.0781 | 0.0042 | YES |
| UE | −5.6648 | 0.0032 | YES | −28.7953 | 0.0001 | YES | −10.2385 | 0 | YES | −1.7892 | 0.0706 | YES |
| TMH | −4.5323 | 0.0045 | YES | −28.3829 | 0.0001 | YES | −2.1153 | 0.2412 | NO | −3.8421 | 0.0007 | YES |
| PVO | −3.0419 | 0.0499 | YES | −1.9058 | 0.6077 | NO | 1.3783 | 0.9999 | NO | −2.5041 | 0.3222 | NO |
| AS | −1.9444 | 0.306 | NO | −10.9525 | 0.0001 | YES | −3.9072 | 0.0085 | YES | −1.8279 | 0.0654 | NO |
| Model | Lag Length Based on AIC | Bound Test F-Statistics | Significance | Lower I(0) Bound | Upper I(1) Bound |
|---|---|---|---|---|---|
| InAS = f(InRTA, InIN, InFA, InDEL) | ARDL (1, 2, 2, 2, 1) | 3.3262 | 5% | 3.05 | 3.97 |
| InEM = f(InRTA, InIN, InFA, InDEL) | ARDL (1, 0, 1, 2, 2) | 163.5342 | 1% | 3.74 | 5.06 |
| InUE = f(InRTA, InIN, InFA, InDEL) | ARDL (1, 2, 1, 1, 1) | 8.3385 | 1% | 3.81 | 4.92 |
| InTMH = f(InRTA, InIN, InFA, InDEL) | ARDL (1, 2, 2, 2, 2) | 74.7924 | 1% | 3.07 | 4.44 |
| InPVO = f(InRTA, InIN, InFA, InDEL) | ARDL (2, 2, 0, 1, 0) | 5.9826 | 1% | 3.07 | 4.44 |
| Dependent Variables Independent Variables | InEM | InUE | InTMH | InPVO | ||||
|---|---|---|---|---|---|---|---|---|
| Lag Order (1, 0, 1, 2, 2) | Lag Order (1, 2, 1, 1, 1) | Lag Order (1, 2, 2, 2, 2) | Lag Order (2, 2, 0, 1, 0) | |||||
| Coefficient | t-Statistic | Coefficient | t-Statistic | Coefficient | t-Statistic | Coefficient | t-Statistic | |
| InRTA | −0.0847 *** | −7.6256 | 0.3954 ** | 2.8726 | −1.1212 *** | −4.2545 | 12.4637 | 0.8872 |
| InIN | 0.1196 *** | 3.9201 | −0.5492 * | −2.4010 | −1.8217 ** | −3.8434 | −18.4985 | −1.2762 |
| InFA | −0.1454 *** | −4.7967 | 0.223 | 1.2596 | 3.3855 *** | 10.4211 | 14.5688 * | 1.8458 |
| InDEL | 0.0314 *** | 10.2691 | −0.1251 ** | −2.4603 | 0.4314 *** | 4.8703 | −6.3795 | −0.9322 |
| T | 0.0154 *** | 5.5707 | ||||||
| Independent Variables Dependent Variables | InEM | InUE | InTMH | InPVO | ||||
|---|---|---|---|---|---|---|---|---|
| Coefficient | t-Statistic | Coefficient | t-Statistic | Coefficient | t-Statistic | Coefficient | t-Statistic | |
| C | 2.7694 *** | 35.9001 | 6.5080 *** | 9.6169 | ||||
| D(InPOV(-1)) | 0.6930 *** | 13.7840 | ||||||
| D(InRTA) | −0.0692 | −0.7199 | 0.5997 *** | 9.1133 | 0.4609 *** | 6.3802 | ||
| D(InRTA(-1)) | −0.1678 ** | −3.5285 | −0.4996 *** | −4.7462 | −0.1360 *** | −4.7498 | ||
| D(InIN) | 0.0184 *** | 17.6991 | −0.1543 | −1.7276 | −1.2031 *** | −16.5300 | ||
| D(InIN(-1)) | 0.7869 *** | 9.4150 | ||||||
| D(InFA) | −0.0004 | −0.2937 | −0.1354 | −1.6486 | 0.3029 *** | 5.0018 | 0.1680 ** | 2.5484 |
| D(InFA(-1)) | 0.0118 *** | 9.6067 | −0.8598 *** | −10.3410 | ||||
| D(InDEL) | 0.0035 *** | 6.0647 | 0.0204 | 0.4391 | 0.0760 * | 2.3187 | ||
| D(InDEL(-1)) | −0.0032 *** | −5.7597 | −0.2752 *** | −7.1043 | ||||
| ECM(-1) | −0.2296 *** | −35.8457 | −0.8614 *** | −9.5772 | −0.7356 *** | −25.9448 | −0.0216 *** | −6.5733 |
| Dependent Variables | Independent Variables F-Statistics (p-Values) | |||
|---|---|---|---|---|
| D(InEM) | D(InUE) | D(InTMH) | D(InPVO) | |
| D(InRTA) | 0.2348 (0.6280) | 0.6370 (0.4248) | 0.5548 (0.4564) | 1.3436 (0.2464) |
| D(InIN) | 3.8926 ** (0.0485) | 1.1987 (0.1660) | 0.4299 (0.5120) | 0.5498 (0.4584) |
| D(InFA) | 2.2128 (0.1369) | 0.0364 (0.8486) | 0.1832 (0.6686) | 3.3122 * (0.0688) |
| D(InDEL) | 0.0632 (0.8014) | 0.0720 (0.7884) | 1.2461 (0.2643) | 0.5726 (0.4492) |
| Dependent Variables | Independent Variables F-Statistics (p-Values) | |||
|---|---|---|---|---|
| D(InRTA) | D(InIN) | D(InFA) | D(InDEL) | |
| D(InEM) | 0.4783 (0.4892) | 0.9705 (0.3246) | 0.0511 (0.8211) | 0.0035 (0.9526) |
| D(InUE) | 2.1809 (0.1397) | 0.8577 (0.3544) | 0.0176 (0.8944) | 1.9496 (0.1626) |
| D(InTMH) | 12.3474 *** (0.0004) | 17.0718 *** (0.0000) | 4.6102 ** (0.0318) | 0.4144 (0.5197) |
| D(InPVO) | 0.1639 (0.6856) | 0.6144 (0.4331) | 1.1949 (0.2743) | 0.0329 (0.8560) |
Publisher’s Note: MDPI stays neutral with regard to jurisdictional claims in published maps and institutional affiliations. |
© 2020 by the authors. Licensee MDPI, Basel, Switzerland. This article is an open access article distributed under the terms and conditions of the Creative Commons Attribution (CC BY) license (http://creativecommons.org/licenses/by/4.0/).
Share and Cite
Li, X.; Liu, J.; Zhou, J.; Liu, X.; Zhou, L.; Wei, W. The Effects of Macroeconomic Factors on Road Traffic Safety: A Study Based on the ARDL-ECM Model. Sustainability 2020, 12, 10262. https://doi.org/10.3390/su122410262
Li X, Liu J, Zhou J, Liu X, Zhou L, Wei W. The Effects of Macroeconomic Factors on Road Traffic Safety: A Study Based on the ARDL-ECM Model. Sustainability. 2020; 12(24):10262. https://doi.org/10.3390/su122410262
Chicago/Turabian StyleLi, Xibing, Jiao Liu, Jian Zhou, Xiling Liu, Lei Zhou, and Wei Wei. 2020. "The Effects of Macroeconomic Factors on Road Traffic Safety: A Study Based on the ARDL-ECM Model" Sustainability 12, no. 24: 10262. https://doi.org/10.3390/su122410262
APA StyleLi, X., Liu, J., Zhou, J., Liu, X., Zhou, L., & Wei, W. (2020). The Effects of Macroeconomic Factors on Road Traffic Safety: A Study Based on the ARDL-ECM Model. Sustainability, 12(24), 10262. https://doi.org/10.3390/su122410262