1. Introduction
Drinking water supply systems have significant impacts on the quality of human life, health, and hygiene. As such, a high quality, well managed and well maintained drinking water supply system is a foundational component of infrastructure for urbanized area. However, in order to effectively operate this infrastructure, it is necessary to understand its structural condition and perform maintenance and repairs accordingly to extend the functional life of system. It has been shown that careful coordination of planned, comprehensive maintenance and renewal of the system can prevent operational emergencies and reduce the need for unplanned interventions. This is important as the water supply system is essential for modern life and accordingly malfunctions, outages or deviations from the normal operating state can have significant negative effects. While some of these effects can be predicted and planned for through substitution or crisis solutions, many of these effects require an immediate emergency response when they occur, which cannot be effectively planned in advance [
1,
2].
In general, the whole drinking water supply system, together with the supply of electricity, is one of the most important elements of critical infrastructure, as a number of sectors, services and the population itself depend on their functionality and operability. Even the slightest disruption of these systems operation can then result in the deterioration of the quality of human life. A properly functioning supply of drinking water currently represents an important role for the functionality of systems, functions and elements of the state and other areas of critical infrastructure. The interruption of the supply of drinking water therefore means not only a reduction of human life living standard, but also a reduction in the functionality of other state parts on which society is directly dependent. It is possible to mainly include emergency services in the form of an integrated rescue system, especially the fire safety of the area and health care, as well as food, chemical, industrial or agricultural production.
This issue is a severe issue in other countries around the world, which corresponds to the subject of many publications interest [
3,
4,
5,
6,
7,
8,
9,
10]. In some countries, the situation is addressed in the context of water supply systems failure, often with a link to the legislation of the country. For example, the author of [
11,
12] stated, using the example of a pipe route failure, that even a small-scale failure can cause the collapse of the entire system and affect the performance of the entire water network. Other approaches to the evaluation of water supply networks are also presented by the authors of the publication [
13,
14], who, in their work, evaluate individual components of the water supply network on the basis of graph theory and also deal into detail with the issue of risky urban water supply networks analysis, as well as other publications [
15,
16,
17,
18,
19].
The village of Zaben is situated in the Moravian-Silesian Region of the district of Frydek-Mistek. In particular, Zaben can be considered a suburban part of the city of Frydek-Mistek. In Zaben, according to the Czech Statistical Office (CZSO), there have been 827 inhabitants as of 1 January 2017 and individual housing is dominant. The village lies on a flat plain at an altitude of 266 to 270 m above sea level and its total cadastral area is 3.35 km
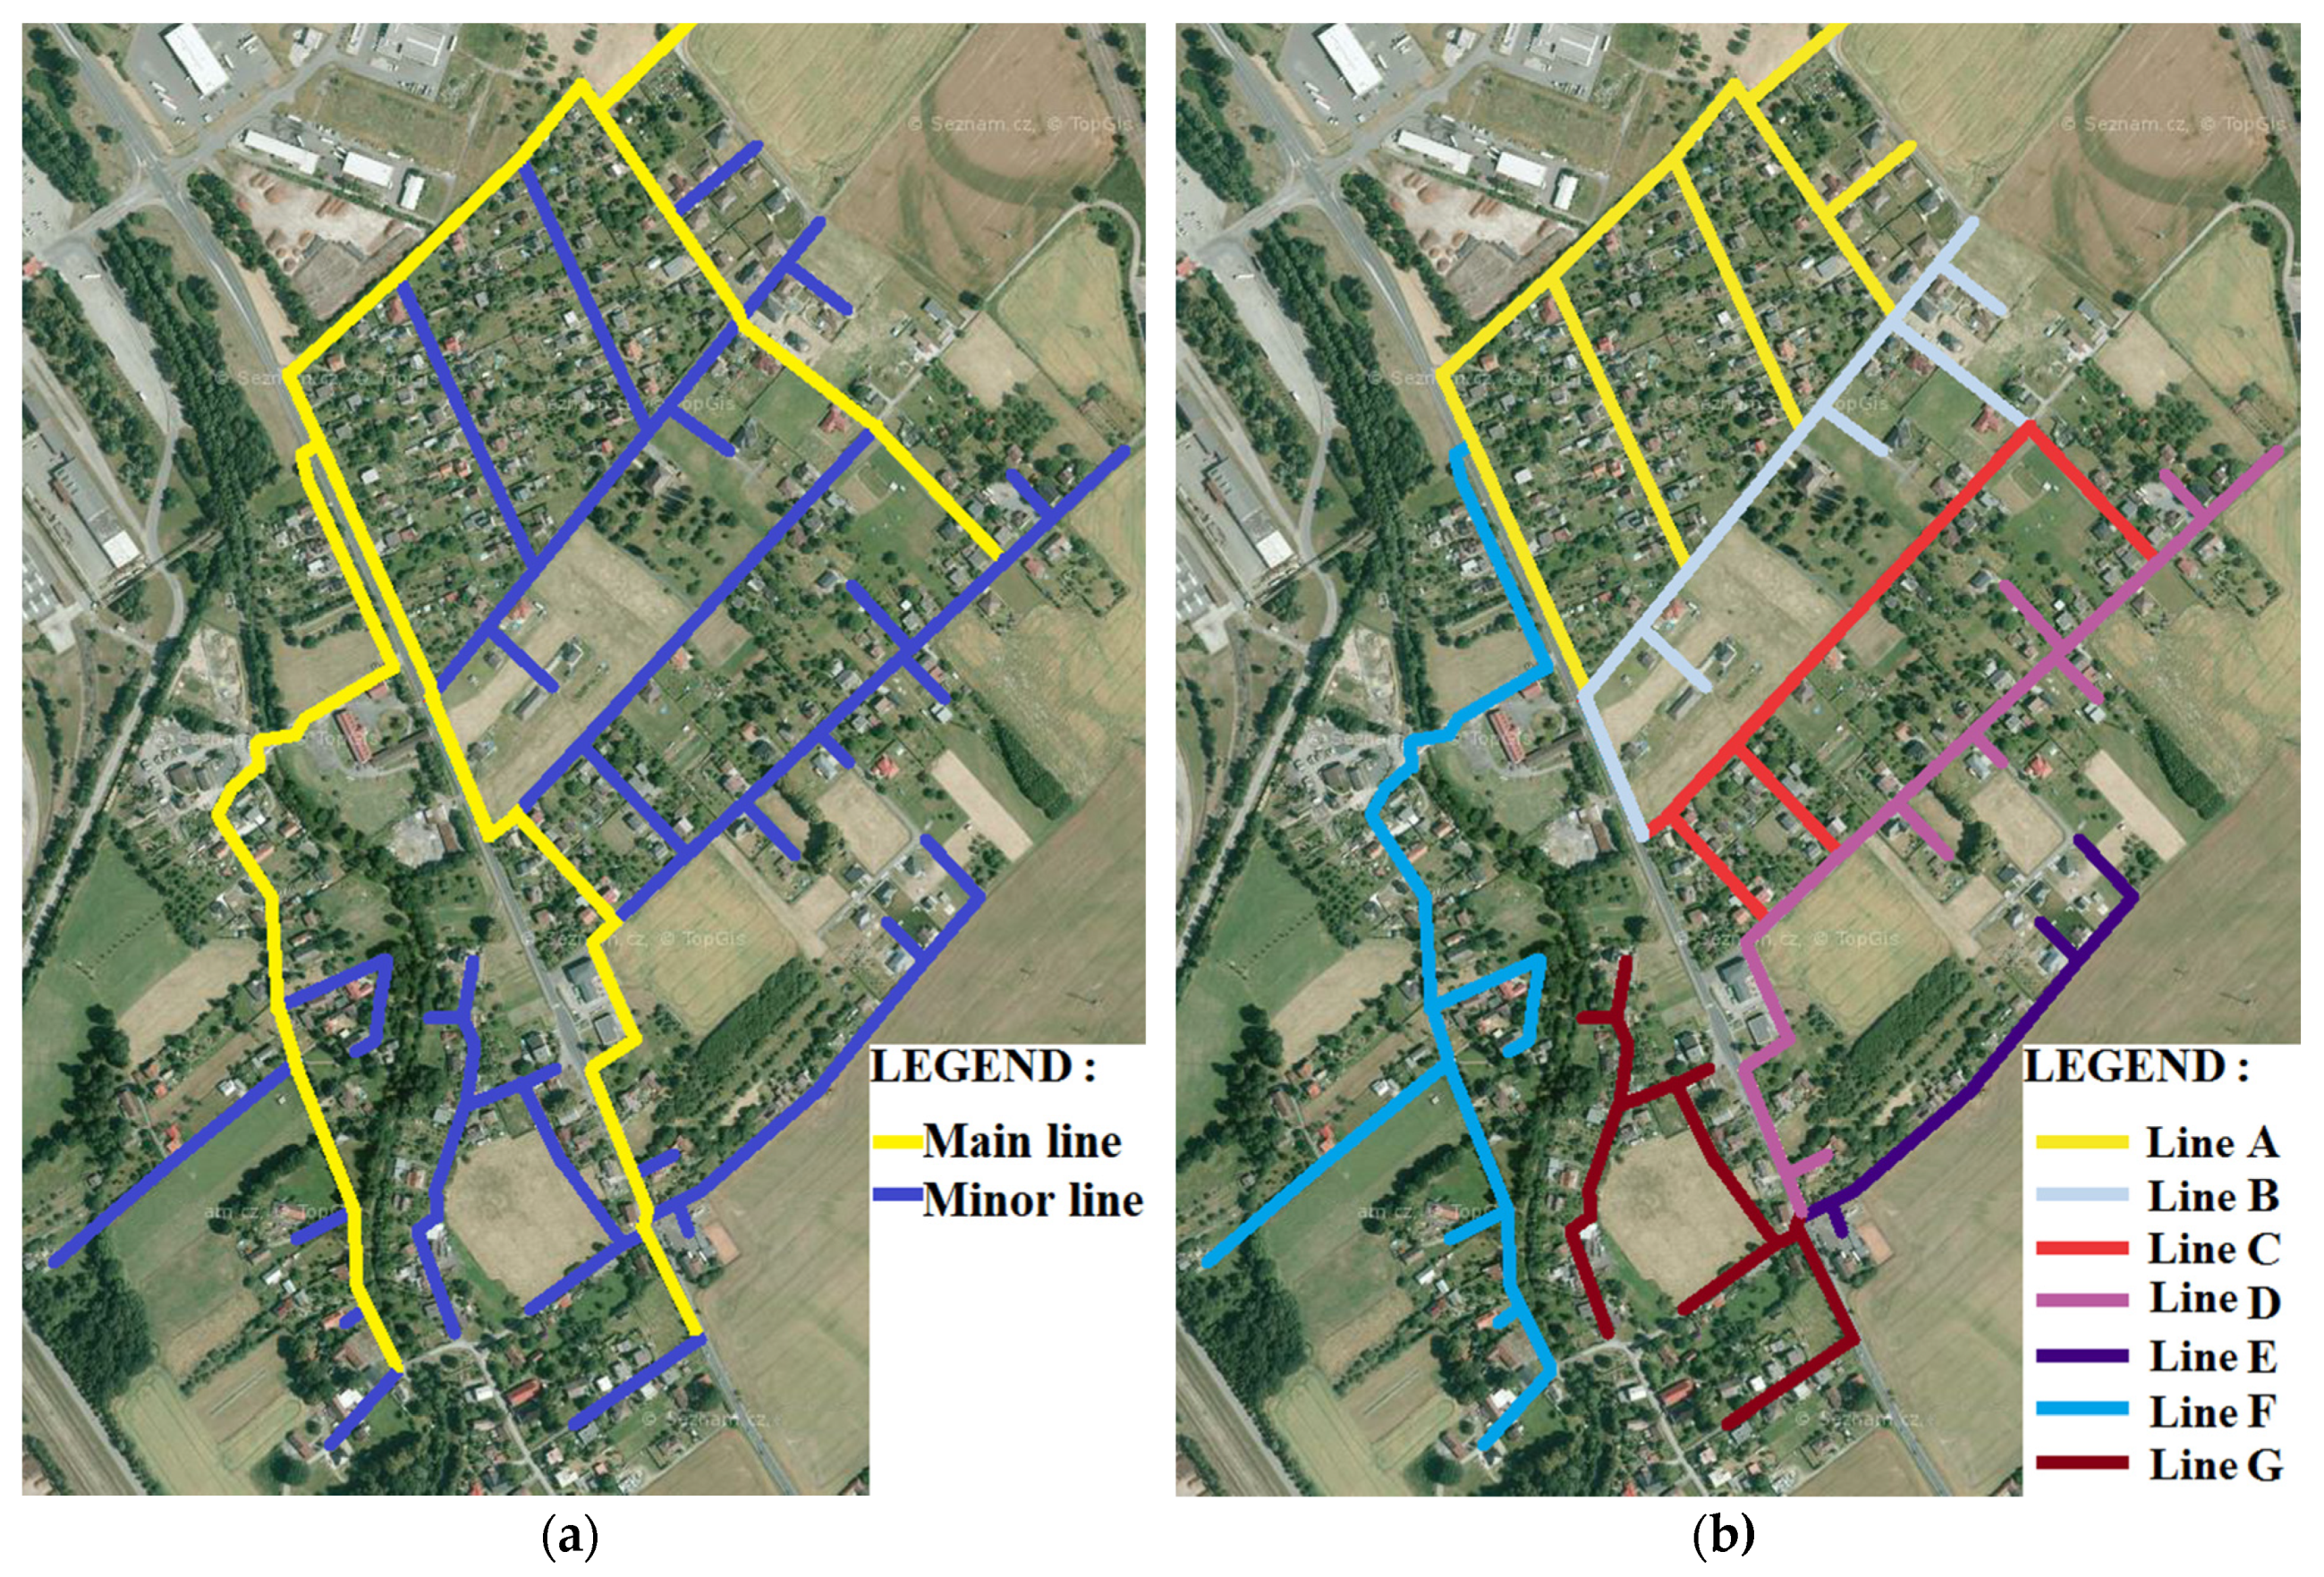
2. The construction of the water supply system began in 1981 and was completed in 1984. A schema of the water mains in Zaben is presented in
Figure 1.
Figure 1 shows the overall scheme of the water supply network in the village. The left part shows the main distribution order (
yellow color) and the minor water supply order (
blue color). The main water distribution lines contain dimensions DN 150 or DN200, the minor water supply lines have smaller dimensions, DN100, DN80 and DN50. The picture on the right side shows the division of the water supply system into individual functional units, which are the subject of the solution and are solved separately. This division was created for the purpose of present study; a similar division is now also used by the administrator of the water supply system.
The whole water supply network is owned by the municipality of Zaben. The administrator of the water supply network (also sewerage network) and the entity responsible for the operation and functionality of the system is the joint-stock company Severomoravské vodovody a kanalizace Ostrava Plc (SmVaK Plc). SmVaK Plc is also entitled to collect money for water and sewage and regulate its price. The source of drinking water is the Ostrava Regional Water Supply, from which drinking water is supplied to the tower reservoir of Biocel Paskov. This reservoir has a total volume of 200 m3, its minimum level is 306.50 m above sea level and the maximum water level in the reservoir is 311.80 m above sea level. Drinking water is supplied to the appliance by gravity due to sufficient elevation (the terrain level of the appliance is 266 to 270 m above sea level). The elevation between the lower level of the reservoir and the highest point of the terrain in the village is 36.50 m. The reservoir of Biocel Paskov, by the village of Zaben, also supplies the Biocel industrial complex itself, including the adjacent housing estate in the village of Paskov. Drinking water from the Biocel reservoir is supplied by the DN200 feeder to the north-eastern part of the village. From there, the water is distributed to the final consumers through the distribution network.
Approximately 97% of village inhabitants are connected to the water supply network [
20]. The water supply system is a combined system; accordingly, most of the village’s supply system (central and north-western regions) has a circular layout, whereas the south and west components of the supply system were designed as a branch system. The total length of the water pipelines in the municipality is 9028.60 m and PVC pipes were used as the construction material with dimensions of DN 50, DN 80, DN 100 or DN 150. The water supply network is divided into seven lines labelled A to G. Lines A, B, C and D are the water lines located in the northern part of the village, and the E, F and G lines are located in the southern part of the village. Notably, lines E, F and G have a low operational reliability [
20].
3. Results and Discussion
3.1. Water Supply Documentation
We created a water supply system summary document as described in
Section 2.1. As previously mentioned, the system was segmented and each element of the system was recorded in this document. A sample excerpt of the summary document is provided in
Table 10.
The water lines in the municipality are made of PVC pipes in different dimensions and their total length is 9028.6 m.
Figure 2 shows the length share of the individual water lines A to G in the context of the total system length.
Notably, the water supply network in Zaben includes a total of 250 water supply lines, 44 sectional closures, 10 mud pans, 15 air valves and 35 hydrant closures, along with other objects, valves and fittings. Furthermore, it should be noted that neither the owner nor the operator have accurate information about their assets. For example, according to the operator’s database, there is supposed to be a hydrant in the village in a specific location, while according to the data of the municipal authority, this element was supposed to be a valve. However, our field survey could not identify either of these elements at the specified location. Nevertheless, all the available data were summarised in a single, uniform record of all elements of the water supply system [
26].
3.2. Assessment of Structural Conditions of Water System
In this study, individual TIs were addressed comprehensively within the entire system of drinking water supply in the municipality. The only exception here is TI2—Failure rate—where the system was evaluated according to the place of failure and thus in relation to individual water lines A to G. Other TIs were solved all over the village due to input data of individual TI, which are similar within the system, or differs in fractions of ratio.
3.2.1. Age of Pipelines—TI1
The water mains in Zaben were predominantly built between 1981 and 1984 using PVC pipes. Some pipeline sections were replaced since the initial construction and were either replaced with new PVC or with PE or high-density PE due to PVC defects. However, in relation to the total length of the network, the replaced segment is a very small component of the water supply system (approximately 8%). As such, the replaced segments did not have a significant impact on the evaluation of TI1. As the PVC water supply network in the municipality is predominantly 35 to 38 years old, TI1 was classified as K2 (for ages 20 to 40), sorted by
Table 2. Since the expected theoretical service life of the PVC pipe material is 60 years, the water mains are approximately in the middle of their service life and should not require replacement in the near future.
As water mains are often made up of large-scale systems that were not built up at once, but rather gradually with the growth of settlements, large water supply systems are often comprised of different materials and segments with different ages. Our assessment is simplified in the case, as the water system is predominantly one material and age. However, in the case of large water pipelines with a variety of different materials and of different ages, it would be advisable to divide this network into segments and deal with the segments individually. This approach is only possible if there is sufficient data available.
3.2.2. Failure Rate—T12
We summarised the failure rates and accident record for the different water lines from 2013 to 2015 in
Table 11. This summary includes a description of the pipeline malfunction, the location and date of the problem and the method of its repair.
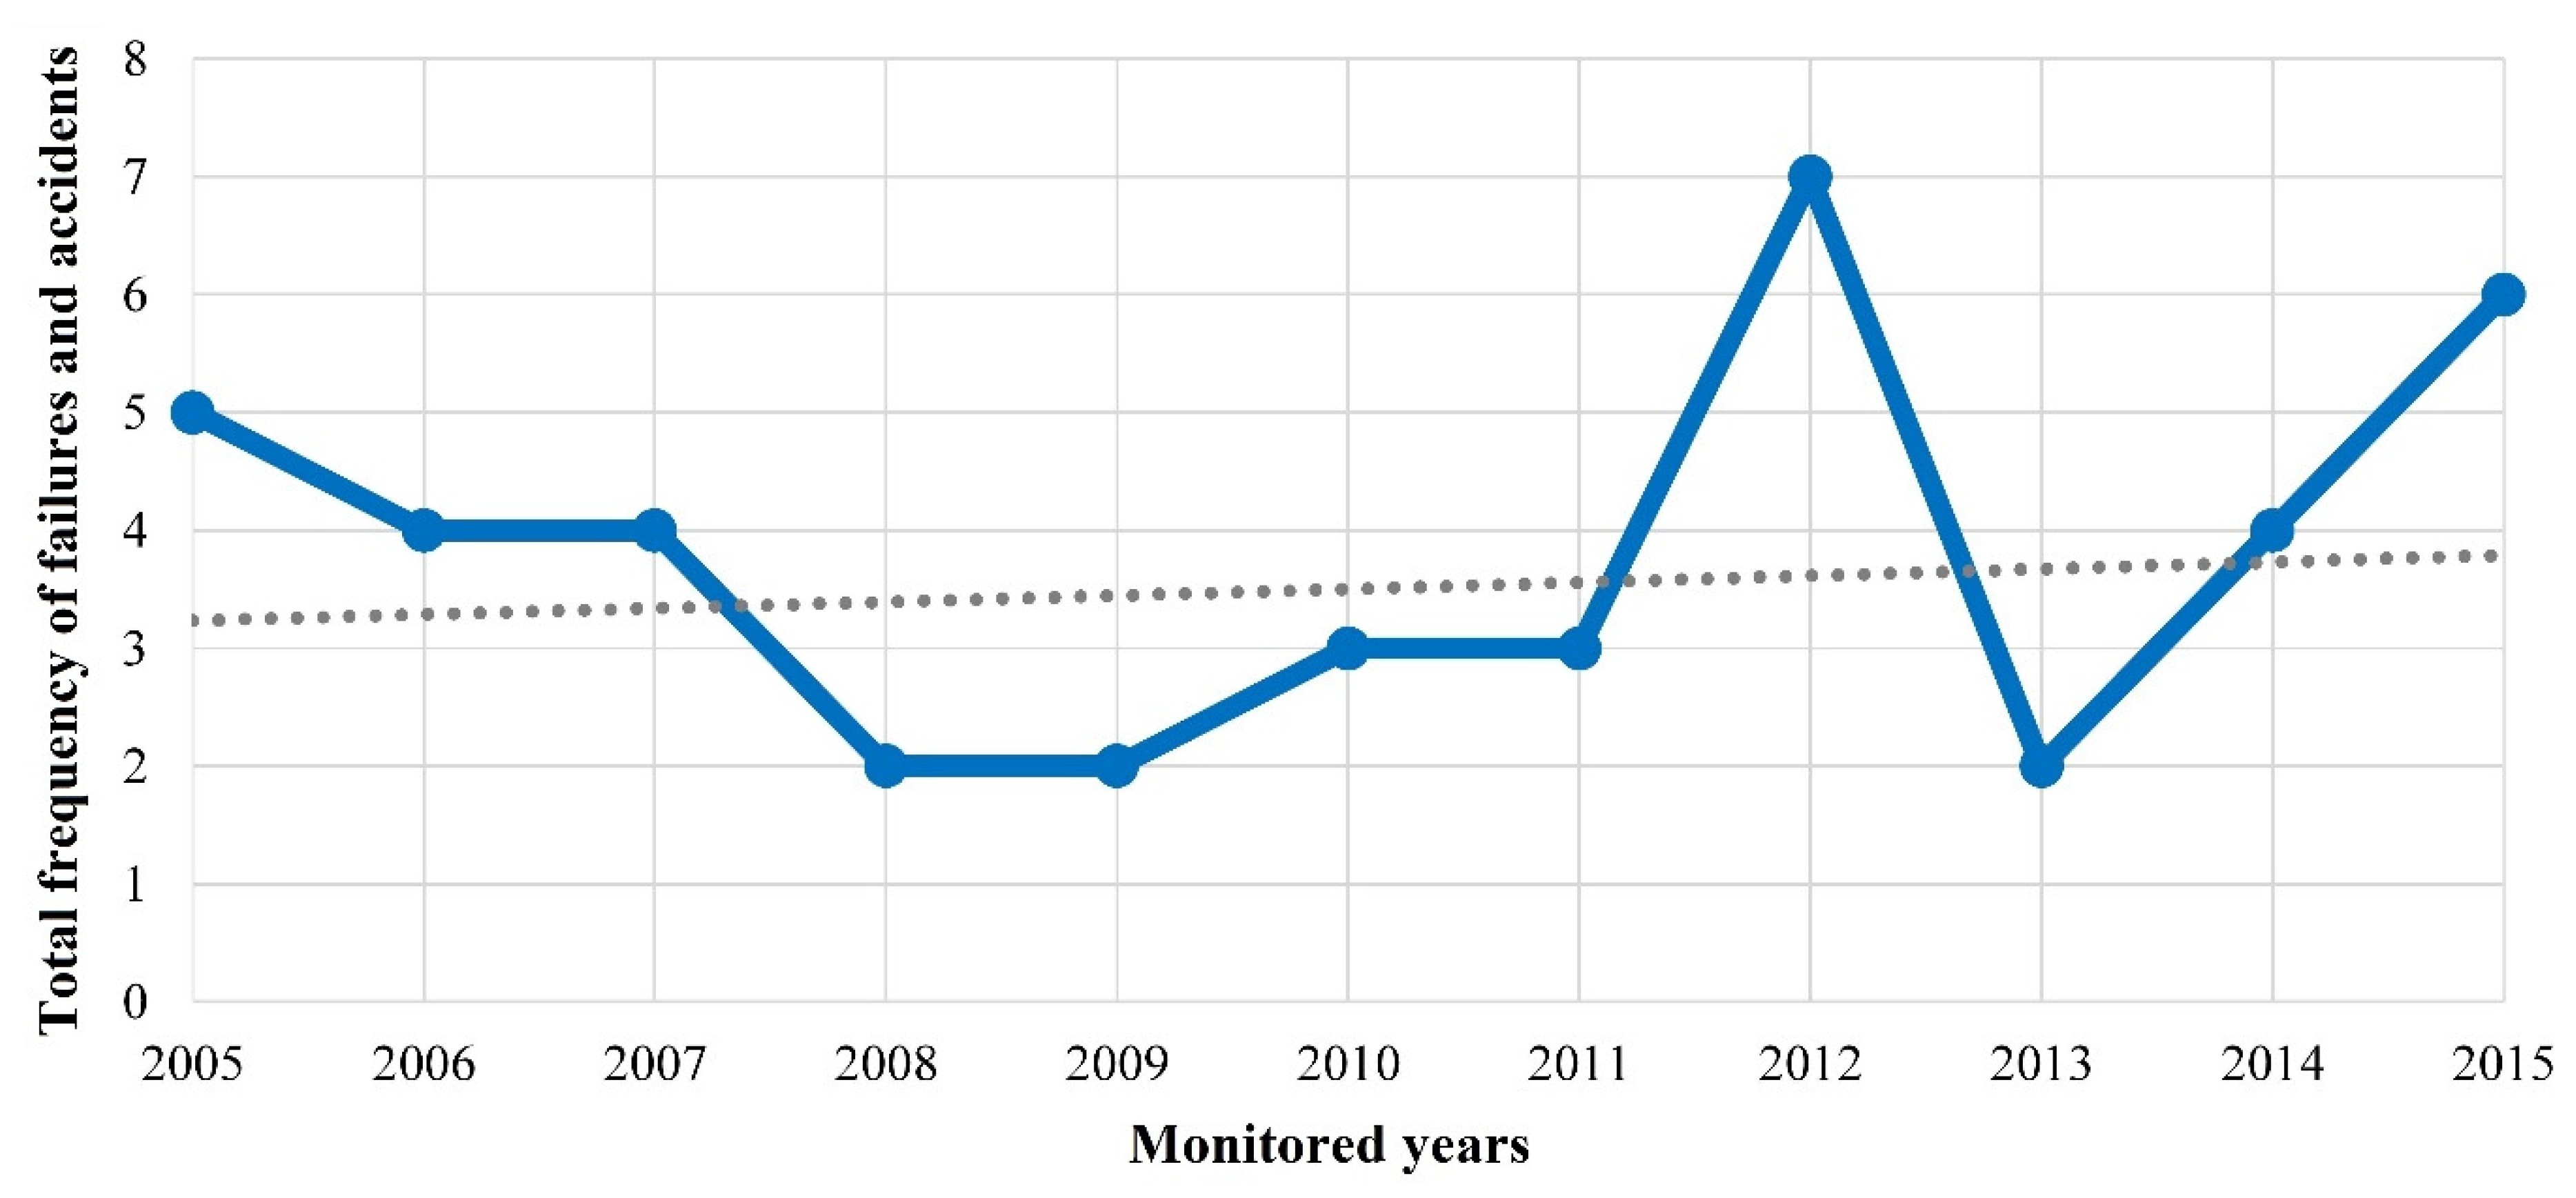
We also investigated the frequency of system failures by year from 2005–2015. These data are presented in
Figure 3. There was a maximum of seven failures in 2012, which was due in part to the extensive reconstruction and completion of the village gas pipeline. Three defects in the water pipeline were caused by mechanical damage during gas line construction. We also evaluated the trend in the frequency of failures and accidents on water mains over time and observed a small but steady increase in frequency. This trend line is also shown in
Figure 3.
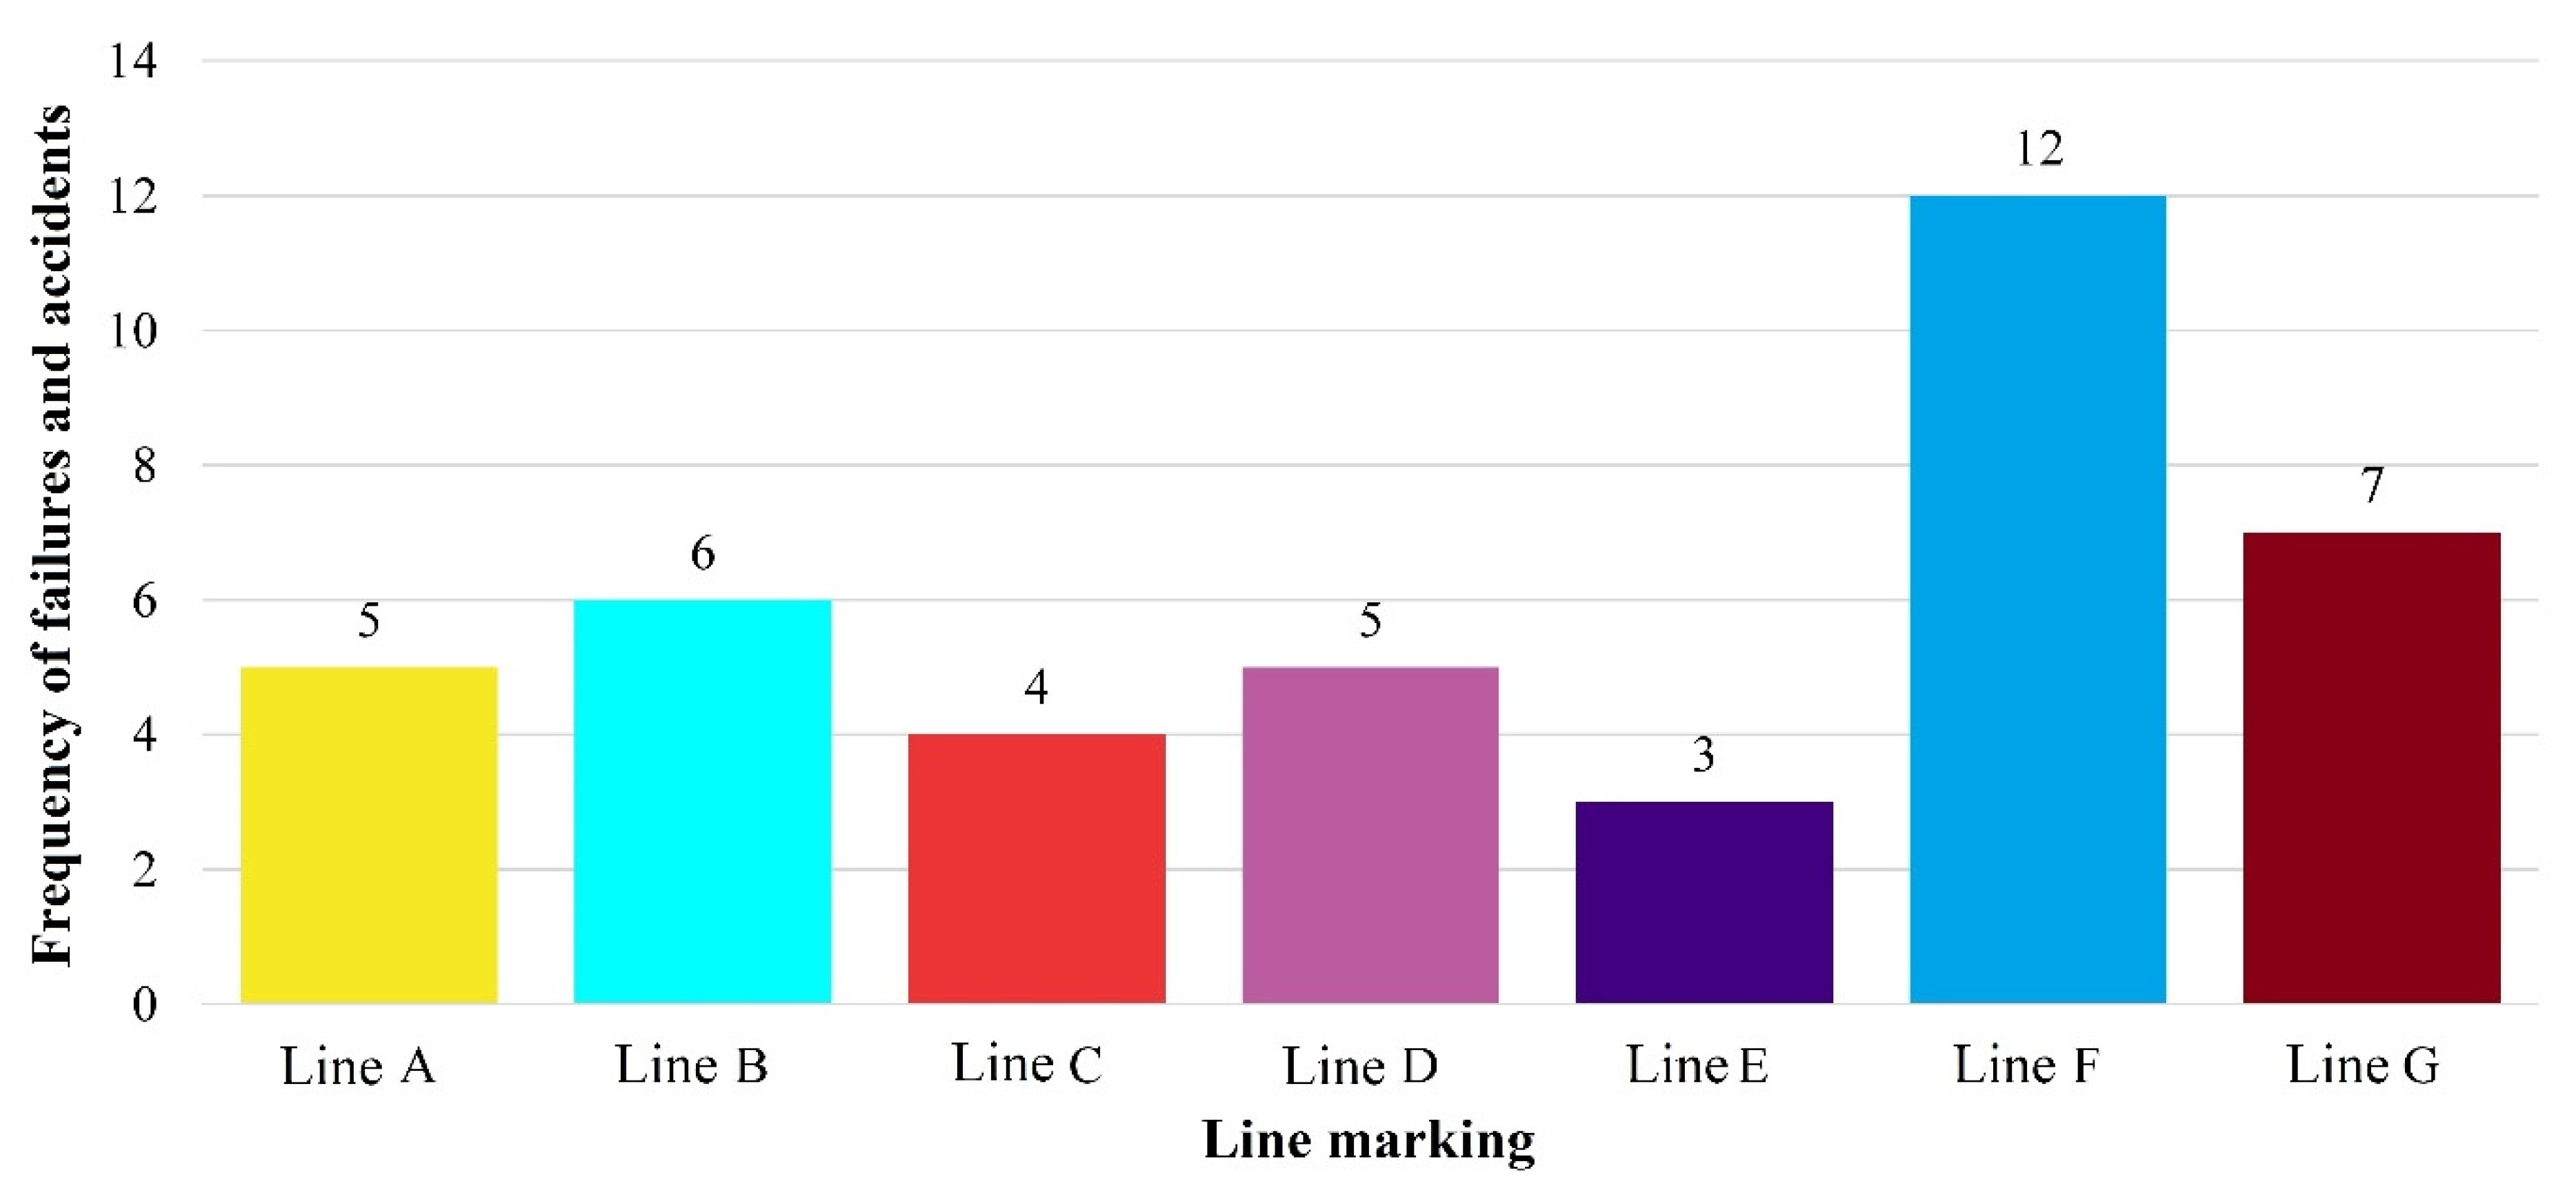
Figure 4 shows the frequency of failures and accidents in relation to individual water lines for the period from 2005 to 2015. There were 42 failures and accidents in the water supply network in the monitored period, which were not distributed equally between the water lines. In particular, Line F had the most failures with 12 events in the monitored period, while Line E had the fewest failures, with 3 events in the monitored period.
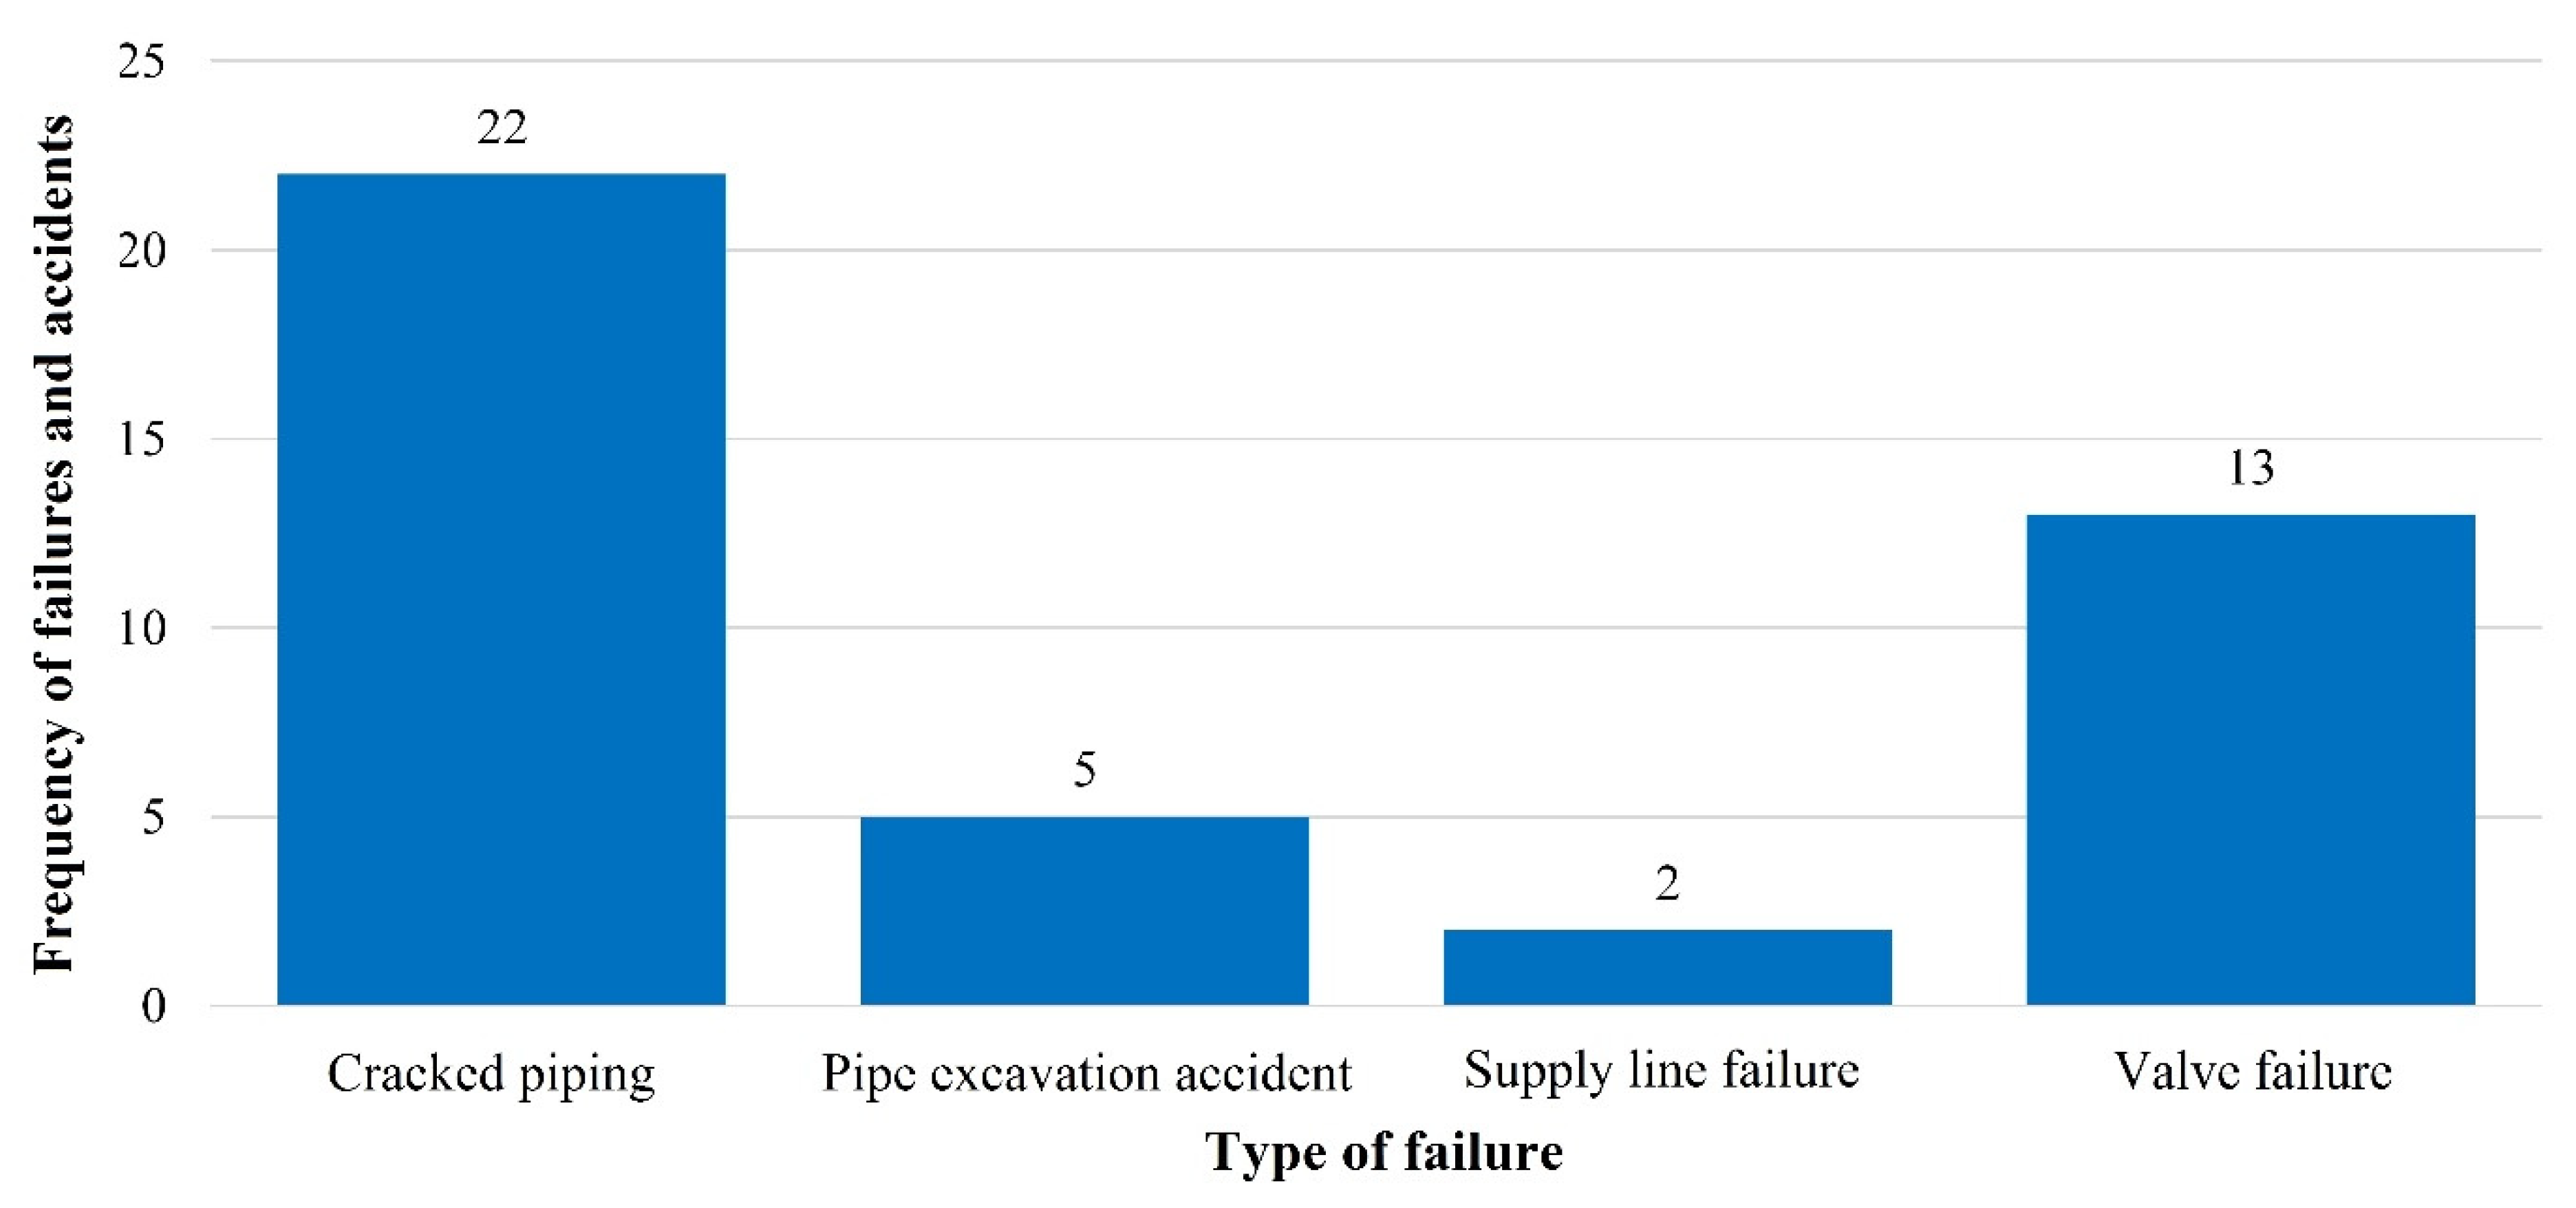
Figure 5 shows the number of failures categorized by type.
From
Figure 5, it is evident that the most common cause of a malfunction or emergency was a cracked pipe (n = 22 cases). The cracked pipe category includes any disturbance of the line elements, and are a significant source of water loss in the network. It can be further assumed that across the network there are also other minor water leaks. From the list of failures in the monitored period, it was noted that many faults were repaired by replacing the pipe material for long (>10 m) sections of the pipeline. However, these changes were not reflected in the project documentation provided by the operator and thus, were not reflected in the data on the age of the pipe material or the list of components in the water supply network. It follows that these structural changes are addressed by a reactive maintenance approach, so the problem is eliminated only after a failure occurs. According to the Civil Engineering Act No. 183/2006 Coll., as amended, this does not require any administrative construction proceedings, so the operator can improvise and carry out such repair even with no project documentation [
27,
28].
In
Table 12, we present the summary of the number of failures in each line over time and for the system overall. In total, there were 42 failures and accidents in the water supply system of the village between 2005 and 2015. The total length of the waterline is 9.0286 km and the number of failures per kilometre of water line per year was 0.4229 pp/km/year. The table also shows that the most problematic section of the water system was the F line—which was categorised as K4 with 0.6413 pp/km/yr—whereas the failure rate was the lowest for line A—which was categorised as K1 with 0.2039 pp/km/yr. Thus, the most critical component of the drinking water supply system is Line F. Finally,
Table 12 shows the categorisation of each line based on its individual failure rate while
Table 13 shows a ranking of the lines by performance. Overall, the water supply system was categorised as
K3 with regards to TI2, sorted by
Table 3.
3.2.3. TI3—Water Losses
Data on water losses in Zaben were not provided by the owner or the operator of the water system. The volume of water losses, or the balance of WNI, was therefore obtained from the development plans of water supply and sewage systems in the region (PRVKUK). These plans state that ‘the proportion of water not invoiced is consistently higher, reaching up to 31% of the quantity of water supplied to the system’ [
20]. Due to these enormous losses, the whole water system was categorised as K5 with regards to TI3 (sorted by
Table 5). This categorisation indicates that water loss is an emergency situation that requires immediate solutions.
3.2.4. TI4—Pressure Ratios
Pressure conditions in the water network in the village were broadly comparable across the whole system because the village lies on relatively flat plain where the altitude differences are minimal. Due to the altitude of the water tower reservoir which supplies drinking water to Zaben, among other villages, the network has compliant pressure conditions. The water level in the reservoir was between 306.5 and 311.8 m above sea level. The maximum hydrostatic pressure in the water supply system was thus 45.8 mH
2O, while the minimum was 36.5 mH
2O. These pressure conditions in the village water network can be considered as favourable, given
Table 5. In particular, 45.8 mH
2O is on the border between categories K1 and K2. However, in normal operating mode the hydrostatic pressure will be lower and thus the resulting category for TI4—pressure conditions of the water supply network—was K1 (sorted by
Table 5). Note that in certain cases, increased pressure can have adverse impact on network performance, especially in the case of a leak. Thus, water losses tend to increase in the system when pressure is high, interrelating TI3 and TI4.
3.2.5. TI5—Water Quality
Water quality is affected by many factors, including the age of the network, clogging, pipe material, quality of drinking water supplied, number of purification steps, and water residence time in the pipeline. Water quality categorisation was determined, as described in
Table 6. Given that the village of Zaben is supplied with drinking water from the regional water mains of Ostrava—which contains predominantly surface water—the water in the mains has adequate quality. Furthermore, residence of water in the pipes should be less than 24 h, due in part to the circular design of the network. The weakest point of the system is where water loss indicates leakage may be occurring. Leakage may result in a deterioration of the quality of drinking water in the pipeline. Thus, the resulting category for TI5 was K3 (sorted by
Table 6).
3.2.6. CTS—Overall Technical Condition
It was appropriate to determine the weight
Wi as an estimate, based on the significance of the indicators for the CTS of the water supply network. Usually, the significance of each TI
i stems mainly from their classification. In this case, we used equal weighting because the presented study was implemented as an illustrative and idealized model. However, with a more detailed solution, it would clearly be appropriate to adjust the values of the weights for individual TIs according to their severity. From this point of view, it would be most effective to increase the values of the weights for TI2, TI3 and TI5, which, in this context, have the most significant effect on water quality and system functionality. TI1 and TI4 then have a negligible effect. However, the degree of weights needs to be assessed separately for each area of interest, and it is therefore possible that in a different environment the distribution of Wi weights could be different. Substituting Equation (1) resulted in
Table 14 provides a summary of the categorisation for each TI and the overall condition (CTS). Based on the evaluation, the entire water supply system was categorised as K3 (sorted by
Table 7).
A categorisation of K3 indicates an average evaluation and, according to
Table 1, is not expected to require immediate rectification, though repairs and maintenance should be expected in the near future. However, it should also be noted that some of the technical indicators were categorised as being in very good condition (K1), while some were classified as emergency levels (K5). Considering this perspective, the overall condition of the water network is likely unsatisfactory, especially due to the enormously high water losses in the network. Thus, urgent action is likely required.
3.3. Funding and Planning for Water Main Renewal
To calculate the TDAP, the service life of the system is required along with the value of the percentage of wear. It is thus recommended that a financial plan be determined by considering the service life estimates presented in
Table 12. The obligation to save for, and subsequently restore, water systems was prescribed for owners of water supply systems by the Amendment to the Water Supply and Sewage Systems Act (i.e., the Act No. 76/2006 Coll.) as of February 2006. Based on this act, Zaben Municipality—as the owner of the water supply network in its region—should theoretically have annual funding for the restoration of the water mains (RPPO) for at least the next 10 years. Since no major reconstruction projects have been undertaken nor has other investment been made in the water system of the village so far, it can be assumed that the village has been saving the money to date.
Using Equation (3), we determined the percentage of wear as
which is consistent with the fact the system is past approximately half its service life. Subsequently, Equation (4) was used to determine the TDAP by
Based on these calculations, the total theoretical time required for accumulation of funds is 23.5 years, which means that the water supply system should be reconstructed in its entirety by 2042.
The total value of the water mains in the village (according to annual reports by SmVaK Plc) is approximately 26.823 million CZK (€1.03 million), RPPO was calculated using Equation (5) as follows:
which is equivalent to CZK 10.52 million (€404,615) over the 10 years since the establishment of the legal obligation to prepare a plan for financial renovation of water supply systems. These funds should therefore be either invested annually into water supply system renewal or the owner and operator should plan extensive reconstruction on the timescale of a few years, in which case the funds required are proportionally increased. If the municipality, as the owner of the water mains, obeyed the requirements of the law [
28], we can assume it has sufficient funding to commence the first phase of the water supply network reconstruction now.
Based on the evaluation of the structural condition described in
Section 3.2, we prepared a plan for the renovation of water mains in the village. As mentioned above, the significant water losses necessitate urgent solutions even though the overall system was generally evaluated as K3 (compliant). Draft plans for the reconstruction particularly considered the failure rate of individual water lines, since this factor has a significant influence on the reliability of the water system village. According to the failure rates of individual pipelines, we proposed a schedule of reconstruction for the water supply network. When preparing the schedule, there were distinguished preparatory and implementation phases of water supply reconstruction. The implementation phase involves the actual design of the infrastructural renewal, whereas the pre-realisation phase includes the preparation of the restoration project, its approval processes, building permit procedures, transport engineering measures during the reconstruction work and so on. The target end date of 2042 is due to the calculated TDAP. A summary of the proposed schedule is provided in
Table 15.
The first phase of restoration will take place in the years 2019–2025, which cover the restoration of the water supply system in the southwestern part of the village (Lines F and G) as well as construction of a second water supply conduit from Paskov City. Water line F will be renewed first since it has the highest failure rate of the entire water supply system and is likely a significant source of water losses in the system. Following the renovation of Line F, a second drinking water supply conduit from Paskov of approximately 870 m in length is expected to be constructed in 2021 and 2022 and is expected by PRVKUK [
20]. This conduit will connect to Line G, which will also be renewed during this process—specifically by replacing the current water mains with wider pipes (DN200 instead of DN50). Water supply lines F and G are currently designed as branch-type, but in the reconstruction, it would be advisable to interconnect them in a circular design so as to improve the operational certainty of both water lines. The second phase will take place between 2035 and 2042, when the remaining parts of water supply in the north-eastern area of the municipality (lines A through E) will be reconstructed. Specifically, water lines D and E will be reconstructed first, followed by lines B and C and finally line A. Thus, restoring the water supply system in the village is a large investment, for which the village must be well prepared.
Given the fees associated with lost water and that it is likely that part of this cost could be recovered by repairing the pipeline, system owners and operators may be incentivised to participate in the revitalisation process. Consider that the present annual water consumption is approximately 36,223 m
3/yr. and that WNI may account for up to 11,229 m
3/yr. Furthermore, consider that the price of water is CZK 34.40 (€ 1.32)/m
3. As such, the financial loss is approximately CZK 386,278 (€ 14.856,85), which represents a significant annual financial loss to the operator of water supply network which may encourage operators to financially support and maintain the system [
29].
In short, the result of our proposed financing plan was the annual need to set aside financial assets for the renovation of water supply systems. This is necessary to ensure the required technical equipment and stable operation of the water supply system, the financing for which could be incentivised to operators by addressing the cost of lost water in systems needing repair [
28].
3.4. Final Recommendations and Discussions
As described above, the subject of the practical part of the work was modeling and subsequent optimization of the water supply network in Zaben village. Only the distribution network in the village was solved in the work. In the case of further development of the issue, not only should the distribution network itself should be addressed, as it is the most common place of failures and accidents, but so should other parts of drinking water supply system, which form a significant part of the entire system. These parts can include, in particular, raw water sources, drinking water treatment plants, water inlets and reservoirs. In this work, the basic risks of these and other buildings are only outlined, however, the evaluation of their construction and economic condition is not included here due to the scope of the topic. For further development of the issue, it would be appropriate to apply, for example, the methods used in this work, or some other methods of risk analysis, namely those parts of the water supply system that have a significant impact on the functionality and reliability of the system.
For further development of modeling and optimization of the reliability of buildings for drinking water supply, it also seems important to take into account other areas that have been revealed during the elaboration of this very comprehensive topic. Areas suitable for further solution of the issue include in particular:
the effects of other infrastructures (transport, energy, sewerage, hot water, etc.) and other elements of public space (greenery, furniture, space division) on the operability and failure rate of water supply networks,
the effects of method of laying engineering networks or water mains on their service life, reliability and failure rate (simple installation in the field, trenchless technologies, pipeline material, common and combined routes, etc.),
evaluation of other operational parts of drinking water supply system, such as raw water sources, drinking water treatment plants, water supply, water reservoirs, pumping stations, etc.,
economic evaluation and balancing of individual water supply lines in connection with the financing of the renewal of water supply systems for public use,
design of method of optimization (e.g., the possibility of using suitable trenchless technology, simple storage in the ground, material design, coordination with other elements of public space) based on the construction status of the water supply network using the FMEA method,
prediction of failures and accidents in drinking water supply system using a suitable statistical method based on the evaluation of the failure rate of individual elements of the system and the determination of the resulting time to failure (e.g., FTA tree analysis),
solution and design of a maintenance plan for inspections and revisions using modern technologies for monitoring water supply networks and related operating files (especially detection of water leakage from pipes, monitoring the course of hydrodynamic pressures in the water supply network, etc.)
4. Conclusions
Water supply networks in the Czech Republic are an extensive grid of 77.146 km of water mains that supply water to 9.93 million people—approximately 94% of the population. The water losses in the network have been slightly reduced in recent years, but may still reach an average of 16.8% of water intended for delivery. This amount corresponds to approximately 99.1 million m3 of water per year, which is a huge amount of water that it is costly to produce and is subsequently lost due to leaks. This study presents the water supply network of a model territory in the village of Zaben in the Czech Republic. We applied the methodology for evaluating the technical condition of the water supply system, according to the general FMEA approach. Based on this methodology, the evaluation of individual sections of the water mains was conducted according to their structural condition. We also proposed a financial and logistical plan for the reconstruction of the water supply system in the village on the basis of our analysis. Notably, the proposed time schedule was designed such that the sequence of individual water lines being renewed reflects their structural condition. The result is a schedule for water main reconstruction, whereby the priority is the renewal of those lines that are in the worst technical condition. This schedule can serve as a basis for both the owner and the operator of the water supply network when preparing for the reconstruction or development of the water supply and sewer systems in the region.
The analysis shows that the most critical point of the drinking water supply system in the municipality is clearly the water supply line F, where there is an average of 0.64 failures per kilometer of water supply per year. The second most problematic section is the line G. On the contrary, the smallest number of failures and accidents for the monitored period is shown by the line A with 0.2 failures per one kilometer of water pipeline per year. According to the methodology for evaluating the technical condition of the water supply network in the village was generally evaluated as network belonging to the K3 category—satisfactory. However, due to the enormous losses of water in the network and the relatively high failure rate, especially of some water supply lines in the village, it is appropriate to start the renewal of the water supply system in the village now. The renewal proposal is mainly based on the failure rate of individual series, as this factor has a significant effect on the reliability of the whole drinking water supply system in the village. The procedure and data processing proposed in this work, which was presented on the water supply network in the model area of the village Zaben could be applied to other water supply systems in other municipalities and cities to create realistic conditions for efficient operation of water supply networks and significantly support sustainable development area.
As part of the management of water supply networks in the Czech Republic (in the case where the operator is a private company, as in this case, SmVaK Plc), the total operation is solved for the purpose of maximum profit of the operator. Private entities are not entitled to any state or other support and therefore all interventions in the system are handled as low-cost. In contrast, there are systems that are operated by the state sphere. Here, the main goal is to ensure the supply of water in the required quality and with maximum efficiency. However, there are few such systems in the Czech Republic, mainly due to historical political practices (especially in the 90s). Fortunately this situation has recently improved and an increasing number of drinking water supply systems are being taken over by the state sphere.


