Article

Numerical Modeling and Analysis of Concrete Slabs in Interaction with Subsoil

1
Department of Structures, Faculty of Civil Engineering, VSB-Technical University of Ostrava, 708 00 Ostrava-Poruba, Czech Republic
2
Department of Building Materials and Diagnostics of Structures, Faculty of Civil Engineering, VSB-Technical University of Ostrava, 708 00 Ostrava-Poruba, Czech Republic
*
Author to whom correspondence should be addressed.
Sustainability 2020, 12(23), 9868; https://doi.org/10.3390/su12239868
Submission received: 23 October 2020 / Revised: 20 November 2020 / Accepted: 23 November 2020 / Published: 25 November 2020
(This article belongs to the Special Issue Civil Engineering as a Tool for Developing a Sustainable Society)

Abstract

:
This article focuses on the analysis and numerical modeling of a concrete slab interacting with subsoil. This is a complex task for which a number of factors enter into the calculation, including the scope or dimension of the model, the non-linear solution approach, the choice of input parameters, and so forth. The aim of this article is to present one possible approach, which is based on a non-linear analysis and a three-dimensional computational model. Five slabs were chosen for modeling and analysis. The experiments involved slabs of 2000 × 2000 mm and a thickness of 150 mm, which were tested using specialized equipment. The slabs included a reinforced concrete slab, a standard concrete slab, and three fiber-reinforced concrete slabs. The fiber-reinforced slabs had fiber volume fractions of 0.32%, 0.64%, and 0.96%, which corresponded to fiber dosages of 25, 50, and 75 kg/m3. A reinforced concrete slab was chosen for the calibration model and the initial parametric study. The numerical modeling itself was based on a detailed evaluation of experiments, tests, and recommendations. The finite element method was used to solve the three-dimensional numerical model, where the fracture-plastic material of the model was used for concrete and fiber-reinforced concrete. In this paper, the performed numerical analyses are compared and evaluated, and recommendations are made for solving this problem.

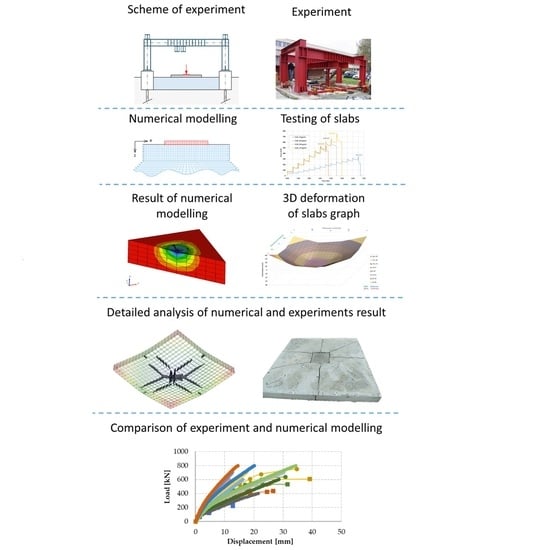
Graphical Abstract

1. Introduction

Numerical modeling [1,2], together with experiments [3,4,5,6,7], enables a detailed understanding of the real behavior of structures and structural optimization. The search for new and innovative design solutions is then associated with the use of advanced materials [8,9,10,11]. Detailed knowledge of the behavior of structures built with new innovative materials can then lead to sustainable development in construction. The most important materials in construction include concrete and its variants, for example, steel fiber-reinforced concrete.
Innovative materials include fiber-reinforced concrete [12,13,14,15,16,17,18,19], which can contribute to the durability and economy of the design. We can classify this material as quasi-brittle [20,21,22,23]. For proper function and optimized design, however, it is important to optimize the dosage of fibers and the choice of concrete formulation. Advanced design also includes the use of computer simulation and non-linear analysis [24] to take into account the real behavior of the structure.
Dispersed reinforcement eliminates many of the disadvantages of conventional concrete. In addition, the design of a structural element requires greater knowledge of mechanical parameters [25,26,27], which are determined on the basis of specialized laboratory tests [28,29]. In particular, the determination of tensile strength and fracture energy is very difficult. Many researchers have investigated the field of testing and the mechanical properties of concrete [30,31,32,33,34,35,36,37,38,39,40,41] and fiber-reinforced concrete [15]. The influence of the test method, the sample size, and the boundary conditions are described in [19], where the authors deal comprehensively with the material’s mechanical properties.
The structural application of fibers includes industrial floors [42,43], foundation slabs [44,45,46,47,48,49], or reinforced concrete beams and slabs without shear reinforcement. Typically, fibers are used in concrete slabs in interaction with the subsoil [50,51,52,53,54], where the fibers contribute to increased resistance to punching and shear failure.
It is usual for such structural elements (industrial floors, foundation slabs, beams) to have a mechanism for shear failure [55] or punching [5]. A number of research programs have addressed this issue, which has generally led to specialized solutions [56,57,58,59,60,61,62,63]. The problematic parts also include a lack of information with respect to input parameters. Possible solutions include the use of numerical modeling, which can offer a better and more general solution [2]. Issues related to the failure or shear capacity of concrete have been addressed in a number of studies, where the use of fiber-reinforced concrete has been found to contribute to a more significant and effective solution when compared with conventional reinforcement approaches.
The solving of this problem involves a number of variables and it is necessary to consider the appropriate boundary conditions, the mechanical properties, and the scope of the computer model. Possible variants of material models include a disturbed stress field model for concrete [64], an elastic-plastic material model for conventional concrete, a micro-plane model [65], or a fracture-plastic material model [26].
The basic recommendations for modeling [66] and non-linear analysis are also given in the Model Code 2010 [67]. With the development of knowledge regarding subsoil and numerical methods, a research space has emerged where the finite element method is applied, which is also suitable for non-linear analysis. This article aims to follow up on this issue and present one possible approach to the solution. During the analysis, it is important to follow the recommendations for modeling concrete construction, and to ensure the appropriate size of the computational model and the modeled subsoil, as well as the appropriate input parameters, for the calculation. Several material models are relevant in respect to non-linear analysis; material models vary in terms of their cogency, computing demands, the scope of tasks being performed, and, in particular, the input information required. Reliable input data with respect to material properties is the fundamental precondition for further use of these methods [66,67].
An advanced constitutive model of concrete (3D Nonlinear Cementitious 2) is based on fracture mechanics and the theory of plasticity [68]. The material model chosen for this study is based on the smeared crack concept in tension failure. This problem is shown in Figure 1. The localization of the deformation in the crack band is close to a real discrete crack. Refs [69,70,71] describe the basic idea of the crack band approach, which reduces the sensitivities of the numerical model depending on the size of the finite element mesh [68].

2. Parametric Study and Basic Computational Model

2.1. Experiment—Reinforced Concrete Slab

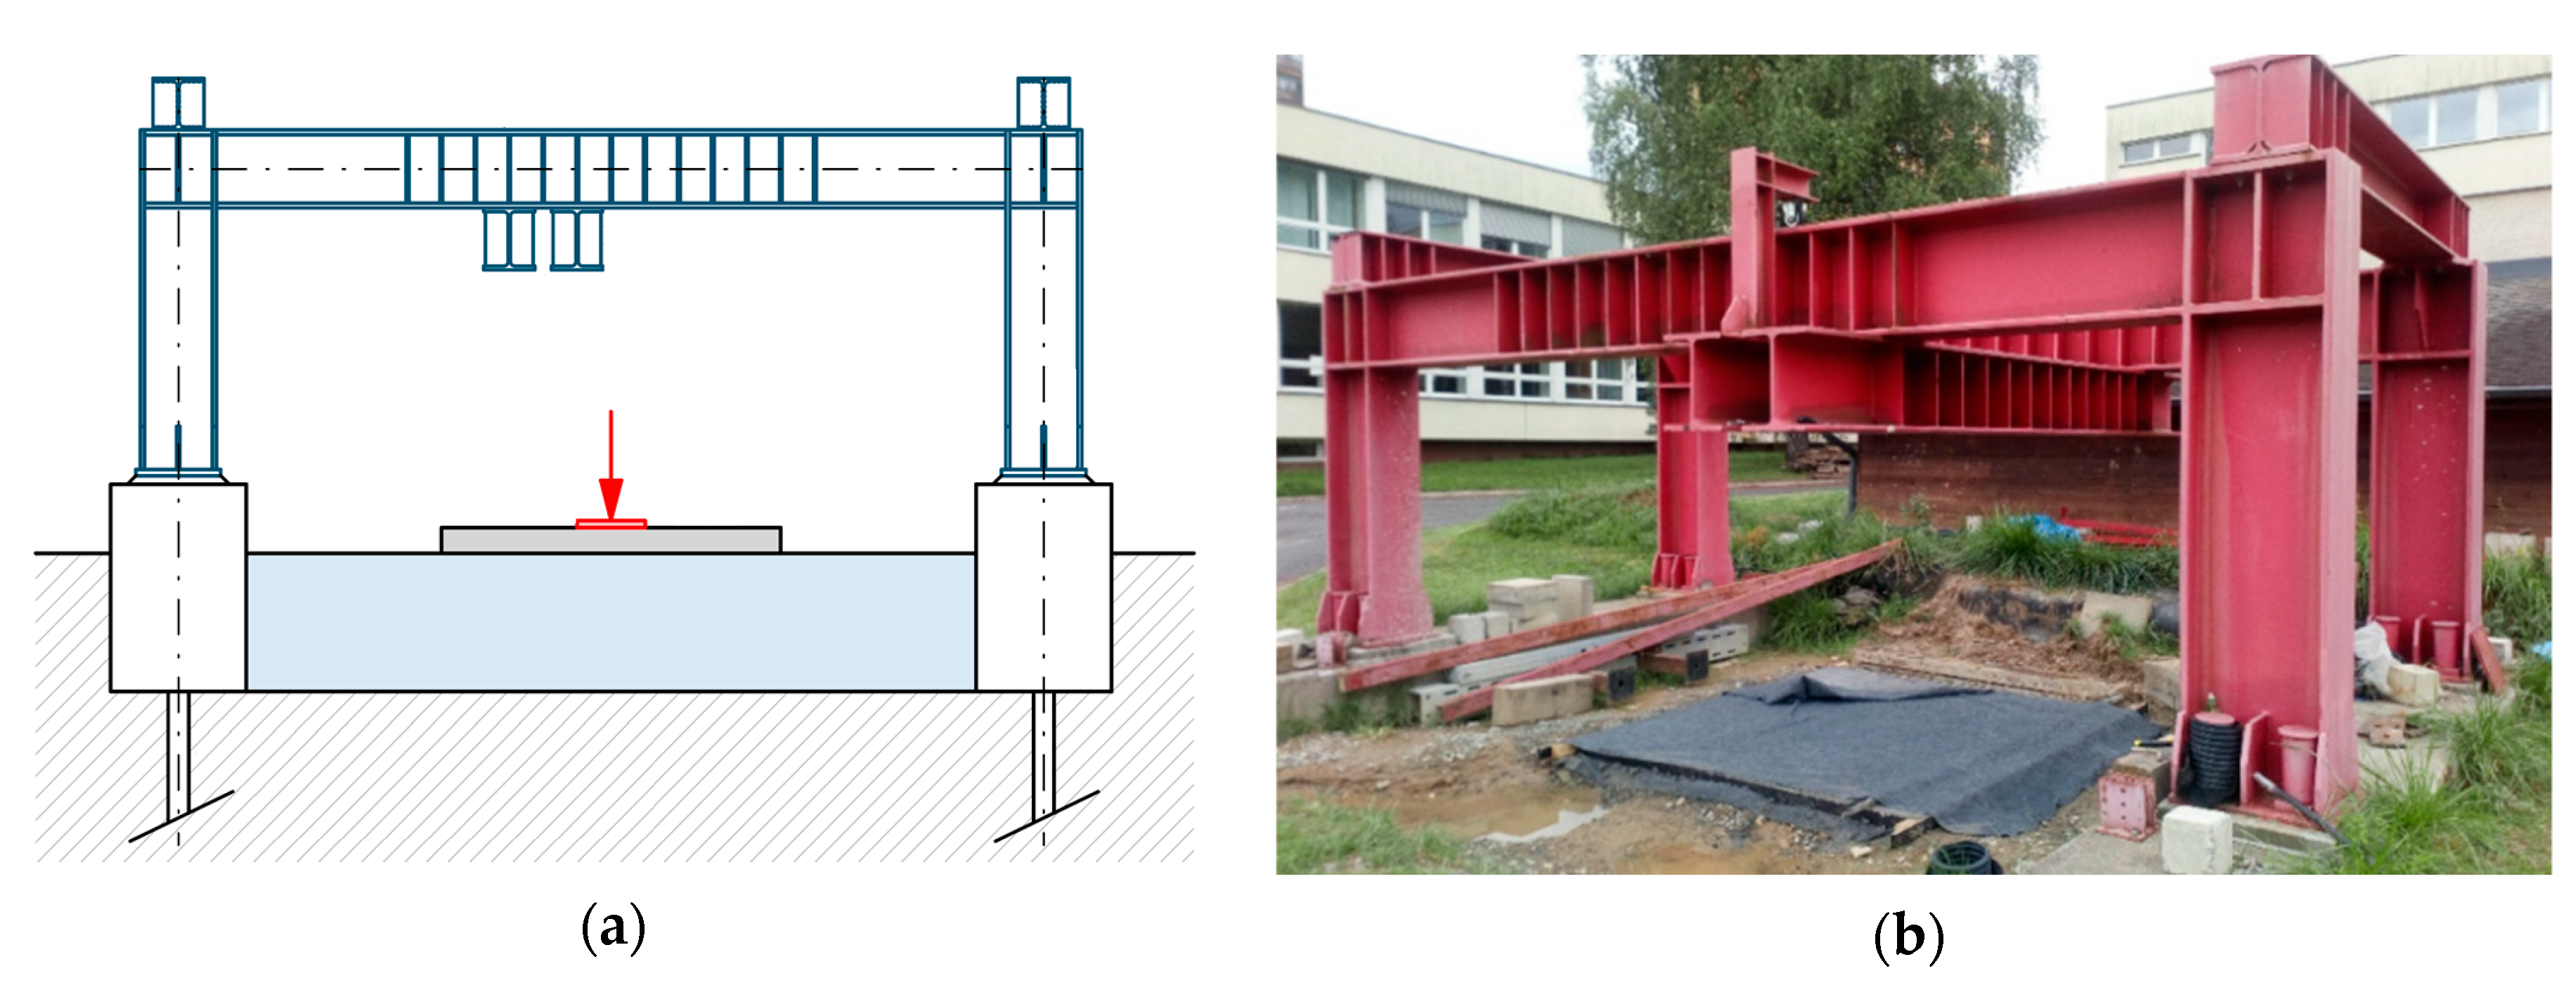
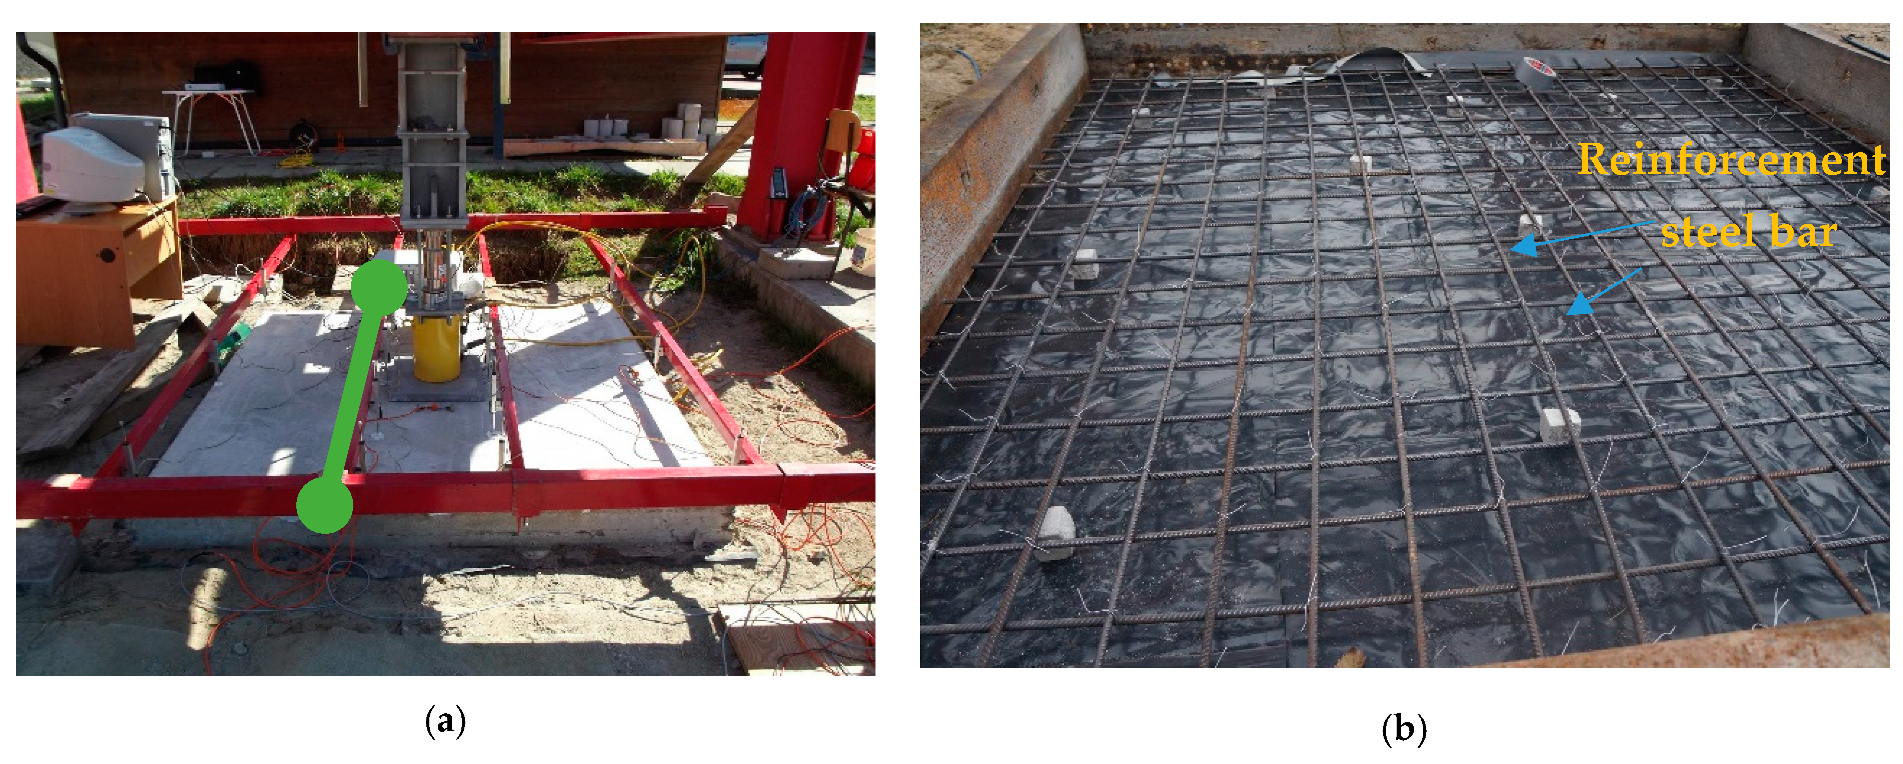
For the introductory parametric study and basic computational model, we used a reinforced concrete slab of 2000 × 2000 mm with a thickness of 150 mm. The specialized test machine shown in Figure 2, that was used for the experiment [72], is located at the Faculty of Civil Engineering, Technical University of Ostrava, Czech Republic. The reinforced concrete slab shown in Figure 3a was loaded under axis-symmetric conditions and was cast from a concrete strength class of C35/45. The reinforcement was a steel mesh of Ø 8/100 mm (see Figure 3b). The subsoil was classified as clay soil. The values of the subsoil deformation modulus Esoil and soil were in the range of 12.5 to 32.5 MPa. In the case of the solved test, the value of the deformation modulus of the subsoil was 22.5 MPa. The testing equipment was designed for loads up to 1000 kN and includes a measuring and control panel for a hydraulic cylinder. A total of 16 linear potentiometric displacement sensors were used in the test. For evaluation, the five sensors indicated by the green line in Figure 3a were used.
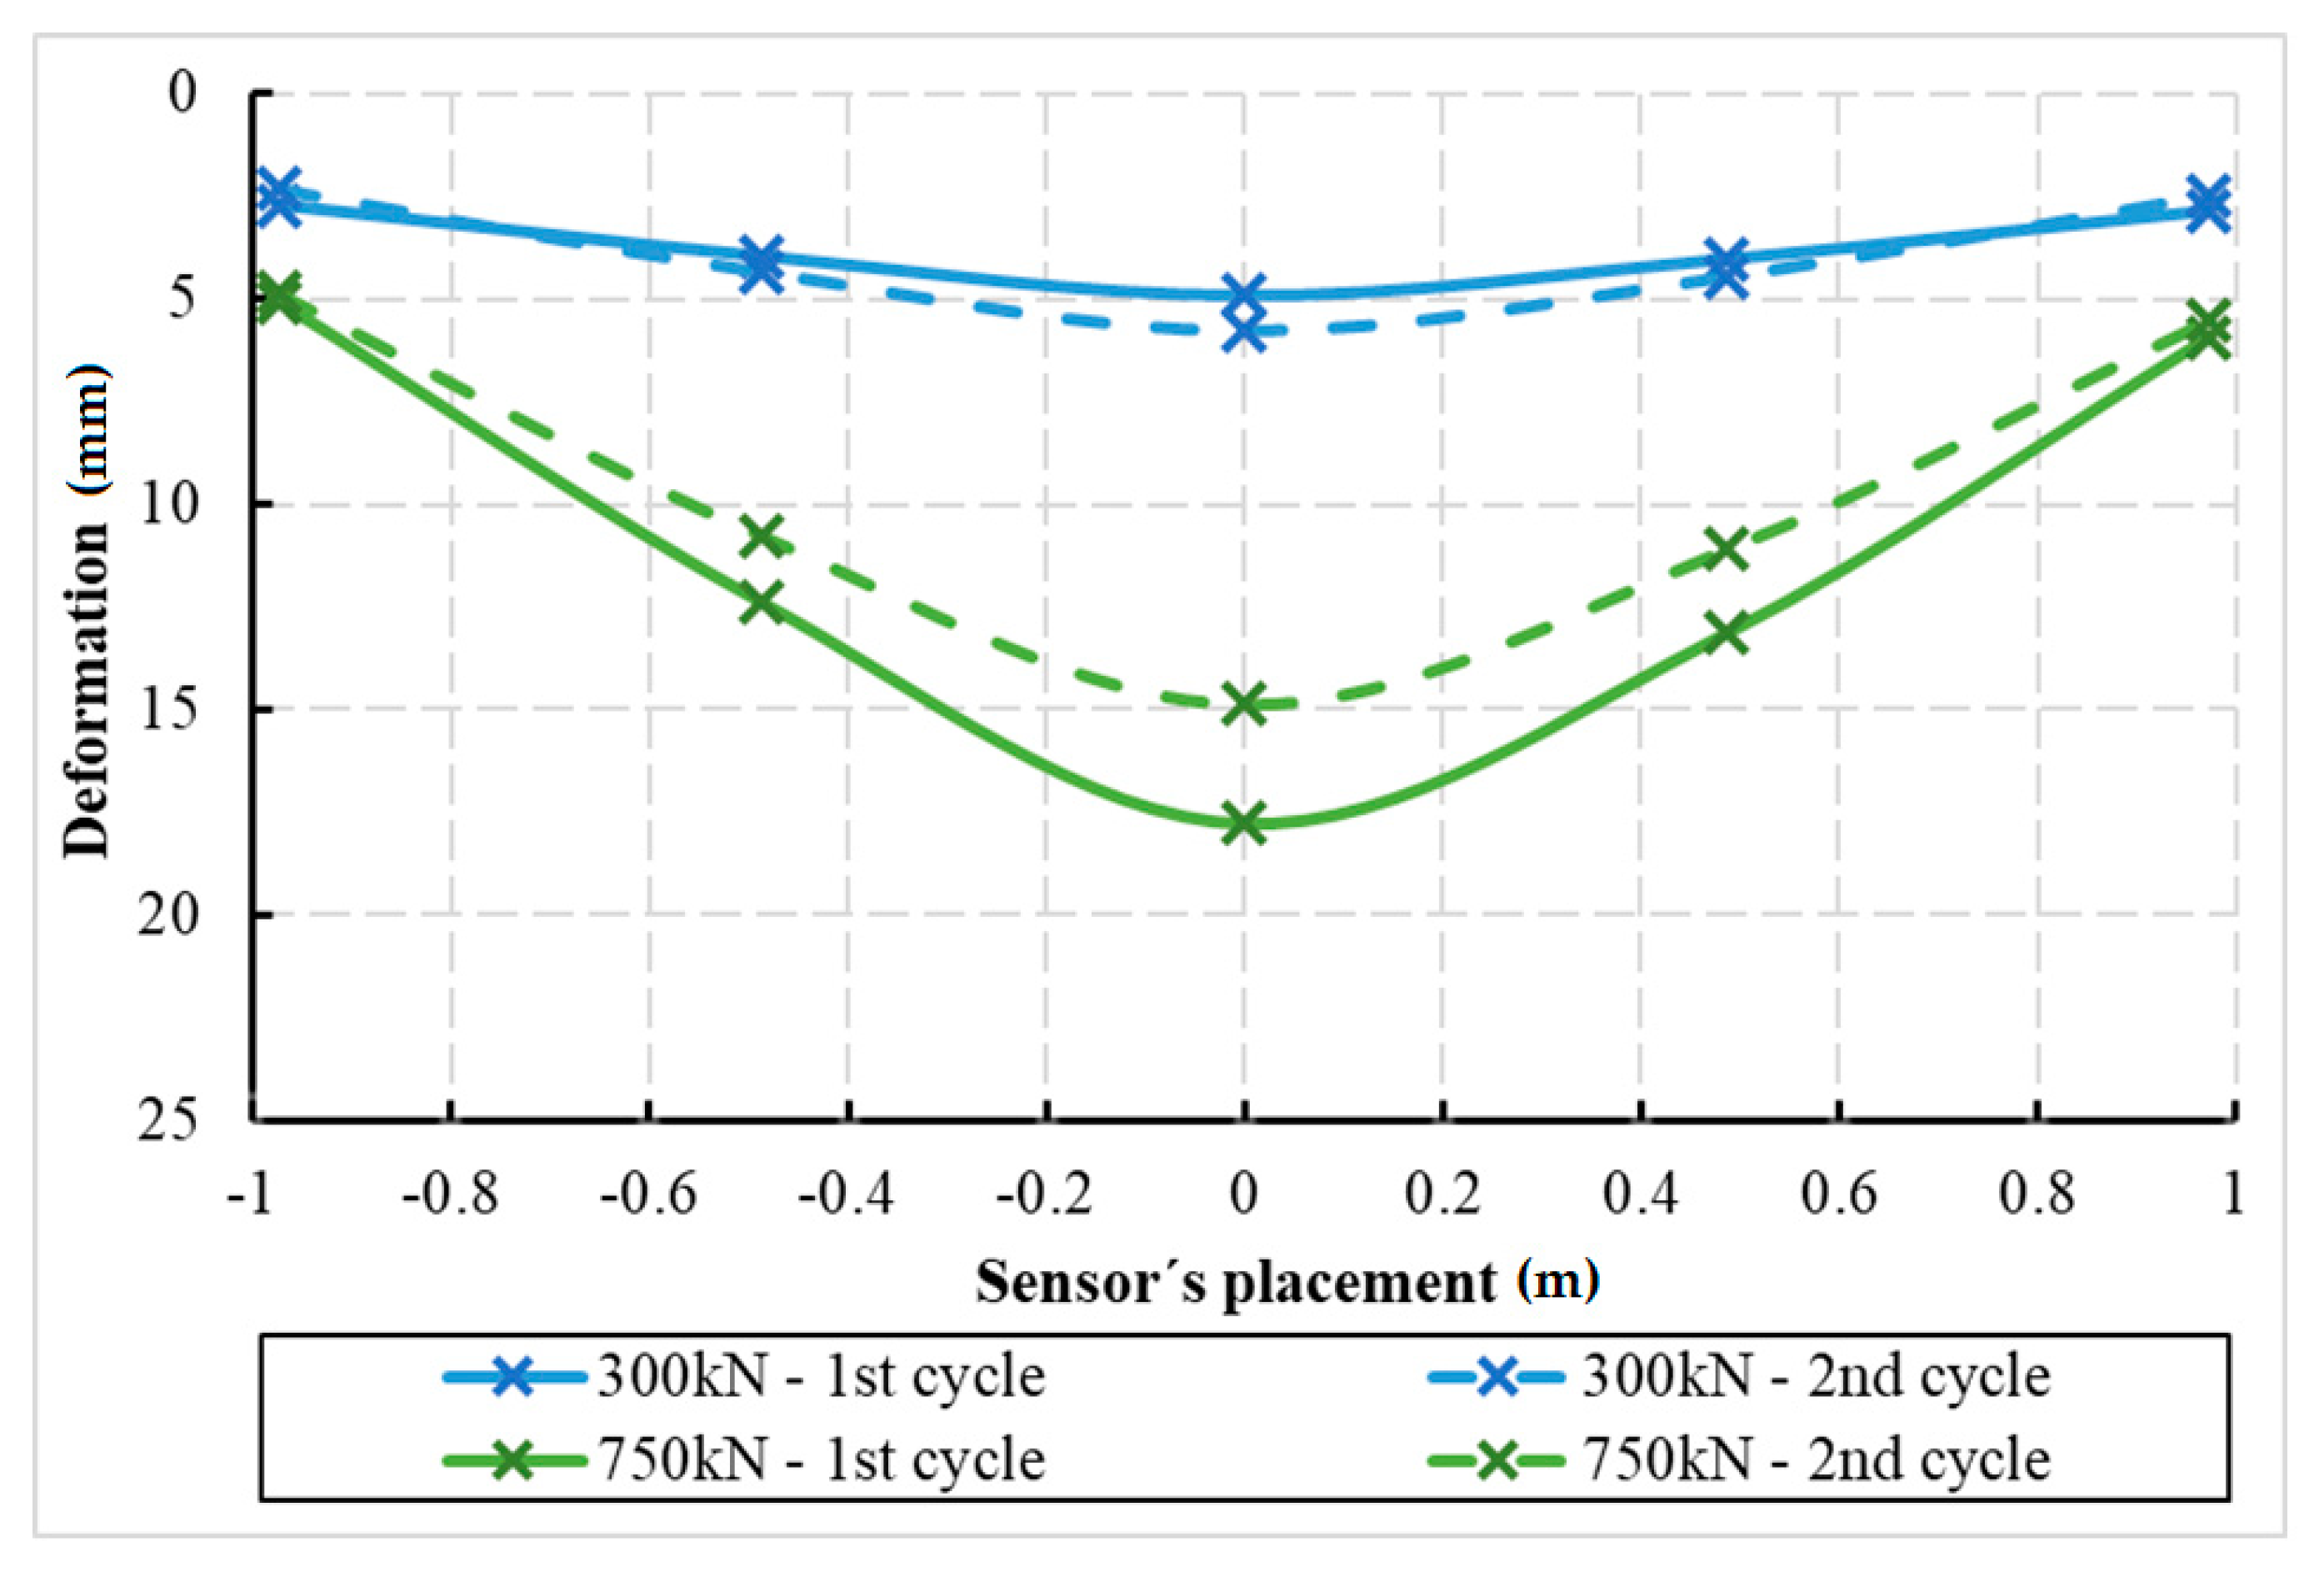
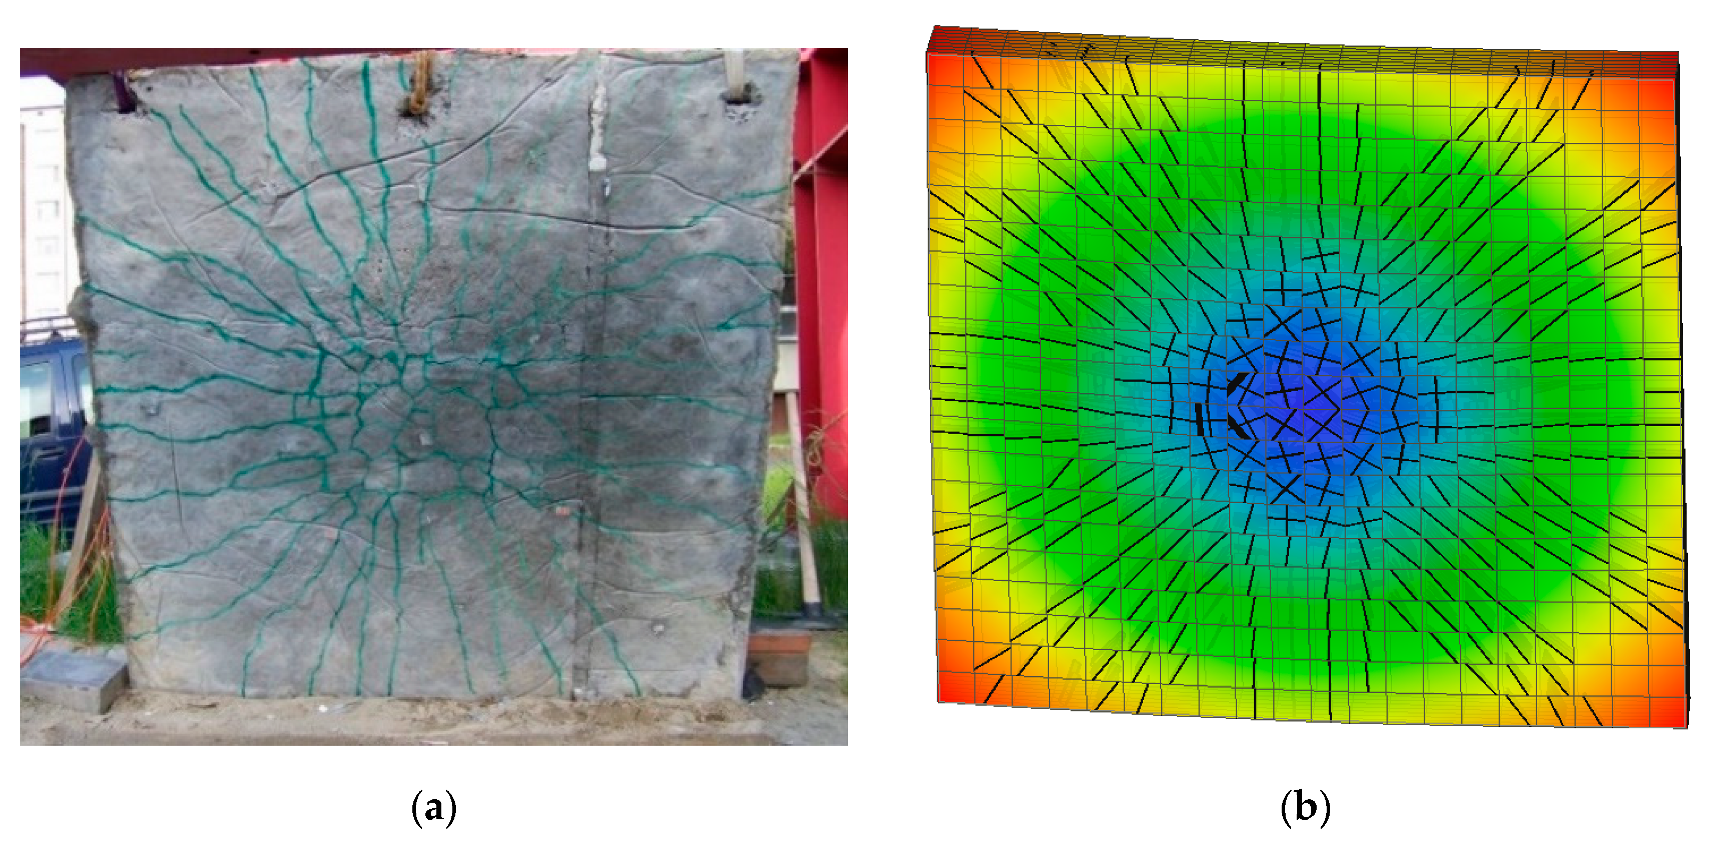
For comparison with the numerical model, two loading steps were selected, the size of which can be seen in Figure 4. The 750 kN value was the last load step in the experiment. The resulting deformations (see Figure 4) were evaluated using deformation curves for the cross-section corresponding to the green line in Figure 3a. The reinforced concrete slab after the test is shown in Figure 5a and calculation model with cracks in Figure 5b. In Figure 5a, the green lines indicate the mesh of cracks in the concrete on the underside of the slab.
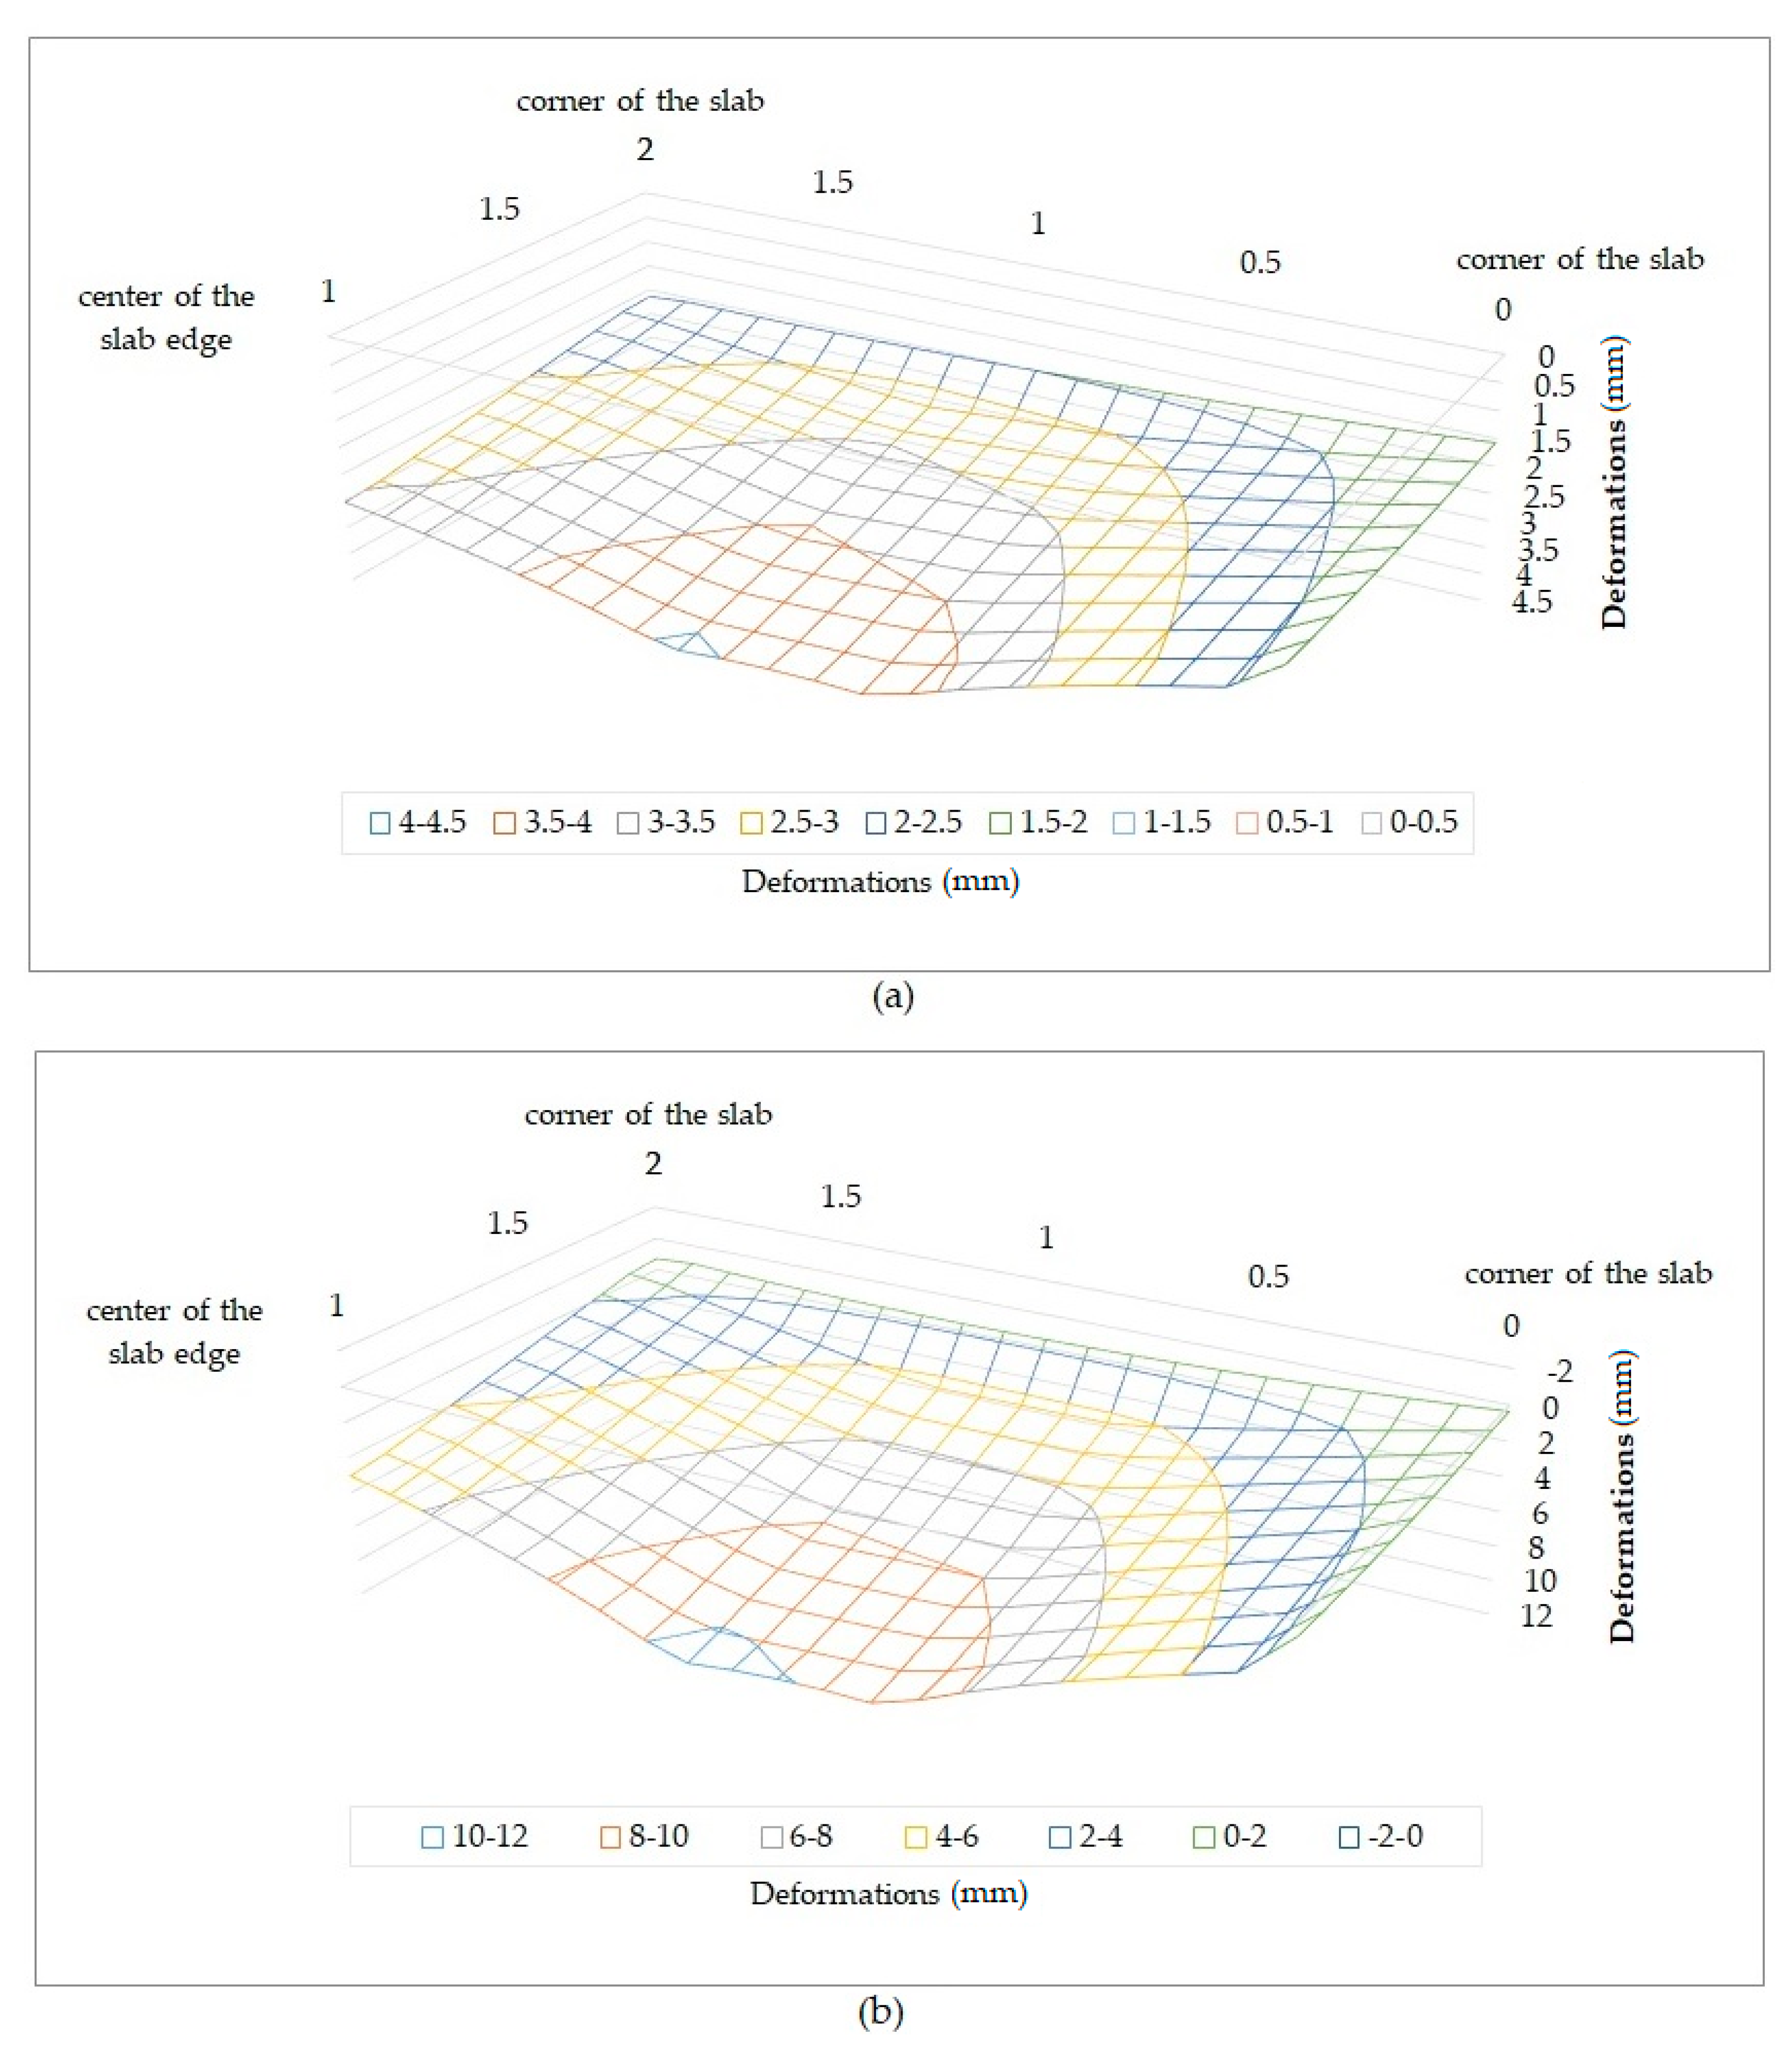
Advanced processing and evaluation of data from sensors were carried out to evaluate the experiment. Specifically, three-dimensional deformation graphs for the reinforced concrete slab were plotted, which are shown for selected load cases in Figure 6.

2.2. Experiment for Reinforced Concrete Slab—Numerical Modeling

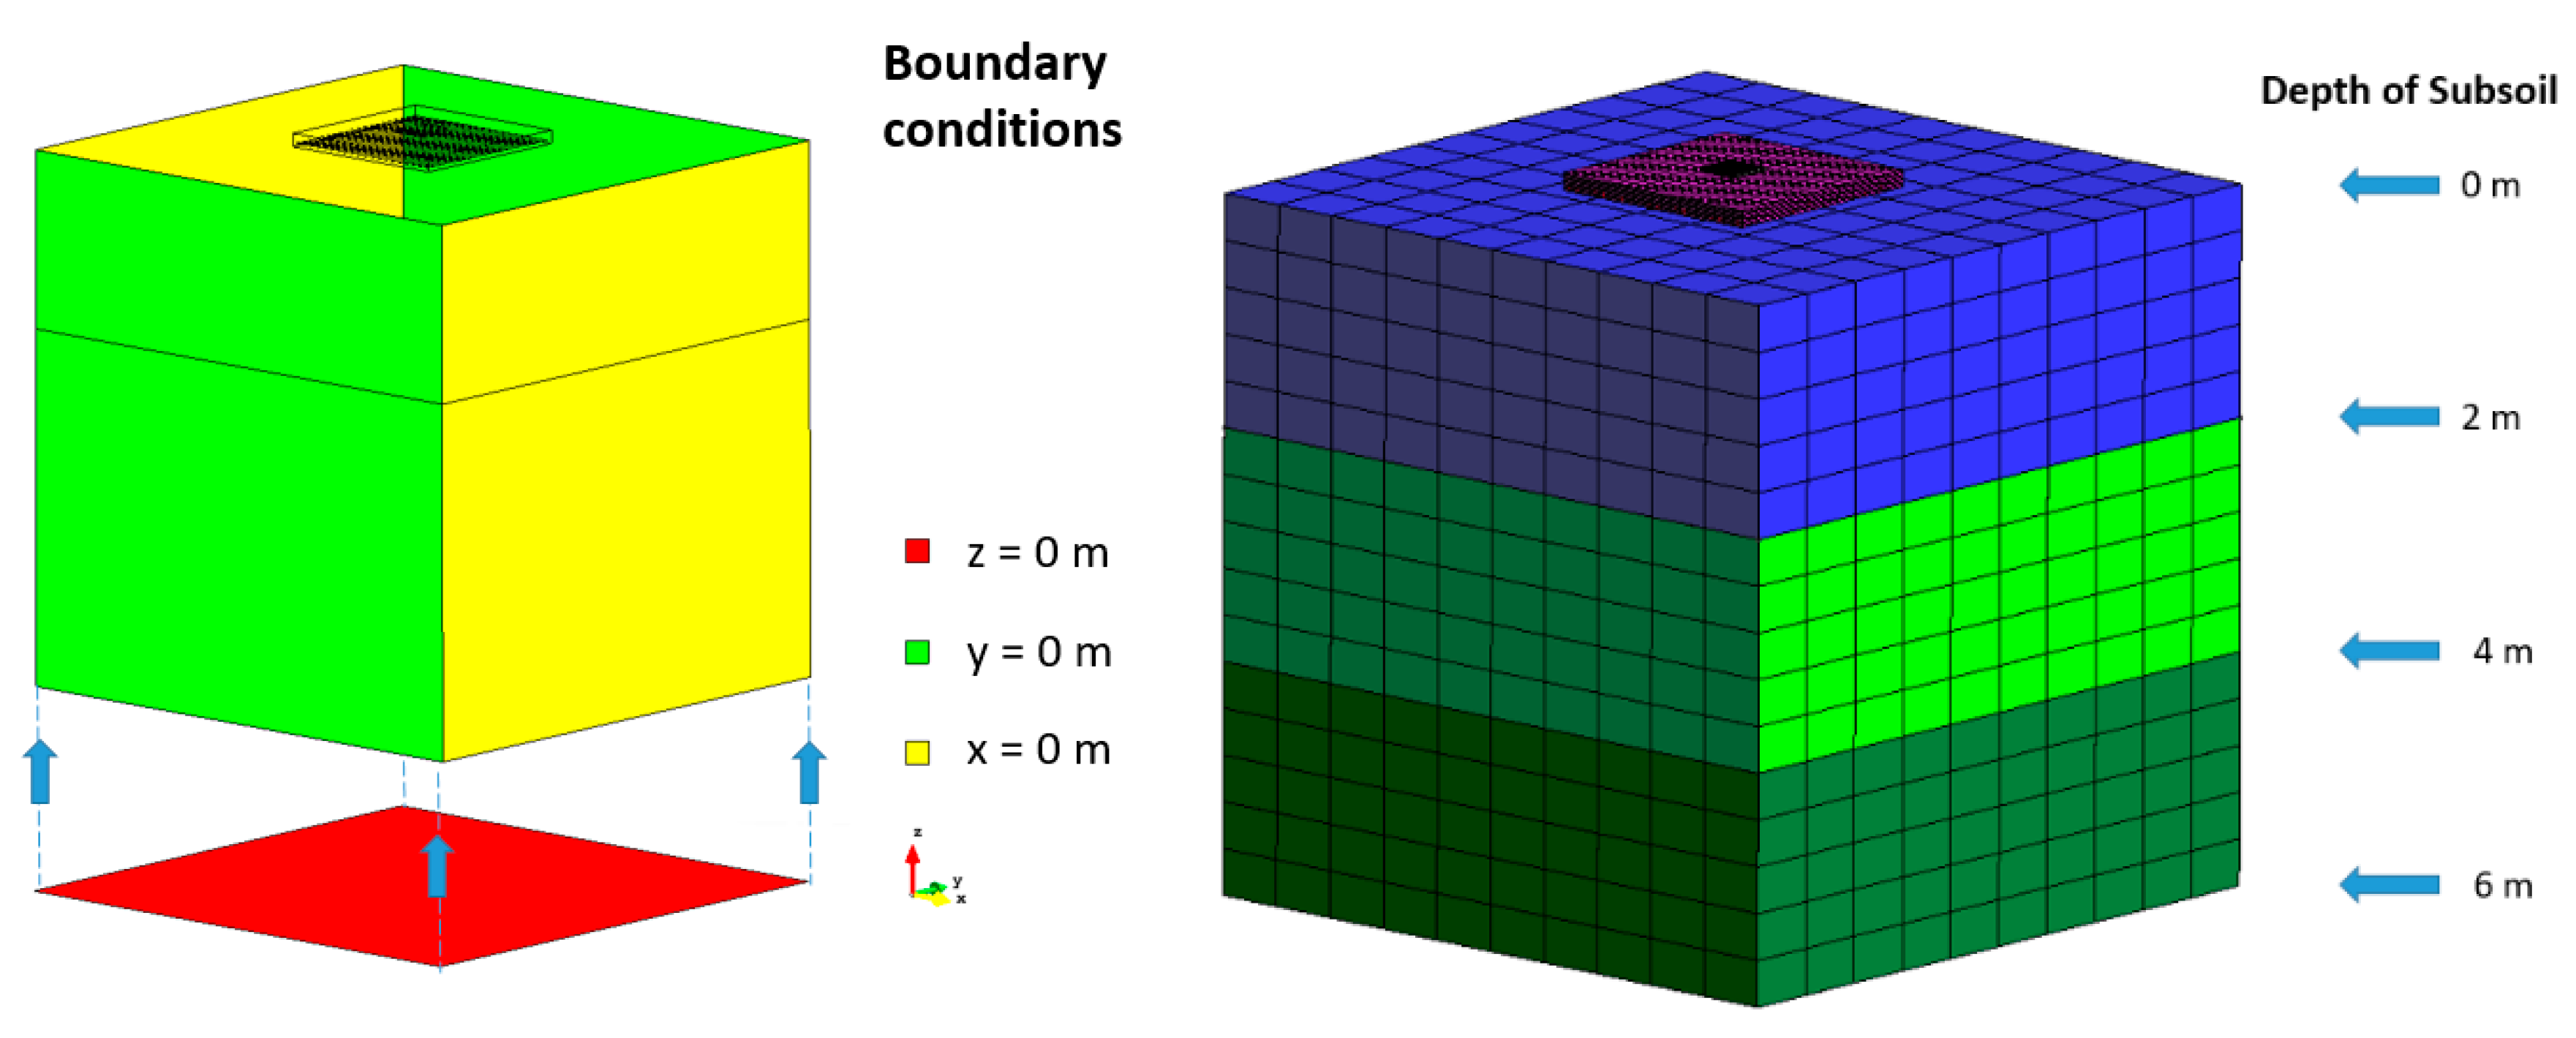
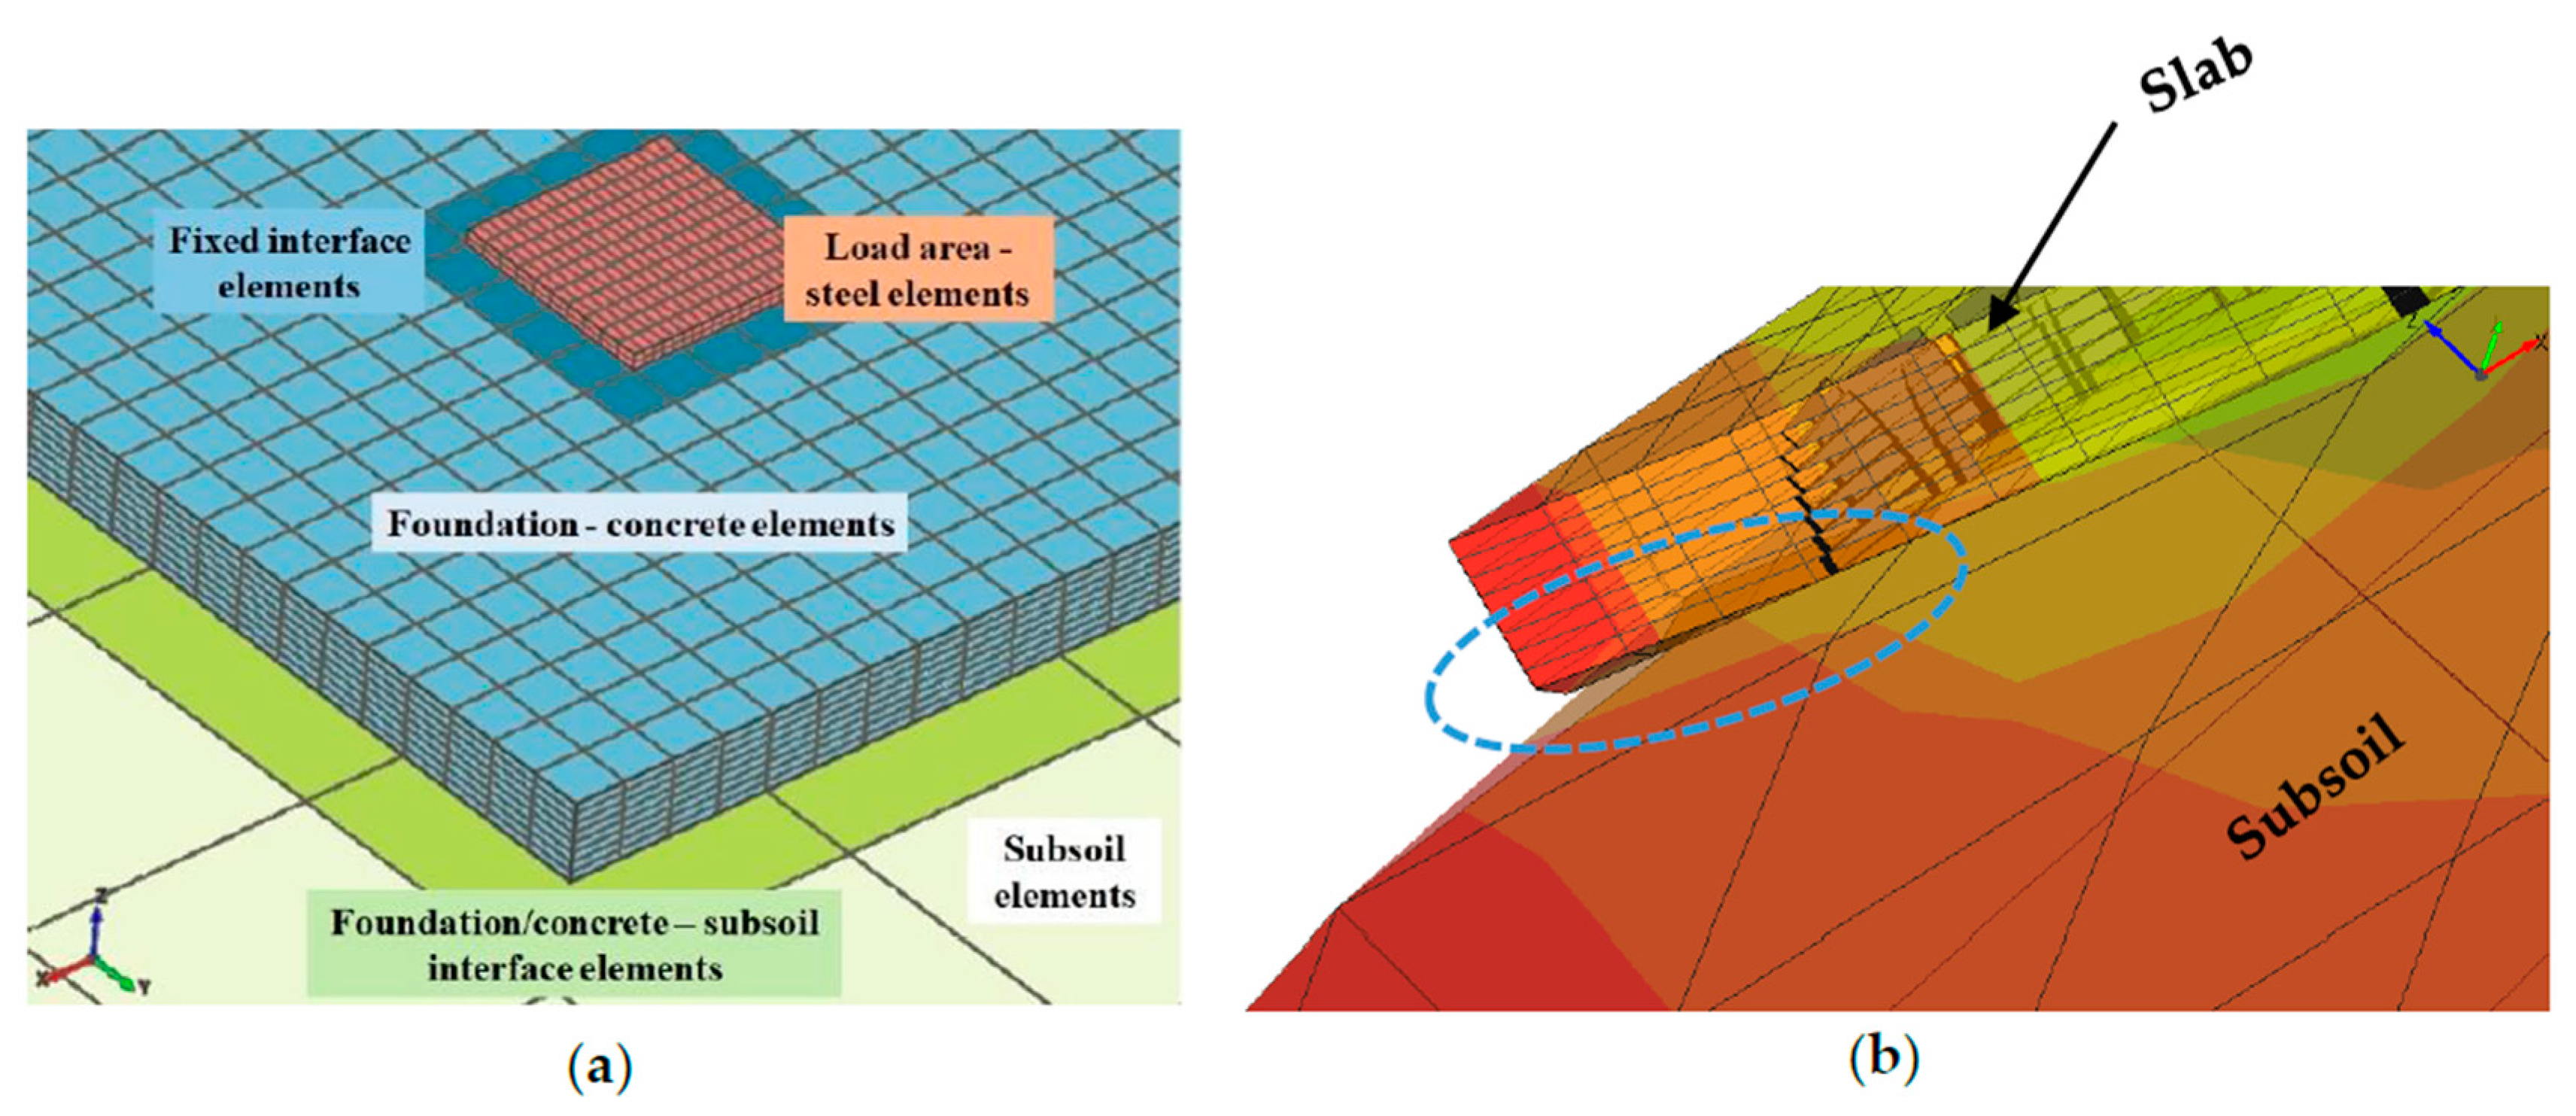
The study was based on a non-linear analysis involving a three-dimensional computational model with a steel loading plate, reinforced concrete slab, and subsoil. The calculations were conducted for a variable subsoil depth from 2 to 6 m and a subsoil deformation modulus from 12.5 to 32.5 MPa. The computational model had a regular mesh of finite elements. The computational model and boundary conditions are shown in Figure 7 and Figure 8.
The details of the finite element mesh are shown in Figure 8a. The area of the subsoil was 6 × 6 m. Concrete parameters were determined with respect to Model Code 2010 and the ATENA (Advanced Tool for Engineering Nonlinear Analysis) user manual [26]. For example, ref [73] also involves parametric studies on the influence of the input parameters of the computational model for this research task. In that analysis, the contact interface was modeled between the concrete slab and the subsoil, and the determination was based on recommendations and previous experience of slab testing. The actual parameters of the interface are variable when the experimental slab tests are performed in situ. In the analysis, the selected parameters (for example, stiffness Knn and Ktt) were also chosen with respect to the numerical stability of the calculation. The interface parameters will significantly influence the calculation for the case of horizontal loading when this is a separate research task, as shown and experimentally solved in [74]. The functionality of the interface itself is illustrated in Figure 8b, in which the lifting of the corners of the slab can be seen. In real conditions, this is atypical because the foundations (floors) are below ground level and the free space would be filled with soil. The parameters of the contact interface are given in Table 1.

2.3. Result of Parametric Study

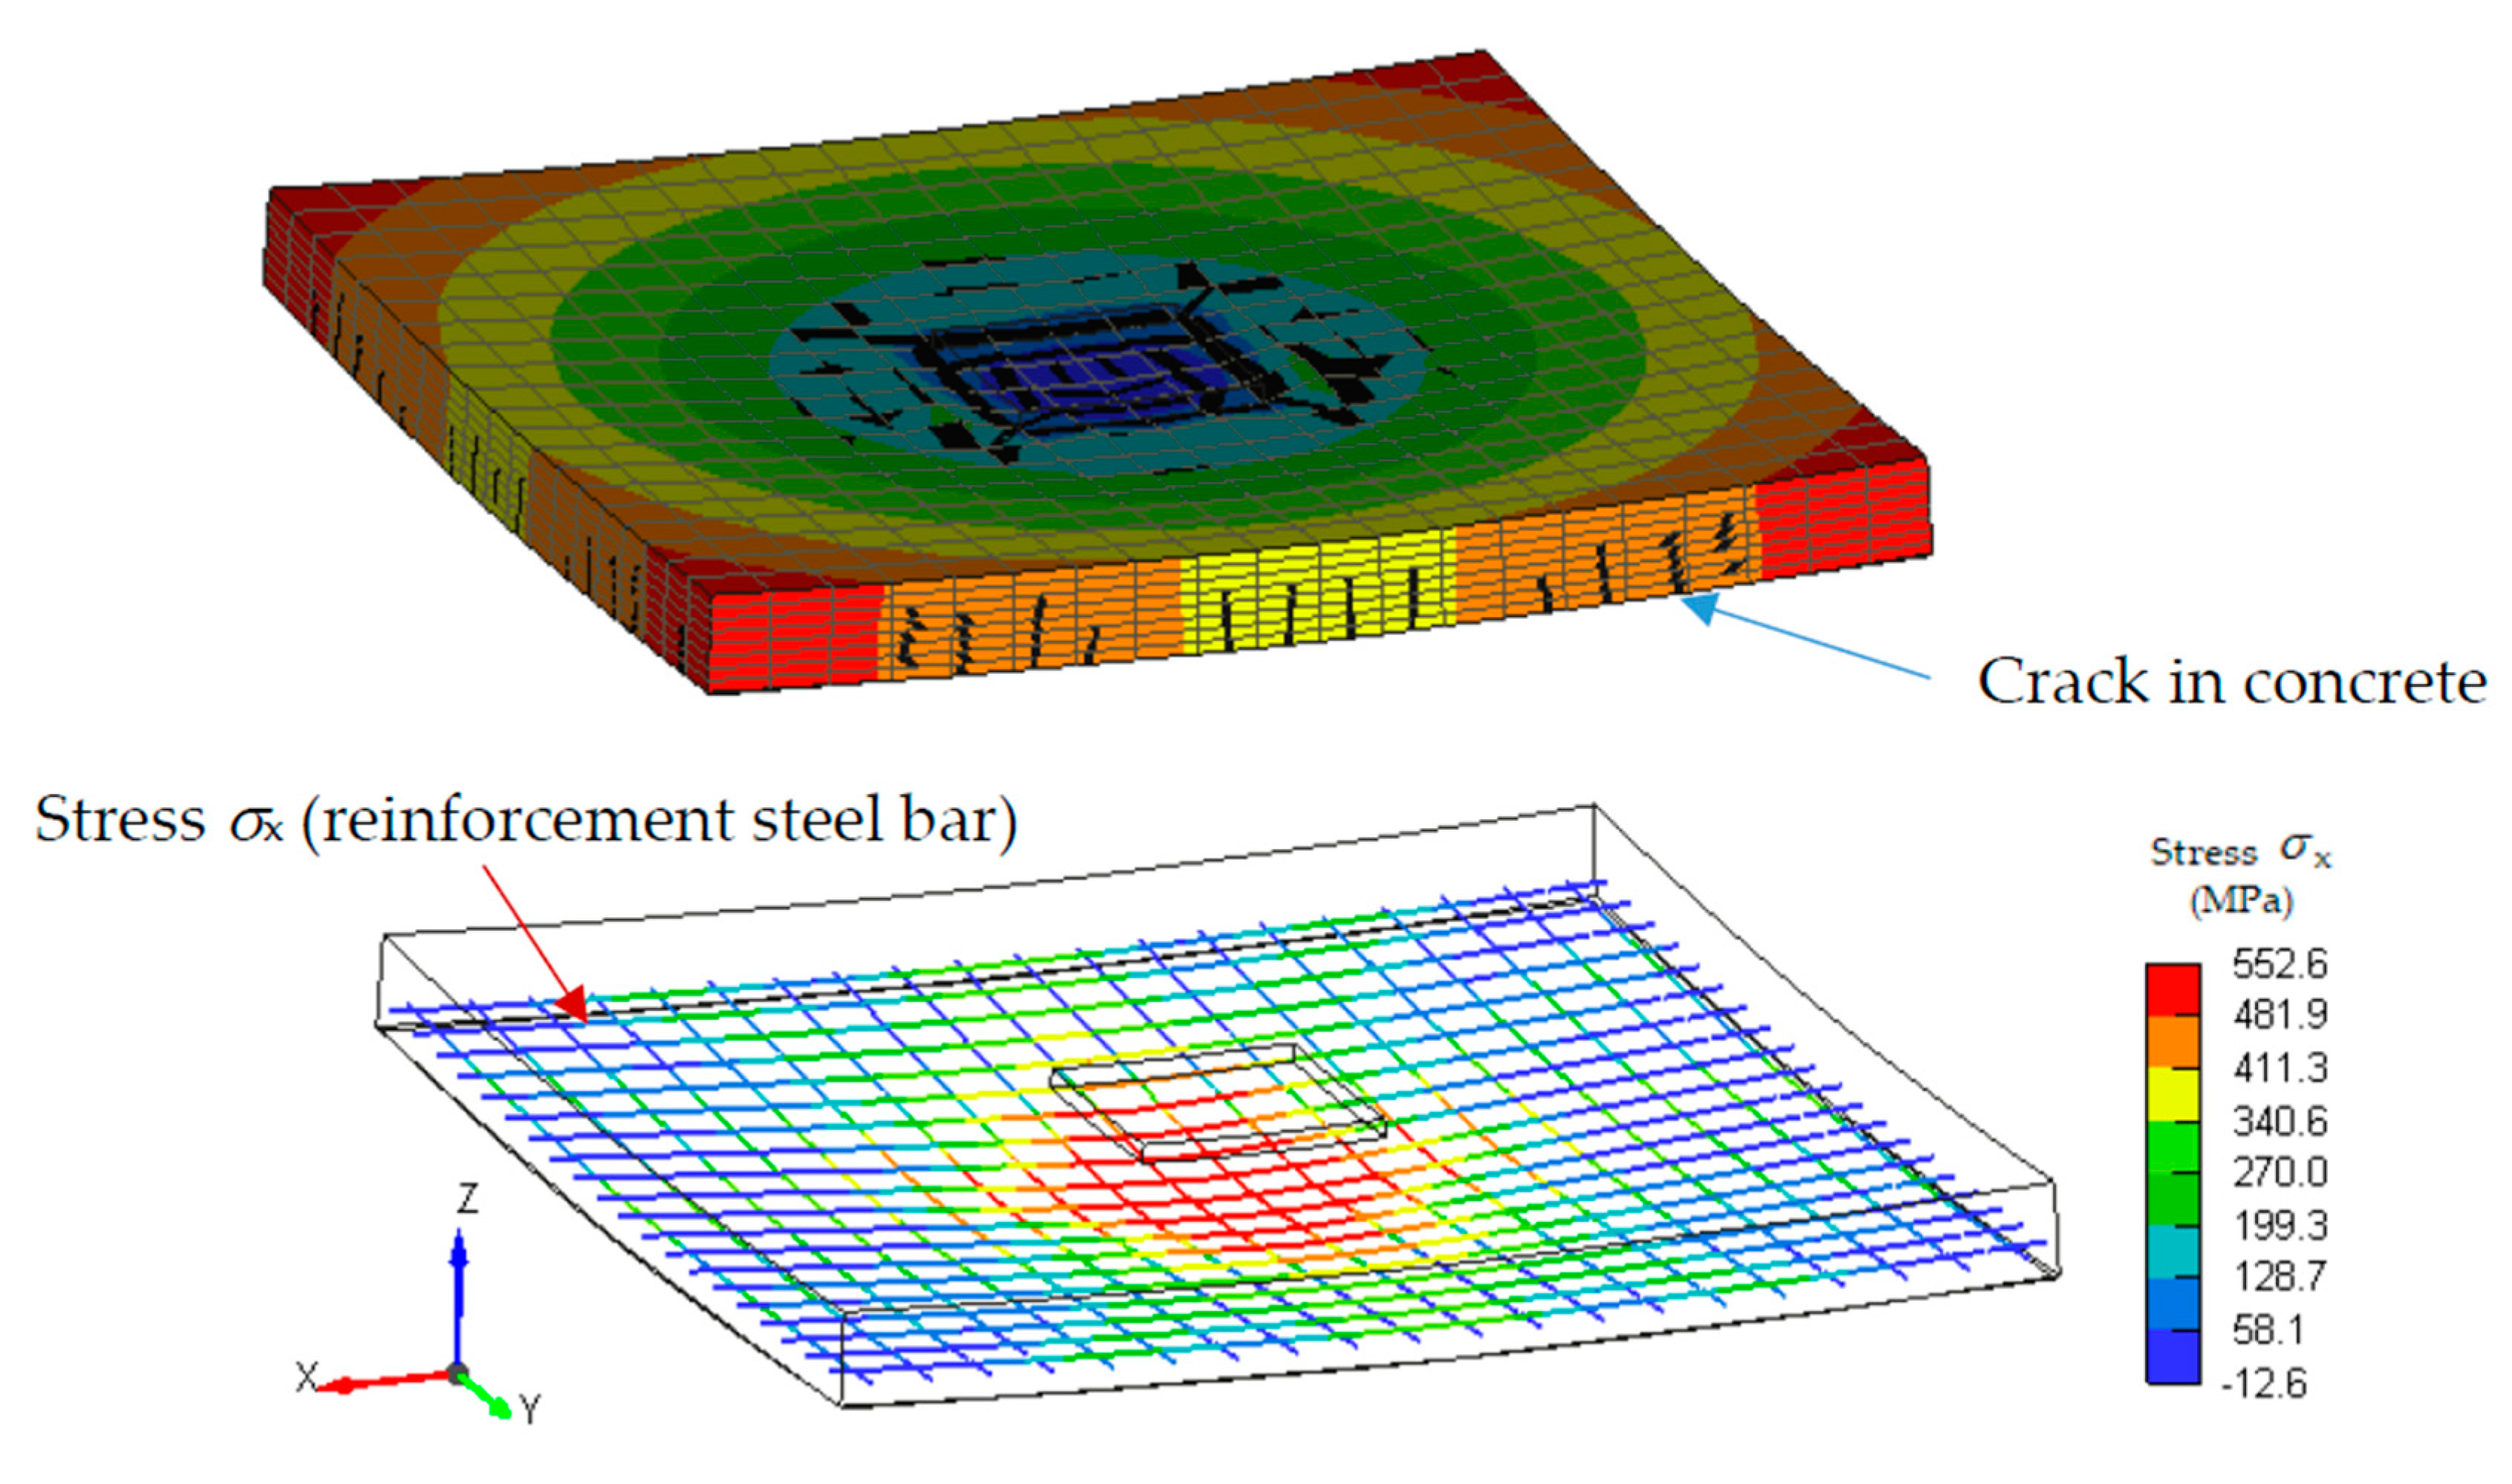
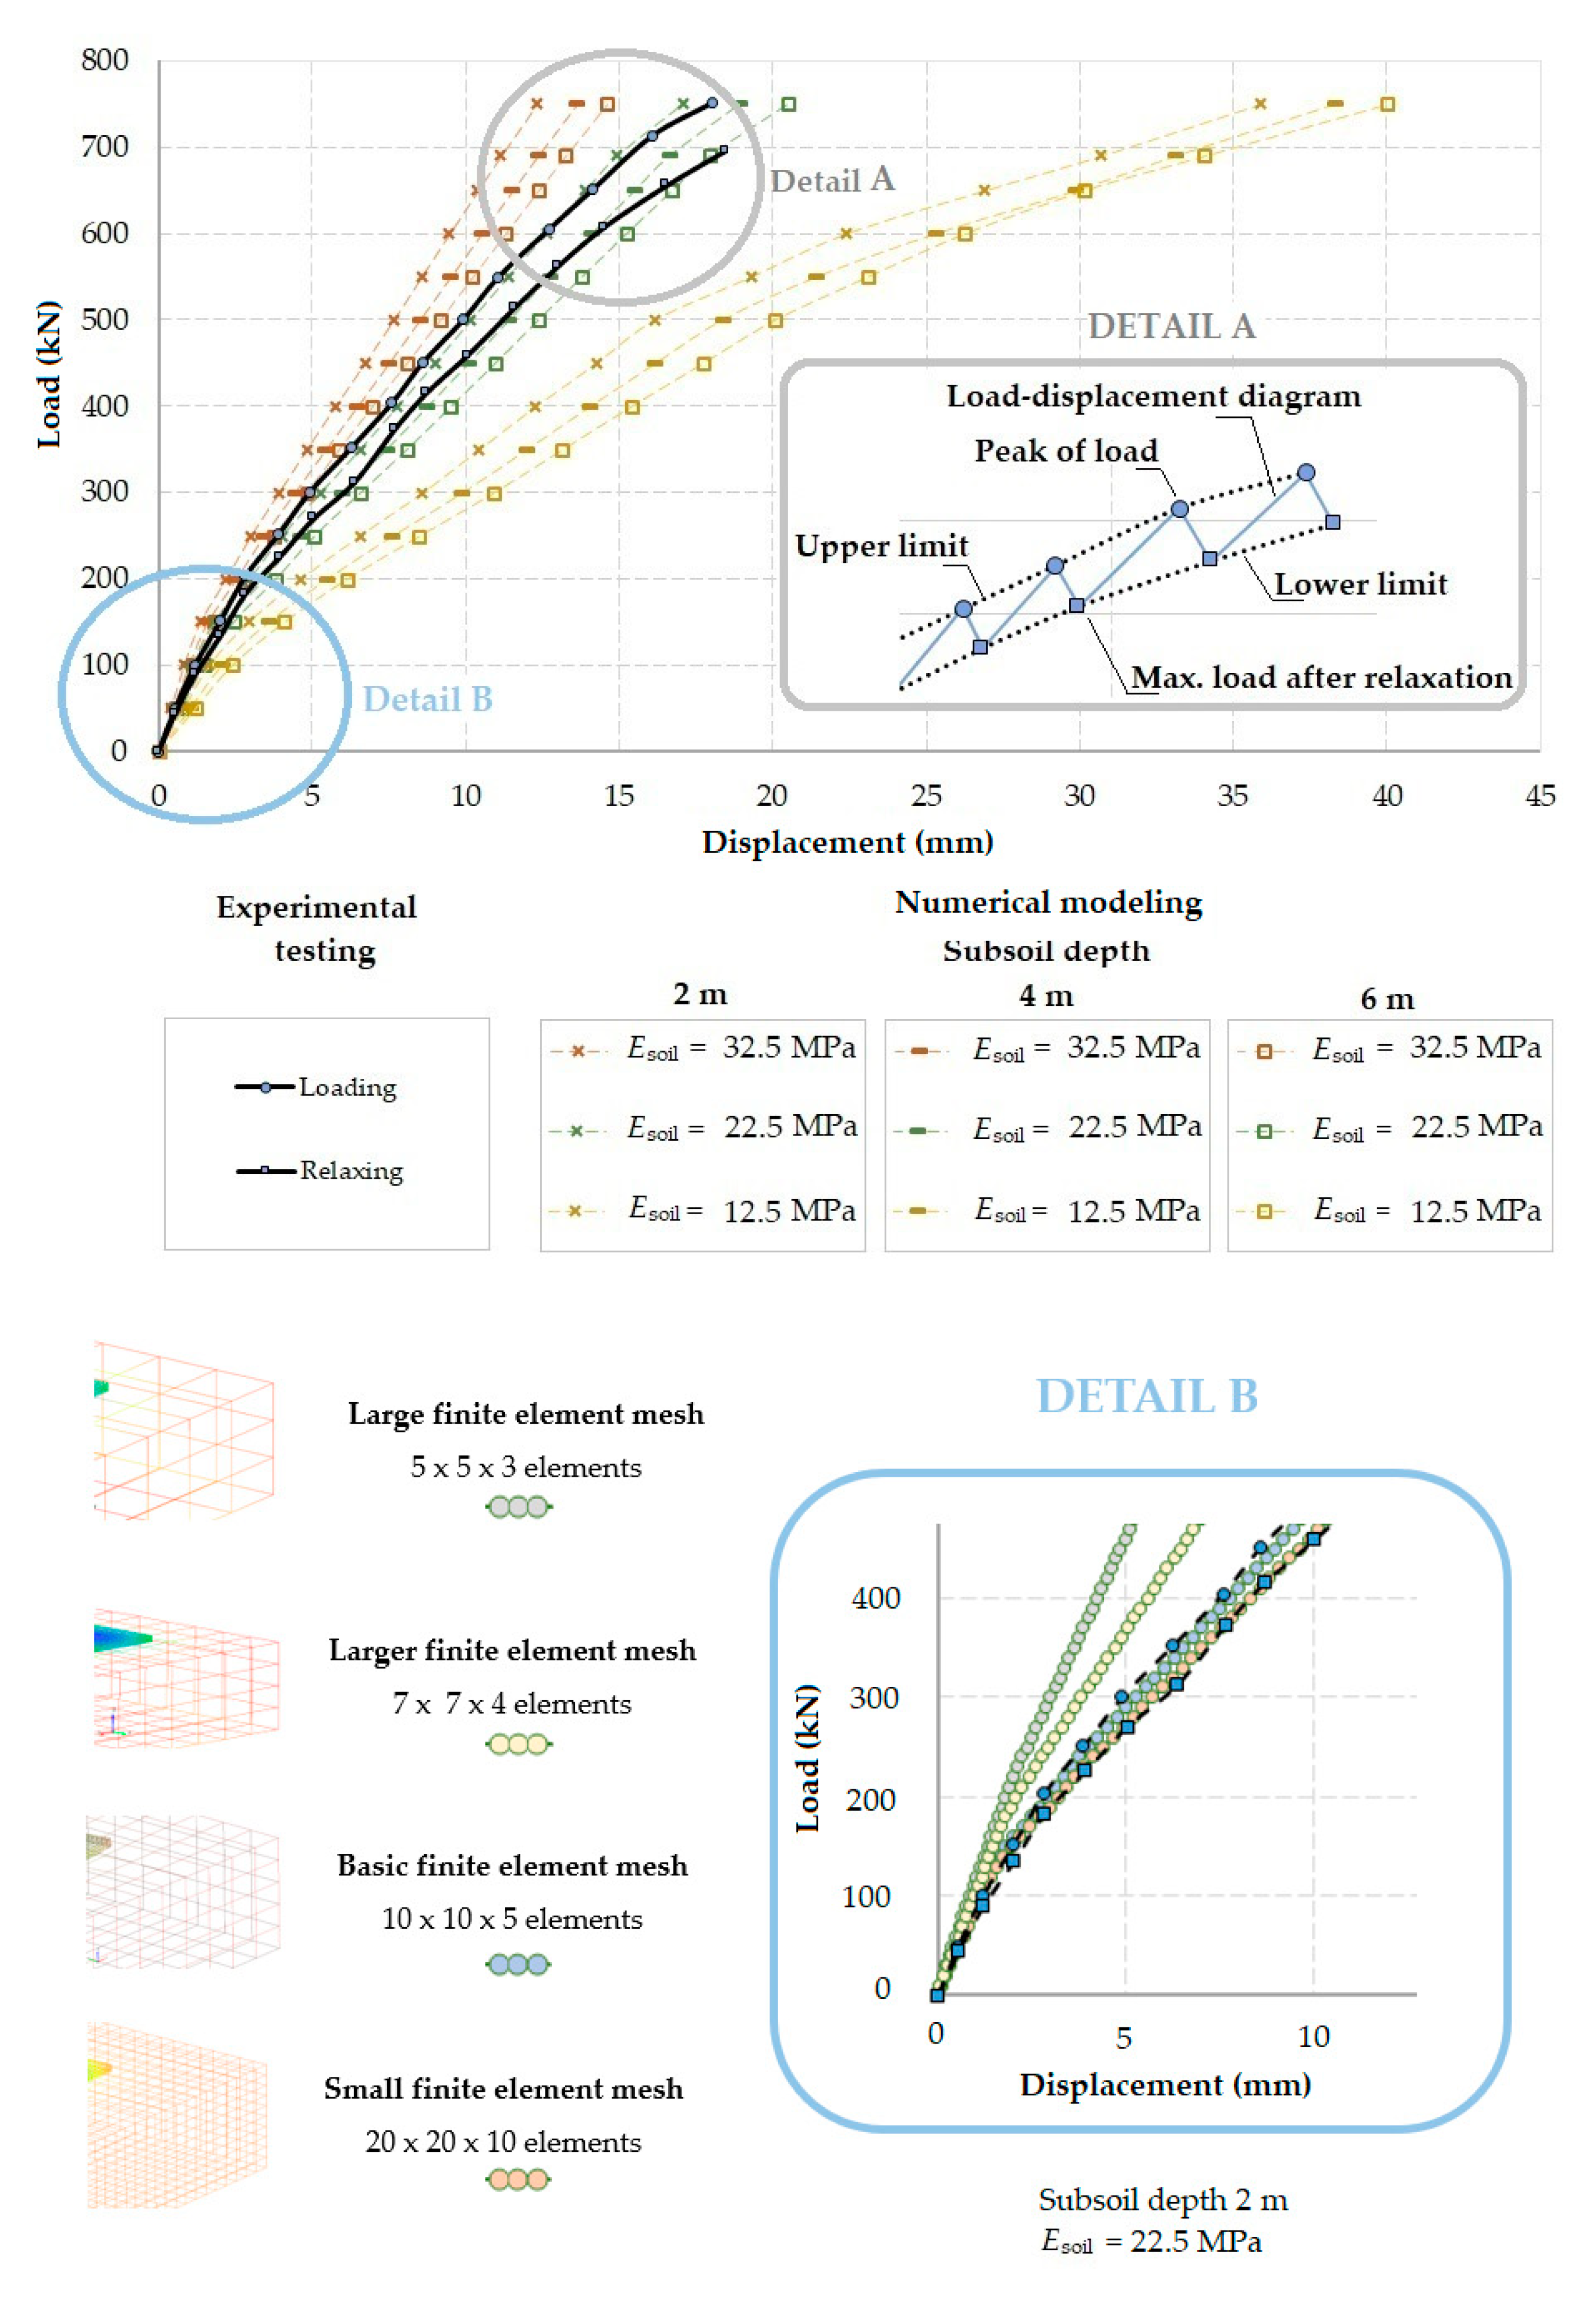
Table 2 shows the deformations for variants of the calculation used in the numerical models, which have different subsoil deformation modulus and different subsoil depths. The results in Table 2 show a greater influence on deformations when varying the subsoil deformation modulus than when varying the subsoil depth. The computed deformations are significantly smaller when the deformation modulus of the subsoil increases. The resulting deformations for a load of 300 kN are in the range of 3.92 to 10.91 mm. For a load of 750 kN, the difference is even more pronounced from 12.32 to 40.02 mm. There is an evident influence of the crack development in the concrete and a reduction in the bending stiffness of the concrete slab. Figure 9 shows the graphical output of crack occurrence and stresses in reinforcement.
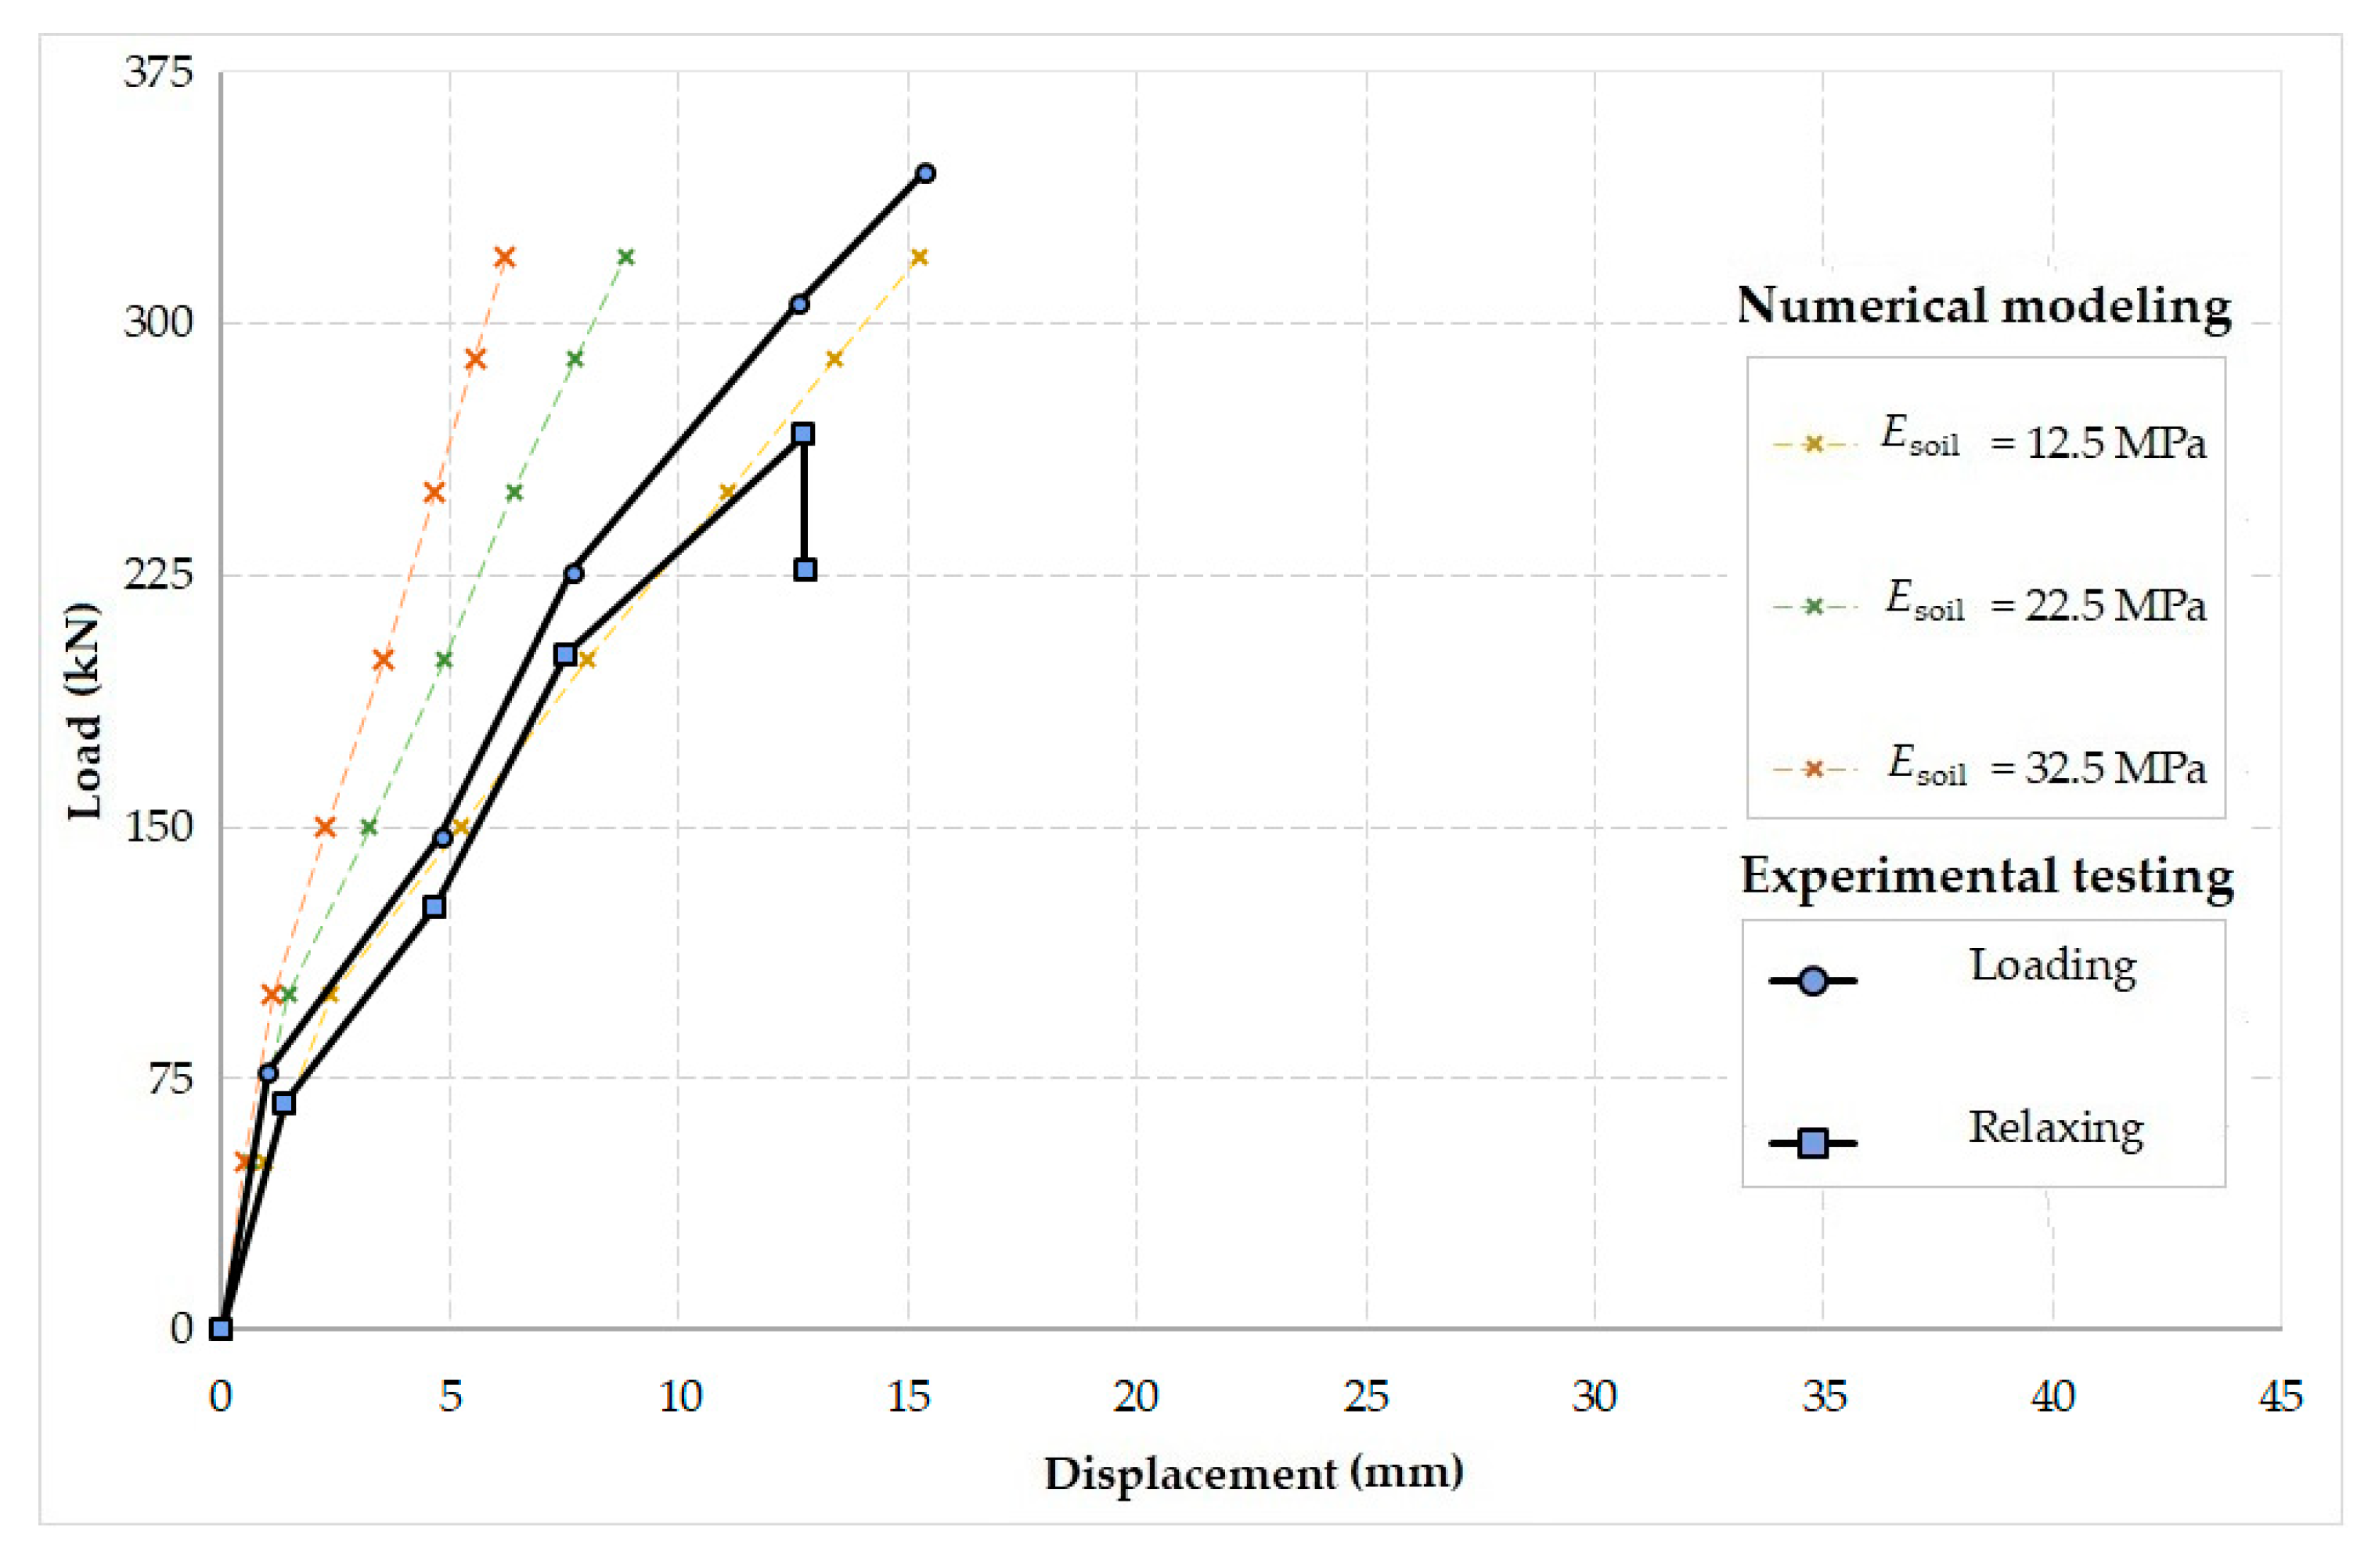
The load–displacement diagram can be used for evaluation and comparison. The resulting load–displacement diagrams for the numerical model and experiment are shown in Figure 10. The horizontal axis in Figure 10 shows the displacements in the center of the slab, which were determined based on the approximation of the three-dimensional deformation surface of the slab (see Figure 6). Approximation of the three-dimensional deformation surface was performed on the basis of 16 points (sensors), where the displacements were experimentally measured. The scheme of mounted sensors on the slab is given in [72]. The difference between the influence of the subsoil depth and the subsoil deformation modulus is clearly visible in Figure 10. From the performed parametric study for different sizes of finite elements of the subsoil, it is evident that in the area of the initial (linear) loading steps, the differences in the size of the finite elements are relatively small. After first formatting the cracks in the concrete, the influence of the subsoil and its finite element size increase. The variants for large and larger finite elements are illustrative only and also confirm that the coarser finite element mesh is stiffer. The difference between the deformation results for the basic and small finite element variants is already small. However, when using the small variant, the computational complexity increases to 168%, compared with the basic variant. The basic finite element mesh was used for further calculations.

3. Fiber-Reinforced Concrete Slabs

3.1. Experiments

The experiments included the testing of four concrete slabs of the same size. The nominal dimensions of the slabs were 2000 × 2000 × 150 mm. The load was applied using a steel plate measuring 400 × 400 mm. The slabs had different fiber dosages, where fibers of the same type were used for all slabs: steel 3D fibers (DRAMIX 65/60BG) [75]. The concrete recipe was specified in [76]. The experiments were performed using a specialized test machine (support frame), as shown in Figure 2.
Prior to the experimental load tests, geotechnical tests were performed, which served to obtain the material properties of the homogenized subsoil. The soil was classified as Cl, clay with medium plasticity [76]. The deformation modulus of the subsoil (12.5 MPa) was obtained from the static load test, which was used as an input value for the numerical analyses. The subsoil cohesion value (c = 9.0 kPa) and the angle of internal friction (φ = 19.3°) were determined by a box shear test.
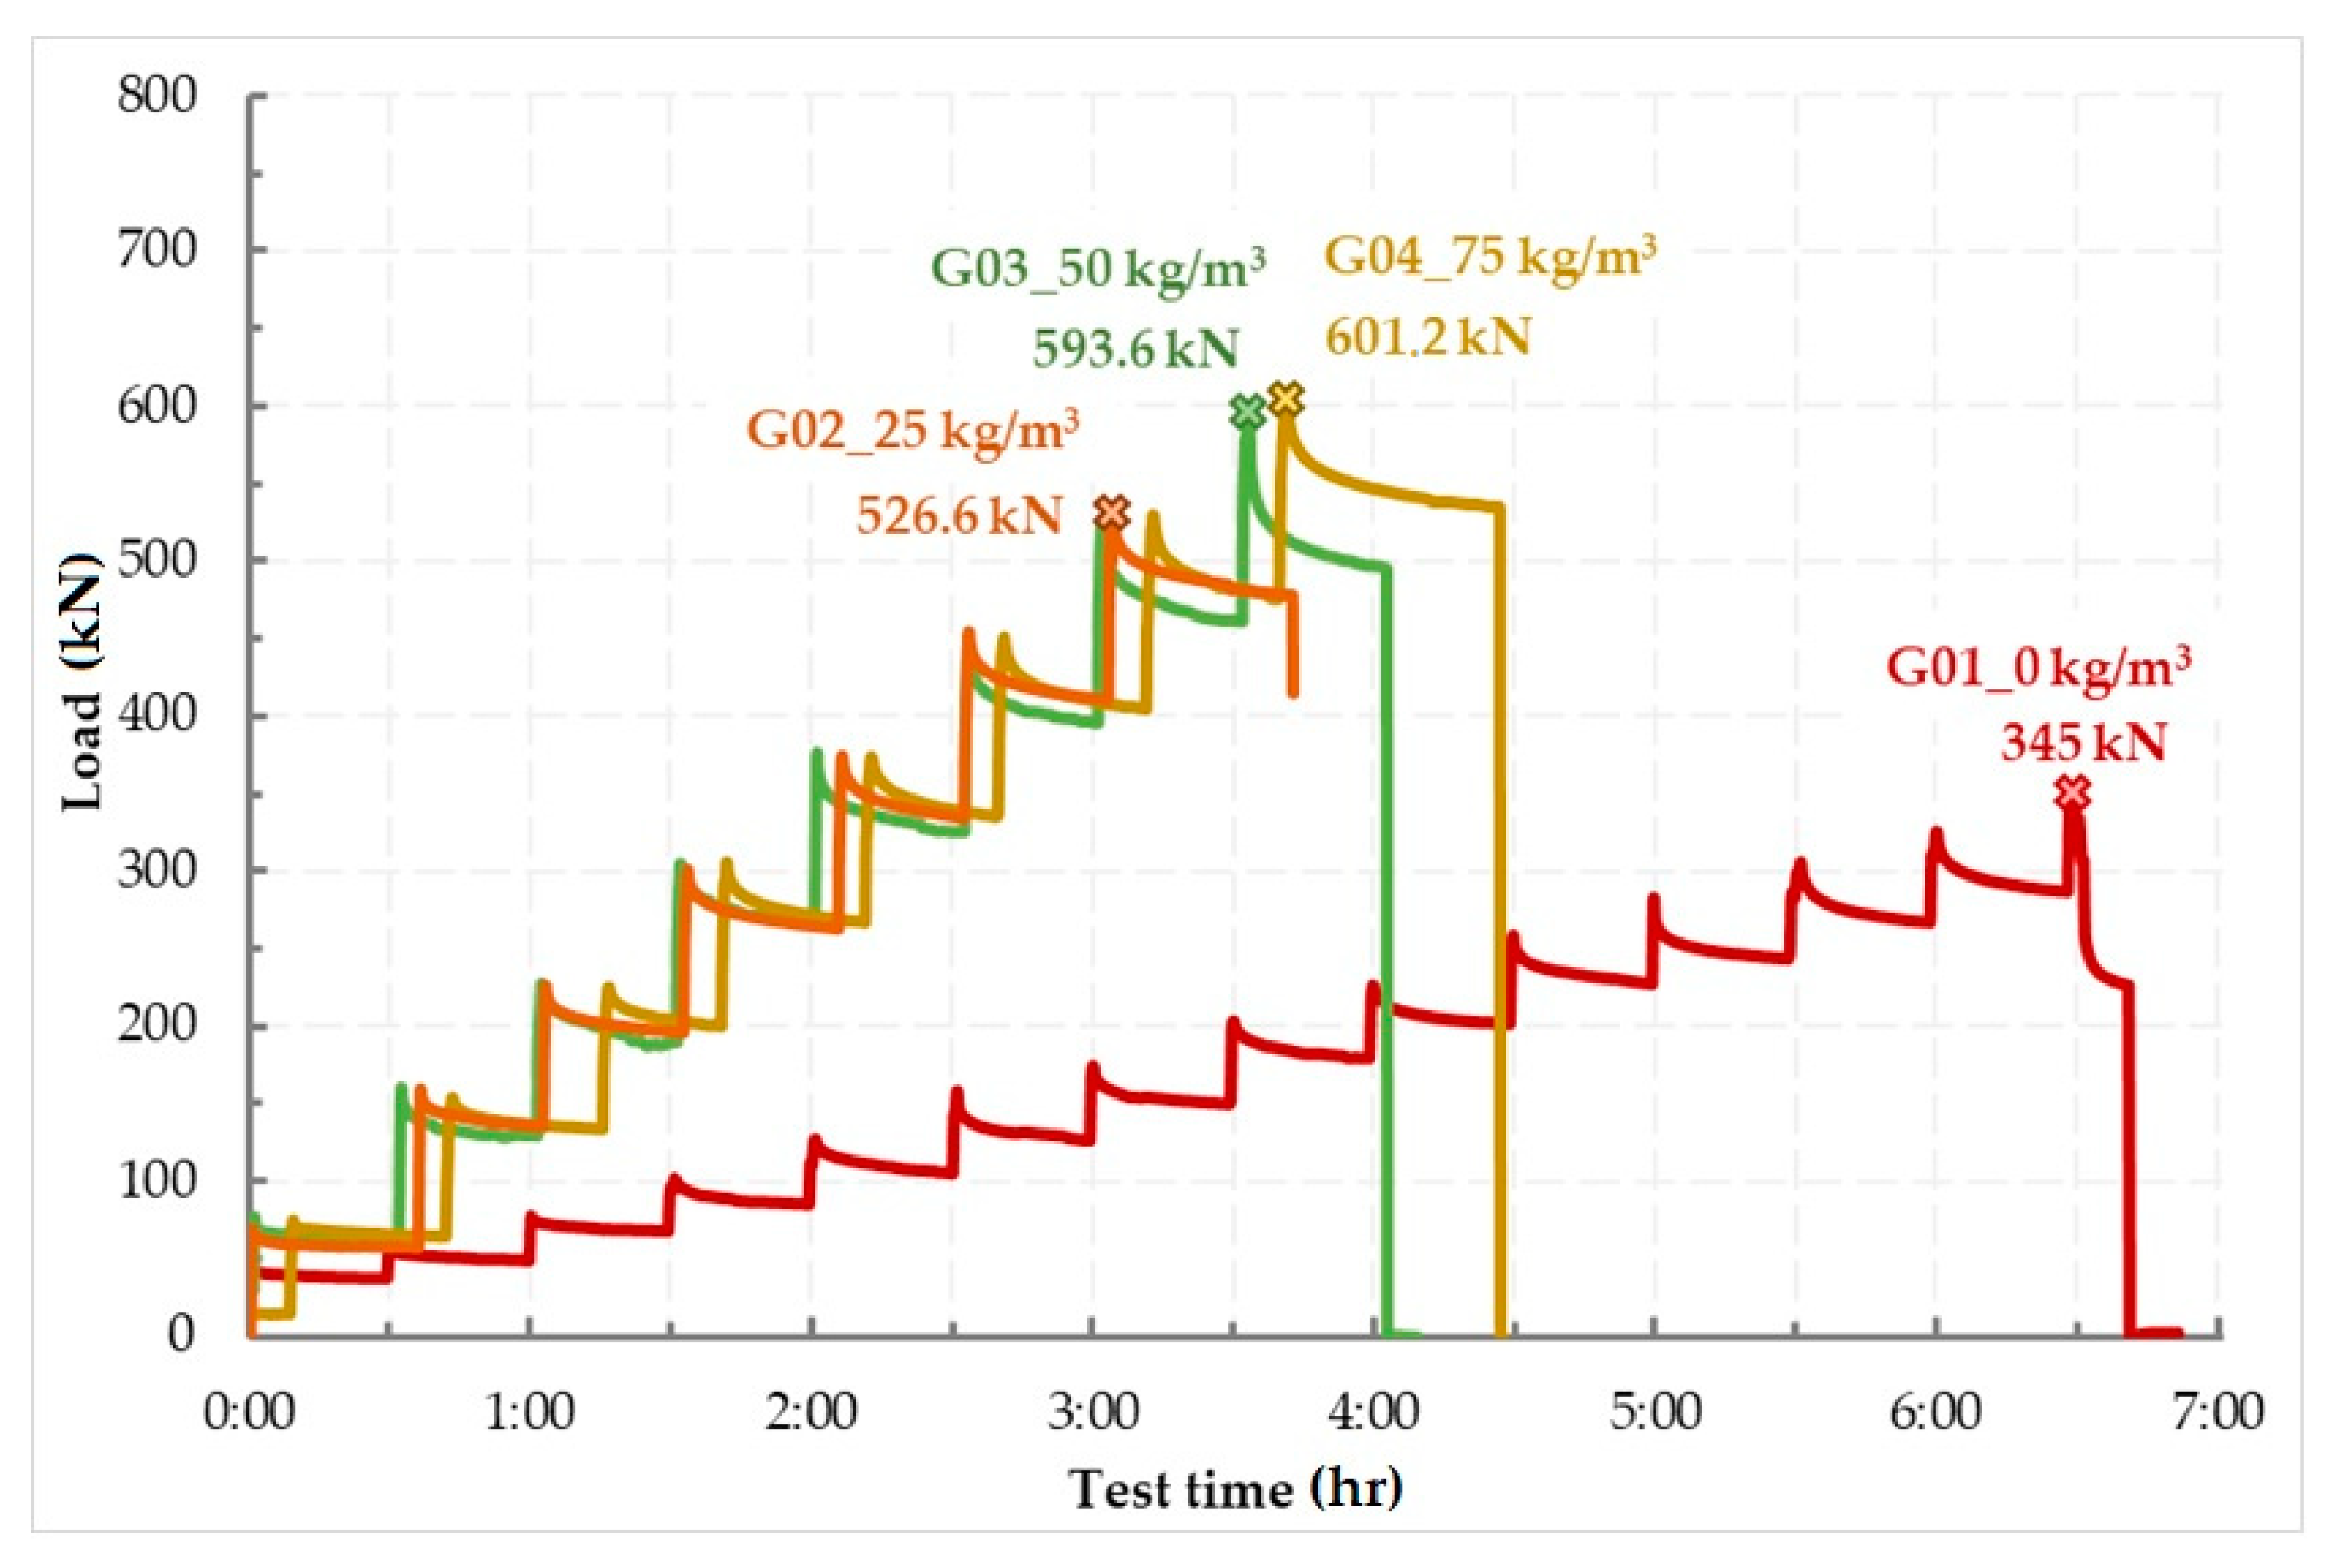
Slab G01 did not contain fibers, that is, it had a fiber dosage of 0 kg/m3. Slab G02 was made of fiber-reinforced concrete with a fiber dosage of 25 kg/m3. Slab G03 had a fiber dosage of 50 kg/m3 and slab G04 had a fiber dosage of 75 kg/m3. The load-bearing capacity of the slabs was assumed to be the load at which deformation increased, and therefore the pressure in the hydraulic cylinder decreased rapidly (see Figure 11).
Slabs G02, G03, and G04 were loaded in loading steps of 75 kN/30 min. Slab G01 was made of standard concrete; therefore, smaller loading steps were chosen during loading, that is, 25 kN/30 min. The size of the loading steps can also be seen in Figure 11.
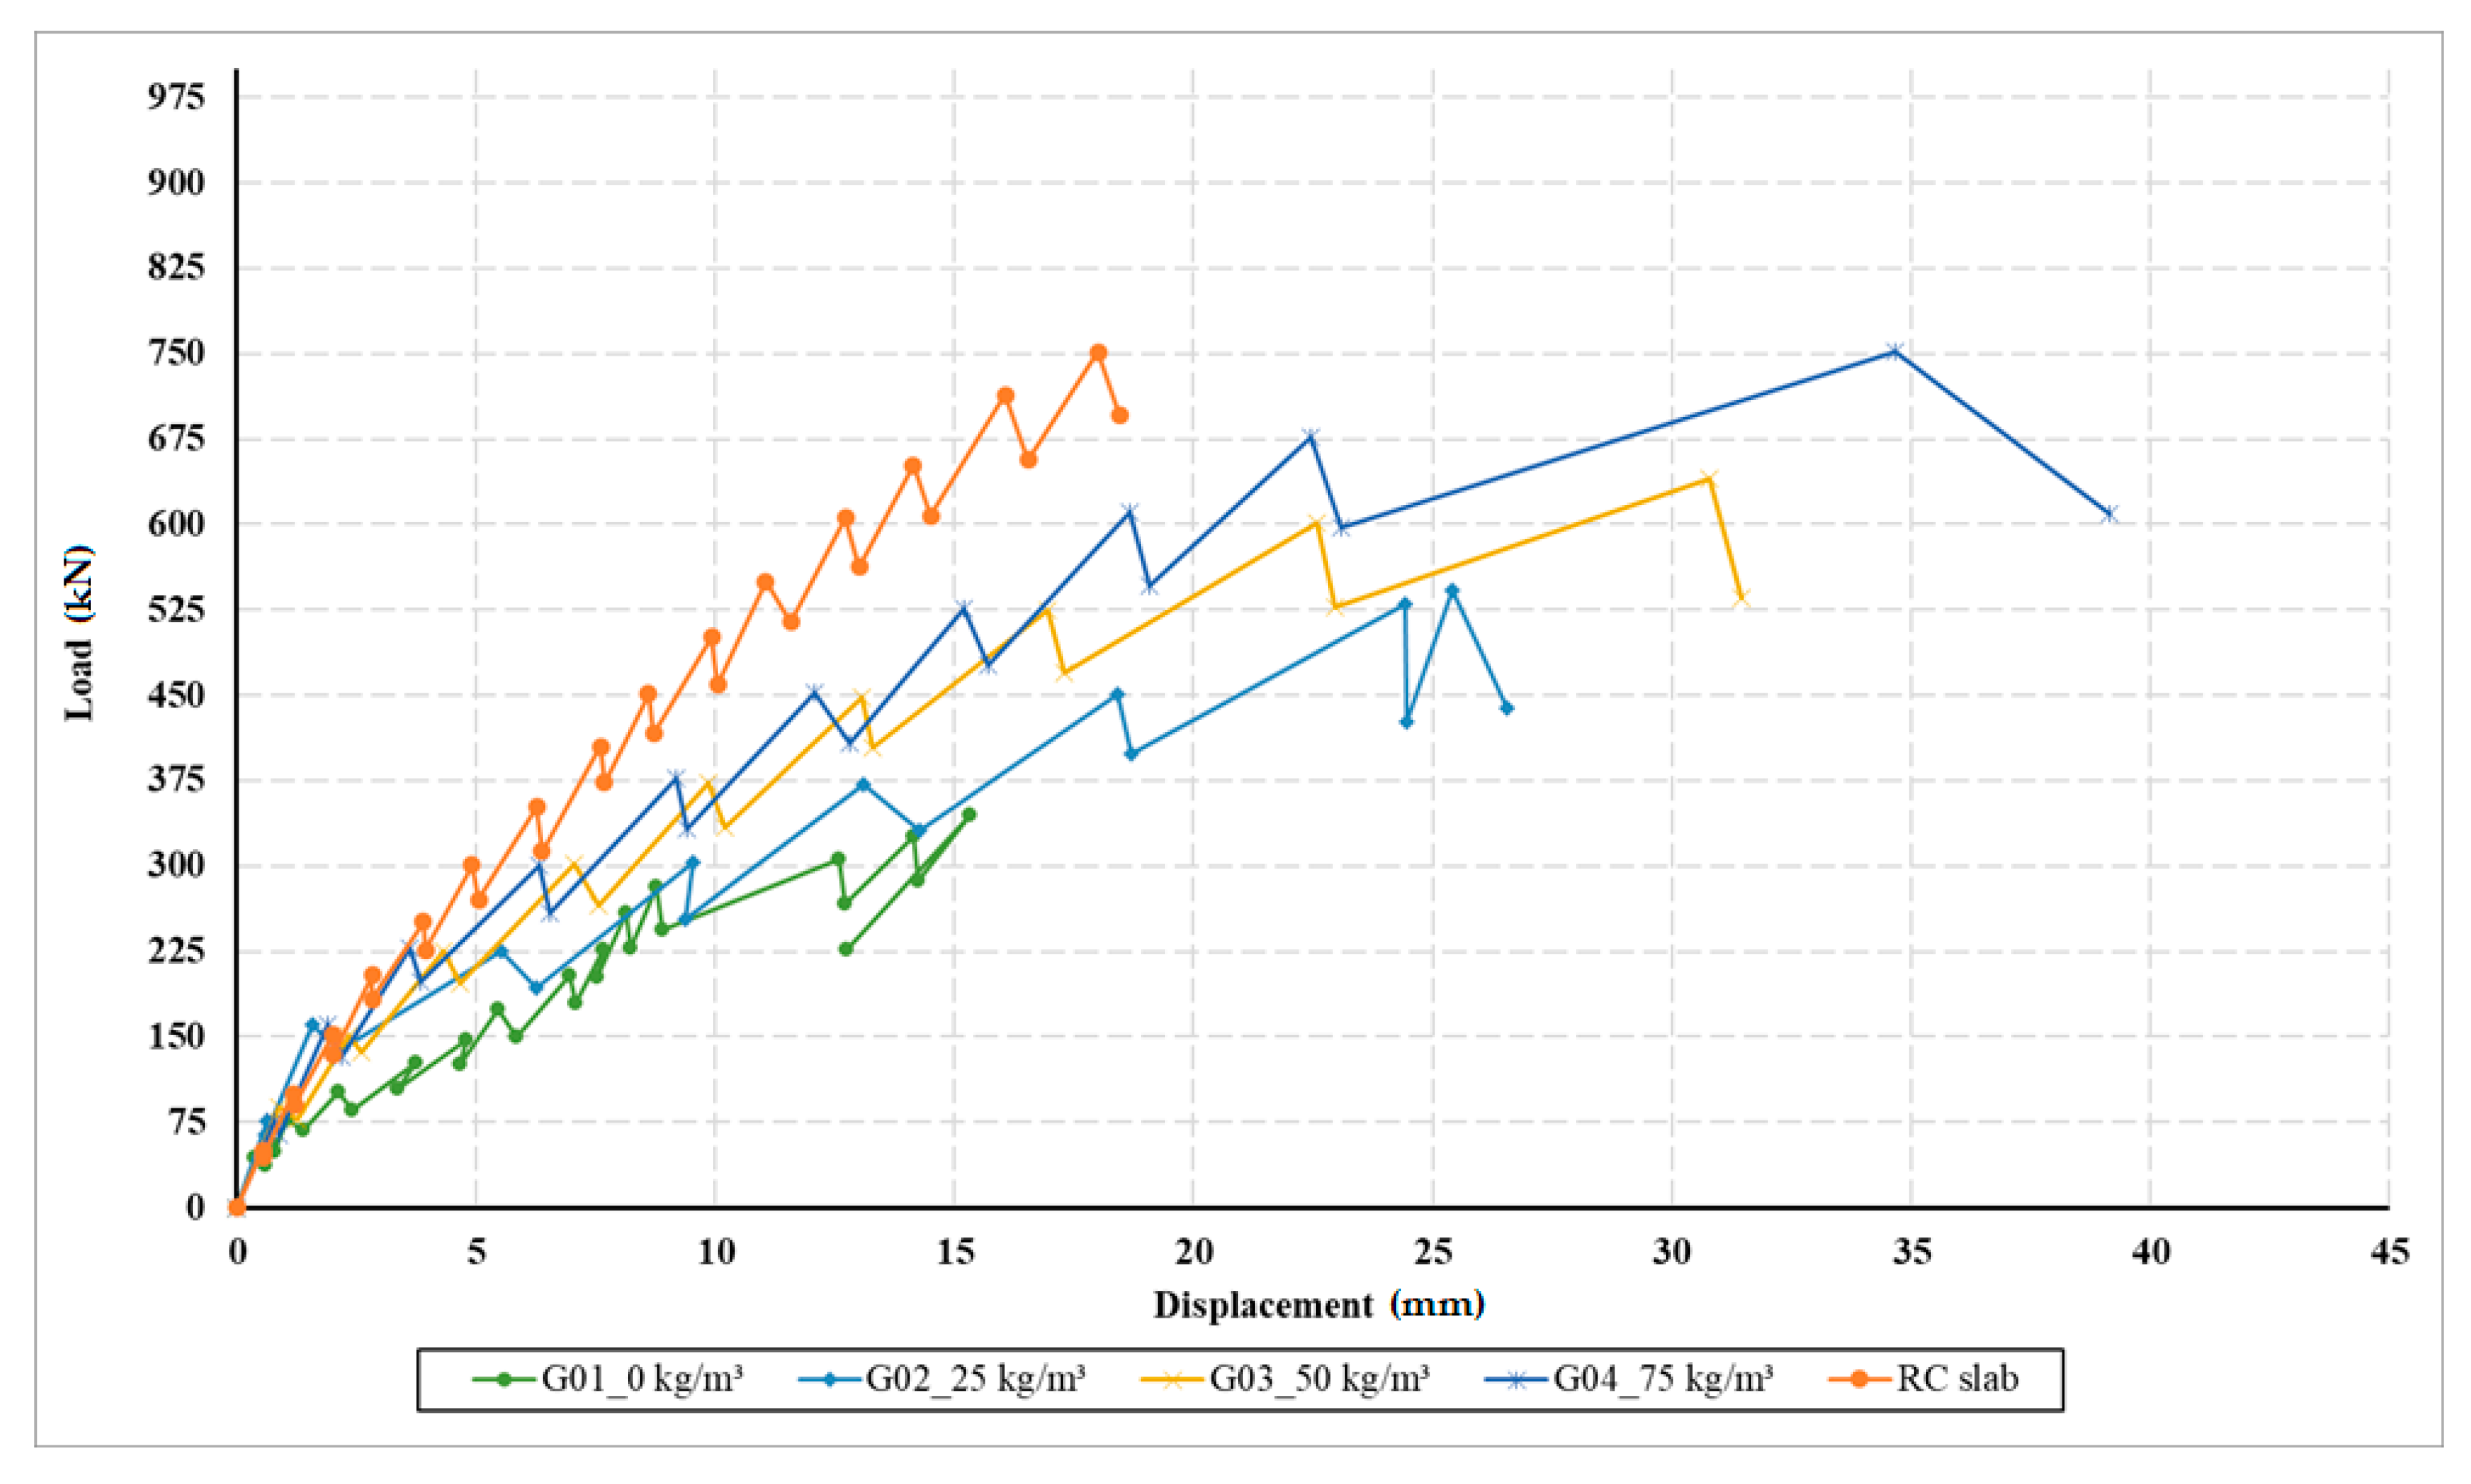
The peak load at the time of failure of slab G01 was 345 kN (see Figure 12). The load-bearing capacity of slab G02 was 542 kN, slab G03 was 640 kN, and slab G04 was 752 kN. The load–displacement diagrams show the noticeable effects of the fiber dosage on the overall load-bearing capacity of the fiber-reinforced concrete slabs.
The effect of the fibers and comparison of two slabs after reaching their load-bearing capacity is shown in Figure 13: The first was slab G01 (without fibers) and the second was slab G04 (fiber dosage of 75 kg/m3). At first glance, we can see the complete destruction of slab G01 after reaching its load-bearing capacity. In the case of slab G04, the positive effect of the fibers can be observed; the slab remained compact even after reaching the load-bearing capacity, in comparison with slab G01.
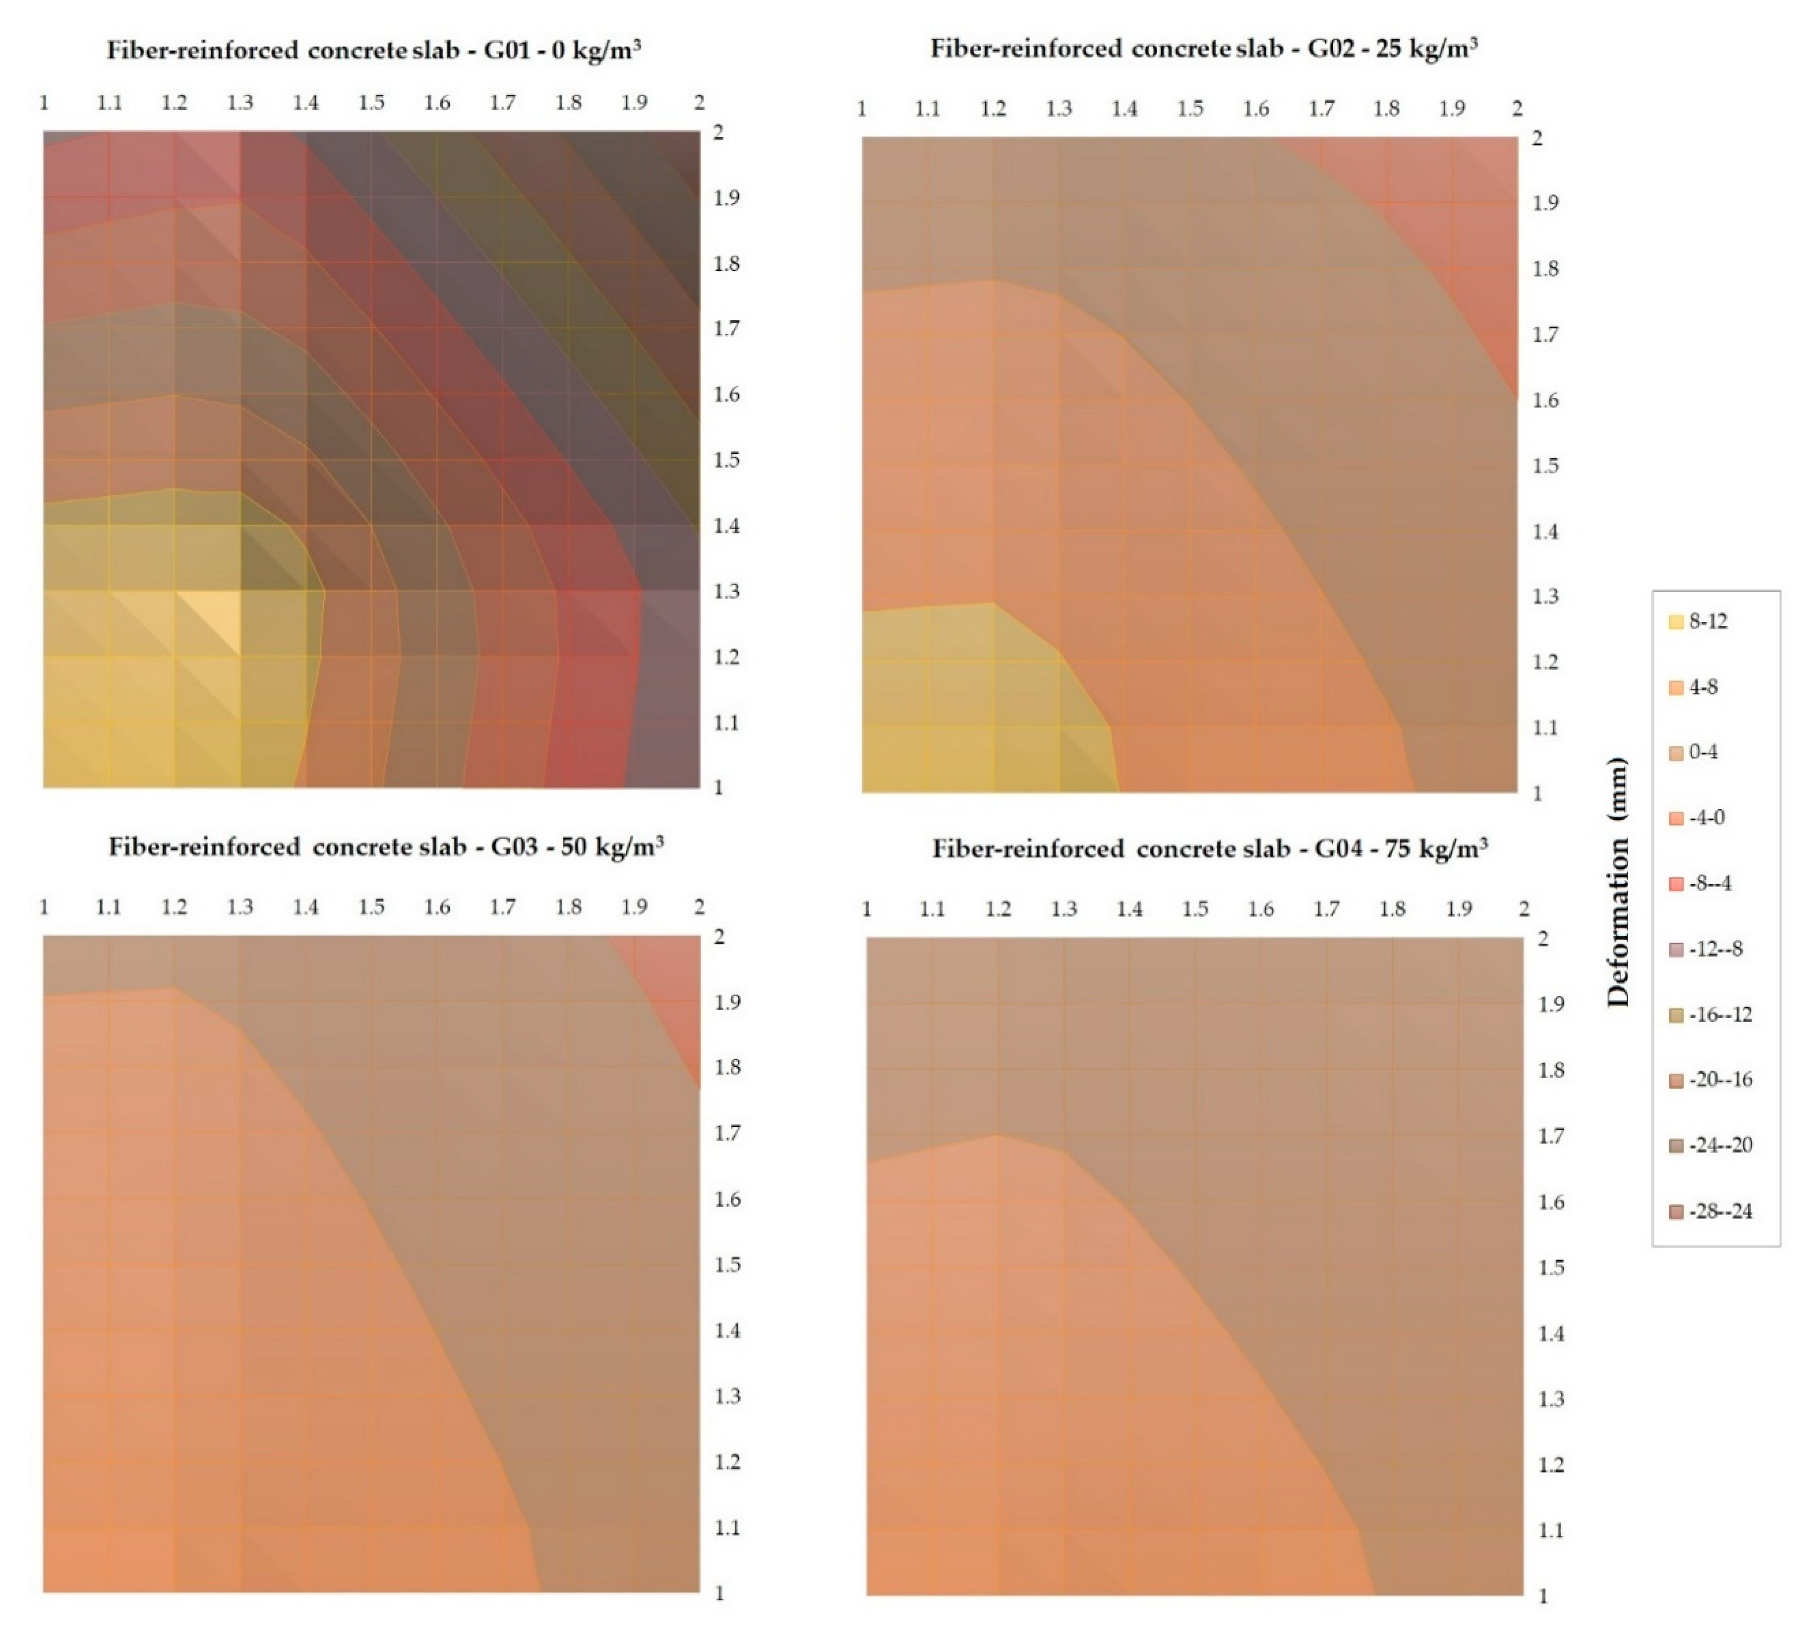
The data from the sensors can be evaluated using two-dimensional graphs or three-dimensional deformation of slabs using contour lines. A variant of the three-dimensional deformation for a load step of 300 kN was processed and is shown for one-quarter of each slab in Figure 14. The lower left edge of each image indicates the center of the slab. Data from the three-dimensional deformation were then used for the load–displacement diagrams in Figure 15.
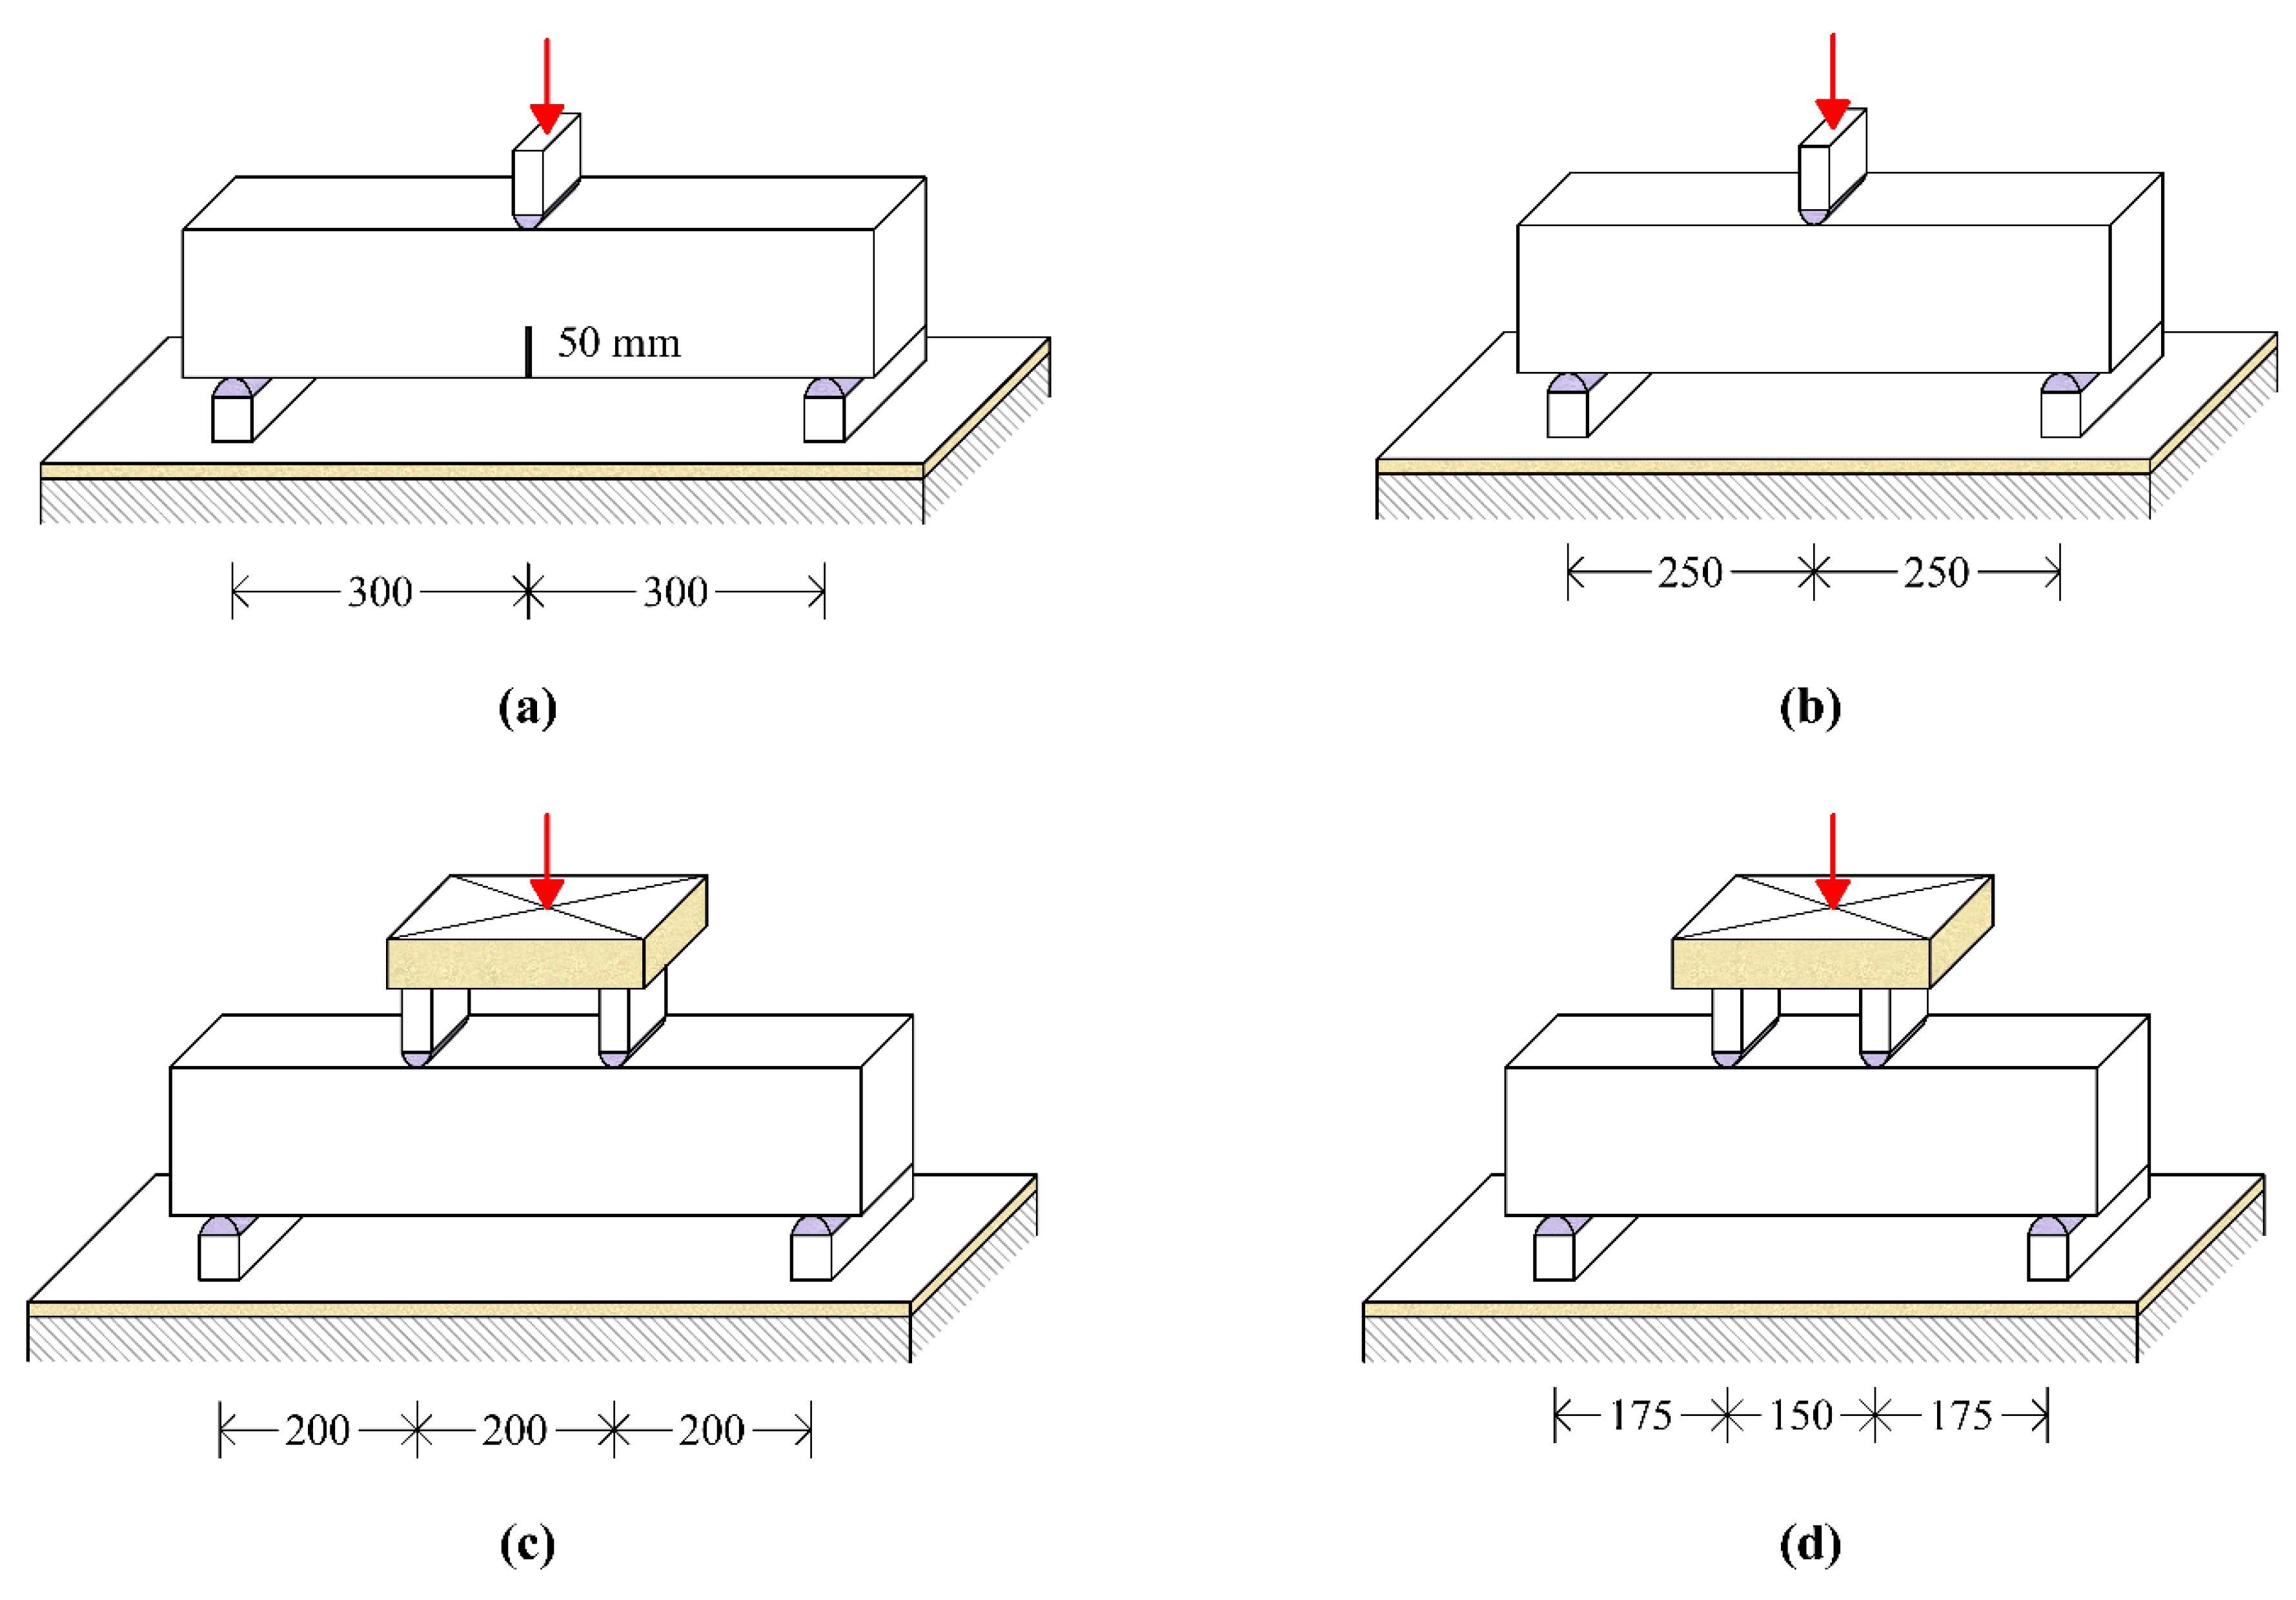
During the concreting of the slabs, test samples were also concreted to determine the mechanical properties of the concrete. The mechanical properties of conventional concrete and fiber-reinforced concrete are given in Table 3. A detailed description of these mechanical properties and a description of the individual tests are given in [76]. The scheme of bending tests is shown in Figure 16.

3.2. Numerical Analysis of Fiber-Reinforced Concrete Slabs on Subsoil

The detail of the computingg model and mesh of finite elements are shown in Figure 8a. Figure 17 shows the computer model of subsoil and slab and boundary conditions. The subsoil computer model used an area size of 6 × 6 m and a depth of 2 m. The depth and overall extent of the subsoil used in a numerical model influence the calculation task and have a significant effect on the subsidence and deformation of the foundation slab. Based on the results of our initial study for the reinforced concrete slab and the actual geological profile after the subsoil replacement, a depth of 2 m was chosen. The subsoil deformation modulus used for calculations had values of Esoil = 12.5, 22.5, and 32.5 MPa. The concrete material model also included material properties acquired from laboratory tests. Summary information is given in Table 4, specifically, cylinder compressive strength, tensile strength, and other recommendations for detailed material properties [76]. Other parameters were used according to the relationship recommendations in the manual ATENA [26].
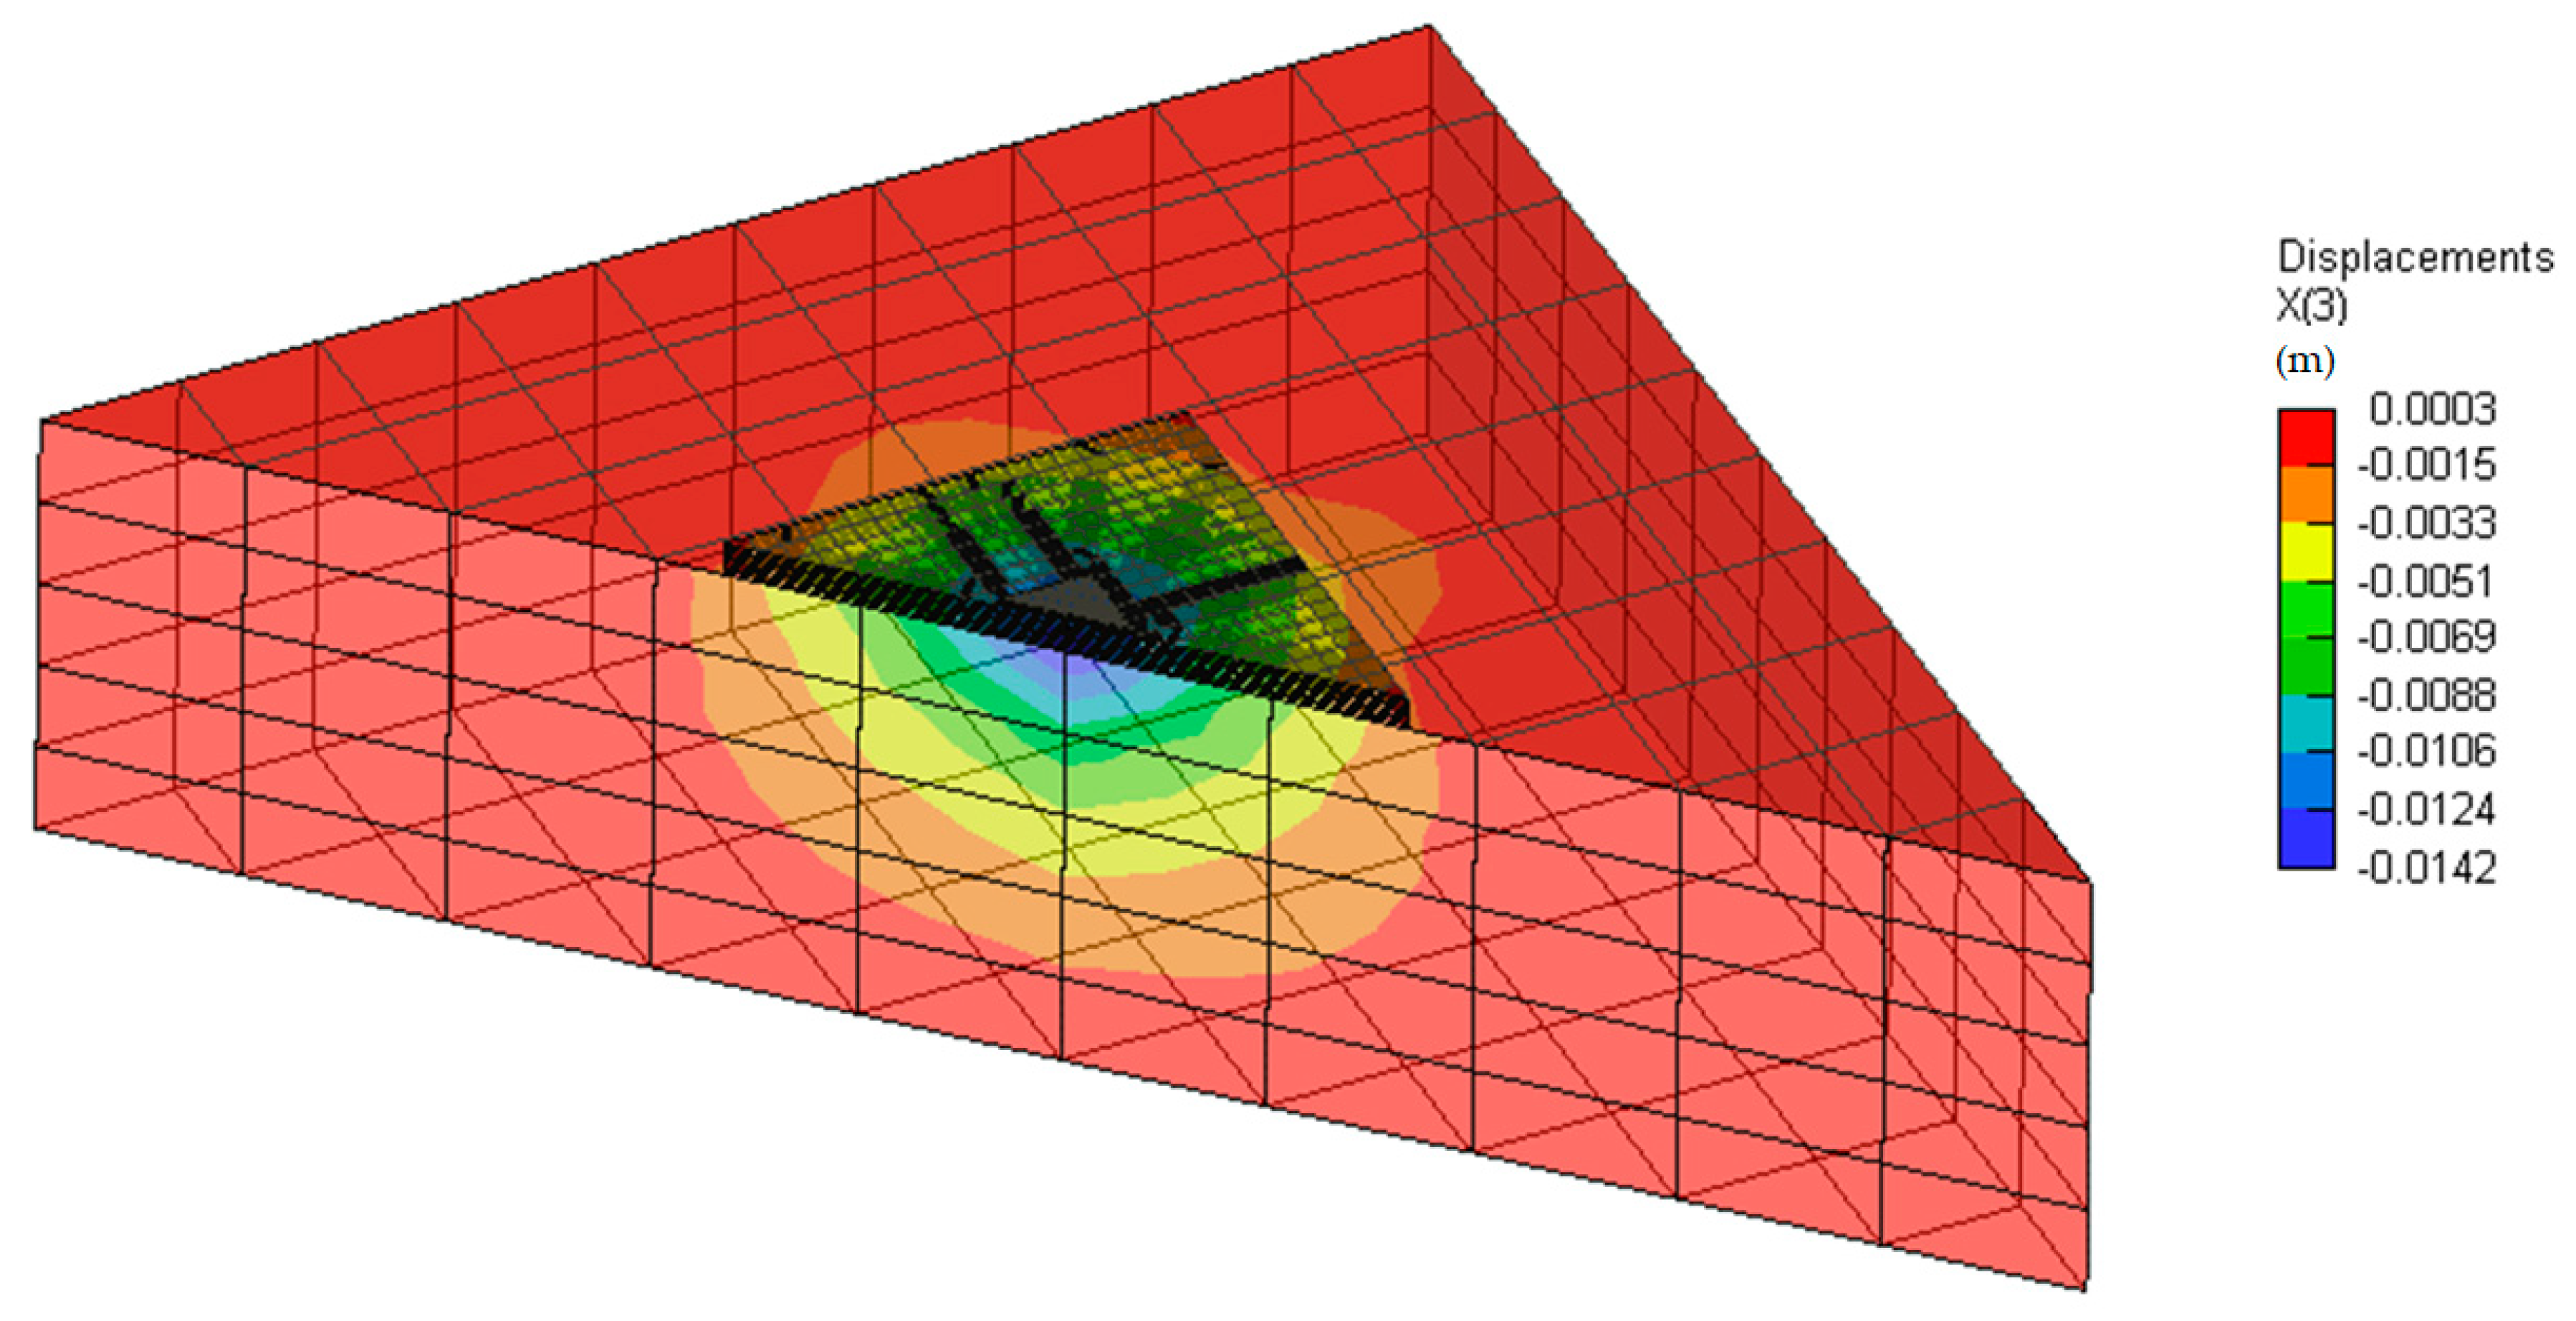
The output of the numerical analysis is shown graphically in Figure 18. The numerical model was evaluated for the subsoil deformation modulus Esoil = 12.5 MPa.
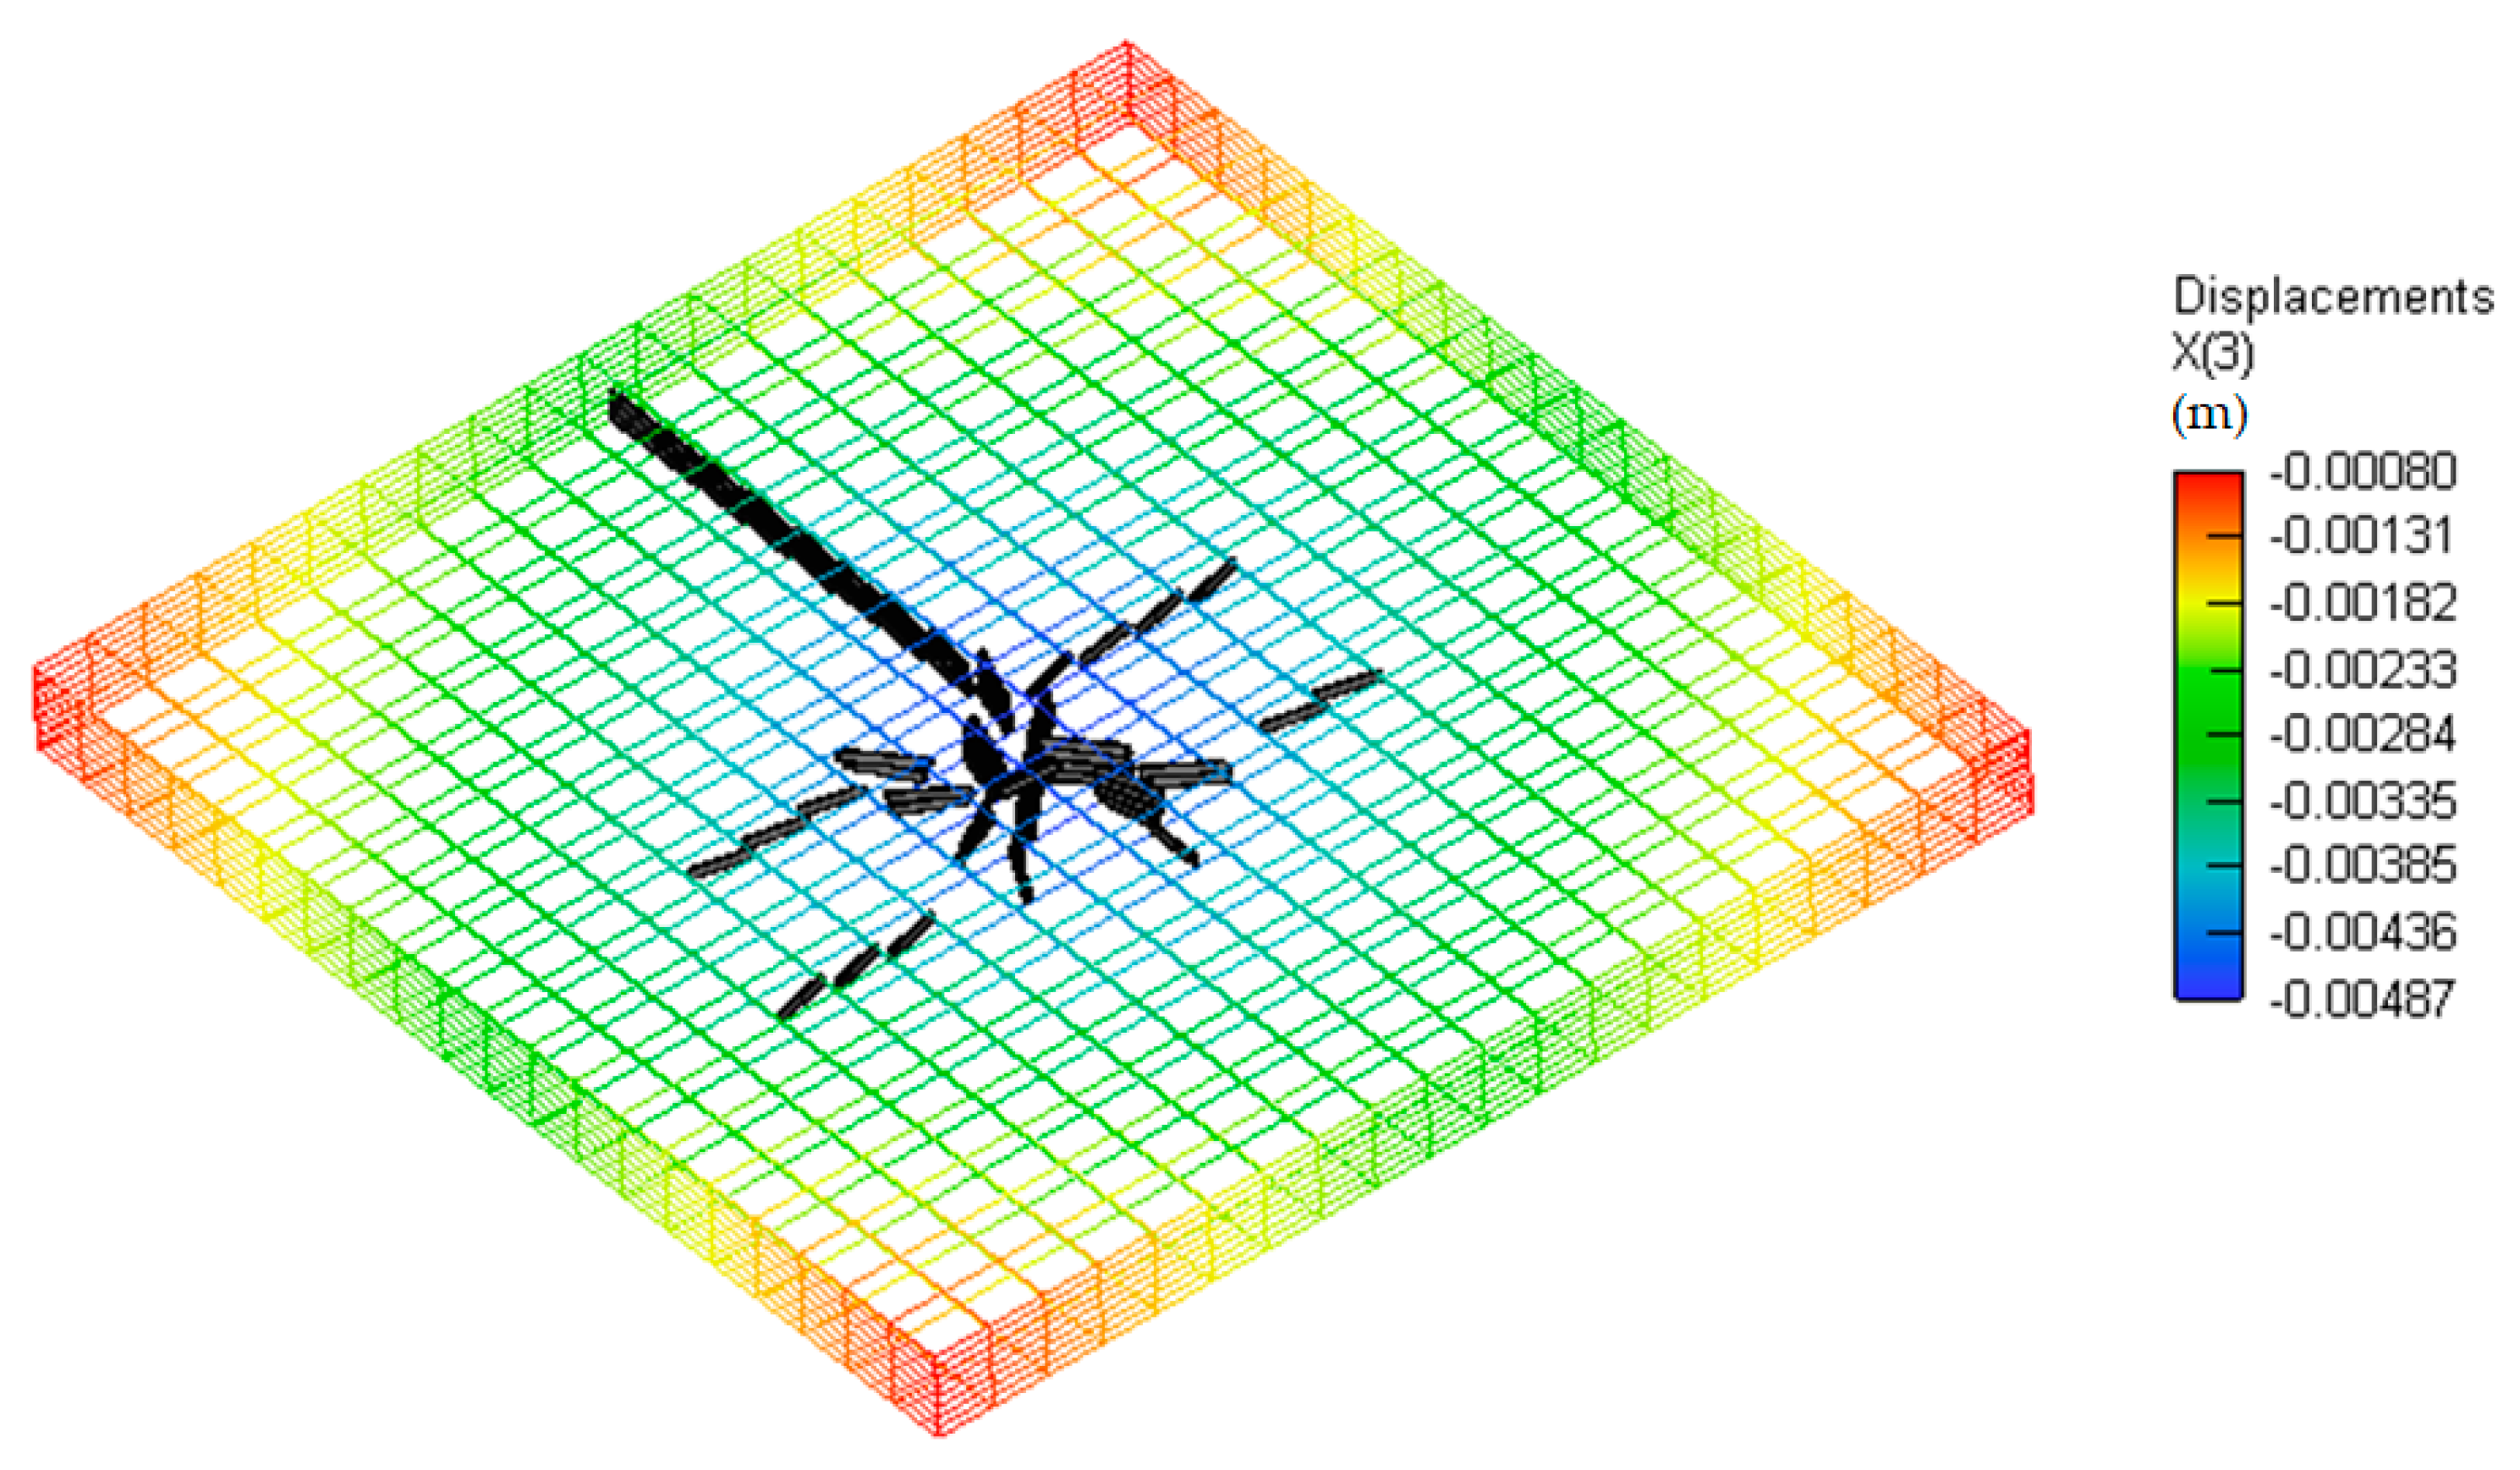
The numerical model reflects the increased load capacity of the slab with increasing fiber dosage. It also reflects smaller deformations for slabs with higher fiber dosage. Figure 19 and Figure 20 show the graphical output of crack occurrence and deformation of slab G01, for loads of 150 kN and 300 kN, respectively. The crack pattern indicates that the total load-bearing capacity of the slab has been reached.
The results of the numerical calculations for all subsoil variants are shown in Figure 21 and Figure 22. Load-displacement diagrams show the upper and lower load ranges for individual slab variants. The positive effect of fibers on the overall slab behavior is clearly visible. Numerical results are also close to the experimental results. The effect of the subsoil deformation modulus on the total deformation can again be seen. For individual load-displacement diagrams, a larger difference between deformations is evident with increasing load.

4. Discussion

Experiments involving load tests of fiber-reinforced concrete slabs on subsoil have shown the positive effect of fibers on the overall behavior and load-bearing capacity of the slabs compared with conventional concrete slabs. Even in the case of the smallest fiber dosage, 25 kg/m3, the effect was significant. Higher fiber dosage also affects the residual stiffness and overall load-bearing capacity of the slabs.
Numerical simulations of the slab using the non-linear analysis approach correlate well with visual observations during load tests. However, the choice of model and input parameters is important for the correct modeling of the task. The influence of the subsoil deformation modulus is greater than the influence of the subsoil depth. Figure 23 shows a comparison of the deformations obtained in the experimental load testing and those calculated in the numerical model. In the case of a higher load step, the differences are more pronounced but they are acceptable with respect to the higher deformation of the load step. The failure mode in the numerical analysis corresponded to the experimental failure mode. For appropriate numerical modeling of fiber-reinforced concrete, it is necessary to choose a suitable material model and corresponding input parameters. An overall comparison of all five experimental slabs and the numerical modeling is shown in Figure 23. Figure 23 also shows the differences between the load–displacement diagrams.
For non-linear calculations, repeated solutions using the Newton–Raphson method or the arc-length method were used. The main criterion was a displacement error, which was set to 0.01. In addition, auxiliary criteria were a residual error given by the value 0.01, an absolute residual error of 0.01 given by the value or energy error of 0.0001. The main convergence criterion was decisive for possible premature termination of the calculation. The number of iterations was set to a limit of 30. Choosing a smaller number of iterations was not appropriate and may have skewed the results and information value of the results. Tangent Predictor was used for calculated stiffness. The PARDISO solver was also used, which enables parallel processing of the task. The parallel solver worked well. An incremental solution with a step size of 10 kN was used for the resulting load-displacement diagrams. This computational procedure and the parameters of the non-linear analysis were chosen with regard to the convergence, speed of the computation, and information value of the results.

5. Recommendations for Numerical Modeling of Slabs in Interaction with Subsoil

Based on our numerical calculations, we draw partial conclusions and make the following recommendations for solving the problem:
(1)
Current computer technology and numerical methods make it possible to solve the problem using three-dimensional computational models with linear and non-linear solutions.
(2)
The chosen finite element method is suitable, and a linear isoparametric eight-node finite element with eight integration points is recommended. The use of tetrahedral finite elements in a non-linear solution can reduce the quality of the solution with respect to the principle of implementation of physical non-linearity. The use of more advanced isoparametric elements also leads to a significant increase in computational complexity.
(3)
The size of the finite elements must be chosen appropriately with regard to the dimensions of the structure. Setting the mesh along the thickness of the slab with at least eight finite elements is important for the accuracy of the calculation.
(4)
In the case of a linear calculation, the results of deformations are more significantly affected by the subsoil deformation modulus than the stiffness of conventional concrete and the size of finite elements.
(5)
The boundary conditions of the computational model must account for the actual geological profile. With greater depth of the model, there are also greater deformations. However, the computational model should not be deeper than the active depth (space) of the subsoil.
(6)
Suitable boundary conditions for the subsoil model are for the bottom surface, vertical support uz = 0, and the walls ux = 0 or uy = 0.
(7)
For modeling, it is appropriate to use the interface in the fixed contact or interface contact. Such use removes the need for there to be a common finite element mesh. The use of the contact interface significantly increases the requirements for computational complexity and knowledge of input parameters. Contact interface parameters have mixed properties. Some have a physical nature and some are more influenced by the specific geometry of the model. The parameter selection is an iterative process; the model must respect the actual behavior of the structure.
(8)
In the case of failure of conventional or fiber-reinforced concrete, it is necessary to use a non-linear solution, where the failure of the cross-section of the slab significantly affects the total deformation.
(9)
For the accuracy of the non-linear calculation, the choice of input parameters for conventional or fiber-reinforced concrete is important. The tensile strength of concrete determines the initial formation and development of cracks. During further loading, knowledge of tensile softening or fracture energy is required.
(10)
For concrete of ordinary strength classes and composition, it is advantageous to follow the recommendations in Model Codes 1990 or 2020. For fracture energy, it is appropriate to use VOS 1983 from the ATENA theoretical manual [26].
(11)
It is more difficult to determine the parameters for fiber-reinforced concrete. There are several approaches to modeling fiber-reinforced concrete and determining constitutive relationships. The basic methods include modeling of concrete and fiber separately [77], the approach presented in this study of using effective values of tensile strength and fracture energy, the definition of tensile softening [2,27], and the approximation of the tensile softening function [1]. When determining the parameters, it is appropriate to proceed from a detailed laboratory program. The basic parameters can be determined similarly to conventional concrete. Specialized tests are then the bending test and the tensile test. It is also appropriate to take into account the stochastic nature [27,78] of the parameters in the resulting parameters.
(12)
In the case of a known overall load-bearing capacity of a structure, it is possible to use the Newton–Raphson method. If it is necessary to determine the total load capacity, the descending branch of the calculation must use the arc-length method or the Newton–Rapson method with deformation load. It is also possible to combine methods but as a consequence, the calculation becomes complicated. The proven number of iterations was 30. The loading step should ideally be 1/20 or 1/50 of the total load capacity.
(13)
For a non-linear calculation, it is important to check that the experimental failure mechanism is the same.
(14)
A balanced compromise should be found between the requirements of the experimental program, laboratory tests, and computational complexity in order to obtain the appropriate value of the knowledge.

6. Conclusions

In this article, we have presented one possible approach to the numerical modeling of a slab in interaction with subsoil. Soil–structure interaction solves a complex problem. In specific cases where it is necessary to take into account the real behavior of the structure and the subsoil, the solution leads to a non-linear analysis. In this case, the presented solutions include the use of the finite element method and three-dimensional computational models. Sensitive input parameters include the mechanical parameters of the subsoil and the choice of model geometry. However, under real foundation conditions, the soil–structure interaction task is not geometrically limited. For the correct selection of the subsoil model is necessary for geological monitoring or exploration. Differences in the resulting deformations of the slabs in individual variants of the calculations can be significant. Numerical calculations also show that with the development of cracks in concrete, decreasing the slab stiffness and increasing the load, the influence of the mechanical parameters of the subsoil increases.
One of the results of the problem addressed in this study is that even after a significant failure of the concrete and plasticization of the reinforcement, the reinforced concrete slab remained whole. The conventional concrete slab was crushed into smaller parts during testing. The damage to the fiber-reinforced concrete slabs depended on the dosage of the fibers. The advantages of using non-linear analysis include the fact that, together with crack modeling, it is also possible to capture the mechanism of structural failure, which cannot be captured when using models according to design codes.
The following partial conclusions can be drawn:
  • The analysis of a slab in interaction with subsoil is a complex task, where conventional concrete, reinforced concrete, and fiber-reinforced concrete slabs behave differently.
  • Damage and deformations to fiber-reinforced concrete slabs depend on the dosage of the fibers.
  • The influence of the parameters of the subsoil (subsoil deformation modulus and depth of subsoil) increases with a higher load and damage to the slabs.
  • In this study, the subsoil deformation modulus had a more significant effect on deformations than the depth of the subsoil.
  • Accuracy of the input parameters for the material model is important for analysis and calculations. Individual variants can differ significantly, especially for fiber-reinforced concrete. It is necessary to appropriately identify the tensile strength and fracture energy, which are different from the values for conventional concrete.
  • For the solved type of soil–structure interaction task detailed in this study, it is appropriate to use a three-dimensional computational model and non-linear analysis.

Author Contributions

Conceptualization, R.C. and V.B.; methodology and validation, Z.M. and O.S.; data curation, Z.M. and R.C.; writing—original draft preparation, Z.M.; visualization, O.S.; supervision, R.C. All authors have read and agreed to the published version of the manuscript.

Funding

This research was funded by VŠB-TUO by the Ministry of Education, Youth and Sports of the Czech Republic.

Acknowledgments

The work was supported by the means of conceptual development of science, research and innovation assigned to VŠB-TUO by the Ministry of Education, Youth and Sports of the Czech Republic.

Conflicts of Interest

The authors declare no conflict of interest.

References

  1. Valikhani, A.; Jahromi, A.J.; Mantawy, I.M.; Azizinamini, A. Numerical Modelling of concrete-to-UHPC Bond Strength. Materials 2020, 13, 1379. [Google Scholar] [CrossRef] [PubMed] [Green Version]
  2. Sucharda, O. Identification of Fracture Mechanic Properties of Concrete and Analysis of Shear Capacity of Reinforced Concrete Beams without Transverse Reinforcement. Materials 2020, 13, 2788. [Google Scholar] [CrossRef]
  3. Falkner, H.; Hunag, Z.; Teutsch, M. Comparative study of plain and steel fiber reinforced concrete ground slabs. Concr. Int. 1995, 17, 45–51. [Google Scholar]
  4. Hrubesova, E.; Mohyla, M.; Lahuta, H.; Bui, T.Q.; Nguyen, P.D. Experimental Analysis of Stresses in Subsoil below a Rectangular Fiber Concrete Slab. Sustainability 2018, 10, 2216. [Google Scholar] [CrossRef] [Green Version]
  5. Sucharda, O.; Smirakova, M.; Vaskova, J.; Mateckova, P.; Kubosek, J.; Cajka, R. Punching Shear Failure of Concrete Ground Supported Slab. Int. J. Concr. Struct. Mater. 2018, 12, 36. [Google Scholar] [CrossRef]
  6. Halvonik, J.; Majtanova, L. Experimental Investigation of the Maximum Punching Resistance of Slab-Column Connections. Slovak J. Civ. Eng. 2018, 26, 22–28. [Google Scholar] [CrossRef] [Green Version]
  7. Hegger, J.; Sherif, G.A.; Ricker, M. Experimental investigations on punching behavior of reinforced concrete footings. ACI Struct. J. 2006, 103, 604–613. [Google Scholar] [CrossRef]
  8. Chen, H.-J.; Yu, Y.-L.; Tang, C.-W. Mechanical Properties of Ultra-High Performance Concrete before and after Exposure to High Temperatures. Materials 2020, 13, 770. [Google Scholar] [CrossRef] [Green Version]
  9. Pająk, M.; Ponikiewski, T. Flexural behavior of self-compacting concrete reinforced with different types of steel fibers. Constr. Build. Mater. 2013, 47, 397–408. [Google Scholar]
  10. Brandt, A.M. Fiber reinforced cement-based (FRC) composites after over 40 years of development in building and civil engineering. Compos. Struct. 2008, 86, 3–9. [Google Scholar] [CrossRef]
  11. Ponikiewski, T.; Katzer, J. Fresh mix characteristics of self-compacting concrete reinforced by fibre. Period. Polytech. Civ. Eng. 2017, 61, 226–231. [Google Scholar] [CrossRef] [Green Version]
  12. Sorelli, L.G.; Meda, A.; Plizzari, G.A. Steel fiber concrete slabs on ground: A structural matter. ACI Struct. J. 2006, 103, 551–558. [Google Scholar] [CrossRef]
  13. Cajka, R.; Labudkova, J. Dependence of deformation of a plate on the subsoil in relation to the parameters of the 3D model. Int. J. Mech. 2014, 8, 208–215. [Google Scholar]
  14. Chen, S. Strength of steel fibre reinforced concrete ground slabs. Proc. Inst. Civil Eng. Struct. Build. 2004, 157, 157–163. [Google Scholar] [CrossRef]
  15. Katzer, J.; Domski, J. Quality and mechanical properties of engineered steel fibres used as reinforcement for concrete. Constr. Build. Mater. 2012, 34, 243–248. [Google Scholar] [CrossRef]
  16. Sucharda, O.; Bilek, V.; Smirakova, M.; Kubosek, J.; Cajka, R. Comparative Evaluation of Mechanical Properties of Fibre Reinforced Concrete and Approach to Modelling of Bearing Capacity Ground Slab. Period. Polytech. Civ. Eng. 2017, 61, 972–986. [Google Scholar] [CrossRef] [Green Version]
  17. Alani, A.M.; Beckett, D. Mechanical properties of a large scale synthetic fibre reinforced concrete ground slab. Constr. Build. Mater. 2013, 41, 335–344. [Google Scholar] [CrossRef]
  18. Alani, A.; Beckett, D.; Khosrowshahi, F. Mechanical behaviour of a steel fibre reinforced concrete ground slab. Mag. Concr. Res. 2012, 64, 593–604. [Google Scholar] [CrossRef]
  19. Marcalikova, Z.; Cajka, R.; Bilek, V.; Bujdos, D.; Sucharda, O. Determination of mechanical characteristics for fiber-reinforced concrete with straight and hooked fibers. Crystals 2020, 10, 545. [Google Scholar] [CrossRef]
  20. Malvar, J.L.; Warren, G.E. Fracture energy for three-point-bend tests on single-edge-notched beams. Exp. Mech. 1988, 28, 266–272. [Google Scholar] [CrossRef]
  21. Hoover, C.G.; Bazant, Z.P. Cohesive crack, size effect, crack band and work-of-fracture models compared to comprehensive concrete fracture tests. Int. J. Fract. 2014, 187, 133–143. [Google Scholar] [CrossRef] [Green Version]
  22. Khalilpour, S.; BaniAsad, E.; Dehestani, M. A review on concrete fracture energy and effective parameters. Cem. Concr. Res. 2019, 120, 294–321. [Google Scholar] [CrossRef]
  23. Bazant, Z.; Planas, J. Fracture and Size Effect in Concrete and Other Quasibrittle Materials; CRC Press: Boca Raton, FL, USA, 1998. [Google Scholar]
  24. Cervenka, V.; Cervenka, J.; Pukl, R. ATENA-A tool for engineering analysis of fracture in concrete. Sadhana 2002, 27, 485–492. [Google Scholar] [CrossRef]
  25. Cervenka, J.; Papanikolaou, V.K. Three dimensional combined fracture—Plastic material model for concrete. Int. J. Plast. 2008, 24, 2192–2220. [Google Scholar] [CrossRef]
  26. Cervenka, V.; Jendele, L.; Cervenka, J. ATENA Program Documentation, Part 1, ATENA Theory Manual, Cervenka consulting, 2000–2020. Available online: https://www.cervenka.cz/assets/files/atena-pdf/ATENA_Theory.pdf (accessed on 26 March 2020).
  27. Sucharda, O.; Pajak, M.; Ponikiewski, T.; Konecny, P. Identification of mechanical and fracture properties of self-compacting concrete beams with different types of steel fibres using inverse analysis. Constr. Build. Mater. 2017, 138, 263–275. [Google Scholar] [CrossRef]
  28. Vandewalle, L.; Nemegeer, D.; Balazs, L.; Di Prisco, M.A. Rilem TC 162-TDF: Test and design methods for steel fibre reinforced concrete—Bending test. Mater. Struct. /Mater. Et Constr. 2002, 35, 579–582. [Google Scholar] [CrossRef]
  29. EN 14651:2005+A1:2007(E). Test Method for Metallic Fibre Concrete –Measuring the Flexural Tensile Strength (Limit of Proportionality (LOP), Residual); CEN—European Committee for Standardization: Brussels, Belgium, 2007. [Google Scholar]
  30. Ros, S.; Shima, H. Relationship between splitting tensile strength and compressive strength of concrete at early age with different types of cements and curing temperature histories. Concr. Inst. Proc. 2013, 35, 427–432. [Google Scholar]
  31. JCI. Guidelines for Control of Cracking of Mass Concrete; Japan Concrete Institute: Tokyo, Japan, 2011. [Google Scholar]
  32. JSCE. Standard Specifications for Concrete Structures—2002: "Materials and Construction"; Japan Society of Civil Engineers: Tokyo, Japan, 2005; p. 443. [Google Scholar]
  33. JSCE. Standard Specifications for Concrete Structures—2007, Materials and Construction; Japan Society of Civil Engineers: Tokyo, Japan, 2010; Available online: https://www.jsce-int.org/system/files/JGC16_Standard_Specifications_Materials_and_Construction_1.1.pdf (accessed on 22 October 2020).
  34. AIJ. Recommendations for Practice of Thermal Cracking Control of Massive Concrete in Building; Architectural Institute of Japan: Tokyo, Japan, 2008; p. 69. [Google Scholar]
  35. CEB-FIP Model Code 1990: Design Code, Final version; Thomas Telford Ltd.: London, UK, 1993.
  36. ACI Committee 318. Building Code Requirements for Structural Concrete (ACI 318-11) and Commentary; American Concrete Institute: Farmington Hills, MI, USA, 2011; p. 111. [Google Scholar]
  37. Raphael, J.M. Tensile strength of concrete. ACI J. Proc. 1984, 81, 158–165. [Google Scholar]
  38. Gardner, N.J. Effect of Temperature on the Early-Age Properties of Type I, Type III, and Type I/Fly Ash Concretes. ACI Mater. J. 1990, 87, 529–536. [Google Scholar]
  39. Oluokun, F.A.; Burdette, E.G.; Deatherage, J.H. Splitting tensile strength and compressive strength relationships at early ages. ACI Mater. J. 1991, 88, 115–121. [Google Scholar]
  40. Oluokun, F.A. Prediction of concrete tensile strength from its compressive strength: Evaluation of existing relationship for normal weight concrete. ACI Mater. J. 1991, 88, 302–309. [Google Scholar]
  41. Arioglu, N.; Girgin, Z.C.; Arioglu, E. Evaluation of Ratio between Splitting Tensile Strength and Compressive Strength for Concrete up to 120 MPa and Its Application in Strength Criterion. ACI Mater. J. 2006, 103, 18–24. [Google Scholar]
  42. Tomasovicova, D.; Jendzelovsky, N. Stiffness Analysis of the Subsoil under Industrial Floor. Procedia Eng. 2017, 190, 365–370. [Google Scholar] [CrossRef]
  43. Huang, X.; Liang, X.; Liang, M.; Deng, M.; Zhu, A.; Xu, Y.; Wang, X.; Li, Y. Experimental and theoretical studies on interaction of beam and slab for cast-in-situ reinforced concrete floor structure. J. Build. Struct. Jianzhu Jiegou Xuebao 2013, 34, 63–71. [Google Scholar]
  44. Kueres, D.; Ricker, M.; Hegger, J. Improved Shear Reinforcement for Footings—Maximum Punching Strength. ACI Struct. J. 2018, 115, 1365–1377. [Google Scholar] [CrossRef]
  45. Augustin, T.; Fillo, L.; Halvonik, J.; Marcis, M. Punching resistance of flat slabs with openings—Experimental investigation. Solid State Phenom. 2018, 272, 41–46. [Google Scholar] [CrossRef]
  46. Hoang, L.C.; Pop, A. Punching shear capacity of reinforced concrete slabs with headed shear studs. Mag. Concr. 2016, 68, 118–126. [Google Scholar] [CrossRef] [Green Version]
  47. Beckett, D. Ground-supported slabs made from steel-fibre-reinforced concrete. Concrete 2004, 38, 30–31. [Google Scholar]
  48. Meda, A.; Plizzari, G.A. New design approach for steel fiber-reinforced concrete slabs-on-ground based on fracture mechanics. ACI Struct. J. 2004, 101, 298–303. [Google Scholar]
  49. Labudkova, J.; Cajka, R. Comparison of Analysis of Linear Inhomogeneous and Nonlinear Half-Space in Foundation-Subsoil Interaction. J. Mech. 2016, 10. [Google Scholar]
  50. Alani, A.; Aboutalebi, M. Analysis of the subgrade stiffness effect on the behaviour of ground-supported concrete slabs. Struct. Concr. 2012, 13, 102–108. [Google Scholar] [CrossRef]
  51. Cajka, R.; Mynarcik, P.; Labudkova, J. Experimetal measurement of soil-prestressed foundation interaction. Int. J. Geomate 2016, 10, 2101–2108. [Google Scholar] [CrossRef]
  52. Aboutalebi, M.; Alani, A.; Rizzuto, J.; Beckett, D. Structural behaviour and deformation patterns in loaded plain concrete ground-supported slabs. Struct. Concr. 2014, 15, 81–93. [Google Scholar] [CrossRef]
  53. Barros, J.A.O.; Figuieiras, J.A. Experimental behaviour of fibre concrete slabs on soil. Mech. Cohesive-Frict. Mater. 1998, 3, 277–290. [Google Scholar] [CrossRef]
  54. Miltenberger, M.A.; Attiogbe, E.K.; Bissonnette, B. Behavior of conventional reinforcement and a steel-polypropylene fiber blend in slabs-on-grade. Mater. Struct. Mater. Constr. 2007, 40, 10. [Google Scholar] [CrossRef]
  55. Vida, R.; Halvonik, J. Shear assessment of concrete bridge deck slabs. Key Eng. Mater. 2017, 738, 110–119. [Google Scholar] [CrossRef]
  56. Mari, A.; Bairan, J.M.; Cladera, A.; Oller, E.; Ribas, C. Shear-flexural strength mechanical model for the design and assessment of reinforced concrete beams. Struct. Infrastruct. E. 2015, 11, 1399–1419. [Google Scholar] [CrossRef]
  57. Collins, M.P.; Bentz, E.; Sherwood, E.G. Where is shear reinforcement required? A review of research results and design procedures. ACI Struct. J. 2008, 105, 590–600. [Google Scholar]
  58. Mari, A.; Cladera, A.; Oller, E.; Bairan, J.M. A punching shear mechanical model for reinforced concrete flat slabs with and without shear reinforcement. Eng. Struct. 2018, 166, 413–426. [Google Scholar] [CrossRef]
  59. Classen, M. Shear Crack Propagation Theory (SCPT)—The mechanical solution to the riddle of shear in RC members without shear reinforcement. Eng. Struct. 2020, 210, 110207. [Google Scholar] [CrossRef]
  60. Mari, A.; Cladera, A.; Bairan, J.M.; Oller, E.; Ribas, C. Shear-flexural strength mechanical model for the design and assessment of reinforced concrete beams subjected to point or distributed loads. Front. Struct. Civ. Eng. 2014, 8, 337–353. [Google Scholar] [CrossRef] [Green Version]
  61. Fernandez Ruiz, M.; Muttonia, A.; Sagasetab, J. Shear strength of concrete members without transverse reinforcement: A mechanical approach to consistently account for size and strain effects. Eng. Struct. 2015, 99, 360–372. [Google Scholar] [CrossRef] [Green Version]
  62. Muttoni, A.; Fernandez Ruiz, M. From experimental evidence to mechanical modeling and design expressions: The Critical Shear Crack Theory for shear design. Struct. Concr. 2019, 20, 1464–1480. [Google Scholar] [CrossRef]
  63. Kozielova, M.; Marcalikova, Z.; Mateckova, P.; Sucharda, O. Numerical Analysis of Reinforced Concrete Slab with Subsoil. Civ. Environ. Eng. 2020, 16, 107–118. [Google Scholar] [CrossRef]
  64. Montoya, E.; Vecchio, F.J.; Sheikh, S.A. Compression Field Modelling of Confined Concrete: Constitutive Models. J. Mater. Civ. Eng. 2006, 18, 510–517. [Google Scholar] [CrossRef]
  65. Bazant, Z.P.; Adley, M.D.; Carol, I.; Jirasek, M.; Akers, S.A.; Rohani, B.; Cargile, J.D.; Caner, F.C. Large-strain generalization of microplane model for concrete and application. J. Eng. Mech. 2000, 126, 971–980. [Google Scholar] [CrossRef]
  66. Sucharda, O.; Konecny, P. Recommendation for the modelling of 3D non-linear analysis of RC beam tests. Comput. Concr. 2018, 21, 11–20. [Google Scholar] [CrossRef]
  67. Federation internationale du beton. Fib Model Code for Concrete Structures 2010; Wilhelm Ernst & Sohn Verlag fur Architektur und technische Wissenschaften: Berlin, Germany, 2013. [Google Scholar]
  68. Rimkus, A.; Cervenka, V.; Gribniak, V.; Cervenka, J. Uncertainty of the smeared crack model applied to RC beams. Eng. Fract. Mech. 2020, 233, 107088. [Google Scholar] [CrossRef]
  69. Cervenka, V. Computer simulation of failure of concrete structures for practice. In Proceedings of the first fib Congress, Osaka, Japan, 13–19 October 2002; pp. 289–304. Available online: https://www.cervenka.cz/assets/files/papers/cervenka_2_osaka_2002_full_e-328.pdf (accessed on 26 March 2020).
  70. Dias-da-Costa, D.; Cervenka, V.; Graça-e-Costa, R. Model uncertainty in discrete and smeared crack prediction in RC beams under flexural loads. Eng. Fract. Mech. 2018, 199, 532–543. [Google Scholar] [CrossRef]
  71. Cervenka, V.; Cervenka, J.; Kadlec, L. Model uncertainties in numerical simulations of reinforced concrete structures. Struct. Concr. 2018, 19, 2004–2016. [Google Scholar] [CrossRef]
  72. Buchta, V.; Janulikova, M.; Fojtik, R. Experimental Tests of Reinforced Concrete Foundation Slab. Procedia Eng. 2015, 114, 530–537. [Google Scholar] [CrossRef] [Green Version]
  73. Marcalikova, Z.; Neuwirthova, Z.; Cajka, R. Parametric Study for Influence of Input Parameters for Analysis of Fibre Reinforced Concrete Slab-Soil Interaction. Trans. Tech. Univ. Ostrav. Civ. Eng. Ser. 2018, 18, 25–30. [Google Scholar] [CrossRef] [Green Version]
  74. Cajka, R.; Mynarcik, P.; Neuwirthova, Z.; Marcalikova, Z.; Kropacek, M. Tests of fiber reinforced concrete composite slabs on the subsoil with horizontal load. Int. J. Geomate 2020, 18, 143–150. [Google Scholar] [CrossRef]
  75. Concrete Reinforcement. Available online: http://www.bekaert.com/en/products/construction/concrete-reinforcement (accessed on 22 October 2020).
  76. Cajka, R.; Marcalikova, Z.; Kozielova, M.; Mateckova, P.; Sucharda, O. Experiments on fiber concrete foundation slabs in interaction with the subsoil. Sustainability 2020, 12, 3939. [Google Scholar] [CrossRef]
  77. Marcalikova, Z.; Sucharda, O. Modeling of Fiber-Reinforced Concrete and Finite Element Method. Int. Rev. Civil Eng. 2021, 8. [Google Scholar]
  78. Sucharda, O.; Mateckova, P.; Bilek, V. Non-Linear Analysis of an RC Beam Without Shear Reinforcement with a Sensitivity Study of the Material Properties of Concrete. Slovak J. Civ. Eng. 2020, 28, 33–43. [Google Scholar] [CrossRef]
Figure 1. Concept of material model for concrete according to [68].
Sustainability 12 09868 g001
Figure 2. Specialized testing equipment: (a) cross section; (b) view.
Sustainability 12 09868 g002
Figure 3. Reinforced concrete slab: (a) view; (b) reinforcements—steel mesh.
Sustainability 12 09868 g003
Figure 4. Deformation of reinforced concrete slab.
Sustainability 12 09868 g004
Figure 5. Reinforced concrete slab—underside: (a) after loading test; (b) calculation model with cracks (min. width for plotting cracks—0.2 mm).
Sustainability 12 09868 g005
Figure 6. Three-dimensional deformation surface of half of a reinforced concrete slab after relaxation: (a) 5th loading step—load of 250 kN; (b) 10th loading step—load of 500 kN.
Sustainability 12 09868 g006
Figure 7. Computer model and boundary conditions—reinforced concrete slab.
Sustainability 12 09868 g007
Figure 8. Computer model—definition of systems and contact interfaces between them: (a) details of the finite element mesh; (b) contact interface between slab and subsoil.
Sustainability 12 09868 g008
Figure 9. Three-dimensional numerical model of reinforced concrete slab—crack occurrence and stress (Esoil = 22.5 MPa).
Sustainability 12 09868 g009
Figure 10. Load–displacement diagrams for the numerical model and experiment.
Sustainability 12 09868 g010
Figure 11. Time course of load in experimental testing [76].
Sustainability 12 09868 g011
Figure 12. Load test for slab G01, without fibers—after test.
Sustainability 12 09868 g012
Figure 13. Slabs after load testing: (a) slab G01, without fibers; (b) slab G04, fiber dosage of 75 kg/m3.
Sustainability 12 09868 g013
Figure 14. Three-dimensional deformation of slabs G01, G02, G03, and G04 using contour lines for one-quarter of each slab—load step of 300 kN for peak of load.
Sustainability 12 09868 g014
Figure 15. Load–displacement diagrams for slabs (fiber-reinforced concrete slab, conventional concrete slab—Esoil = 12.5 MPa, reinforced concrete slab—Esoil = 22.5 MPa).
Sustainability 12 09868 g015
Figure 16. Bending tests: (a) 3B600; (b) 3B500; (c) 4B600; (d) 4B500 according to [76].
Sustainability 12 09868 g016
Figure 17. Computer model and boundary conditions—fiber-reinforced concrete slab.
Sustainability 12 09868 g017
Figure 18. Three-dimensional numerical model—deformation of slab on subsoil: G01, load of 300 kN (half model).
Sustainability 12 09868 g018
Figure 19. Three-dimensional numerical analysis output: crack and displacement, slab G01, load of 150 kN (min. width for plotting cracks—0.35 mm).
Sustainability 12 09868 g019
Figure 20. Three-dimensional numerical analysis output: crack and displacement, slab G01, load of 300 kN (min. width for plotting cracks—0.35 mm).
Sustainability 12 09868 g020
Figure 21. Load–displacement diagrams: (a) G02; (b) G03; (c) G04.
Sustainability 12 09868 g021
Figure 22. Load–displacement diagram—G01.
Sustainability 12 09868 g022
Figure 23. Load–displacement diagrams for slabs: experimental and numerical modeling—comparison.
Sustainability 12 09868 g023
Table 1. Parameters of contact interface.
C (MPa)fcoefften (MPa)Knn (MN/m3)Ktt (MN/m3)Knn,min (MN/m3)Ktt,min (MN/m3)
1.00.10.32.0 × 1082.0 × 1082.0 × 1052.0 × 105
Table 2. Deformation in the center of a reinforced concrete slab—parametric study.
Deformation Modulus of the Subsoil (MPa)Load (kN)Subsoil of Depth (m)
246
12.51502.923.574.08
3008.609.9010.91
45014.2516.1917.73
60022.4025.3026.25
75035.9138.3340.02
22.51501.802.152.43
3005.286.006.57
4509.0010.1010.96
60012.6214.1015.23
75017.0718.9220.48
32.51501.371.611.81
3003.924.444.82
4506.717.508.08
6009.4710.5211.29
75012.3213.6214.60
Table 3. Mechanical properties of conventional concrete and fiber-reinforced concrete.
Fibers (kg/m3)|(%)Average Compressive Strength Cylinder|Cube
(MPa)
Average Split Tensile Strength (MPa)Bending Tensile Strength (MPa)
Type of Test
3B5003B6004B6004B500
0|020.03|25.112.103.022.892.552.85
25|0.3229.28|34.962.964.043.813.103.76
50|0.6425.27|31.653.124.414.243.564.06
75|0.9624.90|27.873.174.725.164.354.95
Table 4. Mechanical properties for material model Cementitious 2.
Input ParameterUnitMarker of Slab|Fibers (%)
G01|0G02|0.32G03|0.64G01|0.96
Modulus of elasticityGPa19.5119.5119.5119.51
Compression strengthMPa21.3429.7126.9023.69
Poisson’s ratio-0.20.20.20.2
Tension strengthMPa1.892.662.812.85
Fracture energyN/m4722511002500
Fixed crack-1111
Maximum aggregate sizemm16161616
Reduction coefficient Fc, red-0.8111
Shear factor-20202020
Fracture energyN/m4722511002500
Publisher’s Note: MDPI stays neutral with regard to jurisdictional claims in published maps and institutional affiliations.