Article

How Can Emerging Event Sustainably Develop in the Tourism Industry? From the Perspective of the S-O-R Model on a Two-Year Empirical Study

1
Department of Hospitality Management, National Taitung Junior College, Taitung 95045, Taiwan
2
Department of Business Management, National Sun Yat-sen University, Kaohsiung 80424, Taiwan
3
Business School, Shantou University, Guangdong, Shantou 515063, China
*
Author to whom correspondence should be addressed.
Sustainability 2020, 12(23), 10075; https://doi.org/10.3390/su122310075
Submission received: 16 October 2020 / Revised: 23 November 2020 / Accepted: 30 November 2020 / Published: 2 December 2020
(This article belongs to the Section Tourism, Culture, and Heritage)

Abstract

:
Festivals and events are important activities related to enhancing the image of the destination. Modern festivals are spread all over the world, not only changing the rhythm of daily life but also bringing more development possibilities for the places where these festivals are held. In order to learn more about tourists’ experiences in emerging events, a detailed study of famous hot air balloon festivals was conducted in Taitung City, Taiwan. Based on the stimulus-organism-response (S-O-R) model, the purpose of this study is to explore the relationship among these three constructs, namely stimulus: perception of marketing strategies and motivation, organism: positive emotions and satisfaction and response: revisit intention. Face-to-face surveys were conducted on-site in 2014 and 2018, a total of 896 valid questionnaires were collected from tourists who visited the Taiwan International Balloon Festival. SPSS Macros PROCESS was used to examine the measurement model. This study confirms the application of the S-O-R model in predicting tourists’ revisit intentions in the context of emerging events in the tourism industry. The survey results show that whether in 2014 or 2018, tourists’ satisfaction and tourists’ positive emotions can mediate the relationship between tourists’ perception of marketing strategies (or tourist’s motivation) and tourists’ revisit intention. Moreover, only in 2018, tourists’ visiting frequency can moderate the relationship between satisfaction and revisit intention.

1. Introduction

Festivals and events are important activities related to enhancing the image of destinations. Especially in the rural areas, the benefits of festivals are more clearly reflected, especially in local revenue, employment opportunities and promotion of local products [1]. Recently, modern festivals have appeared in Taiwan and have both changed the rhythms of daily life and reshaped the places hosting them. Taiwan International Balloon Festival (TIBF) is such an emerging festival held on Luye Terrace in Taitung, Taiwan. It was started from scratch by the county government in 2011. Like other hot air balloon festivals around the world, the TIBF is a popular tourist activity that attracts many tourists and makes considerable profits. The most famous locations in the world for holding hot air balloon festivals are Cappadocia in Turkey, Bristol in the UK, Albuquerque in the US and Saga in Japan. The Albuquerque Hot Air Balloon Carnival, for instance, has been held for nearly 50 years and is the largest hot air balloon event in the world. The annual economic impact on local companies exceeds 150 million USD.
Figure 1 shows the number of tourists visiting Chulu Ranch and Luye Terrace from June to August from 2008 to 2019. Chulu Ranch and Luye Terrace are two famous attractions in the more rural parts of Taitung County. Since 2011, after holding the TIBF, the number of tourists who visited Luye Terrace has increased significantly compared with 2010. During the TIBF period, the number of tourists visiting Luye terraces far exceeded the number of tourists visiting Chulu Ranch, which showed that the TIBF has indeed brought crowds. The number of tourists reached their peaks in 2012, 2014 and 2018, with the fastest growth in 2018. A previous study demonstrated that the TIBF has brought positive effects of increased tourism revenues and enhanced its host area’s visibility within a growing number of tourists [2].
How could an emerging event be sustainable in the tourism industry? Consumers’ satisfaction and continuous return visit are critical factors in the sustainable development of the festival activity [3]. Those charged with the governance and management of all destinations try to find out how tourists’ demands might be met, why tourists visit their locality and most importantly whether tourists could be enticed to make return visits. The promotion of local festivals may lead to the rapid growth of tourism activities which has resulted in imitation and lack of innovation in all counties and cities. Tourist loyalty is widely considered key to the survival and success of local businesses, especially when the cost of finding a new customer greatly exceeds the cost of retaining an existing customer [4].
This two-year study reinforces the S-O-R model in the field of tourism research and explores the mediation effect of tourists’ satisfaction and positive emotions. Additionally, the stimulus of the S-O-R model came from not only the external environment as viewed through tourists’ perception of marketing strategies but also from the internal stimulus of tourists’ motivation. Regarding the organism, we also tried to discuss both the cognitive (satisfaction) and affective (positive emotions) status of tourists. From the multiple constructs, one can more fully understand the S-O-R model. For tourists, their satisfaction is a critical factor that influences their revisit intention. After their visiting and subsequent satisfaction, their loyalty or revisit intention will be built. Conversely, if the events are held for many years without innovation or for other reasons, tourists may gradually lose their interest and not decide to return. Therefore, following the S-O-R model, all mediation effects are more meaningful.
The TIBF has been held for the 10th year in 2020. In the present study, we analyze tourist feedback on their motivations, perception of marketing strategies, positive emotions, satisfaction and revisit intention for the TIBF. Unlike previous event studies that usually focus on one year and researchers cannot compare results from different years. This study was conducted in 2014 and 2018, which were both peak periods for tourists. Through a two-year study, more can be examined about the experience of tourists and a more comprehensive understanding of sustainable development in this emerging event can be gained. The rest of the paper is organized as follows. First, this study outlines related research and research models including hypotheses. Below the research methods are our research results and discussion sections. Last is the conclusion of this study, theoretical and practical implications are discussed.

2. Literature Review

2.1. Taiwan International Balloon Festival

The Taiwan International Balloon Festival (TIBF) is a non-traditional and emerging festival held on Luye Terrace in Taitung County, Taiwan. It was started from scratch by the county government of Taitung in 2011 and is now one of the most famous tourism events in Taiwan. During this period, annually, every morning at around 5:30 and every dusk at 4:30, when the weather is stable, there will be a hot air balloon flying show. Usually, the airflow in the morning is more stable than the airflow in the afternoon. Watching balloon activities are indeed greatly affected by the weather. Generally speaking, hot air balloon flights will be held when the weather is clear. That is, when the wind or rain is a little heavy, even on a sunny day, if the airflow is unstable and tourists may not be able to watch the hot air balloon flying. In the TIBF, in addition to the regular activity of hot air balloons for tourists, such as tethered or free flight, there are also special activities such as light sculpture concerts held on certain dates complimenting the beautiful summer night sky at various attractions in Taitung. The Taitung County Government has organized various activities to promote the development of the TIBF and make it more interesting and attractive. Sometimes there are other activities, for instance, an ecological environment tour, music party with picnic, street artist performance, etc.
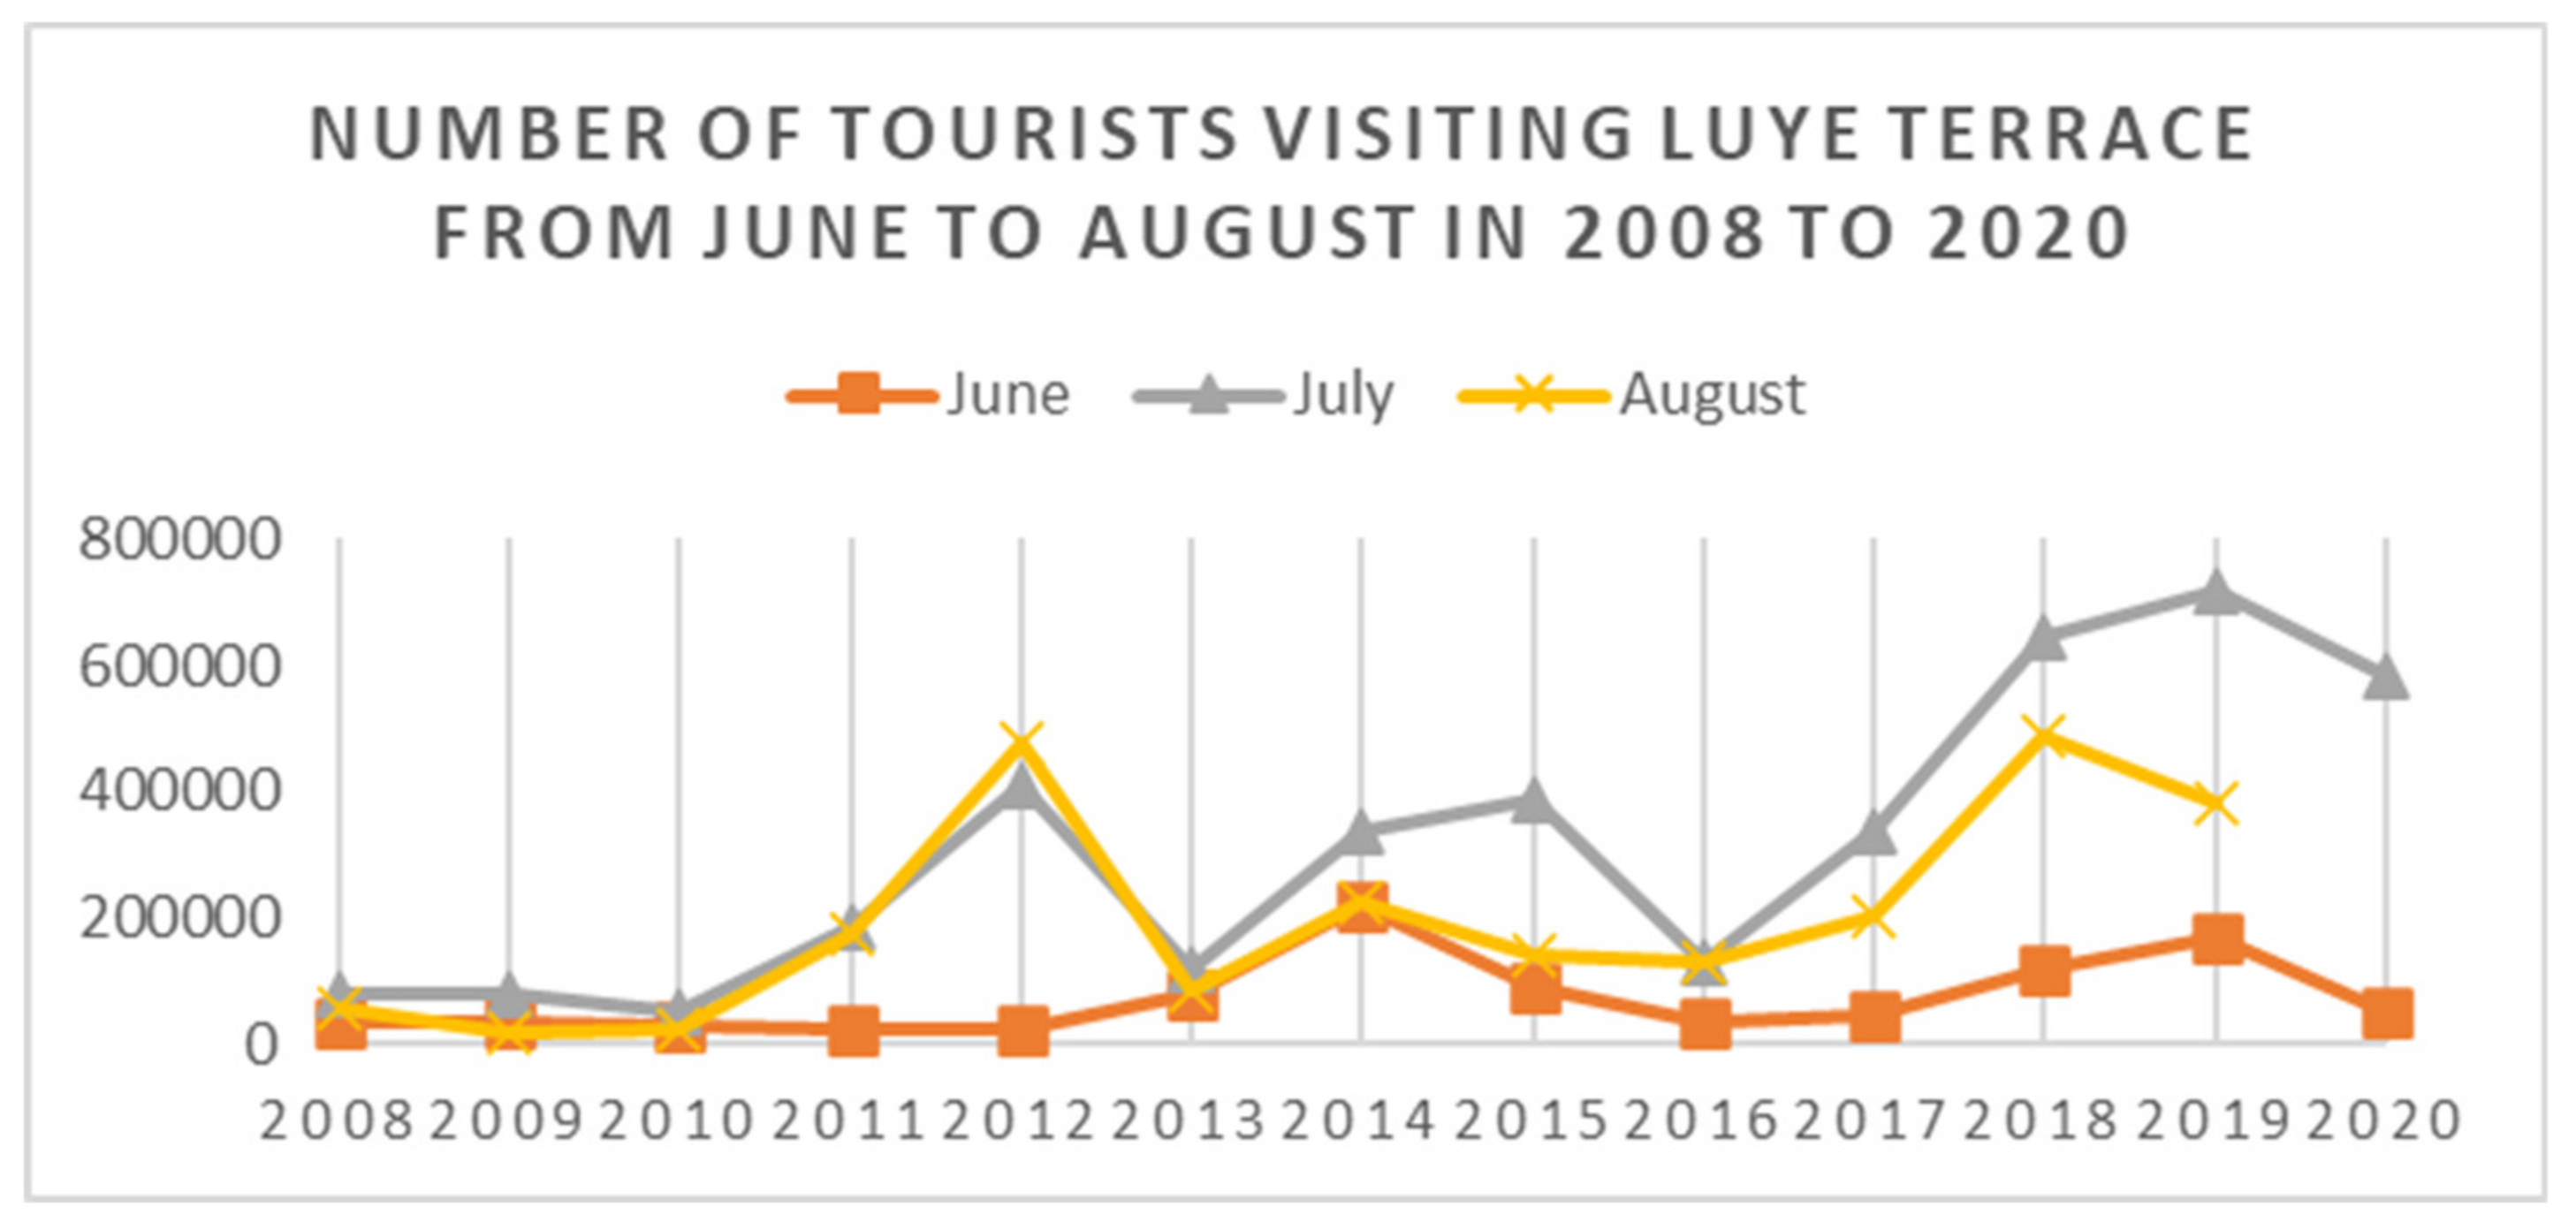
After the first holding of the TIBF in 2011, the number of tourists in Luye Terrace had indeed increased. In the third year of 2013, other county governments in Taiwan also followed up with similar events and the number of tourists visiting Luye Terrace during the TIBF had dropped sharply, and then rebounded in 2014 [2] (see Figure 1). Table 1 shows the numbers of tourists who had visited Luye Terrace from June to August in 2008 to 2020 and the duration of the TIBF. Generally, the TIBF takes place in summer vacations and usually covers the entire July, therefore, the number of visitors in June are the lowest while July has the highest number of visitors. The duration of the TIBF was from 39 to 72 days in the 10 years. From Figure 2, we can more easily find a detailed comparison of the number of visitors in these three months. After the TIBF, the number of tourists visiting Luye Terrace was more than before. In other words, the TIBF has brought positive effects of increased tourism revenues and enhanced its host area’s visibility within a growing number of tourists [2]. However, by 2020, the number of tourists has decreased in June and July due to COVID-19.

2.2. Stimulus-Organism-Response (S-O-R) Model

The Stimulus-Organism-Response (S-O-R) model originates in the field of environmental psychology and states that various aspects of the environments serve as stimulus (S) that ultimately drive the behavioral responses (R) of individuals by intervening in their internal states (O) [5]. The S-O-R model has been in use for a few decades, it has been widely applied to previous studies [6,7,8,9]. However, due to the different aspects of stimuli and organism that researchers are concerned about, there are various application results under the theoretical framework of S-O-R theory. For example, Chang explored the formation of consumer loyalty as influenced by the perception of stimuli from a restaurant, through indirect effects on consumers’ emotions [6]. In addition, Kamboj et al., found that the motivations of customers positively influenced their participation, which in turn significantly affected both brand trust and brand loyalty [10]. In the past, the S-O-R model has been applied to certain research, especially those related to smartphones, online shopping or online communities, but only a few studies in the event or festival context. Chen, King and Suntikul applied the S-O-R approach to convey key festival messages and values from the attendee perspective [11]. They pointed out that this framework can describe the festival experience as a continuous and multi-stage process.
In this paper, we apply the S-O-R model to the domain of consumer behavior in the emerging tourism events, try to define the relationships between environmental stimulus (perception of marketing strategies and motivation), tourists’ internal states as an organism (satisfaction and positive emotions) and the behavioral response (revisit intention) to the event.

2.3. Perception of Marketing Strategies and Motivation

Most studies of tourism events found a positive relationship between the environment and both revisit intention and satisfaction. In the S-O-R model, the environment is as a stimulus. Many factors have been examined regarding consumer behavior in previous S-O-R studies of stimulus, such as the perception of marketing strategies, features of online businesses, customer experiences, service quality and motivations. The stimulus could originate from not only the external environment but also from internal forces within the consumer, both can impact responses. Jacoby explained stimulus as all factors the individual encounters in his/her environment [12]. Peng and Kim used value relative to cost as an internal stimulus and added further stimulus from the environment [13]. Su, Swanson and Chen indicated that stimulus would include a perception of marketing strategies or psychological stimulation from society [14].
The marketing mix was considered one of the external stimuli for an individual in the S-O-R model [15]. The marketing mix usually represents four Ps (product, price, place and promotion) marketing strategies. If the marketing mix can meet more needs of customers in an innovative way than other competitors, it can create a competitive advantage. Wei and Wang had used four P marketing strategies in a marketing environment to test competitive marketing advantages and found a positive effect on profitability [16]. In the tourism industry, events and festivals are used to reinvent value for tourists in such a way [17]. Islam, Yang, Hu and Hsu found a significant relationship between marketing mix and customer loyalty in terms of the quality of customer service provided [18]. Therefore, in our study, the perception of marketing strategies (product, price, promotion and place) of the TIBF is an external stimulus that is vital to tourists.
Moreover, motivation is also an important component of behavioral models of tourism consumption [19]. In the research of Mathesona, Rimmerb and Tinsley, the motivations of cultural adventure and escape for attending the festival were determined [20]. Many researchers investigated the motivations of visitors to attend festivals, but fewer explore how these motivations affect outcomes [21]. Prayag mentioned that the realization of motivation often leads to high satisfaction [22]. Dean and Suhartanto found that motivation could impact visitor behavioral intention to re-experience [23]. In the present study, we adapt tourists’ perceptions of marketing strategies and tourists’ motivation as our external and internal stimuli.

2.4. Tourists’ Satisfaction and Positive Emotions

Oliver defined customer satisfaction as a pleasure fulfillment response toward a good, service, benefit or reward [24]. Previous studies have identified the positive impact of customer satisfaction on behavioral intention in the tourism industry. For example, Yoshida and James found a positive impact of satisfaction on behavioral intention in the context of baseball and football games [25]. In addition, satisfaction and dissatisfaction are significantly related to positive and negative emotions [26]. The emotional response is also a powerful predictor of satisfaction and other post-consumer behaviors [27]. Emotion is one of the internal states of consumers that comes from an evaluation of events or from inner thoughts and is affected by the environment in which an event is experienced [28,29]. Empirical studies point out that emotions play a key role in customers’ decision-making processes, and form customers’ attitudes and behaviors toward a service product [30,31]. However, Lin and Nawijn indicated that motivation does not have a significant impact on tourists’ emotions [32]. Researchers consider consumption-related emotions to be positive emotions such as happiness, pleasure, relaxation, contentment, joy and comfort [33,34]. In the current study, tourists’ satisfaction and positive emotions act in the mediating role of the S-O-R model.

2.5. Tourists’ Revisit Intention

Tourist behavioral intentions are influenced by tourism experiences and are widely considered a key point in the survival and success of businesses since acquiring a new customer costs a lot more than retaining an existing one [4]. Tourists’ revisit intention is a key factor affecting the sustainable competitiveness of the tourism industry. Destinations need new marketing strategies to retain revisit tourists and ensure a sustainable competitive advantage and outstanding development. Relative study of consumer loyalty has used willingness to revisit and positive word of mouth as the aspects used to measure loyalty [4,35]. Eusebio and Vieira measured destination loyalty from an attitudinal approach through “intentions to return to the same destination in the future” and “intentions or willingness to recommend it” [36]. In the study of Bigne et al., they implied behavioral intention and recommendation intention to measure post-purchase behavior of resort tourists [37]. Models of festival revisit intention have explored the process in which aspects of festivals influence revisit intentions through the tourists’ experiences of a festival [38,39].

2.6. Mediation Effects

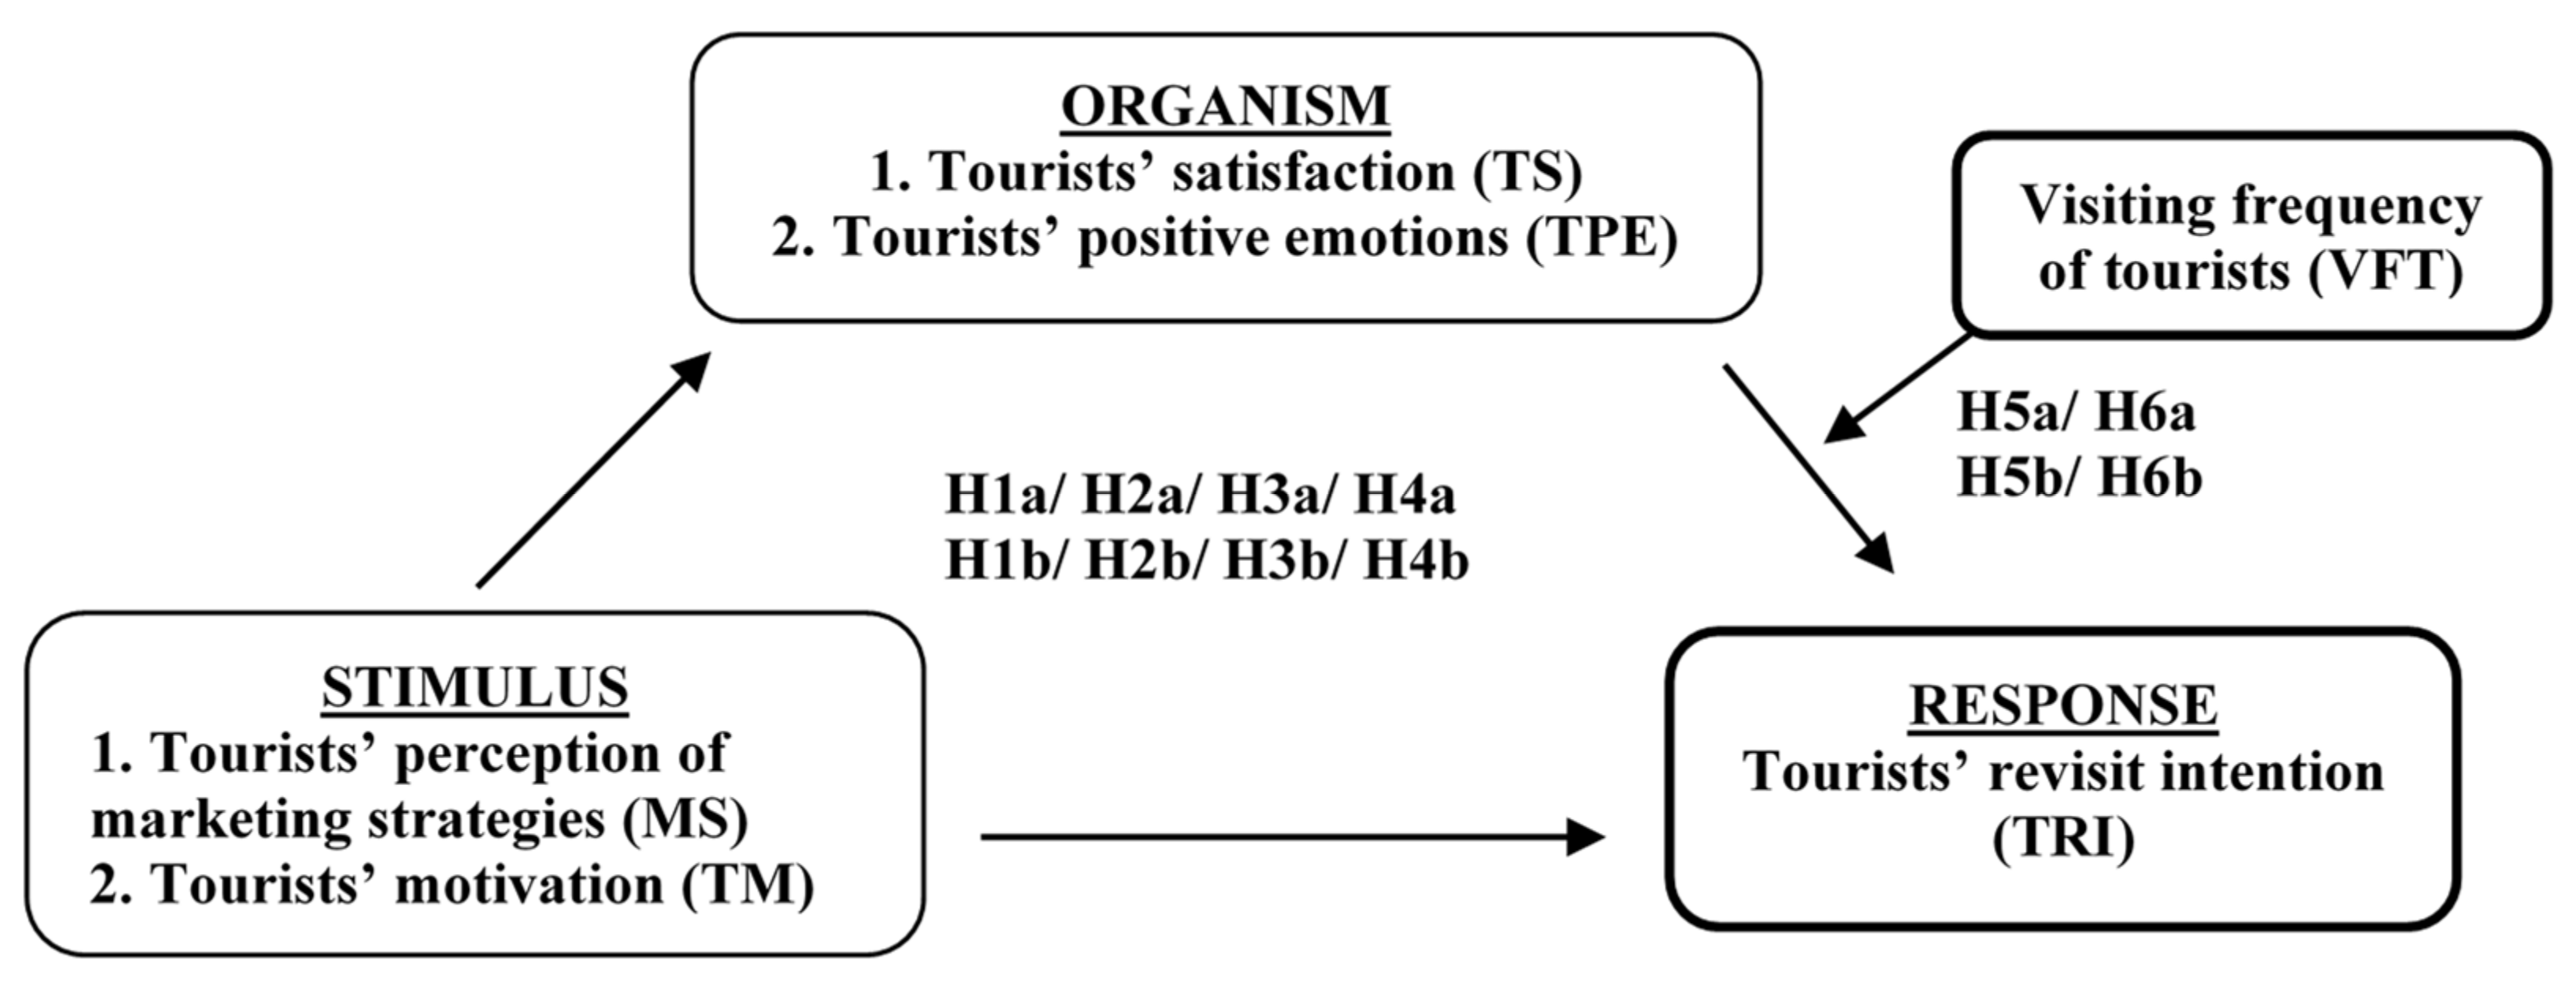
The S-O-R model indicates that an organism can mediate the effects of the stimulus on response [5]. In previous S-O-R studies [40,41], the impact of environmental stimulus on users’ behaviors is mediated by their user experiences. In the field of tourism, tourists’ positive emotions and satisfaction are defined as their user experience. Figure 3 shows the research model, which was developed based on the previous discussion. The mediating role of tourist’s satisfaction and their positive emotion (O) on the relationships between the perception of marketing strategies, tourists’ motivation (S) and tourists’ revisit intention (R) are examined.
Marketing strategies (product, pricing, promotion and distribution) are positively correlated with the business performance [42]. Additionally, a crucially important measure of performance in the tourism service industry is customer satisfaction. Prior studies [43,44] have concluded that the service marketing-mix has a significant effect on customer satisfaction and increases customer loyalty [45].
Besides, Brown, Assaker and Reise also found that spectators at World Cup games were very satisfied with their experiences of the event and their motivations exerted a significant positive influence on their satisfaction [46]. In other words, the more motivated they were, the higher the level of satisfaction gained. Devesa, Laguna and Palacios have also indicated that tourist satisfaction is significantly influenced by their motivation [47]. Prayag had a similar result that the behavioral intentions of visitors were influenced by their motivations [22]. Furthermore, Kamboj et al., demonstrated that customer motivations positively influenced their participation, and this in turn significantly affected brand loyalty [10]. It remains, however, unclear whether tourists’ motivation can exert a significant and positive influence over satisfaction.
Numerous studies have examined the relationship between satisfaction and loyalty/revisit intention, found that tourists’ loyalty/revisit intention was strongly influenced by their satisfaction with the festival [22]. As visitors’ interest and involvement increased, their perception of value and satisfaction was raised and contributed to their behavioral intention [48]. Choo, Ahn and Petrick also found that tourist satisfaction is one of the most important factors influencing future purchases and intention to revisit [49]. Satisfied customers become loyal, and this means that many of them will repeat visits in the future [50]. However, Brown, Assaker and Reise found that satisfaction did not have an impact on visitation intentions [46]. Based on the theoretical and empirical backgrounds, the following hypotheses were proposed.
Hypothesis 1a (H1a): 
Tourists’ satisfaction (TS) will mediate the relationship between perception of marketing strategies (MS) and tourists’ revisit intention (TRI) in 2014.
Hypothesis 1b (H1b): 
Tourists’ satisfaction (TS) will mediate the relationship between perceptions of marketing strategies (MS) and tourists’ revisit intention (TRI) in 2018.
Hypothesis 2a (H2a): 
Tourists’ satisfaction (TS) will mediate the relationship between tourists’ motivation (TM) and tourists’ revisit intention (TRI) in 2014.
Hypothesis 2b (H2b): 
Tourists’ satisfaction (TS) will mediate the relationship between tourists’ motivation (TM) and tourists’ revisit intention (TRI) in 2018.
Moreover, it is proposed that emotions experienced by consumers play a key role in determining their future behavior [28,51]. Lin and Liang pointed out that consumers’ behavior intentions were significantly positively affected by their positive emotions [52]. One of the general behavior intentions of consumers is their loyalty to products or to tourism events. It is also found that positive emotional states have significant impacts on the motivation of tourists and are significantly related to future travel intention [53]. In the research done by Chang, the formation of consumer loyalty was influenced by perceptions of stimulus from a restaurant, through the indirect effects of consumer’s emotional responses [6]. Based on the theoretical and empirical backgrounds, the following hypotheses were proposed.
Hypothesis 3a (H3a): 
Tourists’ positive emotions (TPE) will mediate the relationship between perception of marketing strategies (MS) and tourists’ revisit intention (TRI) in 2014.
Hypothesis 3b (H3b): 
Tourists’ positive emotions (TPE) will mediate the relationship between perceptions of marketing strategies (MS) and tourists’ revisit intention (TRI) in 2018.
Hypothesis 4a (H4a): 
Tourists’ positive emotions (TPE) will mediate the relationship between tourists’ motivation (TM) and tourists’ revisit intention (TRI) in 2014.
Hypothesis 4b (H4b): 
Tourists’ positive emotions (TPE) will mediate the relationship between tourists’ motivation (TM) and tourists’ revisit intention (TRI) in 2018.

2.7. Moderation Effect of Visiting Frequency of Tourist

Scott identified a curiosity factor, regarding which he found statistically significant differences between first-time and repeat visitors [54]. Previous research [55] found that tourists’ former experiences are a major moderator of destination value formation. It is important to understand the differences between first-time and revisit tourists when developing destination marketing strategies [56]. The differences in perceptions and behaviors of first-time and repeat festival visitors remain not widely discussed [22]. Chi mentioned that repeat visitors could report higher destination loyalty than first-time visitors [57]. Tourist behavioral intentions were influenced by tourism experiences and are widely considered a key point in the survival and success of businesses since acquiring a new customer costs a lot more than retaining an existing one [4]. Moreover, first-time visitors reported lower destination loyalty than revisit tourists, in addition, their loyalty was influenced more by satisfaction compared to repeat visitors [57]. On the other hand, some previous studies indicated that there were no significant differences between first-time and repeat visitors for demographic characteristics, satisfaction and intention of recommendation [58,59]. Thus, the following hypotheses are put forward:
Hypothesis 5a (H5a): 
Visiting frequency of tourists (VFT) moderate the effect of tourists’ satisfaction (TS) on tourists’ revisit intention (TRI) in 2014.
Hypothesis 5b (H5b): 
Visiting frequency of tourists (VFT) moderate the effect of tourists’ satisfaction (TS) on tourists’ revisit intention (TRI) in 2018.
Hypothesis 6a (H6a): 
Visiting frequency of tourists (VFT) moderate the effect of tourists’ positive emotions (TPE) on tourists’ revisit intention (TRI) in 2014.
Hypothesis 6b (H6b): 
Visiting frequency of tourists (VFT) moderate the effect of tourists’ positive emotions (TPE) on tourists’ revisit intention (TRI) in 2018.

3. Materials and Methods

3.1. Questionnaire Design

The questionnaire is mainly composed of six parts, they are tourists’ motivation, tourists’ perception of marketing strategies, tourists’ satisfaction, tourists’ positive emotions, tourists’ revisit intention and demographic data. This investigation explored the variability of the tourist experience in 2014 and 2018. All measurement items were adapted or modified from previous studies and measured through a seven-point Likert scale ranging from 1 (strongly disagree) to 7 (strongly agree). Tourists’ motivation was measured by two aspects: “escape and cultural adventure” with seven items, which was proposed by Mathesona, Rimmerb and Tinsley [20]. Tourists’ perception of marketing strategies was measured using four items: “product, price, place and promotion”, which was modified from Wei and Wang [16]. Tourists’ satisfaction was measured using three items: “overall satisfaction”, “rate experience with the destination” and “one of the best destinations” by Hosany and Prayag [27]. Tourists’ positive emotions were measured by two items: “interesting and joyful”, which was proposed by Oliver’s [26]. Tourists’ revisit intention was measured using two items: “intentions to return to the same destination in the future” and “intentions or willingness to recommend it”, which was based on Eusebio and Vieira [36].

3.2. Data Collection and Analysis

We conducted field investigations at Luye Terrace in Taitung, Taiwan from 10 July to 15 July 2014, from 30 June to 2 July 2018 and from 5 July to 7 July 2018. In our study, we expected that all respondents would have experienced and watched the hot air balloon flight. Therefore, we confirmed in advance whether the weather was suitable for the event. Normally, the weather was good when we collected the data. Every morning at 5:30, six pre-trained investigators conducted surveys with paperwork for 1 to 1.5 h in their own responsible area of the TIBF area. They chose the interviewees themselves and provided the questionnaire face to face. On average, there were about 90 responses per day in 2014 and 64 responses per day in 2018.
We started the first study of the TIBF in 2014 to obtain a more comprehensive understanding of this emerging event in Taitung, Taiwan. As Figure 1 shows, the number of visitors to the TIBF dropped slightly in 2015 and 2016, probably related to the typhoons in these two years. In 2018, the Taitung government announced that they had invitedas many as 39 special hot air balloons from all over the world to participate in this event., which was the most balloons since TIBF was held. In addition, the TIBF was rated as one of the 12 most amazing hot air balloon festivals in the world by the US Travel Channel in 2018. Therefore, in 2018, we decided to conduct a second study, expected to compare the results of these two-year studies. A quantitative methodology was employed, consisting of a self-administered questionnaire involving a total of 931 tourists who visited the TIBF (Taiwan International Balloon Festival) in 2014 and in 2018. After removing invalid responses, the final sample was 896, composed of 527 tourists in 2014 and 369 tourists in 2018. Since data is collected face-to-face, researchers can provide clear feedback to respondents immediately, so the response rate is high.
After data collection and descriptive statistics analysis, a series of serial mediation analyses were conducted using the SPSS Macros PROCESS [60]. Model 4 and Model 1 were chosen to perform mediation analysis and moderation analysis. Bootstrapping by a multiple of 5000 was implemented to obtain a 95% bias-corrected confidence interval for making statistical inferences about specific and total indirect effects [61].

4. Results

4.1. Demographic Profile of Sample

Table 2 presents a profile of the respondents. In 2014, a large portion of participants (41.7%) were aged between 21 and 30 and between 31 and 40 (27.3%). In addition, first-time visitors accounted for 69.6% of the sample in 2014, of which 30.4% were returning visitors. Repeat visitors participated in the TIBF 3.02 times on average. Regarding the experience of riding a hot-air balloon, most respondents (87.7%) had no actual riding experience, few had the experience of tethered flight (10.4%), while fewer had the experience of free flight (0.9%). Many respondents participated in the TIBF with three to five companions (42.3%). In 2014, 60.5% of respondents drove to Luye, where the TIBF is held. Meanwhile, 73.8% of respondents planned to stay for more than two days.
In 2018, the highest percentage was aged 31 to 40 (34.6%) and 21 to 40 (34.3%). Moreover, 60.9% of respondents were first-time visitors while 39.1% of respondents were returning visitors. The average frequency of return visits in 2018 was 3.70. Regarding the experience of riding a hot-air balloon, most respondents (82.8%) had no actual riding experience. Few had the experience of tethered flight (11.4%), while fewer had the experience of free flight (5.8%). Many participants took part in the TIBF with three to five companions (47.1%). In 2018, 75.3% of respondents drove to Luye. Meanwhile, 80.3% of respondents planned to stay for more than two days (Table 2).

4.2. Correlation, Reliability and Validity

Table 3 shows descriptive statistics and correlations of constructs in 2014 and 2018. In 2014: In terms of means, the tourists’ positive emotions (TPE) had the largest average score of 6.2, whereas the tourists’ motivation (TM) had the smallest of 5.1. TPE had the smallest standard deviation of 0.77 whereas TM had the highest standard deviation of 0.99. All correlations were highly significant. The significant correlation between tourists’ satisfaction (TS) and tourists’ revisit intention (TRI) was the largest (r = 0.657 **), while the correlation between TM and tourists’ perception of marketing strategies (MS) was the smallest (r = 0.351 *). In 2018: In terms of means, TPE had the largest average score of 6.3, whereas TM had the smallest at 5.34. TPE had the smallest standard deviation of 0.71 whereas TM had the highest standard deviation of 0.91. All correlations were highly significant. The significant correlation between TS and TL was the largest (r = 0.507 **), while the correlation between TM and TPE was the smallest (r = 0.198 *).
The reliability of all scales was first examined using Cronbach’s alpha coefficient to examine the internal consistency of items [62]. The results in Table 3 reveal that most scales in 2014 and 2018 are reliable as their alpha values are very close or greater than 0.7, the minimum acceptable limit. This indicates good internal consistency reliability. The average variance extracted (AVE) values were calculated for each latent construct (see Table 3). All AVE values were from 0.53 to 0.90 (>0.50) [63], indicating that most of the variance in each construct was explained by a common underlying factor. Discriminant validity was assessed by comparing AVE scores with the squared correlation between the constructs. Also shown in Table 3, all the square root AVE scores were larger than the correlation between the constructs, indicating desirable discriminant validity [64,65]. The values of standard deviation for all five variables were less than one, representing that the properties of all variables were normally distributed among the visitors.
Correlation analysis provided initial support for the proposed hypotheses. The results of this analysis revealed that tourists’ perception of marketing strategies and tourists’ motivations were both positively correlated with tourists’ satisfaction and their positive emotions at the 0.01 level. Moreover, both tourists’ satisfaction and tourists’ positive emotions had a significant positive relationship at the 0.01 level with tourists’ revisit intentions as per our expectations under H1a to H4b.

4.3. Hypotheses Testing of Mediation Effects

Table 4 summarizes the results of regression models for testing hypotheses such that the effects of tourists’ perception of marketing strategies (MS) and tourists’ motivation (TM) on tourists’ revisit intention (TRI) are through tourists’ satisfaction (TS) and tourists’ positive emotions (TPE), respectively. In 2014: First, the effects of MS on TS (a = 0.720 ***), MS on TPE (a = 0.440 ***), TM on TS (a = 0.328 ***) and TM on TPE (a = 0.216 ***) are all significant. Second, the effect of MS on TRI (b = 0.664 ***), TM on TRI (b = 0.349 ***) are both significant. Third, in H1a and H3a, the effects of TS on TRI (c = 0.566 ***) and TPE on TRI (c = 0.501 ***) are significant; in H2a and H4a, TS on TRI (c = 0.642 **) and TPE on TRI (c = 0.618 ***) are also significant. In 2018: First, the effects of MS on TS (a = 0.530 ***), MS on TPE (a = 0.237 ***), TM on TS (a = 0.305 ***) and TM on TPE (a = 0.155 ***) are all significant. Second, the effect of MS on TRI (b = 0.369 ***), TM on TRI (b = 0.220 ***) are significant. Third, in H1b and H3b the effects of TS on TRI (c = 0.415 ***), TPE on TRI (c = 0.330 ***) are also significant; in H2b and H4b, TS on TRI (c = 0.443 **) and TPE on TRI (c = 0.363 ***) are both significant.
Moreover, interesting response patterns of the S-O-R model are presented in Table 5, indicating mediation effects on tourists who joined the TIBF by Hayes’s [60] PROCESS macro for SPSS with Model 4. In 2014: There are positive indirect effects of MS on TRI through TS (Effect = 0.407; CI [0.307, 0.520]) and through TPE (Effect = 0.220, CI [0.164, 0.285]). This indicates that both TS and TPE mediate the relationship between MS and TRI. Additionally, there are also indirect effects of TM on TRI through TS (Effect = 0.211; CI [0.152, 0.279]) and through TPE (Effect = 0.134, CI [0.070, 0.200]). This indicates that both TS and TPE mediate the relationship between TM and TRI. In 2018: There are positive indirect effects of MS on TRI through TS (Effect = 0.220; CI [0.151, 0.303]) and through TPE (Effect = 0.078, CI [0.041, 0.128]). Moreover, there are also indirect effects of TM on TRI through TS (Effect = 0.136; CI [.083, 0.196]) and TPE (Effect = 0.056, CI [0.018, 0.108]). This indicates that both TS and TPE mediate the relationship between TM and TRI. Therefore, we could conclude that from H1a to H4b, all eight hypotheses of mediation were supported.

4.4. Moderation Effects of Visiting Frequency of Tourist

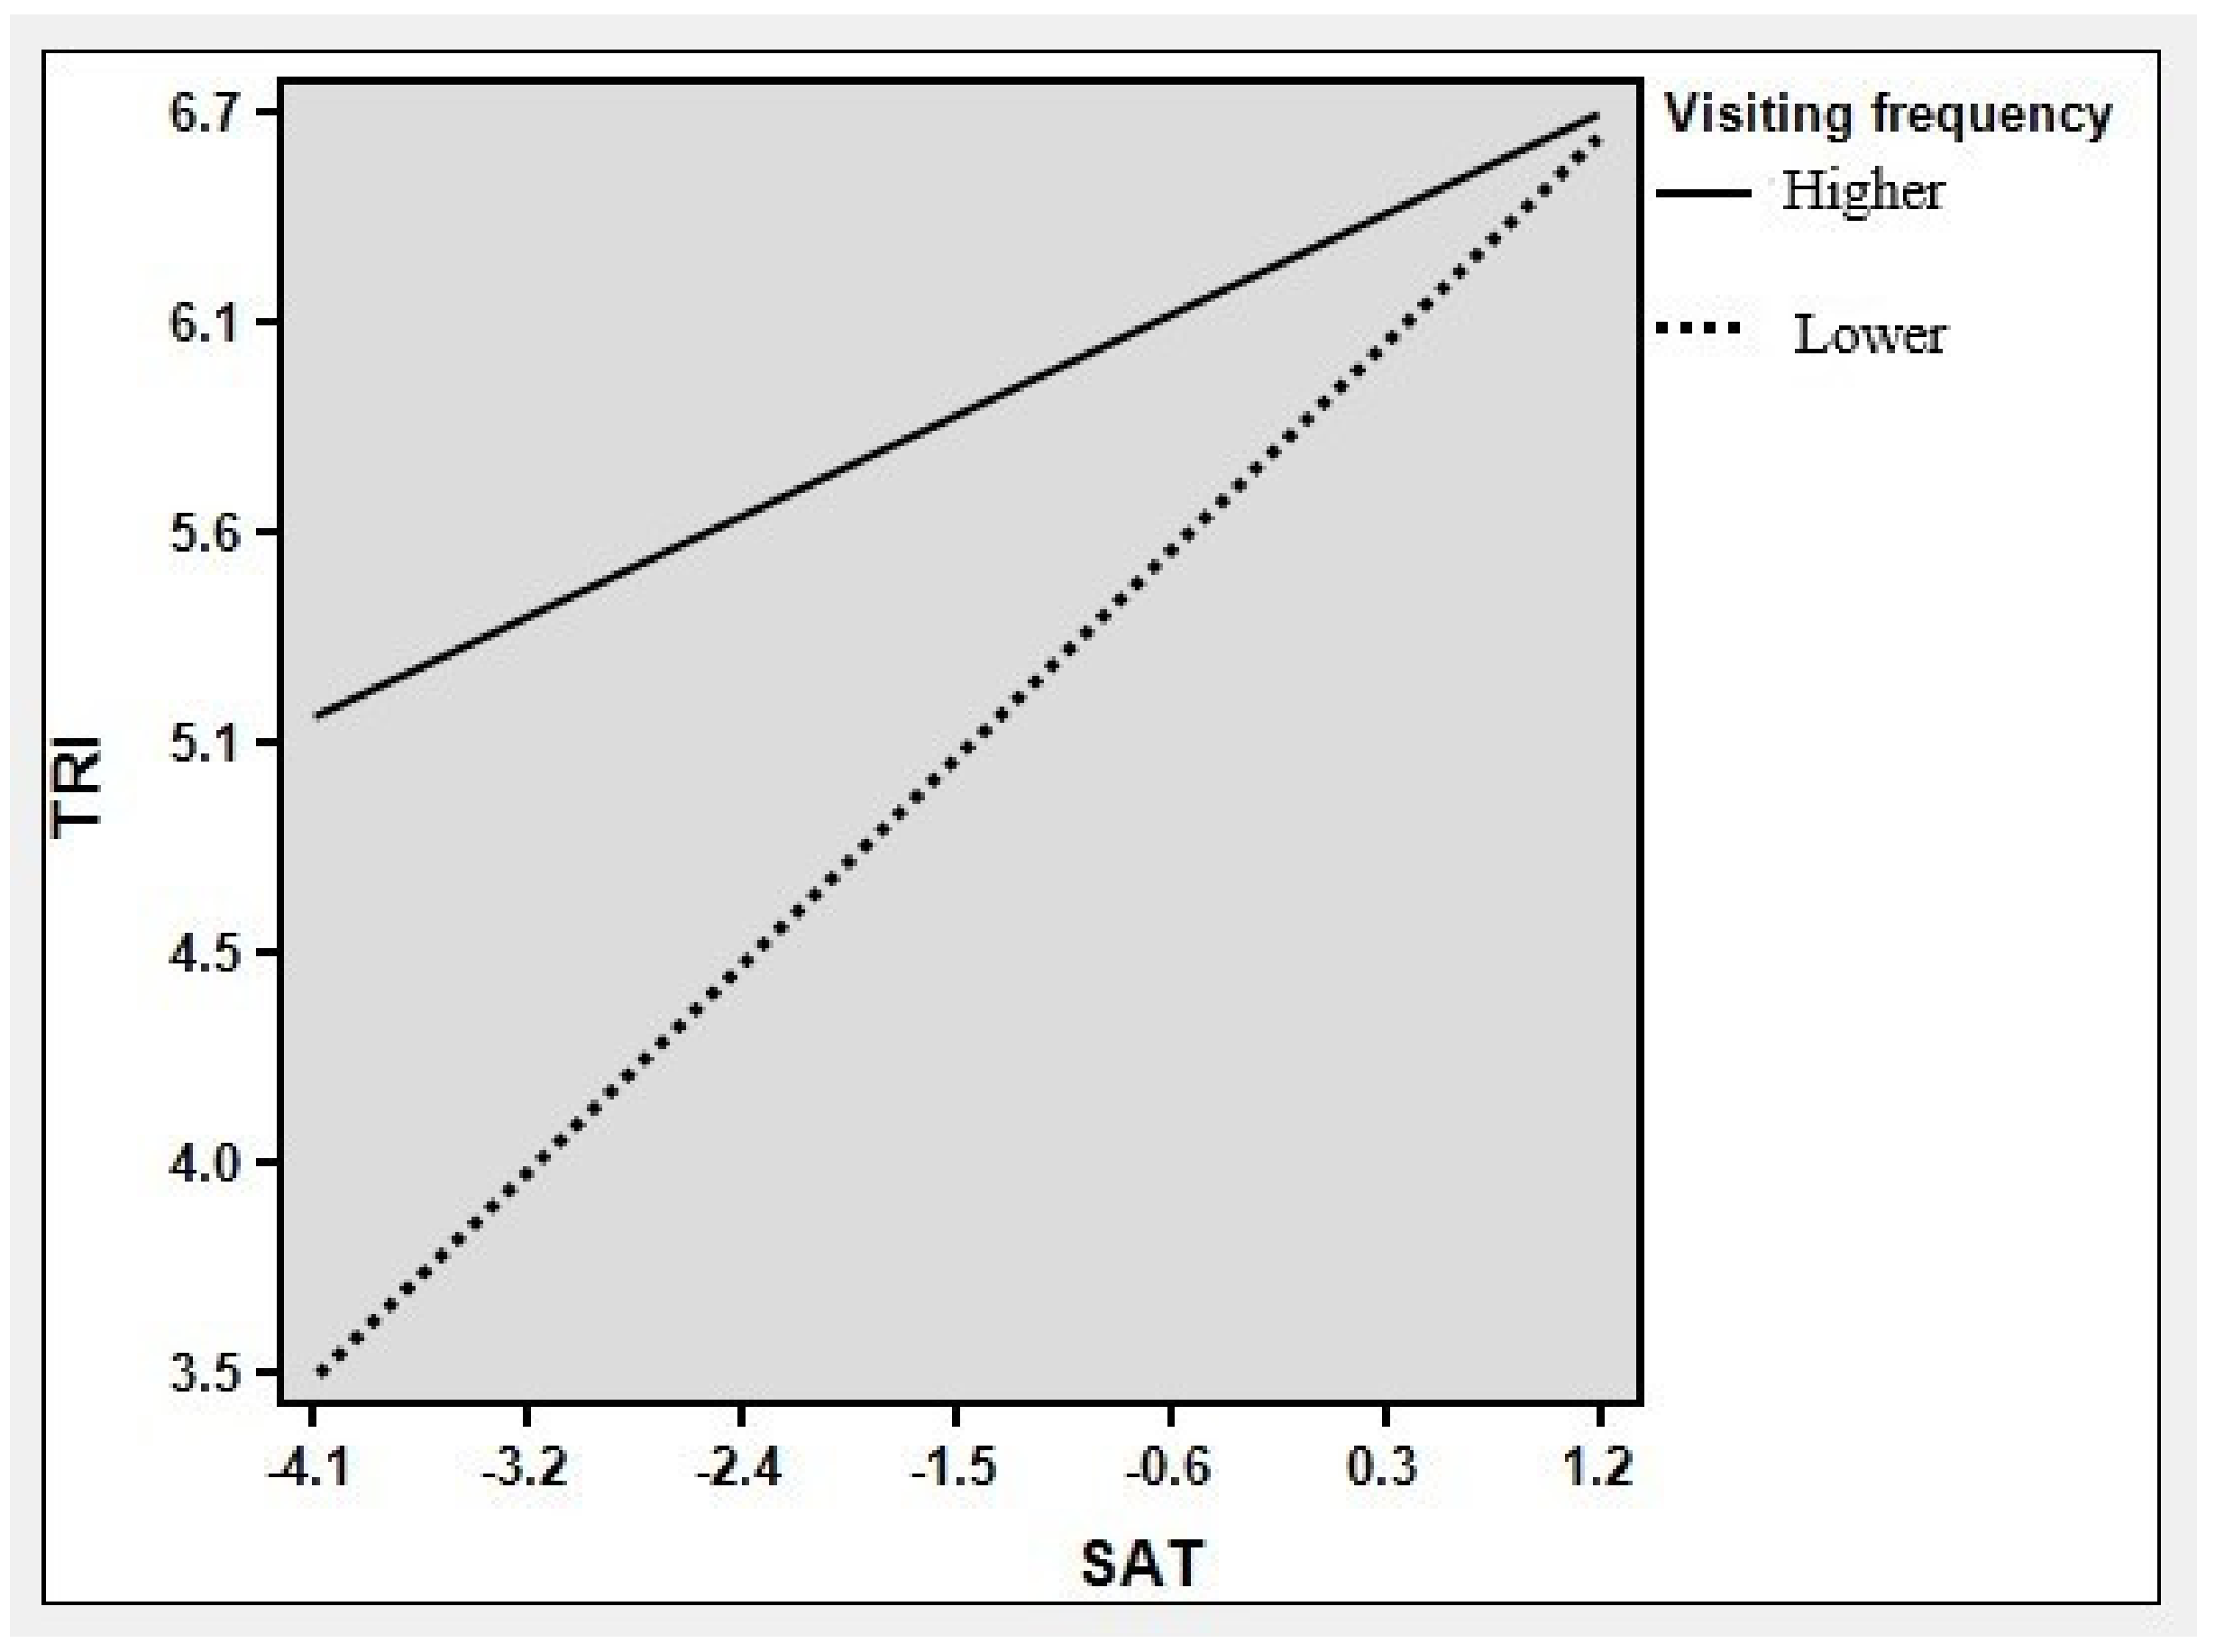
Following Hayes’ guidance [60], the moderation analysis was implemented based on the specifications of model 1 (designed for estimating, testing and probing interactions) of PROCESS as a simple moderation model to test H5a to H6b. The analytical results are reported in Table 6. First, in 2014, the overall moderation model had no significant effects. The interaction of TS and visiting frequency on TRI (t = −0.469, p > 0.05, CI = 0.83, 0.51) and the interaction of TPE and visiting frequency on TRI (t = 0.653, p > 0.05, CI = −0.055, 0.110), were not significantly related, H5a, H6a were not supported. In 2018, the interaction of TPE and visiting frequency on TRI (t = 0.653, p > 0.05, CI = −0.055, 0.110) was not significantly related, H5b was not supported. Meanwhile, the interaction of TS and visiting frequency on TRI (t = −0.268, p > 0.05, CI = −0.094, −0.015) was significant (zero is not in 95% CI), thus supporting H6b. In 2018, the result of the conditional effect of TS on TRI at values of visitors with lower visiting frequency was 0.495 (CI = 0.409, 0.580) compared to that of visitors with higher visiting frequency, which was 0.286 (CI = 0.135, 0.436). This illustrates that TS is critical to tourists when attending the tourism event, especially for visitors with lower visiting frequency. Figure 4 shows a typical diagram of the interaction effect. Compared with tourists with higher visiting frequency, the revisit intention of tourists with lower visiting frequency is more susceptible to satisfaction.

4.5. Comparison Between 2014 and 2018

To sum up, regardless of the year studied, female respondents were more than male ones. The average age of tourists in 2018 was larger than in 2014. Meanwhile, in these two years, more than 80% of tourists were not residents. This result is very different from previous studies in Taiwan. In the past, many studies have shown that most participants in tourism activities come from the local county where the event is held. This is one of the critical findings of our study.
While comparing to the visiting frequency of tourists in 2014, the number of first-time visitors decreased, and the number of revisit tourists increased by 9% in 2018. In 2014, repeat tourists participated in the TIBF for 3.02 times on average, and the average frequency of return visits in 2018 was 3.70. In other words, from 2014 to 2018, more and more tourists became returning visitors. In addition, in both 2014 and 2018, there were few respondents who had the experience of tethered flight, while fewer had the experience of free flight. More than 80% of tourists had no actual riding experience of a hot air balloon. However, compared with 2014, the number of visitors to the TIBF with actual cycling experience increased by 5% in 2018. This is to say that even though the TIBF has been held for eight years in 2018, there are still few tourists who have experienced hot air balloon rides. It is interesting that tourists may attend and visit the TIBF not for hot air balloon rides but for other unique purposes. Besides, the number of tourists driving to Luye Terrace increased by 15% in 2018 and the number of respondents planning to stay in Taitung County for more than two days also increased by 7%.
Under the S-O-R model of tourists in the TIBF, tourists’ perception of marketing strategies and motivation can both influence tourists’ revisit intention through tourists’ satisfaction and positive emotion. The eight hypotheses from H1a to H4b representing the mediating role of tourist satisfaction and tourist positive emotions are supported. All the mediation effects were partial mediation. Regarding the moderation effect, only the interaction between visiting frequency and tourist satisfaction exists in 2018 (H5a). That is, the higher and lower visiting frequency of tourists brings about different trends in the relationship between tourists’ satisfaction and revisit intention in 2018. Table 7 shows the validation of all hypotheses.

4.6. Comparison with Previous Research

According to the analytical results, H1a and H1b agree with Tanford and Jung [21], which proves a positive relationship between the festival environment (stimulus) and tourists’ satisfaction (organism) and supports a positive relationship between the festival environment and tourists’ revisit intention (response). In other words, in our study of the S-O-R model, tourists’ perception of marketing strategies of the festival was as the outside stimulus, which could improve tourist’s satisfaction and enhance their revisit intention to the TIBF. Besides, tourists’ revisit intention is influenced by tourists’ motivation, which is consistent with Prayag [22]. Tourists’ satisfaction in this study also has a mediation effect between tourists’ motivation and their revisit intention in both 2014 and 2018 (H2a, H2b). This result corresponds to the study of Kamboj et al. [10] that the motivation of customers positively influences their participation and significantly affects revisit intention.
Regarding the mediation effect of tourists’ positive emotions, it was found that there was still a partial mediation between tourists’ perception of marketing strategies, and their revisit intention through tourists’ positive emotions in both 2014 and 2018 (H3a, H3b). This finding extends the previous research of Islam et al. [18] that marketing strategies have a significant relationship with customer loyalty/revisit intention. Moreover, in 2014 and 2018, there was a partial mediation effect of tourists’ positive emotions between tourists’ motivation and their revisit intention (H4a, H4b). The results are consistent with a former study that positive emotion has significant impacts on tourists’ motivation and is related to future travel intention [28].
In addition, Hypothesis 5b indicated that visiting frequency will moderate the effect of tourists’ satisfaction on tourists’ revisit intention in 2018. Compared with tourists with higher visiting frequency, the revisit intention of tourists with lower visiting frequency is more susceptible to satisfaction. Our finding is like the result mentioned by Chi [57], that is, the loyalty of first-time (lower frequency) visitors will be more affected by satisfaction than repeat (higher frequency) visitors. However, H5a, H6a and H6b are also supported and like previous studies [58,59] that there were no significant differences between first-time (lower frequency) and repeat visitors (higher frequency) for tourists’ satisfaction and intention of recommendation. In 2014, the TIBF was just an emerging event in Taiwan. Some of the tourists possibly visited the TIBF in search of a novelty experience. However, in the first few years of the TIBF, there may not be much difference in the frequency of visits by tourists, which will not lead to a moderate effect. Relatively, in the eighth year of the TIBF in 2018, there were already quite a lot of tourists who had visited the TIBF, many of them had even experienced it more than one time. Hence, the moderation effect of visiting frequency exists.

5. Discussion and Conclusions

Drawing data from visitors who came to the Taiwan International Balloon Festival in 2014 and 2018, the relationships of tourists’ perception of marketing strategies, tourists’ motivation, tourists’ satisfaction, positive emotions and tourist revisit intention was revealed, especially regarding the mediating role of tourists’ positive emotions and tourists’ satisfaction in the S-O-R model. In summary, through the two-year study, tourists’ satisfaction can not only mediate the relationship between tourists’ perception of marketing strategies and tourists’ revisit intention but also can mediate the relationship between tourists’ motivation and tourists’ revisit intention. Meanwhile, the mediation effect of tourists’ positive emotions exists not only between the perception of marketing strategies and tourists’ revisit intention but also between tourists’ motivation and tourists’ revisit intention. Besides, the moderation effect of visiting frequency was also examined in this study. In 2018, the higher and the lower visiting frequency of tourists brings about different trends in the relationship between tourists’ satisfaction and revisit intention. The period of two years was conducted in this research in order to compare the results from the front and rear year.
How could an emerging event be sustainable in the tourism industry? How do emerging events impact tourists, residents and the environment? According to the definition of sustainable tourism by UNWTO [66]: “Tourism that takes full account of its current and future economic, social and environmental impacts, addressing the needs of visitors, the industry, the environment and host communities.” According to the information on the official website, in 2018, the number of tourists reached 910,000, and an output value of 67 million USD was created. On the other hand, in response to the needs of the people, the Taitung government extended the entire event period from 38 days to 45 days. The probability of economics in the tourism industry and the needs of the visitors are both critical parts of sustainable tourism. However, since the Taiwan International Hot Air Balloon Festival is an emerging event over the past decade, it is not so easy a task to achieve these goals. Regarding environmental issues, parking fees are collected by the government to balance the cost of garbage disposal. There was a parking discount for the residents of Taitung. Moreover, there was also a shuttle bus service from the downtown area of Taitung to the venue of the TIBF to relieve the traffic.
In addition, the needs of visitors are still one of the most critical parts of sustainable tourism. According to our two-year research findings, the moderation effect of visiting frequency only existed in 2018 (H5a). That is, the higher and the lower visiting frequency of tourists brings about different trends in the relationship between tourists’ satisfaction and revisit intention in 2018. In the tourism event, we can divide tourists into three categories: potential tourists, low visiting frequency or first-time tourists and high visiting frequency or repeat tourists. Each group may have its own unique needs. With the development of the tourist area life cycle [67], potential tourists have the chance to become lower visiting frequency (first-time) tourists, and lower visiting frequency (first-time) tourists may become higher visiting frequency (repeat) tourists. Even more, some repeat tourists or first-time tourists may also transform into potential tourists, which can be explained as they may decide not to participate in the event. In our two-year study, at the beginning of the TIBF in 2014, the moderation effect was not significant, indicating that tourists with lower or higher frequency had no differences in satisfaction and revisit intention. However, from our study in 2018, there was some difference between lower or higher frequency tourists. It is a critical issue for tourism managers and the local government to figure out the different motivations and the needs of these three groups of tourists rather than just pursuing an increase in the number of tourists. For example, high-frequency visitors may still participate in the TIBF but also want to learn about the natural environment or experience the local lifestyle in Taitung. Their intention to revisit is not only affected by the satisfaction from the TIBF. Perhaps they are expecting to attend the TIBF and have deeper and cultural travel experiences at the same time.

5.1. Theoretical Contributions and Managerial Implications

This two-year study reinforces the S-O-R model in the field of tourism research and explores the mediation effect of tourists’ satisfaction and positive emotions. First is the mediation effect of tourists’ satisfaction on the relationship of the perception of marketing strategies and tourists’ revisit intention; another is the influence of tourists’ satisfaction on tourists’ motivation and tourists’ revisit intention. The others are that tourists’ positive emotions mediate not only the relationship between tourists’ perception of marketing strategies and tourists’ revisit intention but also the relationship between tourists’ motivation and their revisit intention.
Additionally, the stimulus of the S-O-R model came from not only the external environment as viewed through tourists’ perception of marketing strategies but also from the internal stimulus of tourists’ motivation. Regarding the organism, we also tried to discuss both the cognitive (satisfaction) and affective (positive emotions) status of tourists. From the multiple constructs, one can more fully understand the S-O-R model.
Finally, the most important contribution of this research is using multi-year data. Most previous research in the field of tourism only collected data for a certain year. However, a successful festival of loyalty can motivate tourists to revisit a destination. This study compares results from different years and provides a more sustainable direction of tourism events. Due to this, the moderation effect of the visiting frequency can be found out. On the other hand, expecting to provide important implications for tourism scholars, industry practitioners and local governments.

5.2. Future Research and Limitations

The findings of this analysis provide a foundation for future research on ways to enhance tourists’ satisfaction and revisit intention. In the present study, we found tourists’ perception of marketing strategies is a latent factor in tourism events. Tanford and Jung [21] have suggested that festival planners must focus on providing an enjoyable program at a reasonable price in a comfortable environment. In fact, one of the reasons that only fewer tourists have experienced hot air balloon rides is probably the high price. A more detailed discussion of marketing strategies could be conducted in future research. Moreover, an individual study cannot measure all the variables that contribute to the process. In a future study, consecutive years of research could be done to find more detailed information about visitors. Besides, the research method of meta-analysis could be applied to provide broader generalities, which could be evaluated further with SEM or other statistic methods.

Author Contributions

Conceptualization, W.C., H.T. and H.C.; Methodology, W.C. and P.L.; Investigation, W.C. and T.H.; Data curation, W.C. and P.L., Writing—original draft preparation, W.C. and H.C.; Writing—review and editing, H.T. and W.C. Project Administration, W.C. and T.H. All authors have read and agreed to the published version of the manuscript.

Funding

This research received no external funding.

Acknowledgments

We acknowledge the support of the Shantou University Business School for investigation. We also thank the anonymous reviewers and the editor for their comments.

Conflicts of Interest

The authors declare no conflict of interest.

References

  1. Huang, J.Z.; Li, M.; Cai, L.A. A model of community-based festival image. Int. J. Hosp. Manag. 2010, 29, 254–260. [Google Scholar] [CrossRef]
  2. Chen, W.H.; Chu, C.M.; Chen, W.C. A study of policy transfer theory on analyzing hot air balloon sightseeing activities in Taiwan. J. Leis. Tour. Sport Health 2016, 6, 75–101. [Google Scholar]
  3. Li, J.; Zhu, A.; Liu, D.; Zhao, W.; Zhou, Y.; Chen, Y.; Liu, Y.; Sun, N. Sustainability of China’s Singles Day Shopping Festivals: Exploring the Moderating Effect of Fairness Atmospherics on Consumers’ Continuance Participation. Sustainability 2020, 12, 2644. [Google Scholar] [CrossRef] [Green Version]
  4. Chi, C.G.Q.; Qu, H. Examining the structural relationships of destination image, tourist satisfaction and destination loyalty: An integrated approach. Tour. Manag. 2008, 29, 624–636. [Google Scholar] [CrossRef]
  5. Mehrabian, A.; Russell, J.A. An Approach to Environmental Psychology; MIT Press: Cambridge, MA, USA, 1974. [Google Scholar]
  6. Chang, K.C. How reputation creates loyalty in the restaurant sector. Int. J. Contemp. Hosp. Manag. 2013, 25, 536–557. [Google Scholar] [CrossRef]
  7. Grace, D.; Ross, M.; Shao, W. Examining the relationship between social media characteristics and psychological dispositions. Eur. J. Mark. 2015, 49, 1366–1390. [Google Scholar] [CrossRef] [Green Version]
  8. Luqman, A.; Cao, X.; Ali, A.; Masood, A.; Yu, L. Empirical investigation of Facebook discontinues usage intentions based on SOR paradigm. Comput. Hum. Behav. 2017, 70, 544–555. [Google Scholar] [CrossRef]
  9. Zhuang, M.; Zhang, J.; Xiao, X.; Qiu, M.; Lu, Y.; Zhang, H.; Tseng, T.H.; Zuo, L.; Hu, M. How destination music affects tourists’ behaviors: Travel with music in Lijiang, China. Asia Pac. J. Tour. Res. 2020, 25, 131–144. [Google Scholar] [CrossRef]
  10. Kamboj, S.; Sarmah, B.; Gupta, S.; Dwivedi, Y. Examining branding co-creation in brand communities on social media: Applying the paradigm of stimulus-organism-response. Int. J. Info. Manag. 2018, 39, 169–185. [Google Scholar] [CrossRef] [Green Version]
  11. Chen, V.; King, B.E.M.; Suntikul, W. Festivalscapes and the visitor experience: An application of the stimulus organism response approach. Int. J. Tour. Res. 2019, 21, 758–771. [Google Scholar] [CrossRef]
  12. Jacoby, J. Stimulus-Organism-Response reconsidered: An evolutionary step in modelling (consumer) behavior. J. Consum. Psych. 2002, 12, 51–57. [Google Scholar] [CrossRef]
  13. Peng, C.; Kim, Y.G. Application of the stimuli-organism-response (SOR) framework to online shopping behavior. J. Int. Commer. 2014, 13, 159–176. [Google Scholar] [CrossRef]
  14. Su, L.; Swanson, S.R.; Chen, X. The impact of perceived service fairness and quality on the behavioral intentions of Chinese hotel guests: The mediating role of consumption emotions. J. Travel Tour. Mark. 2016, 33, 88–102. [Google Scholar] [CrossRef]
  15. Bagozzi, R.P. Principles of Marketing Management; Science Research Associates Inc.: Chicago, IL, USA, 1986. [Google Scholar]
  16. Wei, Y.; Wang, Q. Making sense of a market information system for superior performance: The roles of organizational responsiveness and innovation strategy. Ind. Mark. Manag. 2011, 40, 267–277. [Google Scholar] [CrossRef]
  17. Roxas, B.; Chadee, D. Effects of formal institutions on the performance of the tourism sector in the Philippines: The mediating role of entrepreneurial orientation. Tour. Manag. 2013, 37, 1–12. [Google Scholar] [CrossRef]
  18. Islam, M.; Yang, Y.F.; Hu, Y.J.; Hsu, C.S. Marketing mix, service quality and loyalty—In perspective of customer-centric view of balanced scorecard approach. Account. Account. Perform. 2013, 18, 1–18. [Google Scholar]
  19. Gnoth, J. Motivation and expectation formation. Ann. Tour. Res. 1997, 24, 283–304. [Google Scholar] [CrossRef]
  20. Mathesona, C.M.; Rimmerb, R.; Tinsley, R. Spiritual attitudes and visitor motivations at the Beltane Fire Festival, Edinburgh. Tour. Manag. 2014, 44, 16–33. [Google Scholar] [CrossRef] [Green Version]
  21. Tanford, S.; Jung, S. Festival attributes and perceptions: A meta-analysis of relationships with satisfaction and loyalty. Tour. Manag. 2017, 61, 209–220. [Google Scholar] [CrossRef]
  22. Prayag, G. Senior travelers’ motivations and future behavioral intentions: The case of Nice. J. Travel Tour. Market. 2012, 29, 665–681. [Google Scholar] [CrossRef]
  23. Dean, D.; Suhartanto, D. The formation of visitor behavioral intention to creative tourism: The role of push–pull motivation. Asia Pac. J. Tour. Res. 2019, 24, 393–403. [Google Scholar] [CrossRef]
  24. Oliver, R.L. Satisfaction: A Behavioral Perspective on the Consumer; McGraw-Hill Inc: New York, NY, USA, 1997. [Google Scholar]
  25. Yoshida, M.; James, J.D. Customer satisfaction with games and service experiences: Antecedents and consequences. J. Sport Manag. 2010, 24, 338–361. [Google Scholar] [CrossRef]
  26. Oliver, R.L. Cognitive, affective and attribute bases of satisfaction response. J. Consum. Res. 1993, 20, 418–430. [Google Scholar] [CrossRef]
  27. Hosany, S.; Prayag, G. Patterns of tourists’ emotional responses, satisfaction, and intention to recommend. J. Bus. Res. 2013, 66, 733–737. [Google Scholar] [CrossRef]
  28. Jang, J.; Namkung, Y. Perceived quality, emotions and behavioural intentions: Application of an extended Mehrabian–Russell model to restaurants. J. Bus. Res. 2009, 62, 451–460. [Google Scholar] [CrossRef]
  29. Lee, Y.K.; Lee, C.K.; Lee, S.K.; Babin, B.J. Festivalscapes and patrons’ emotions, satisfaction, and loyalty. J. Bus. Res. 2008, 61, 56–64. [Google Scholar] [CrossRef]
  30. Jang, Y.; Kim, W.; Lee, H.Y. Coffee shop consumers’ emotional attachment and loyalty to green stores: The moderating role of green consciousness. Int. J. Hosp. Manag. 2015, 44, 146–156. [Google Scholar] [CrossRef]
  31. Song, J.; Qu, H. The mediating role of consumption emotions. Int. J. Hosp. Manag. 2017, 66, 66–76. [Google Scholar] [CrossRef]
  32. Lin, Y.; Nawijn, J. The impact of travel motivation on emotions: A longitudinal study. J. Destin. Market. Manag. 2020, 16, 100363. [Google Scholar] [CrossRef]
  33. Han, H.; Jeong, C. Multi-dimensions of patrons’ emotional experiences in upscale restaurants and their role in loyalty formation: Emotion scale improvement. Int. J. Hosp. Manag. 2013, 32, 59–70. [Google Scholar] [CrossRef]
  34. Jani, D.; Han, H. Influence of environmental stimuli on hotel customer emotional loyalty response: Testing the moderating effect of the big five personality factors. Int. J. Hosp. Manag. 2015, 44, 48–57. [Google Scholar] [CrossRef]
  35. Virto, N.R.; Punzón, J.G.; López, M.F.B.; Figueiredo, J. Perceived relationship investment as a driver of loyalty: The case of Conimbriga Monographic Museum. J. Destin. Market. Manag. 2019, 11, 23–31. [Google Scholar] [CrossRef]
  36. Eusébio, C.; Vieira, A. Destination attributes’ evaluation, satisfaction and behavioural intentions: A structural modelling approach. Int. J. Tour. Res. 2013, 15, 66–80. [Google Scholar] [CrossRef]
  37. Bigne, J.E.; Sanchez, M.I.; Sanchez, J. Tourism Image, Evaluation Variables and After Purchez Behavior: Inter-relationship. Tour. Manag. 2001, 22, 607–616. [Google Scholar] [CrossRef]
  38. Grappi, S.; Montanari, F. The role of social identification and hedonism in affecting tourist re-patronizing behaviours: The case of an Italian festival. Tour. Manag. 2011, 32, 1128–1140. [Google Scholar] [CrossRef] [Green Version]
  39. Mason, M.C.; Paggiaro, A. Investigating the role of festival scape in culinary tourism: The case of food and wine events. Tour. Manag. 2012, 33, 1329–1336. [Google Scholar] [CrossRef]
  40. Animesh, A.; Pinsonneault, A.; Yang, S.B.; Oh, W. An odyssey into virtual Worlds: Exploring the impacts of technological and spatial environments. MIS Q 2011, 35, 789–810. [Google Scholar] [CrossRef] [Green Version]
  41. Zhang, H.; Lu, Y.; Gupta, S.; Zhao, L. What motivates customers to participate in social commerce? The impact of technological environments and virtual customer experiences. Inf. Manag. 2014, 51, 1017–1030. [Google Scholar]
  42. Morgan, N.A.; Vorhies, D.W.; Mason, C.H. Market orientation, marketing capabilities, and firm performance. Strateg. Manag. J. 2009, 30, 909−920. [Google Scholar] [CrossRef]
  43. Charoensettasilp, S.; Wu, C. Thai consumers satisfaction after receiving services from Thailand’s newest low-cost airline. Appl. Mech. Mater. 2014, 505, 767–777. [Google Scholar] [CrossRef]
  44. Thamrin, H.M. The role of service marketing mix and ship service quality towards perceived value and its impact to ship passenger’s satisfaction in Indonesia. Global J. Manag. Bus. Res. 2012, 12, 97–101. [Google Scholar]
  45. Tridhoskul, P. Customers’ perception towards the service marketing mix and frequency of use of Mercedes Benz. Int. J. Soc. Manag. Econ. Bus. Eng. 2014, 8, 1945–1947. [Google Scholar]
  46. Brown, G.; Assaker, G.; Reis, A. Visiting Fortaleza: Motivation, satisfaction and revisit intentions of spectators at the Brazil 2014 FIFA World Cup. J. Sport Tour. 2018, 22, 1–19. [Google Scholar] [CrossRef]
  47. Devesa, M.; Laguna, M.; Palacios, A. The role of motivation in visitor satisfaction: Empirical evidence in rural tourism. Tour. Manag. 2010, 31, 547–552. [Google Scholar] [CrossRef]
  48. Chen, C.F.; Chen, F.S. Experience quality, perceived value, satisfaction and behavioral intentions for heritage tourists. Tour. Manag. 2010, 31, 29–35. [Google Scholar] [CrossRef]
  49. Choo, H.; Ahn, K.; Petrick, J.F. An integrated model of festival revisit intentions: Theory of planned behavior and festival quality/ satisfaction. Int. J. Contemp. Hosp. Manag. 2016, 28, 818–838. [Google Scholar] [CrossRef]
  50. Parsa, H.G.; Gregory, A.; Self, J.T.; Dutta, K. Consumer behaviour in restaurants: Assessing the importance of restaurant attributes in consumer patronage and willingness to pay. J. Serv. Res. 2012, 12, 29–56. [Google Scholar]
  51. Bigne´, J.E.; Mattila, A.S.; Andreu, L. The impact of experimental consumption cognitions and emotions on behavioural intentions. J. Serv. Mark. 2008, 22, 303–315. [Google Scholar] [CrossRef]
  52. Lin, W.C.; Liang, G.S. Applying fuzzy zot to explore the customer service quality to the ocean freight forwarder industry in emerging Taiwan market. Res. J. Bus. Manag. 2011, 5, 77–88. [Google Scholar] [CrossRef] [Green Version]
  53. Jang, S.; Bai, B.; Hu, C.; Wu, C.E. Affect, travel motivation, and travel intention: A senior market. J. Hosp. Tour. Res. 2009, 33, 51–73. [Google Scholar] [CrossRef]
  54. Scott, D. A comparison of visitors’ motivations to attend three urban festivals. Int. J. Event Festiv. Manag. 1995, 3, 121–128. [Google Scholar]
  55. Frías-Jamilena, D.M.; Castaeda-García, J.A.; Del Barrio-García, S. Self-congruity and motivations as antecedents of destination perceived value: The moderating effect of previous experience. Int. J. Tour. Res. 2019, 21, 23–36. [Google Scholar] [CrossRef] [Green Version]
  56. Yolal, M.; Chi, C.G.Q.; Pesämaa, O. Examine destination loyalty of first-time and repeat visitors at all-inclusive resorts. Int. J. Contemp. Hosp. Manag. 2017, 29, 1834–1853. [Google Scholar] [CrossRef]
  57. Chi, C.G.Q. An examination of destination loyalty differences between first-time and repeat visitors. J. Hosp. Tour. Res. 2012, 36, 3–24. [Google Scholar] [CrossRef]
  58. Shavanddasht, M.; Allan, M. First-time versus repeat tourists: Level of satisfaction, emotional involvement, and loyalty at hot spring. Anatolia 2018, 30, 61–74. [Google Scholar] [CrossRef]
  59. Čaušević, A.; Mirić, R.; Drešković, N.; Hrelja, E. First-time and repeat visitors to Sarajevo. Eur. J. Tour. Hosp. Recreat. 2020, 10, 14–27. [Google Scholar] [CrossRef]
  60. Hayes, A.F. An Introduction to Mediation, Moderation, and Conditional Process Analysis: A Regression-based Approach; Guilford Press: New York, NY, USA, 2013. [Google Scholar]
  61. Preacher, K.J.; Hayes, A.F. Asymptotic and resampling strategies for assessing and comparing indirect effects in multiple mediator models. Behav. Res. Methods 2008, 40, 879–891. [Google Scholar] [CrossRef]
  62. Nunnally, J.C. Psychometric Theory, 2nd ed.; McGraw-Hill: New York, NY, USA, 1978. [Google Scholar]
  63. Bagozzi, R.P.; Yi, Y.; Phillips, L.W. Assessing construct validity in organizational research. Adm. Sci. Q. 1991, 36, 421–458. [Google Scholar] [CrossRef]
  64. Fornell, C.; Larcker, D.F. Evaluating structural equation models with unobservable variables and measurement error. J. Market. Res. 1981, 18, 39–50. [Google Scholar] [CrossRef]
  65. Hair, J.F.; Anderson, R.E.; Tatham, R.L.; Black, W.C. Multivariate Data Analysis, 5th ed.; Prentice Hall: Upper Saddle River, NJ, USA, 1998. [Google Scholar]
  66. UNWTO & UNEP. Making Tourism More Sustainable: A Guide for Policy Makers; UNWTO, Madrid & UNEP: Paris, France, 2005. [Google Scholar]
  67. Butler, R.W. The concept of the tourist area life-cycle of evolution: Implications for management of resources. Can. Geogr. 1980, 24, 5–12. [Google Scholar] [CrossRef]
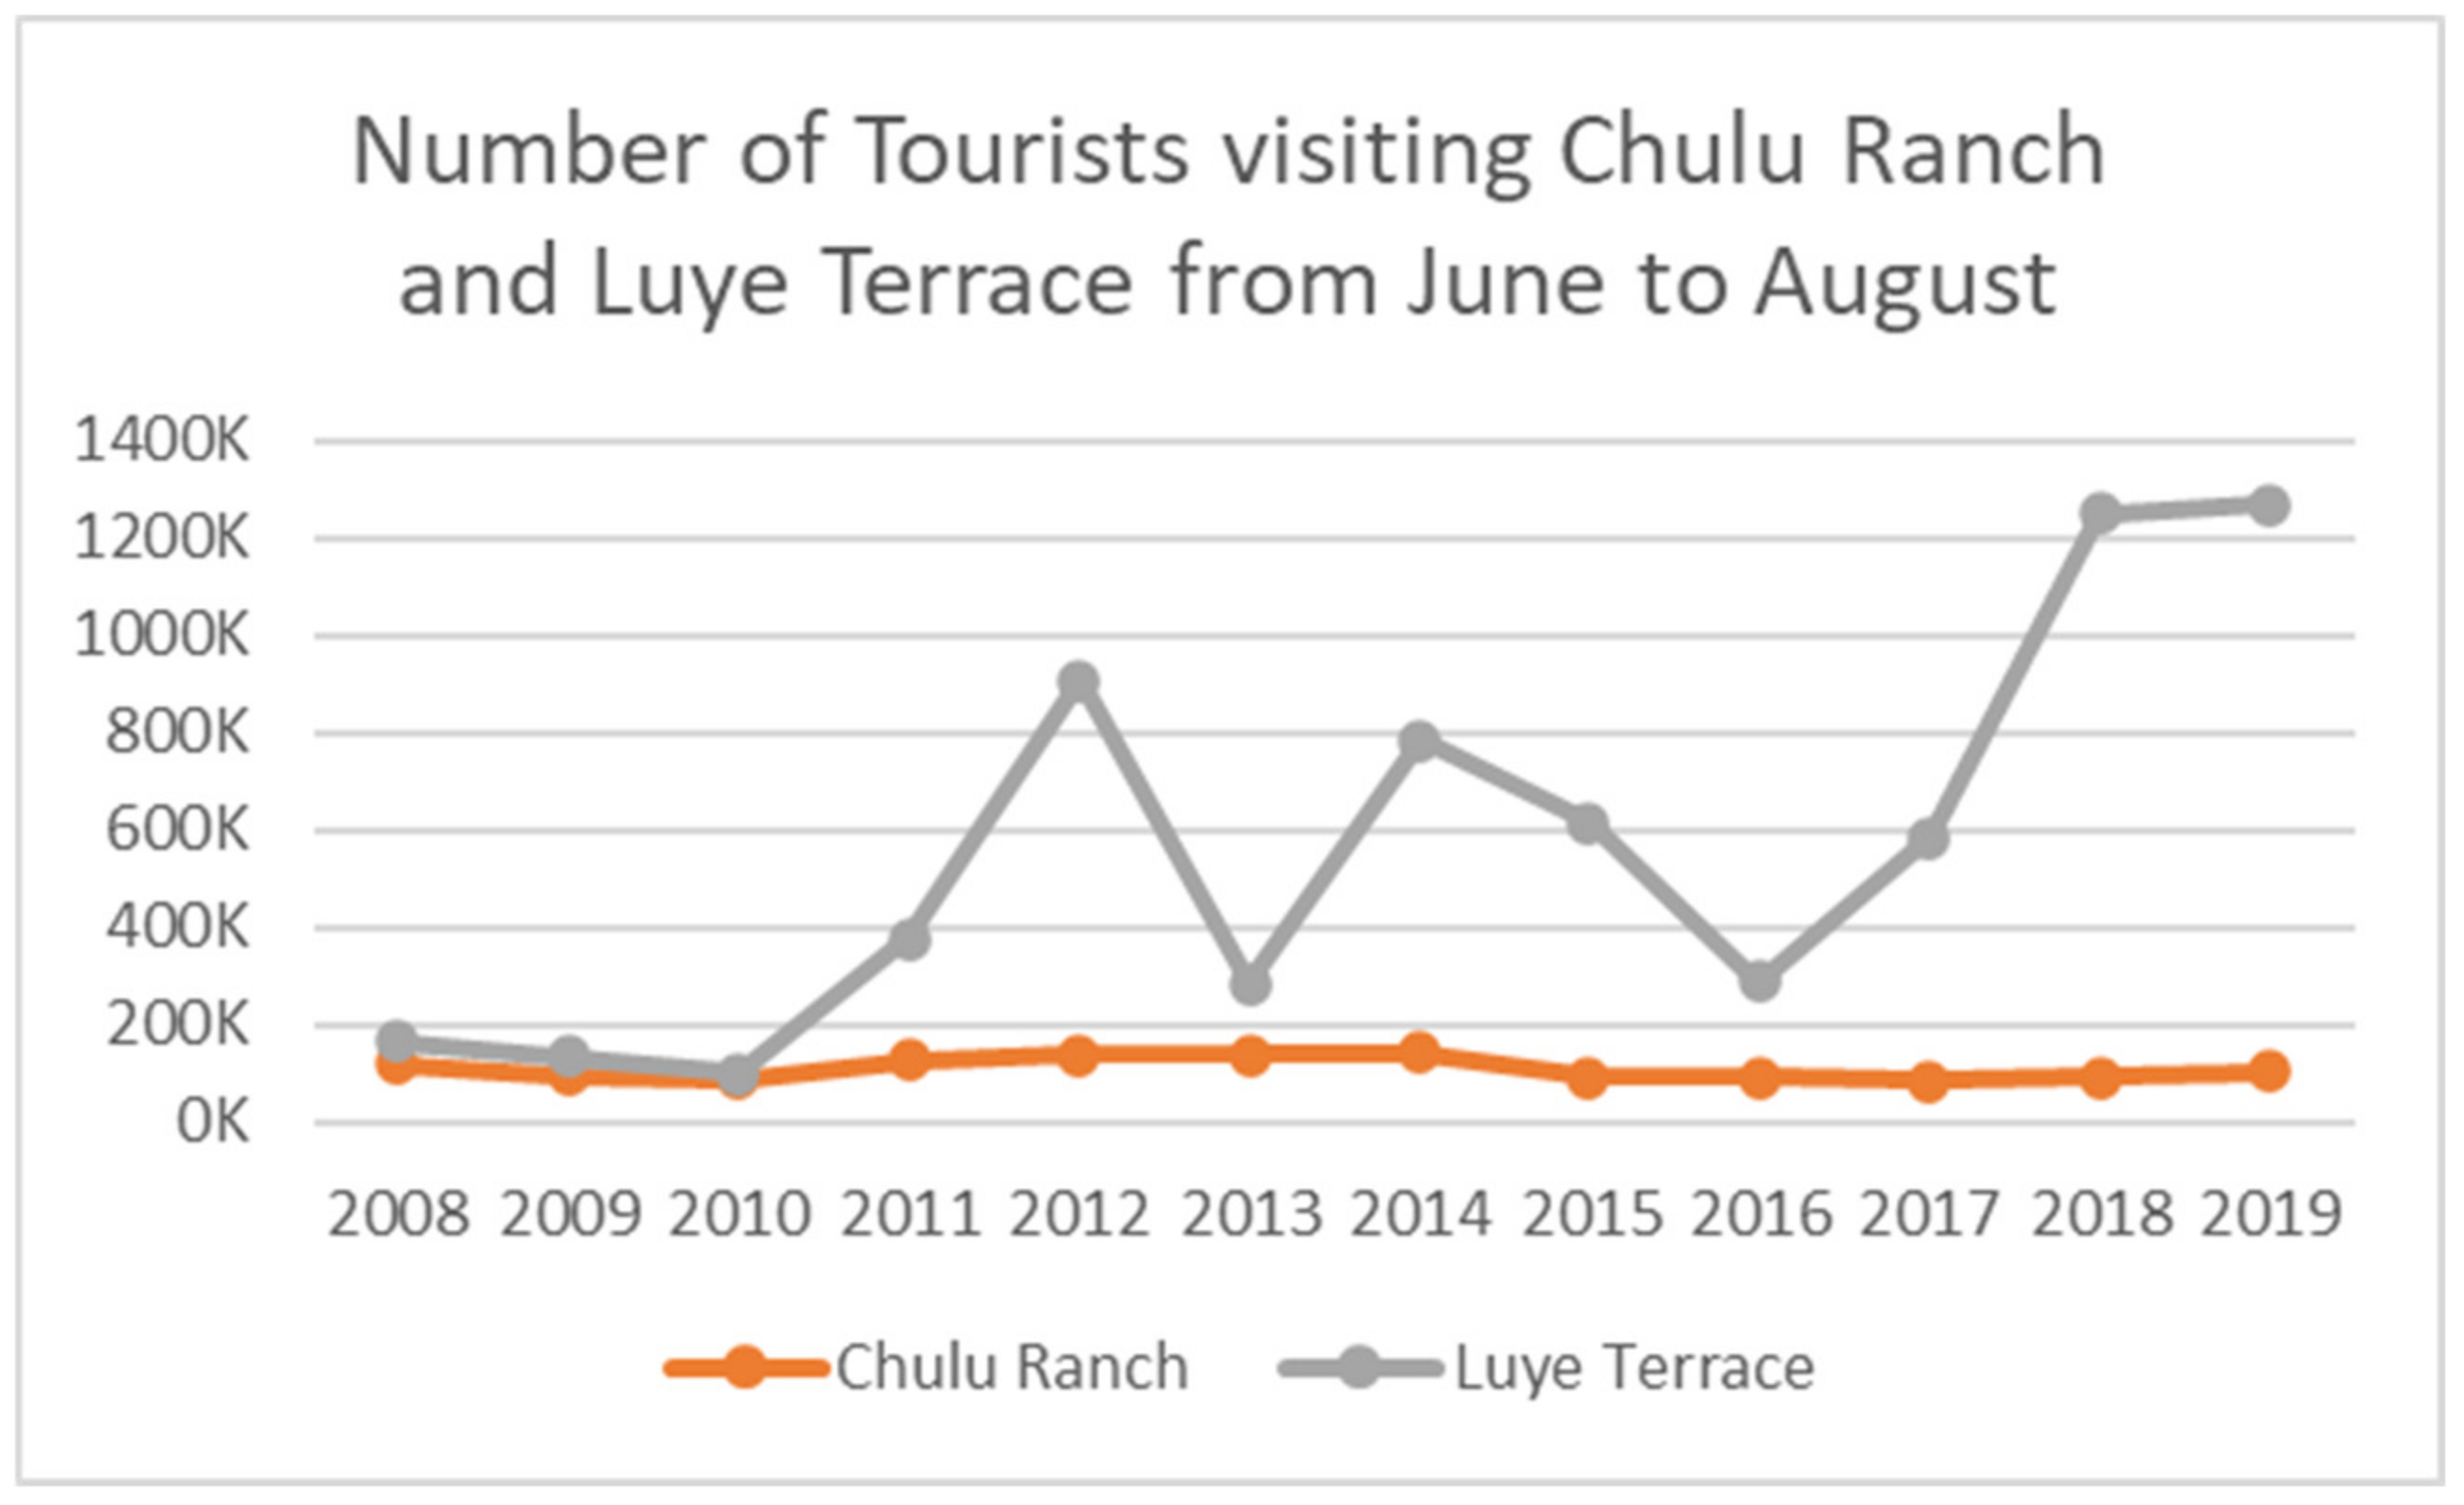
Figure 1. Number of tourists visiting Chulu Ranch and Luye Terrace.
Sustainability 12 10075 g001
Figure 2. Number of tourists visiting Luye Terrace during June, July and August in 2008–2020.
Sustainability 12 10075 g002
Figure 3. The S-O-R model of tourists in the TIBF.
Sustainability 12 10075 g003
Figure 4. The interaction effect of visiting frequency between TS and TRI in 2018.
Sustainability 12 10075 g004
Table 1. Numbers of tourists visiting Luye Terrace and the duration of the TIBF.
YearJuneJulyAugustDurationDays
200832,64077,01455,862
200933,44780,75119,196
201027,68948,15922,140
201119,881183,513172,7897/8–8/3139
201223,118407,483477,1006/29–9/266
201379,711117,79586,0746/1–8/1172
2014221,130339,150223,8325/30–8/1072
201590,399384,908140,2976/27–8/944
201633,839126,446126,4467/1–8/738
201745,905336,170200,9026/30–8/638
2018117,386643,531490,0036/30–8/1345
2019168,867719,987380,6046/29–8/1245
202052,198580,650 7/11–8/3051
Table 2. Demographic profile of the sample in 2014 and 2018.
Variable 20142018Variable 20142018
n = 527
(100%)
n = 369
(100%)
n = 527
(100%)
n = 369
(100%)
GenderMale40.444Riding ExperienceNone87.782.8
Female59.655.4 Tethered10.411.4
AgeUnder 2015.411.7 Free0.95.8
21–3041.734.3CompanionAlone34.2
31–4027.334.6 1 to 234.731.9
41–5013.316.1 3 to 542.347.1
Over 512.33.3 Over 619.916.9
EducationHigh school16.315.4length of stayHalf day8.35.5
Associate14.415.2 1 day18.815
Bachelor54.553.7 2 days34.939.3
Master14.815.5 3 days3840.2
Place of residenceNorth32.128TransportBike0.90.8
Central14.821.3 Motor19.211.4
South26.223.3 Automobile60.575.3
Taitung14.417.7 Bus9.18.6
another east7.47.2 Shuttle81.4
Other52.5 other2.32.5
FrequencyFirst-time69.660.9
Revisit30.439.1
Repeat-Mean3.023.70
Table 3. Descriptive statistics and correlations of constructs in 2014 & 2018.
VariablesαMeanSDAVE12345
2014
1. MS0.725.670.770.57(0.755)
2. TM0.845.100.990.530.351 **(0.728)
3. TS0.835.610.920.760.606 **0.361 **(0.872)
4. TPE0.776.200.770.820.441 **0.283 **0.497 **(0.905)
5. TRI0.885.820.970.900.527 **0.361 **0.657 **0.552 **(0.953)
2018
1. MS0.685.810.740.70(.837)
2. TM0.895.340.910.600.245 **(.774)
3. TS0.805.790.880.650.368 **0.255 **(0.806)
4. TPE0.846.300.710.810.257 **0.106 *0.255 **(0.900)
5. TRI0.736.090.820.710.242 **0.192 **0.403 **0.240 **(0.843)
Note: Diagonal elements are square AVE, off diagonal elements are Pearson correlations. ** p < 0.01.
Table 4. The results of regression models for testing of mediation in 2014 and 2018.
2014 (a)2018 (b)
Model-1Model-2Model-3Model-1Model-2Model-3
H1TS(M1)TRI(Y)TRI(Y)TS(M1)TRI(Y)TRI(Y)
MS(X)
TS(M1)
a = 0.720 ***b = 0.664 ***b’ = 0.256 ***
c = 0.566 ***
a = 0.530 ***b = 0.369 ***b’ = 0.148 ***
c = 0.415 ***
H2
TM(X)
TS(M1)
TS(M1)
a = 0.328 ***

b = 0.349 ***

b’ = 0.138 ***
c = 0.642 ***
TS(M1)
a = 0.305 ***

b = 0.220 ***

b’ = 0.085 **
c = 0.443 ***
H3
MS(X)
TPE(M2)
TPE(M2)
a = 0.440 ***

b = 0.664 ***

b’ = 0.443 ***
c = 0.501 ***
TPE(M2)
a = 0.237 ***

b = 0.369 ***

b’ = 0.291 ***
c = 0.330 ***
H4
TM(X)
TPE(M2)
TPE(M2)
a = 0.216 ***

b = 0.349 ***

b’ = 0.215 ***
c = 0.618 ***
TPE(M2)
a = 0.155 ***

b = 0.220 ***

b’ = 0.164 ***
c = 0.363 ***
Note: 2014 (N = 527); 2018 (N = 369). * p < 0.05. ** p < 0.01. ** p < 0.001.
Table 5. Model 4 for the test of mediation in 2014 and 2018.
Mediation PathsBootstrap 5000 95% Confidence Interval
20142018
EffectSELLCIULCIEffectSELLCIULCI
Ind.1 MS→TS→TRI
Ind.2 TM→TS→TRI
0.407
0.211
0.053
0.033
0.307
0.152
0.520
0.279
0.220
0.136
0.039
0.029
0.151
0.083
0.303
0.196
Ind.3 MS→TPE→TRI
Ind.4 TM→TPE→TRI
0.220
0.134
0.031
0.033
0.164
0.070
0.285
0.200
0.078
0.056
0.022
0.023
0.041
0.018
0.128
0.108
Table 6. Model 1 for the test of moderation effects of visiting frequency of tourists.
Paths Bootstrap 5000 95% Confidence Interval
(Visiting Frequency as Moderator)20142018
Coeff.tLLCIULCICoefftLLCIULCI
Path 1 TS→TRI−0.016−0.469−0.0830.051−0.054 **−0.268−0.094−0.015
Path 2 TPE→TRI0.0270.653−0.055,0.110−0.0480.653−0.1040.008
Note: ** p < 0.01. *** p < 0.001.
Table 7. Validation of Hypotheses.
Hypothesis RelationshipValidation of Hypotheses
20142018
H1: TS will mediate the relationship between MS and TRI.H1aVH1bV
H2: TS will mediate the relationship between TM and TRI.H2aVH2bV
H3: TPE will mediate the relationship between MS and TRI.H3aVH3bV
H4: TPE will mediate the relationship between TM and TRI.H4aVH4bV
H5: Visiting frequency moderates the effect of TS on TRI.H5aXH5bV
H6: Visiting frequency moderates the effect of TPE on TRI.H6aXH6bX
Publisher’s Note: MDPI stays neutral with regard to jurisdictional claims in published maps and institutional affiliations.