Trends and Future Directions in Crop Energy Analyses: A Focus on Iran


Abstract
1. Introduction
1.1. Rationale of the Review
1.2. Objectives
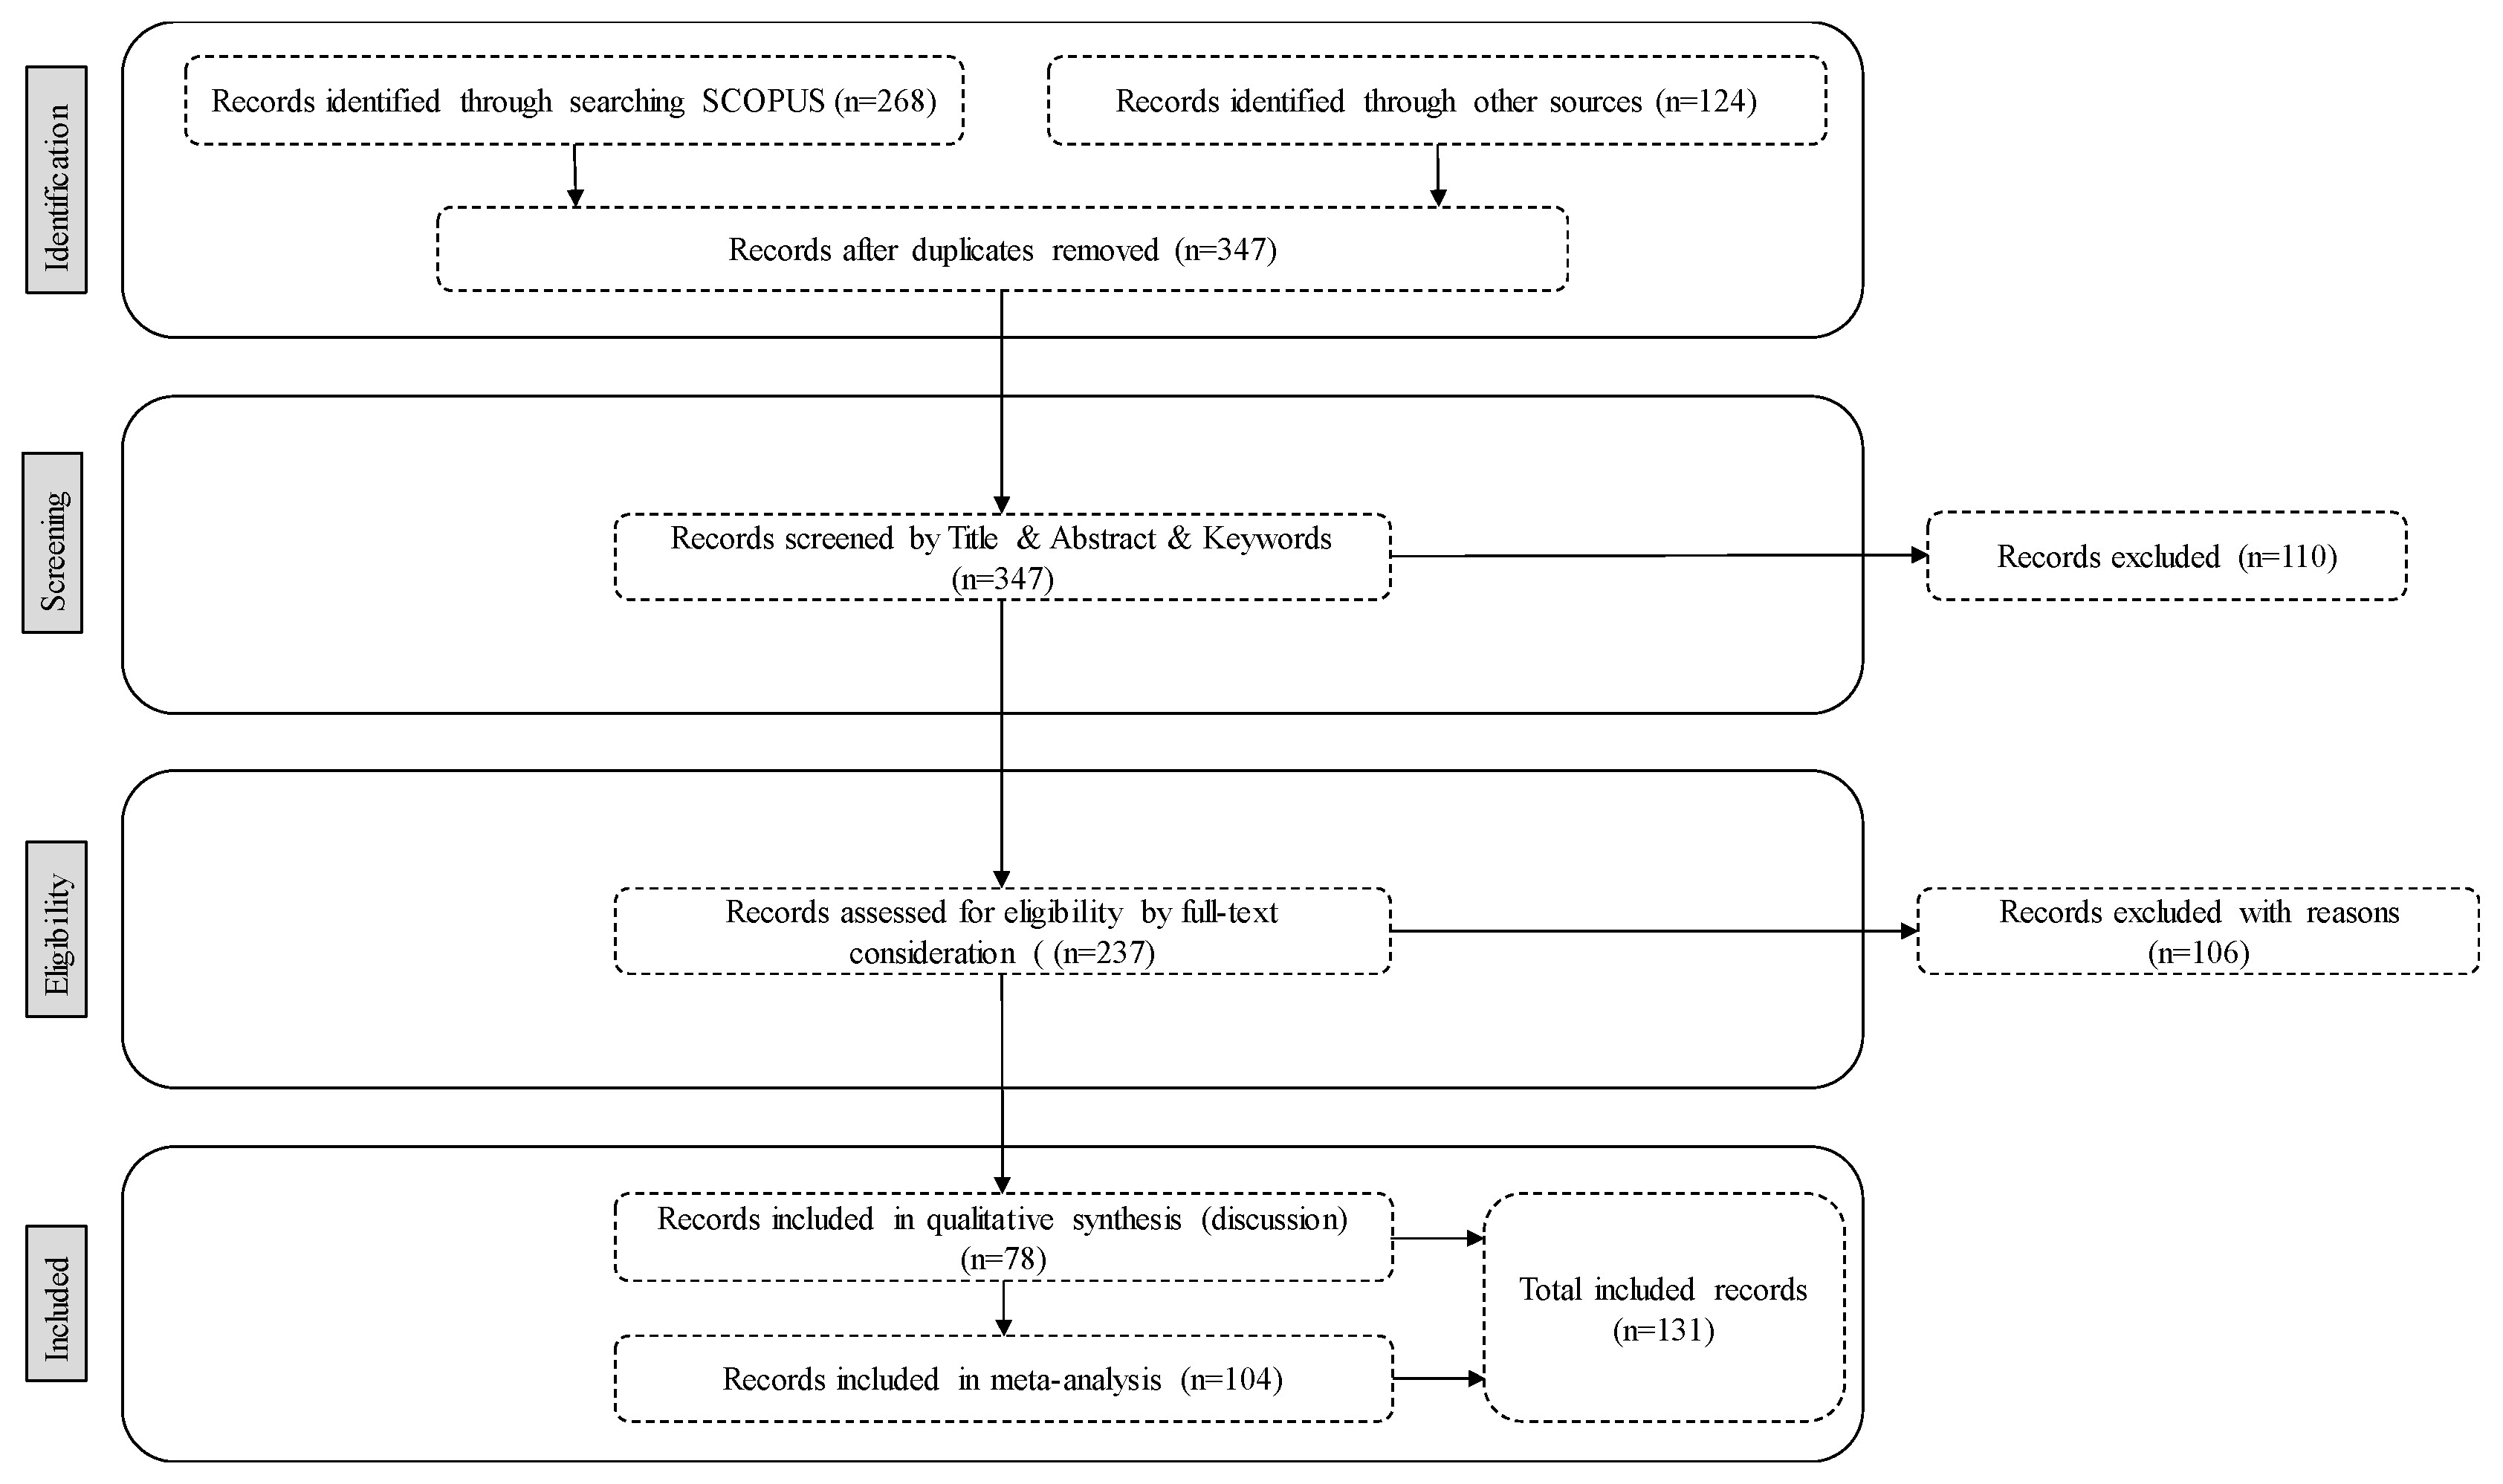
2. Methods
2.1. Protocol of the Review
2.2. Eligibility Criteria
2.3. Information Sources
2.4. Study Selection
2.5. Data Collection Process
2.6. Data Items
2.7. Risk of Bias in Individual Studies
2.7.1. Sampling Methods
2.7.2. Risks and Challenges of Sampling
3. Results
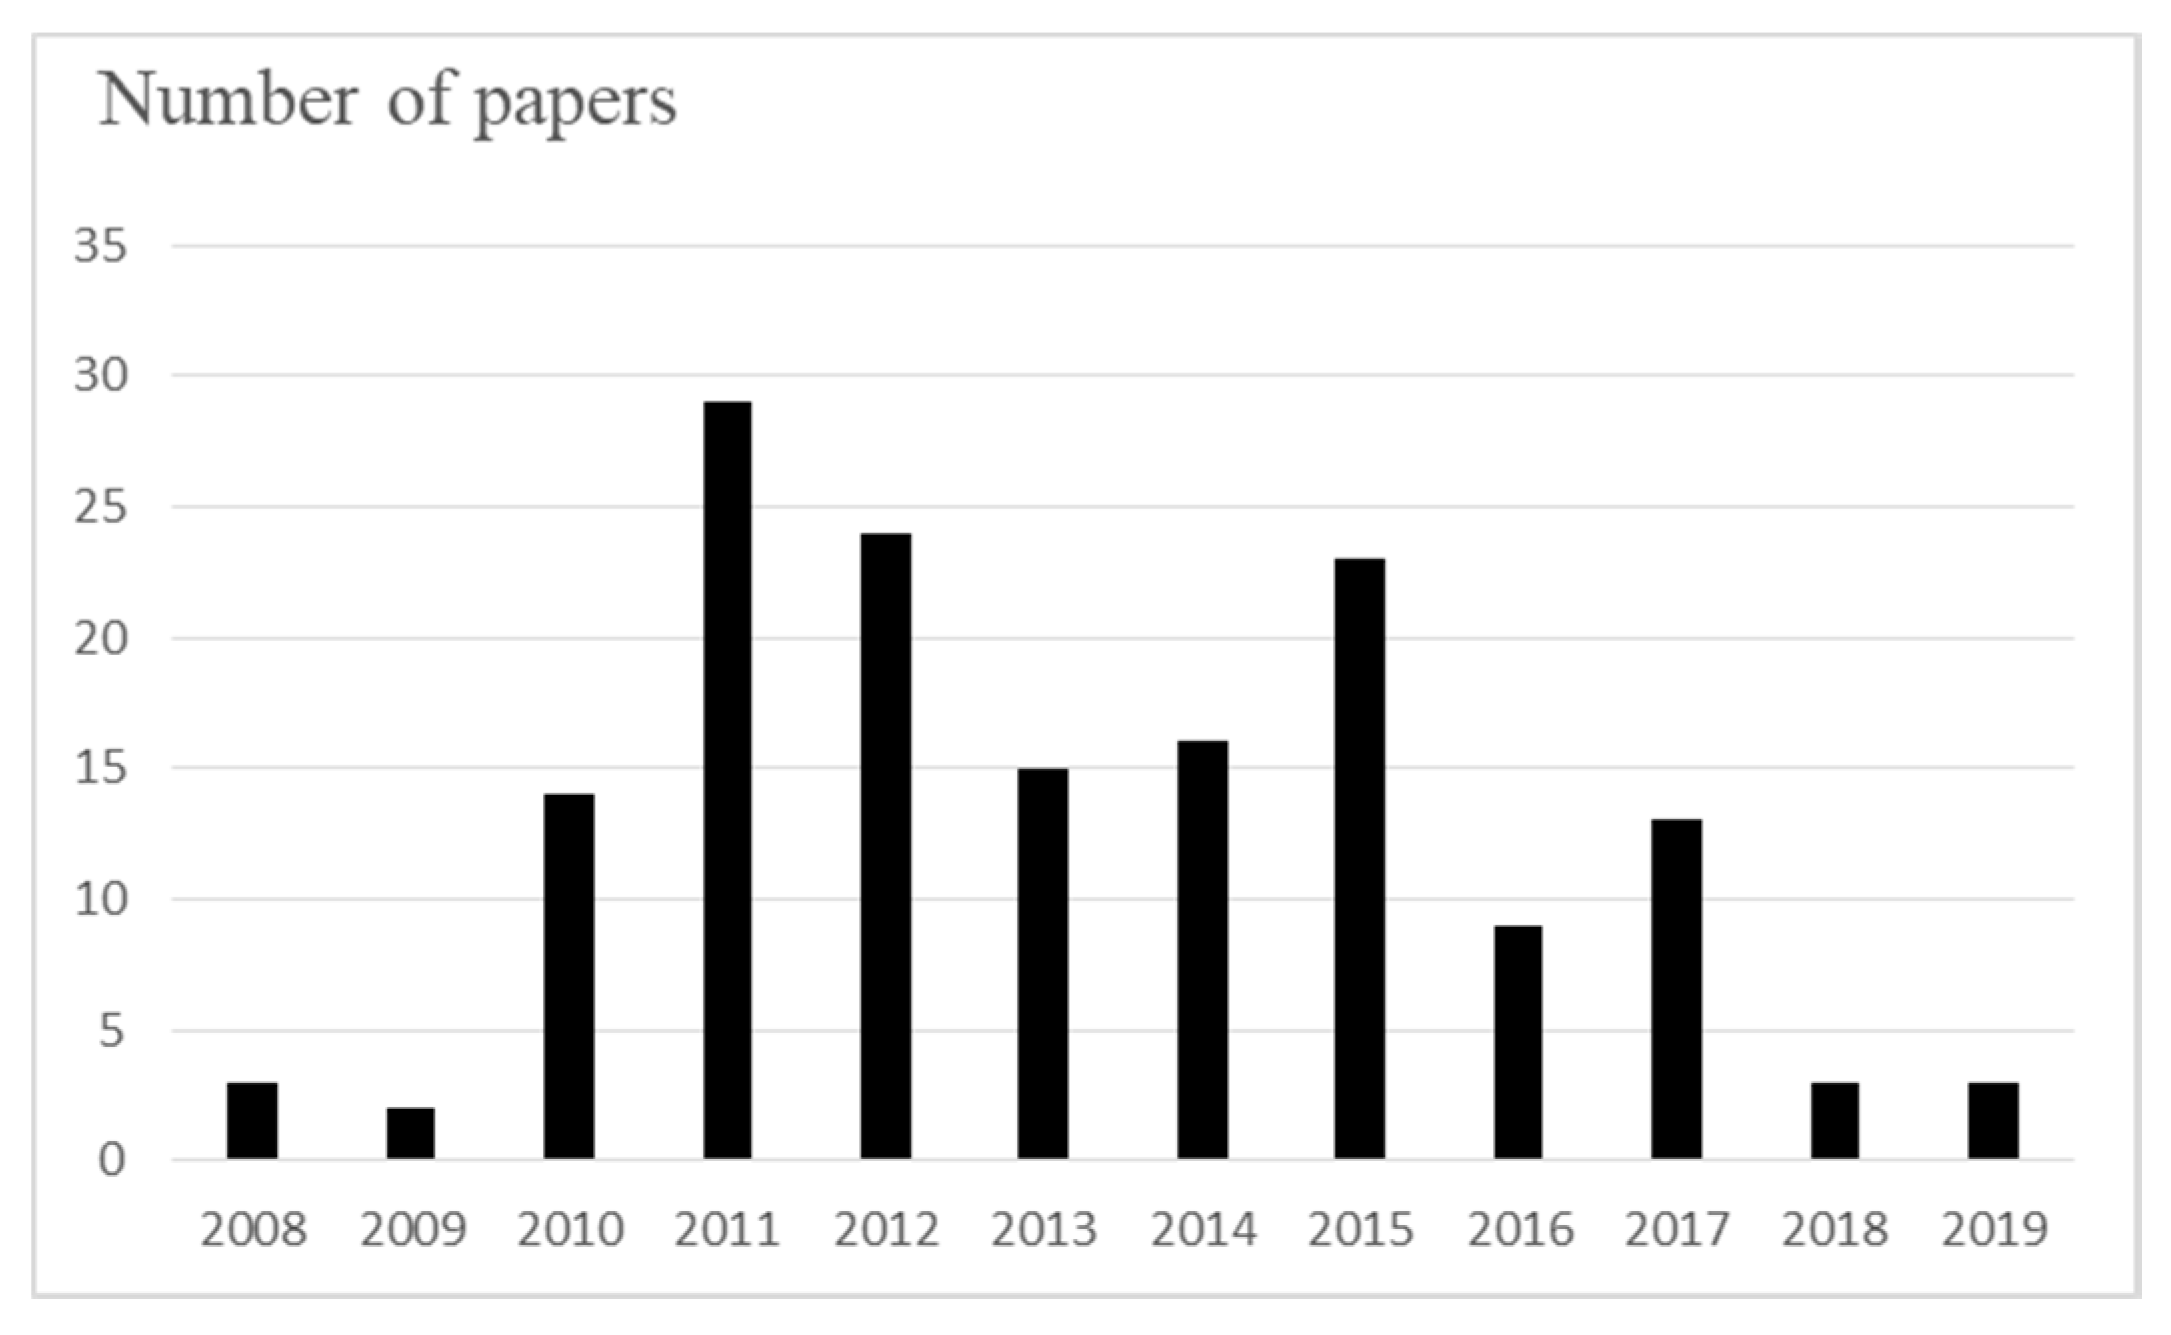
3.1. Synthesis of Results
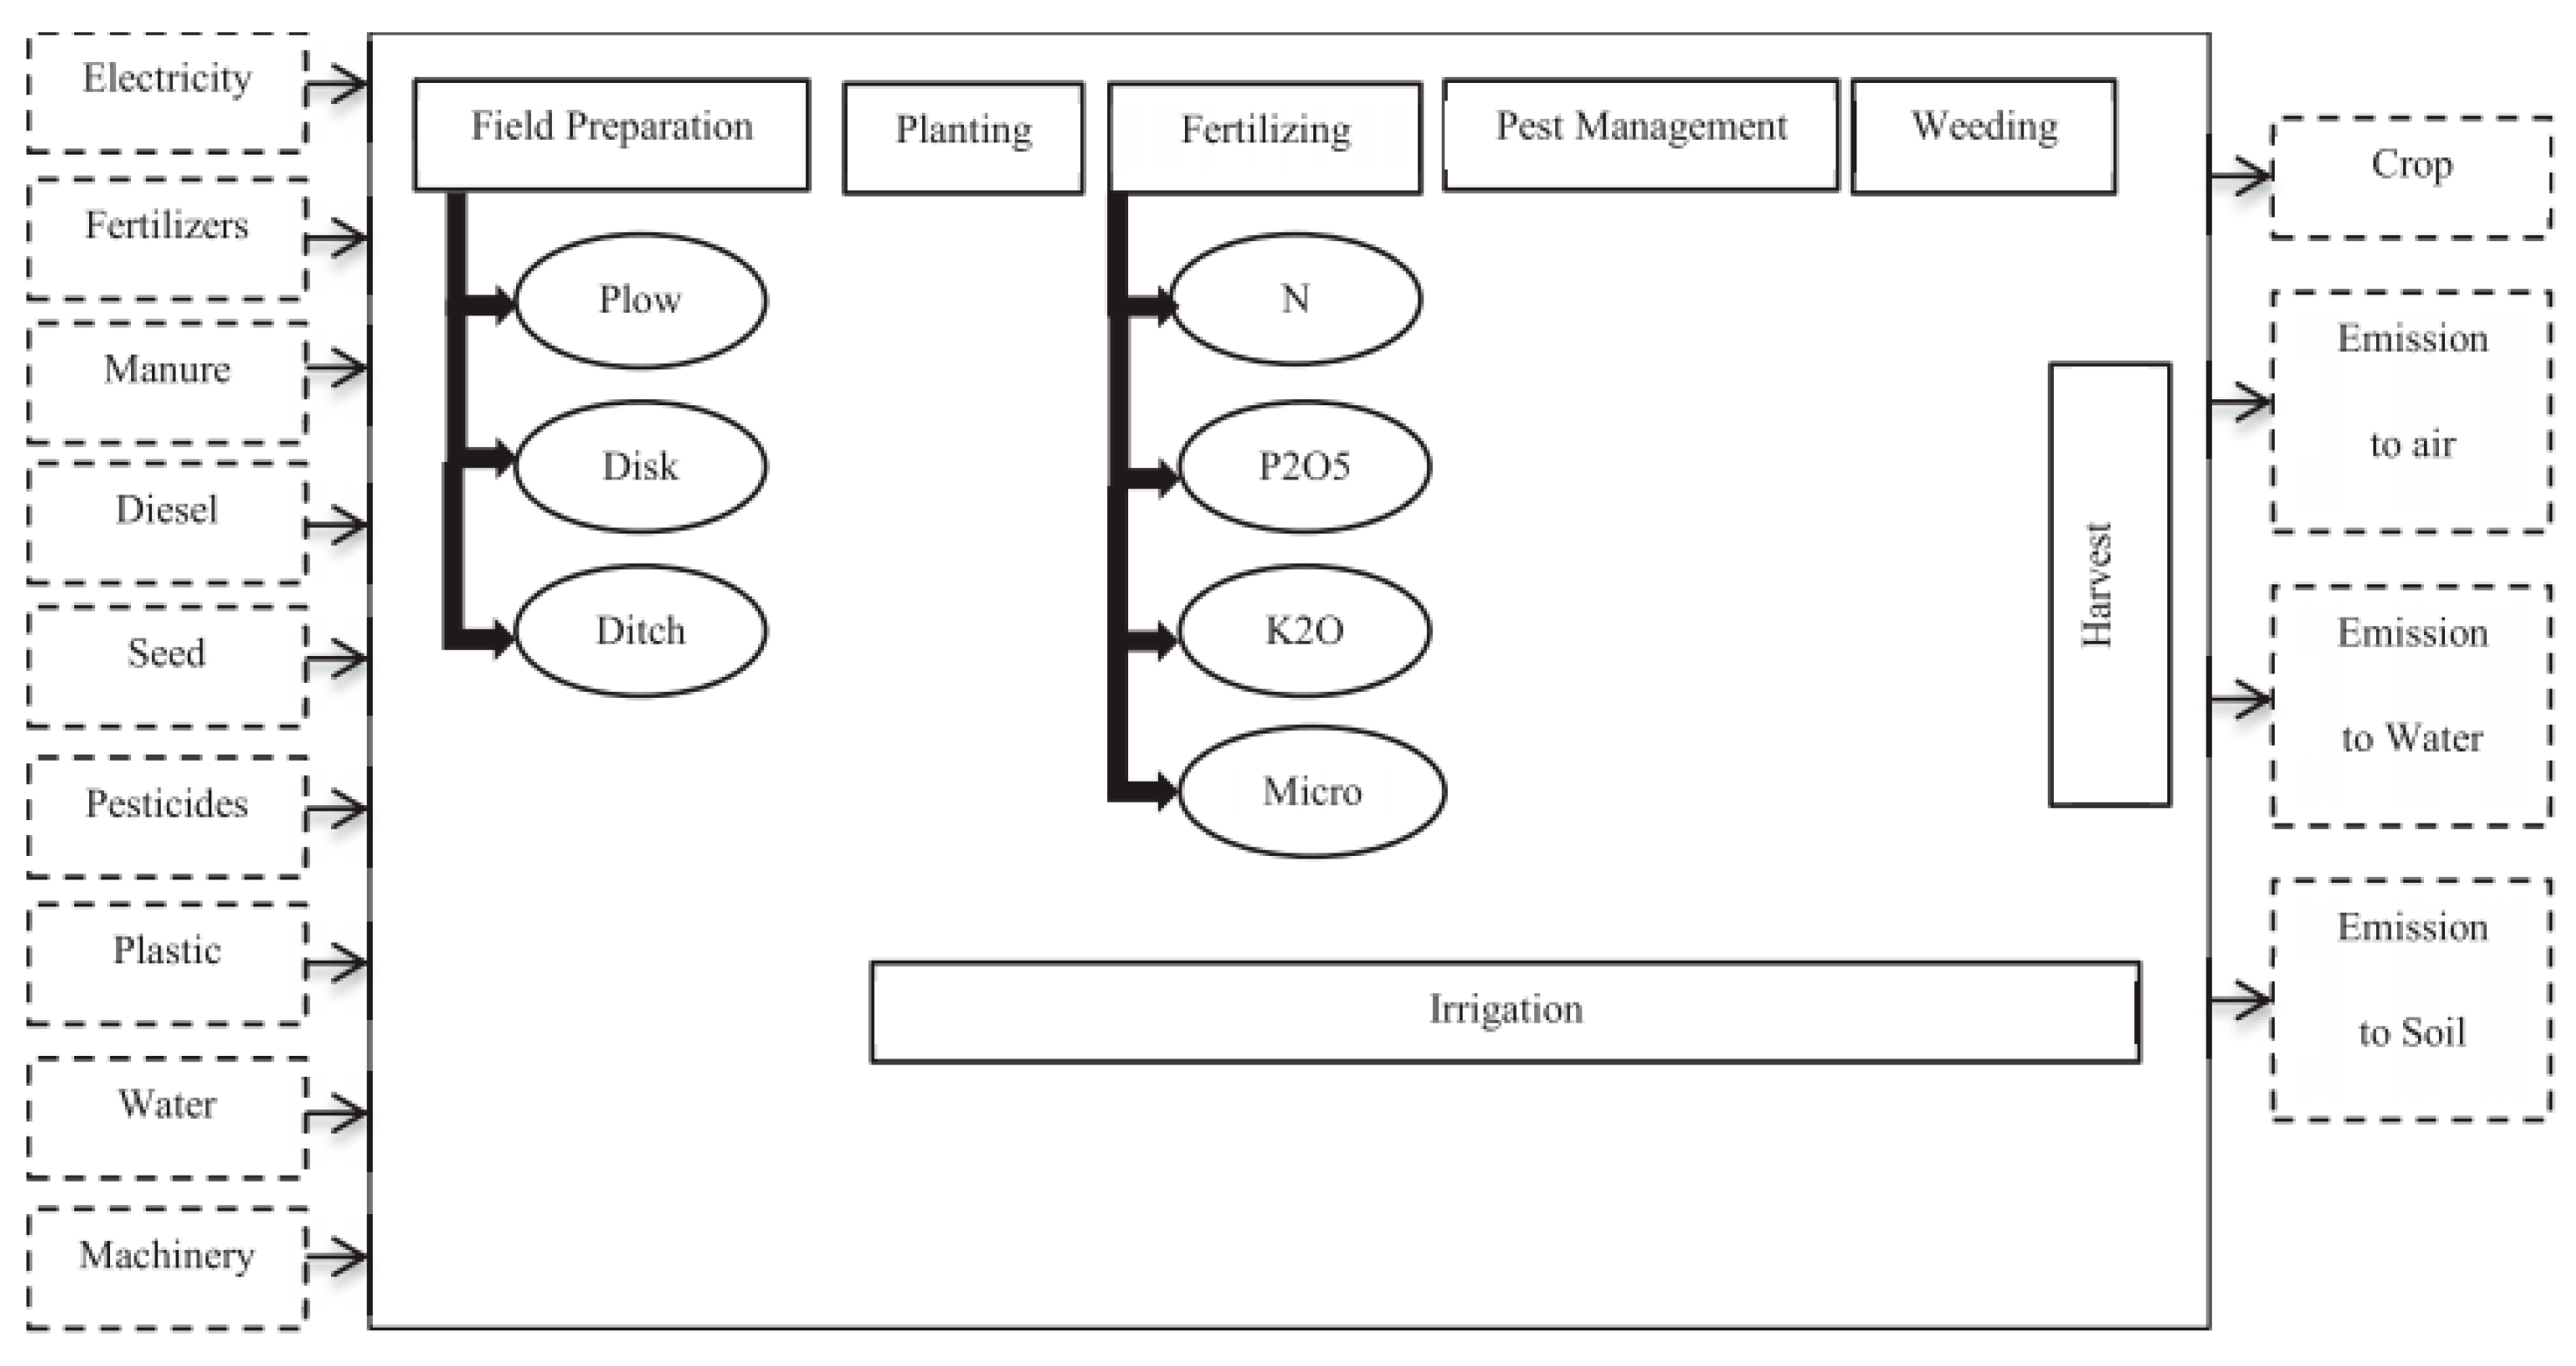
3.1.1. Energy Analysis
3.1.2. Life Cycle Assessment
3.1.3. Economic Indicators
3.1.4. Cobb-Douglas Production Function
3.1.5. Marginal Physical Productivity
3.1.6. Data Envelopment Analysis
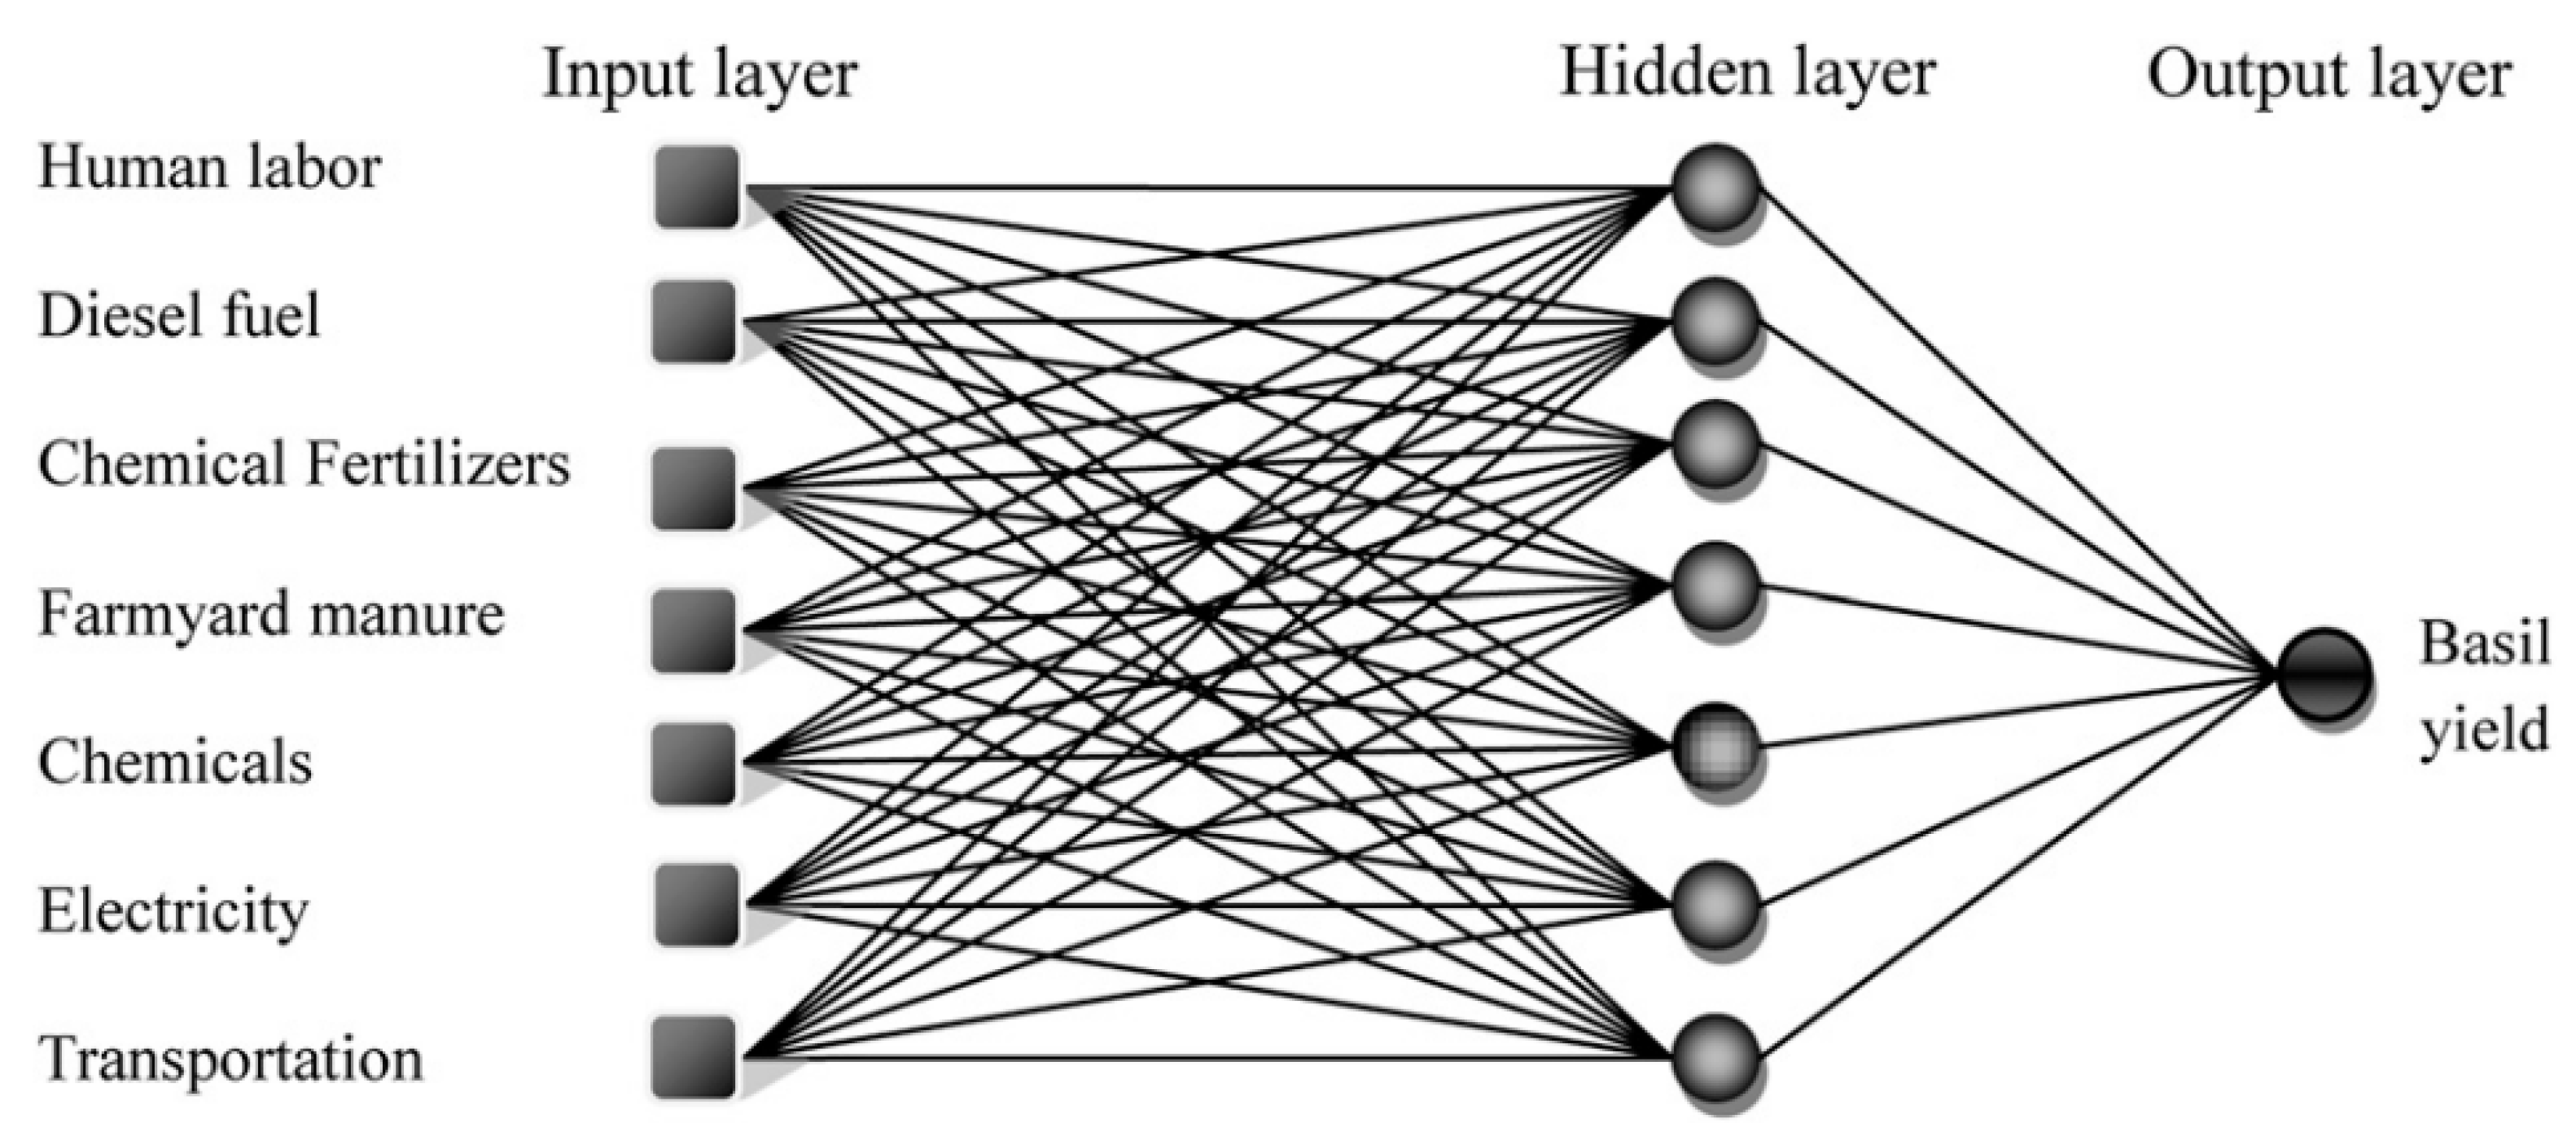
3.1.7. Artificial Neural Networks (ANN)
3.1.8. Adaptive Neuro-Fuzzy Inference System (ANFIS)
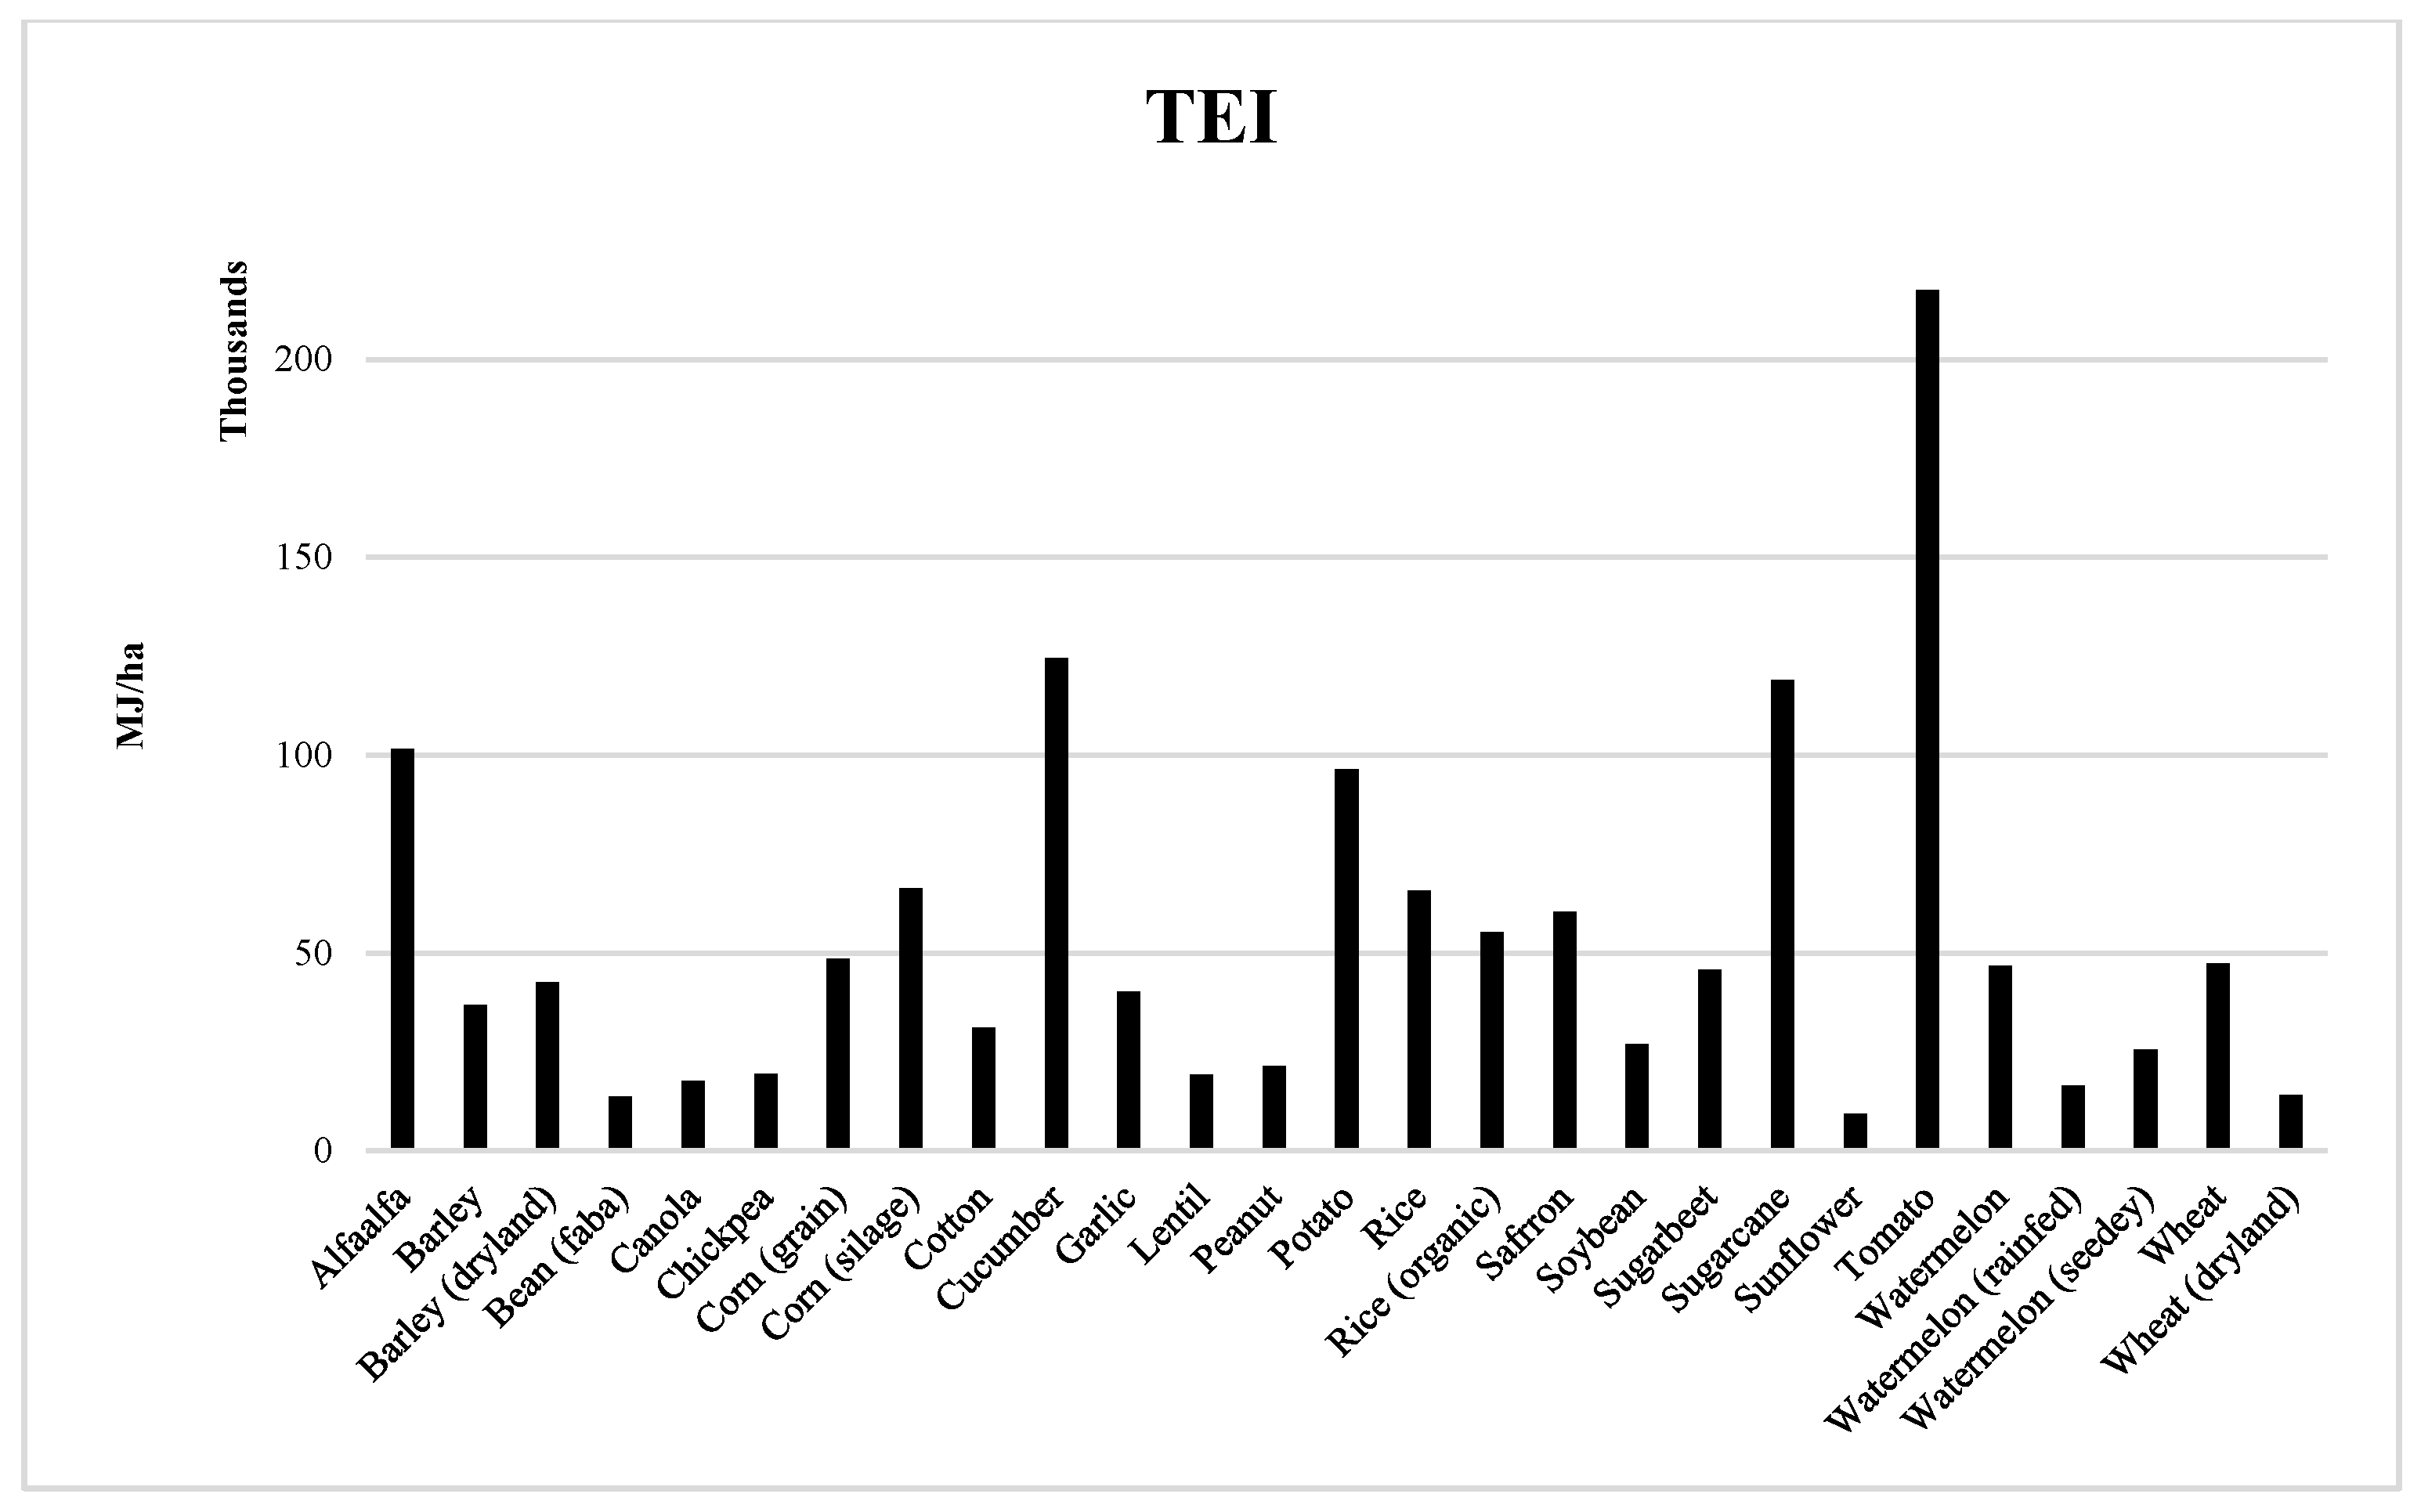
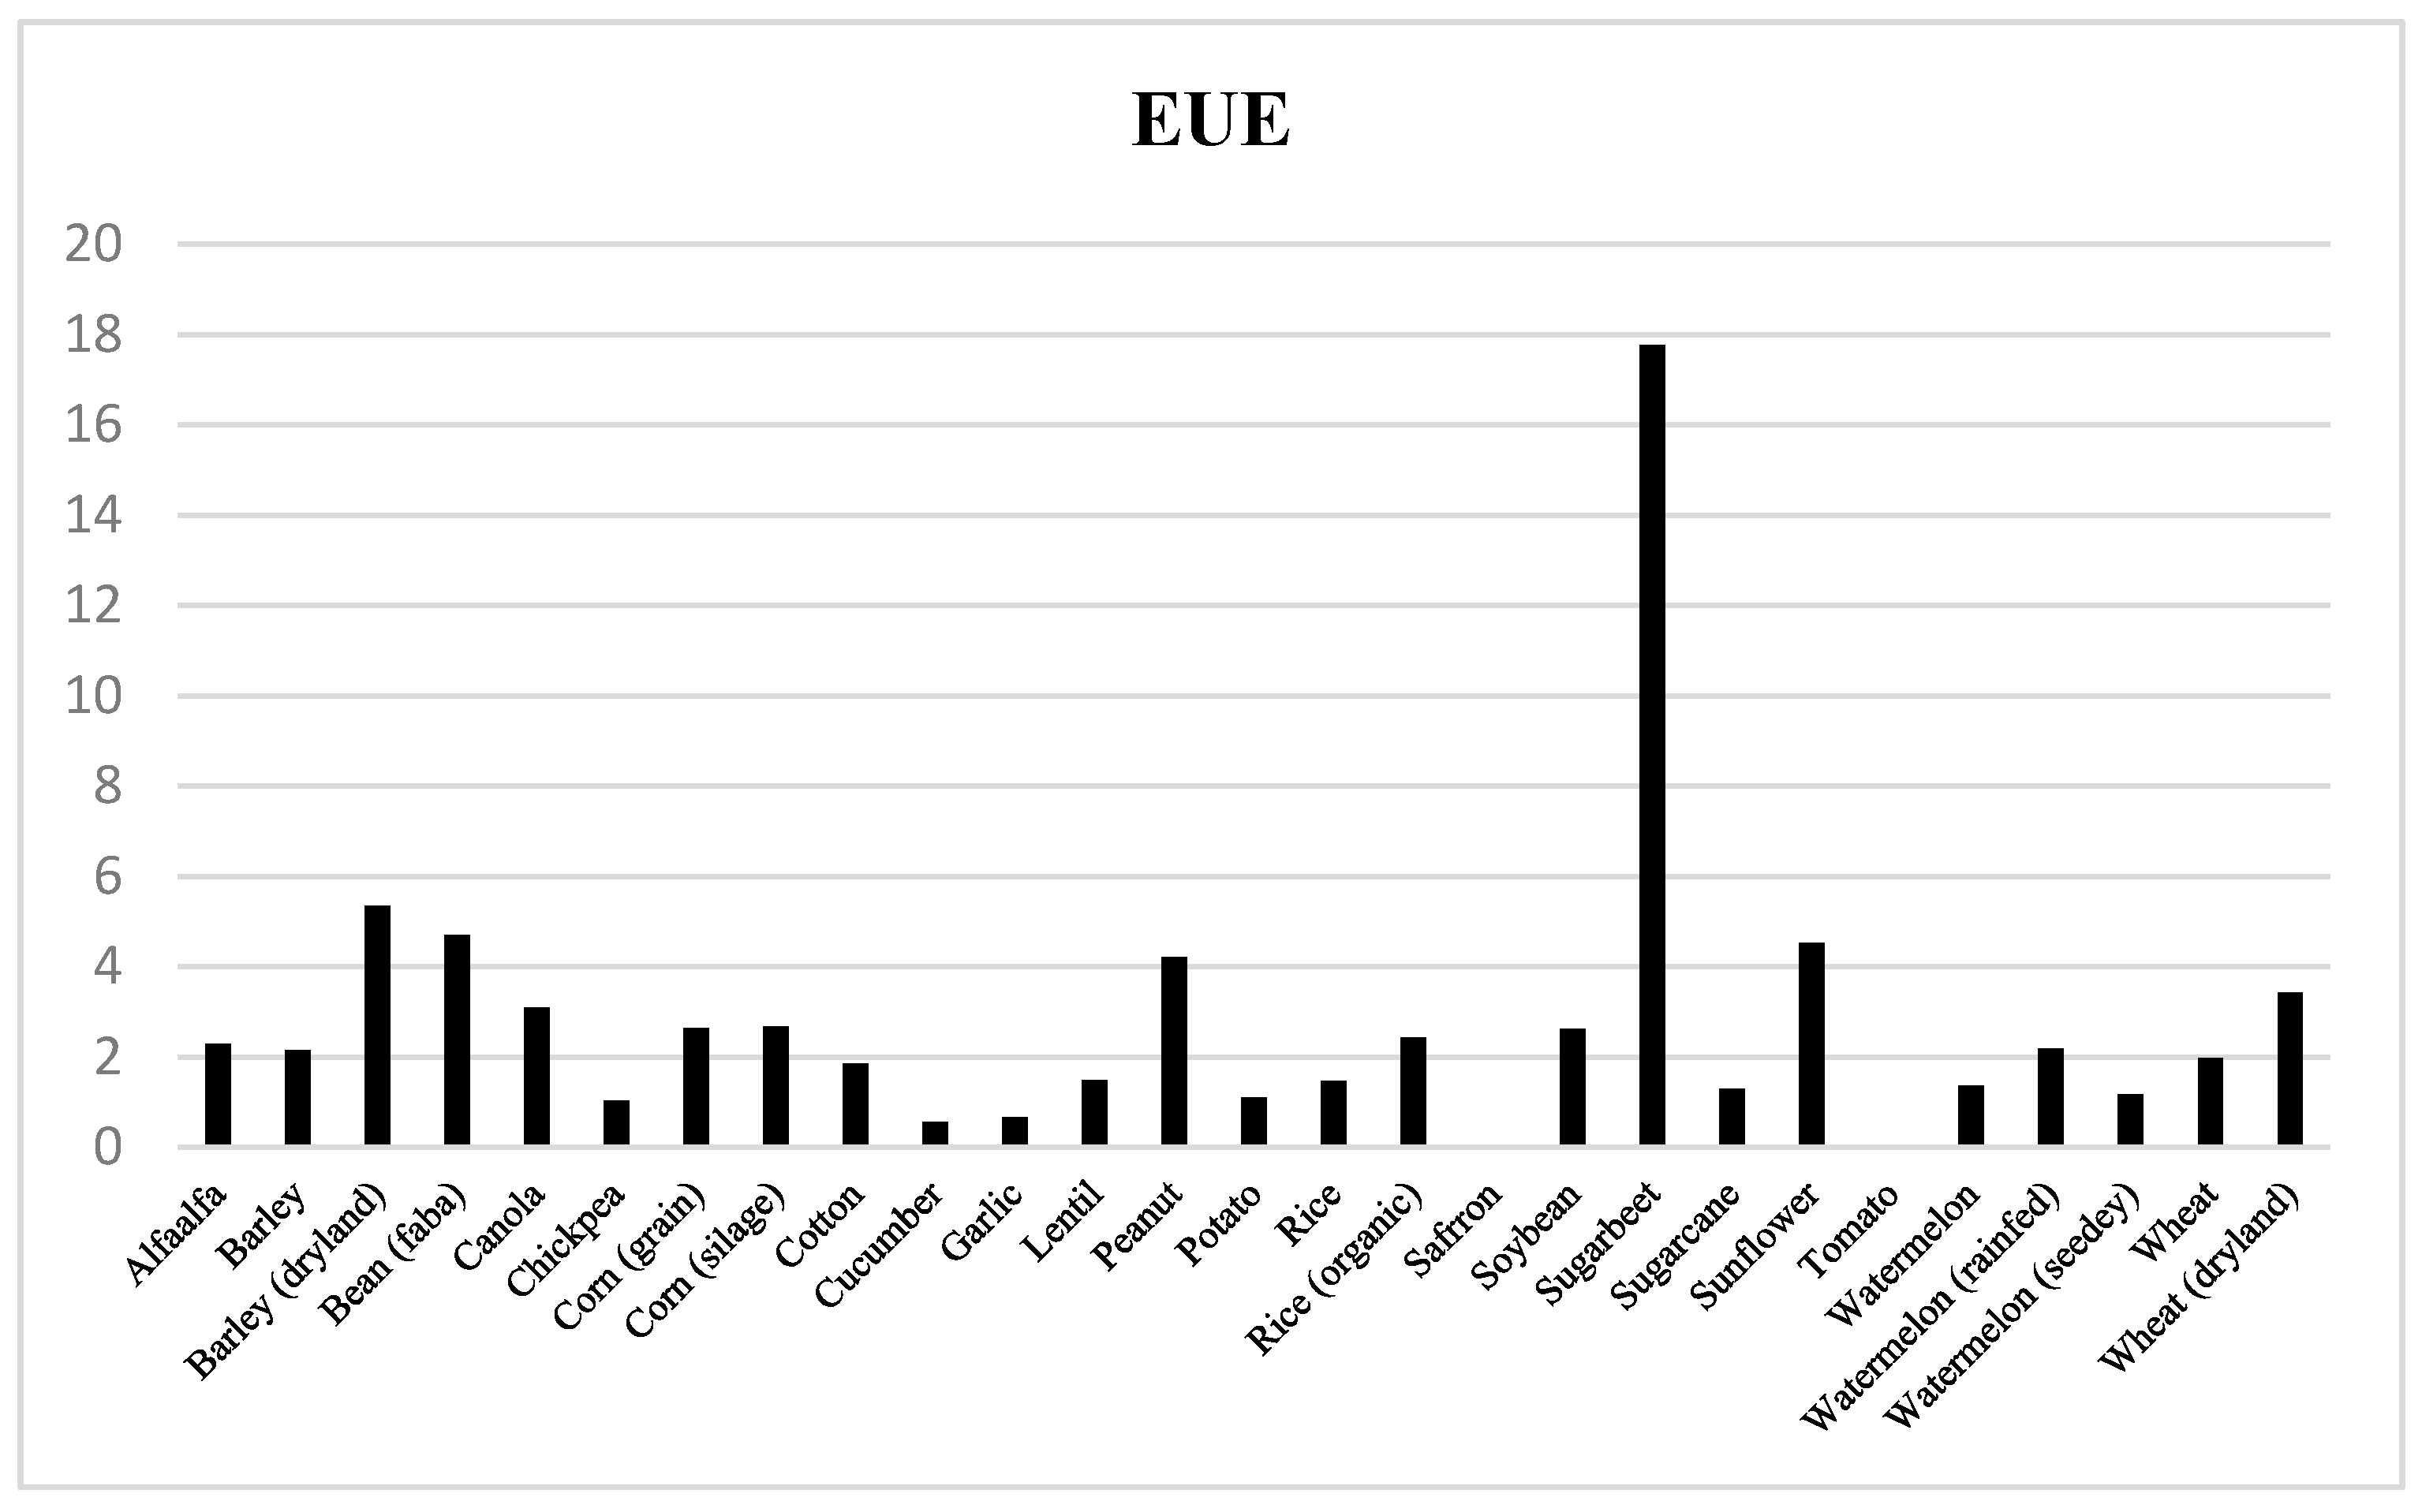
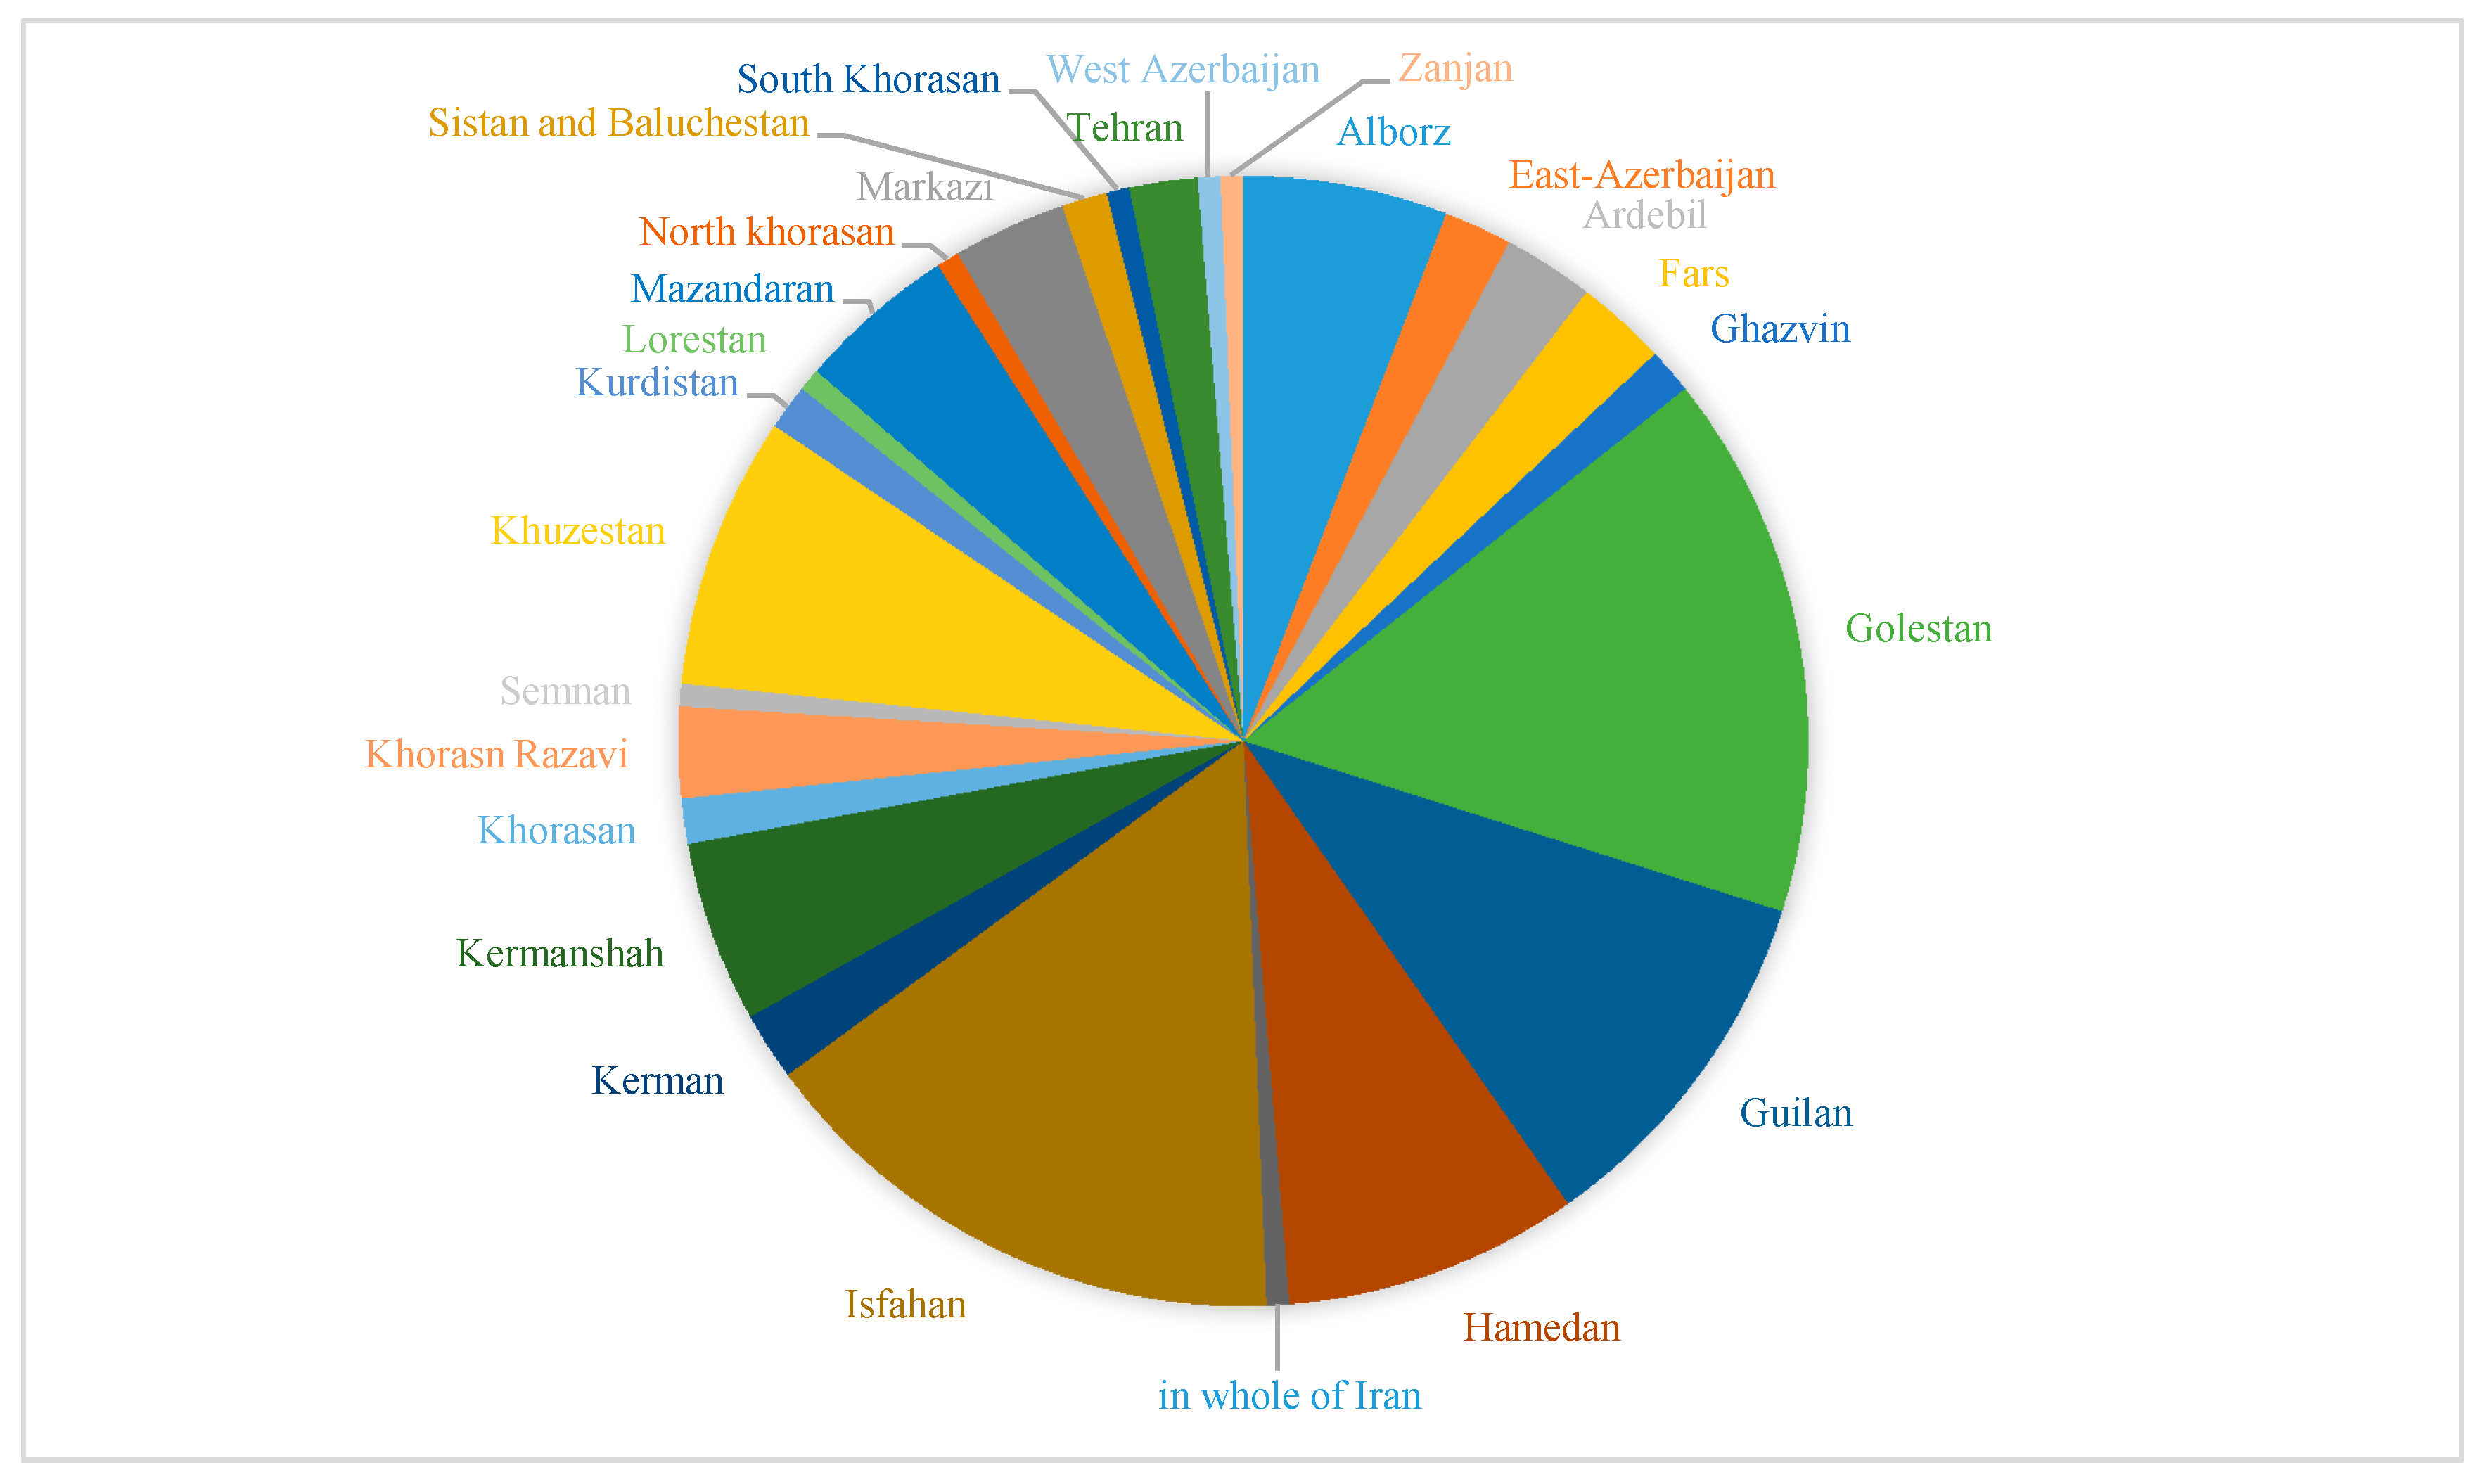
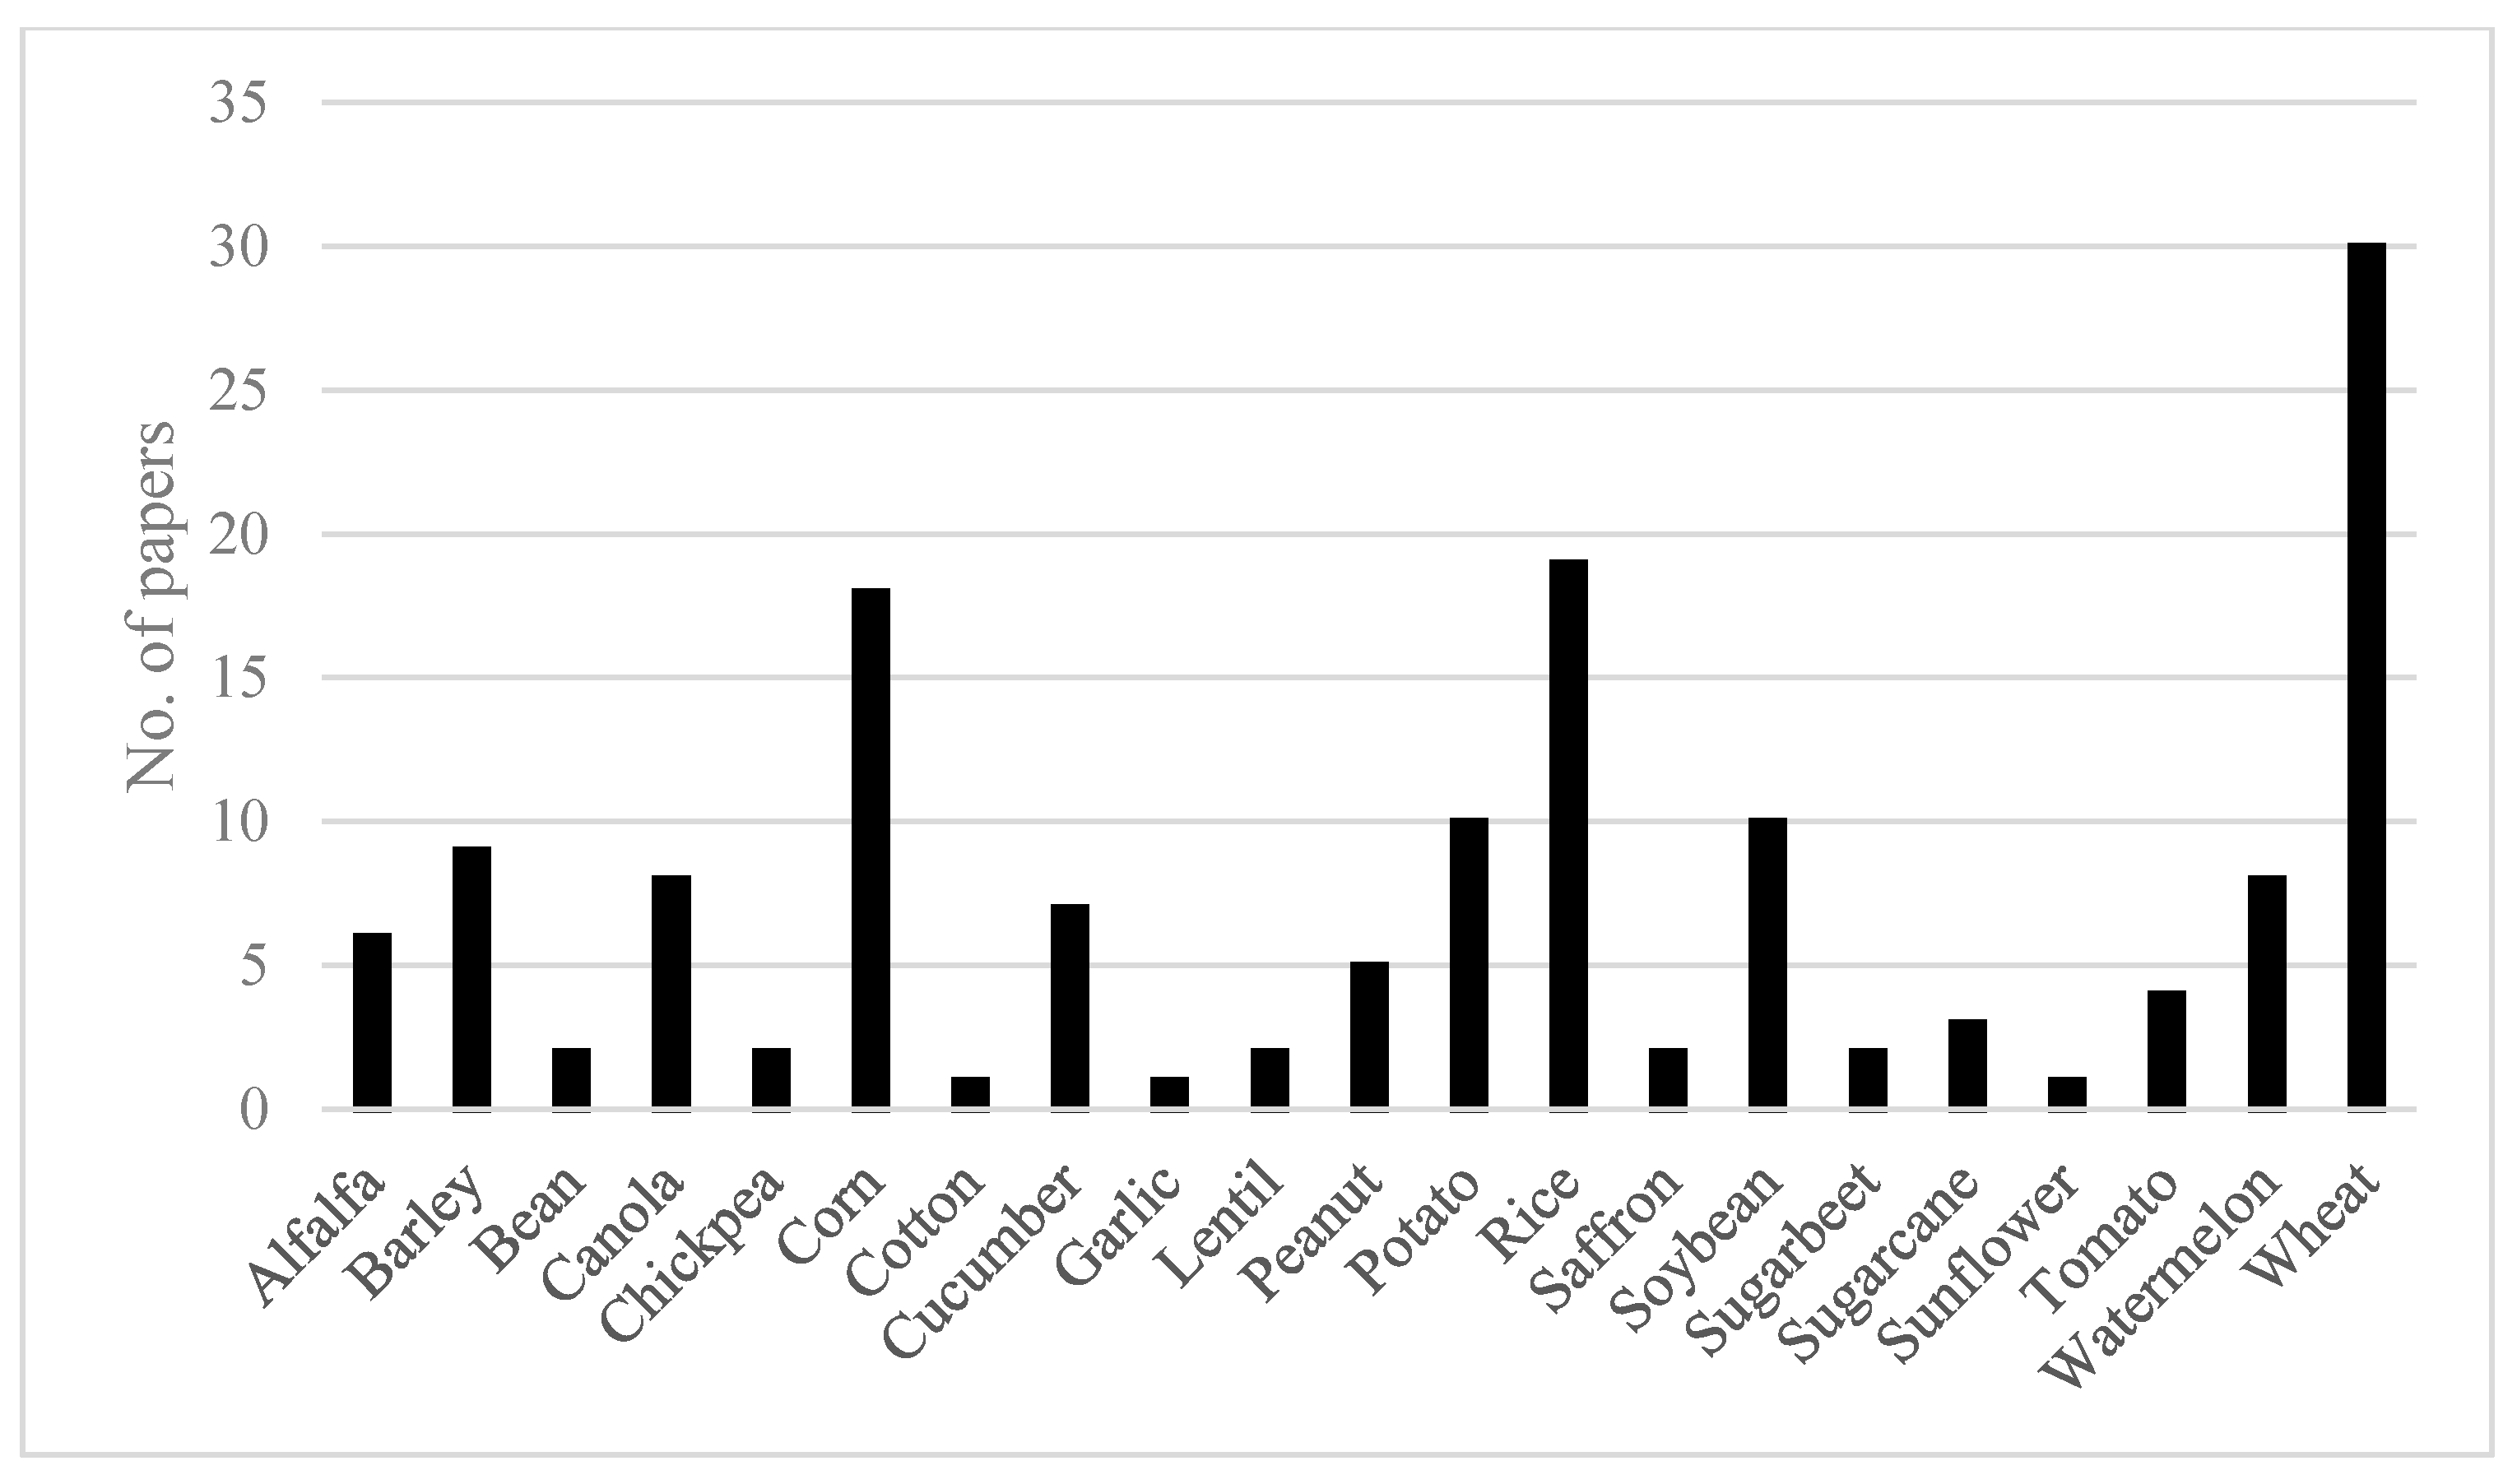
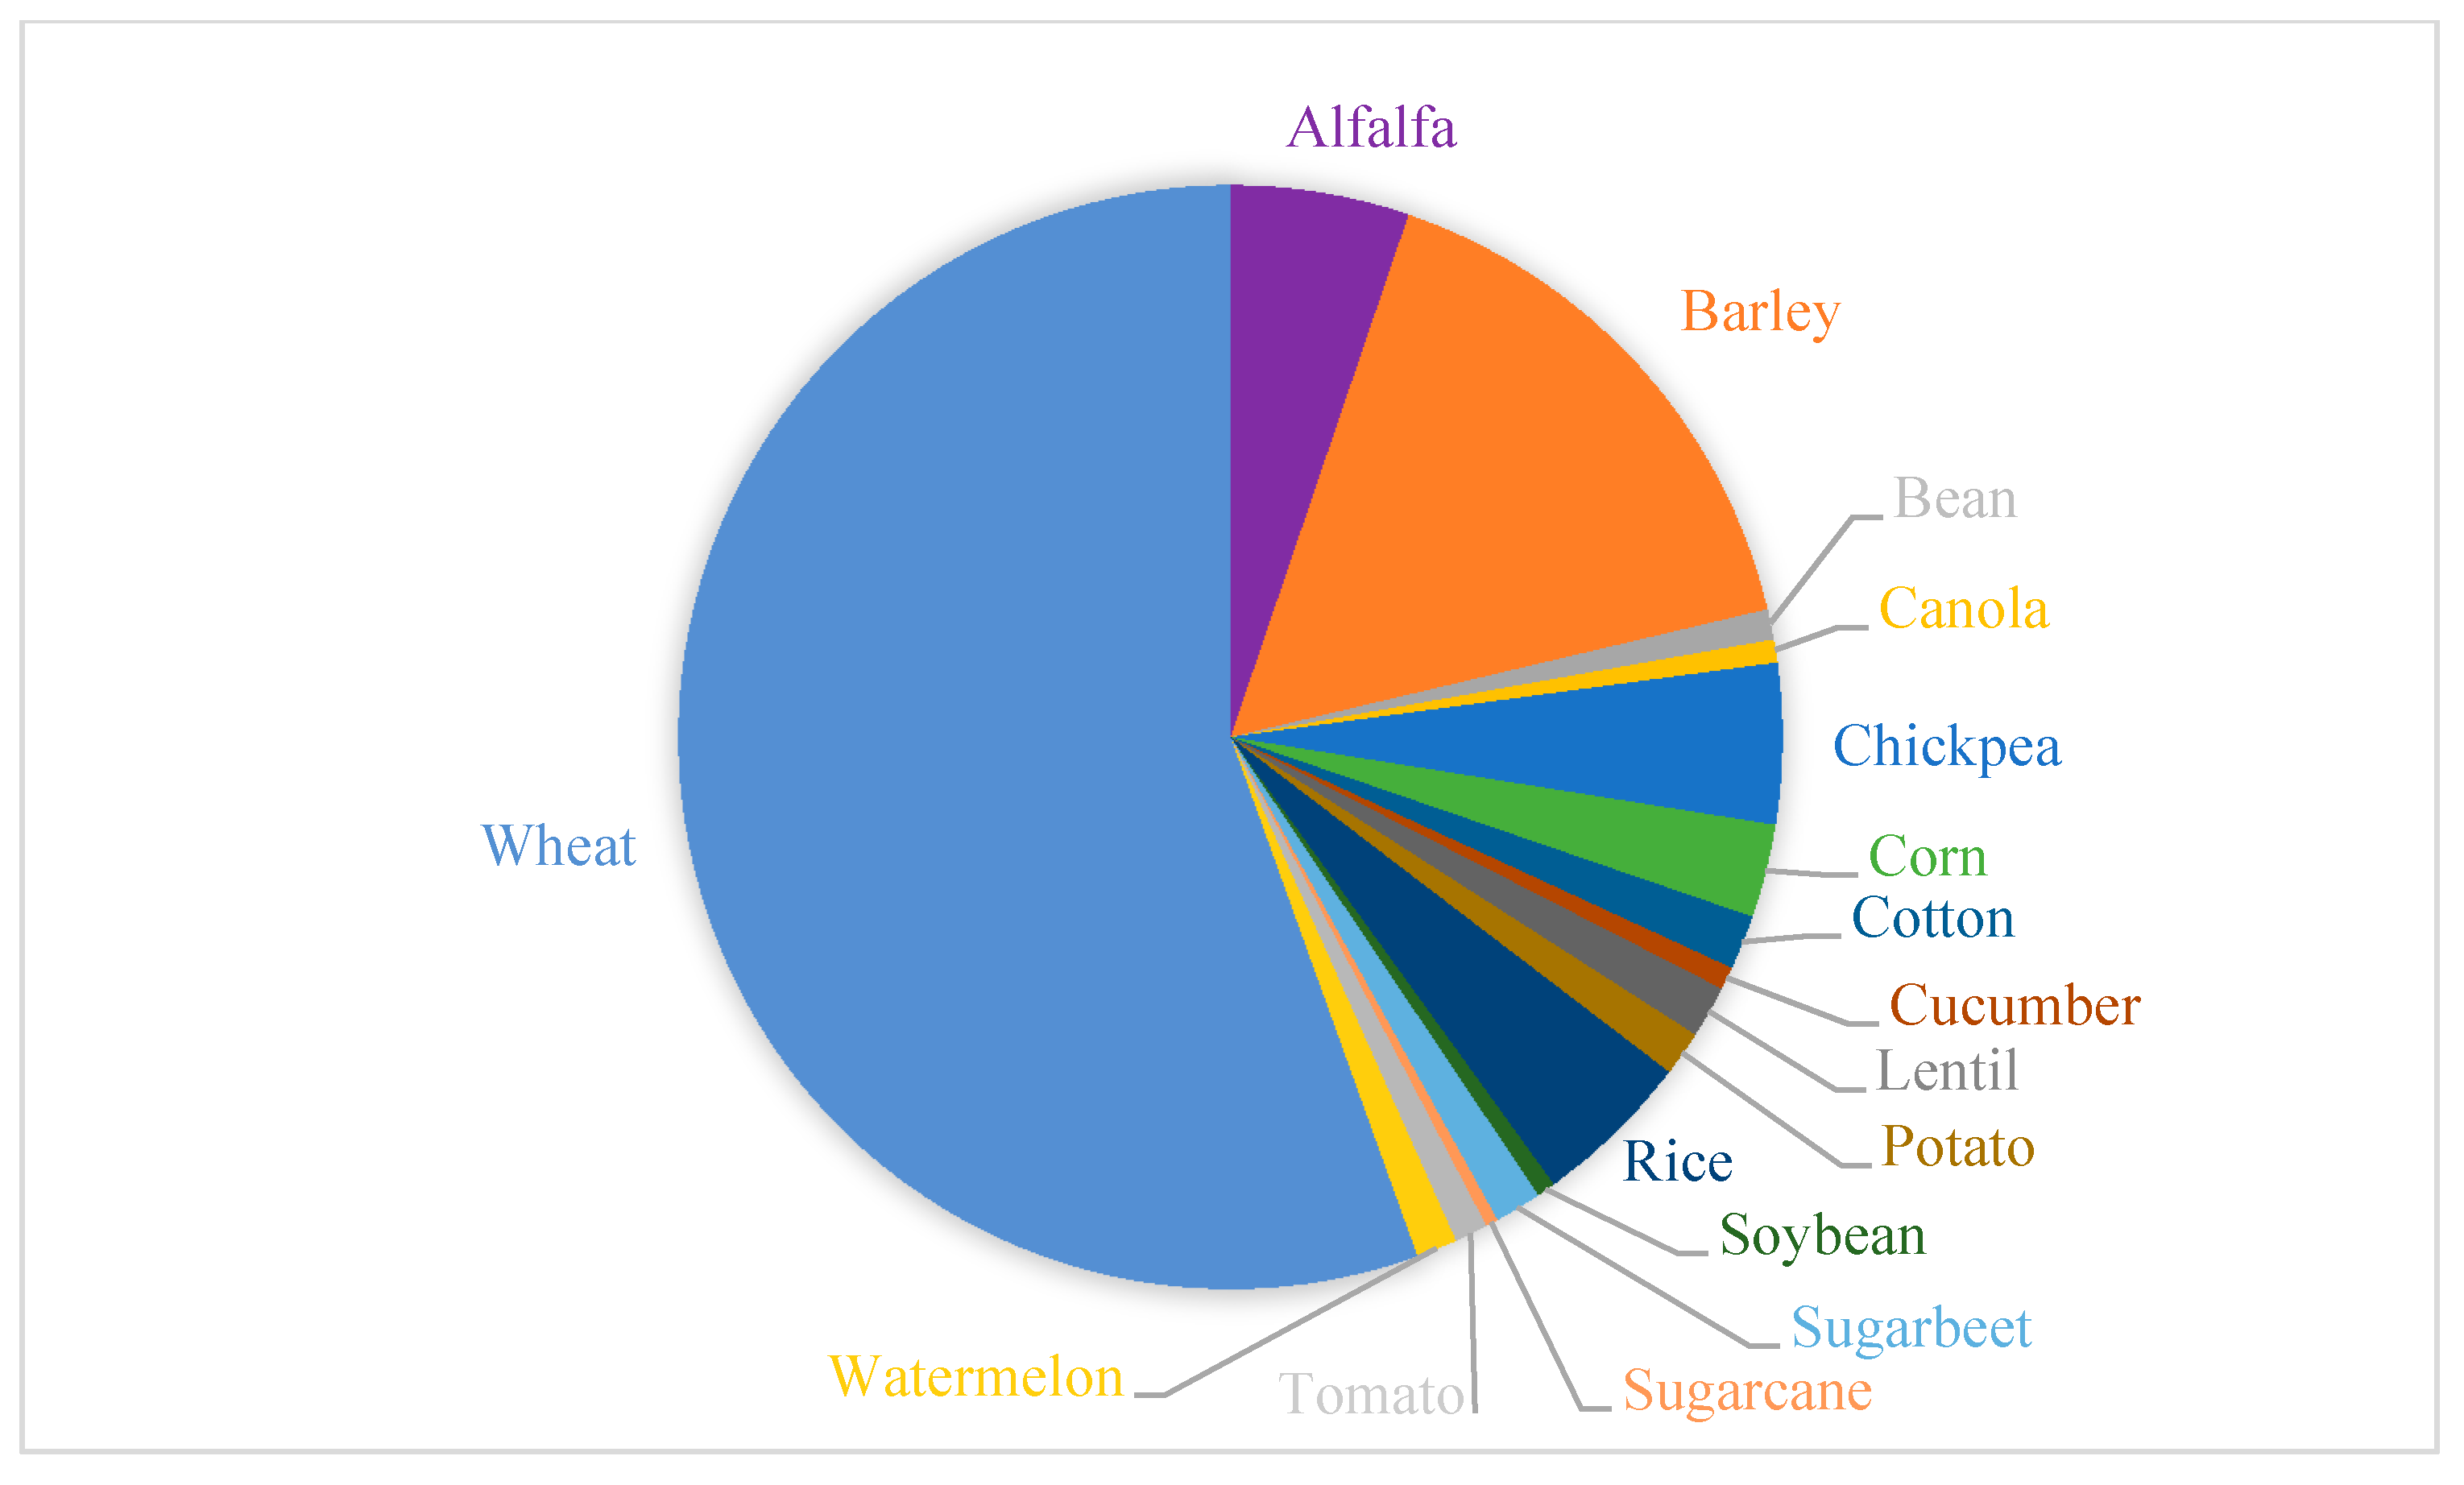
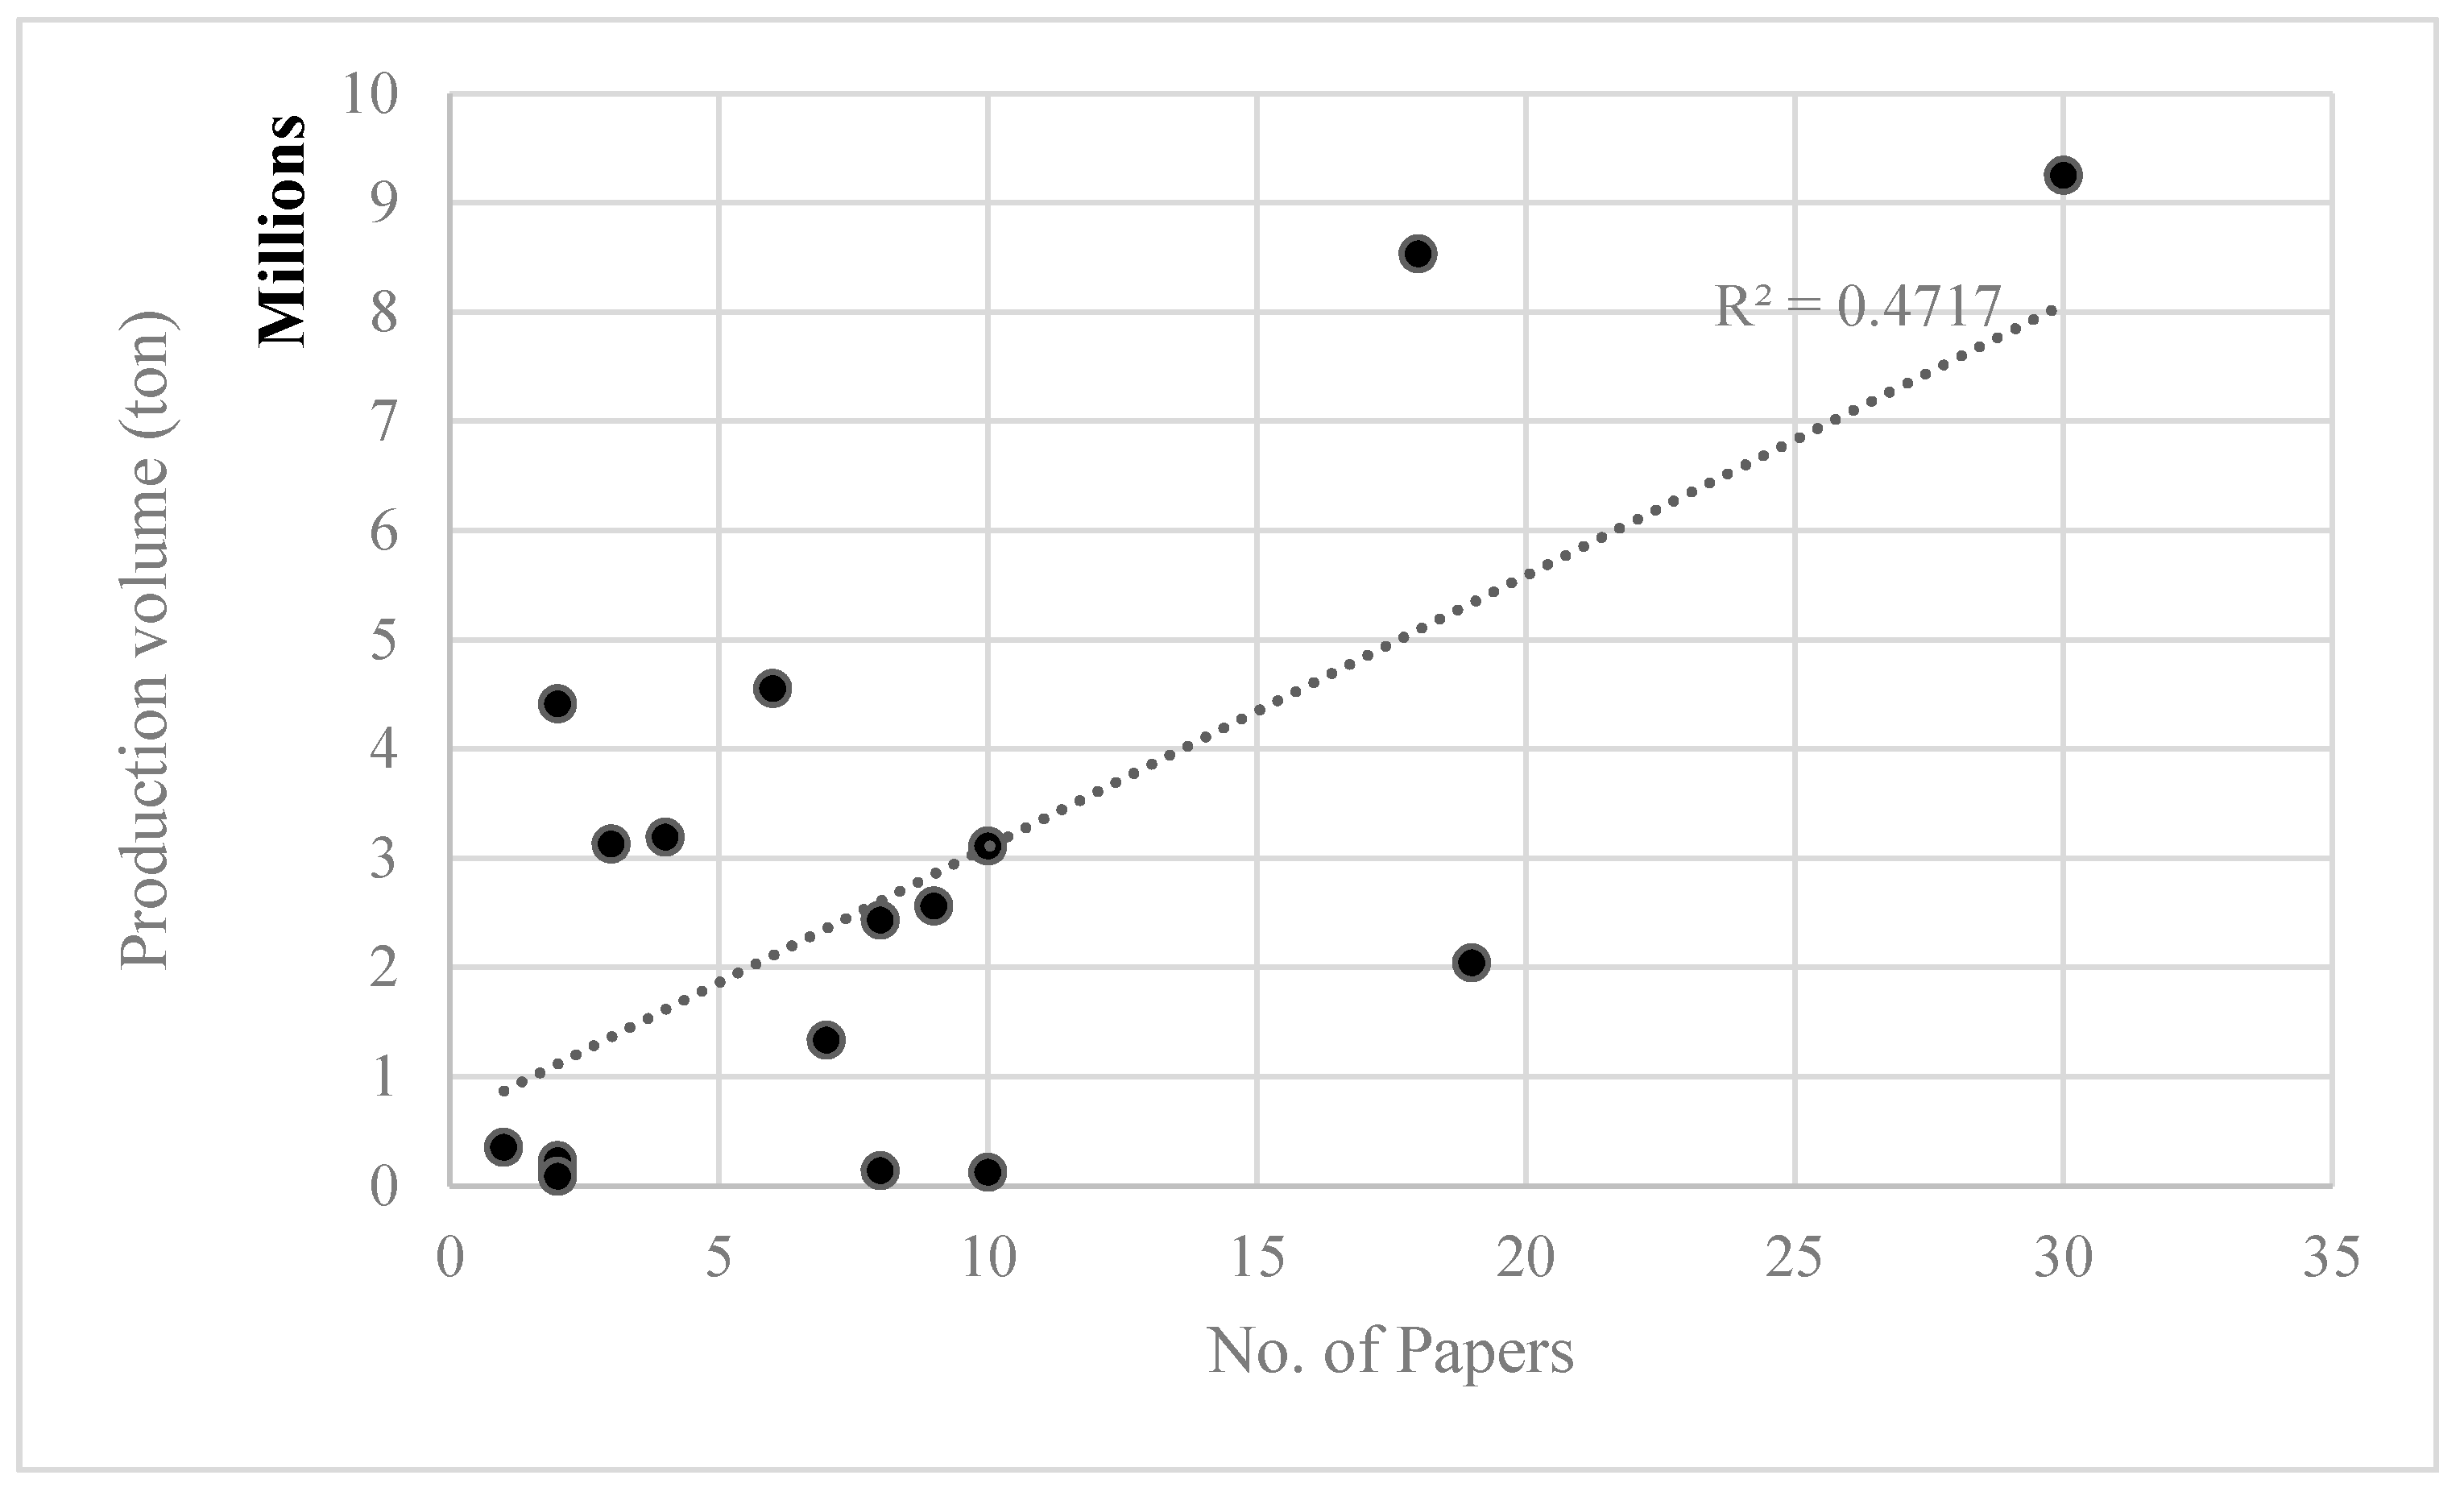
3.2. Energy Status in Farm Crops
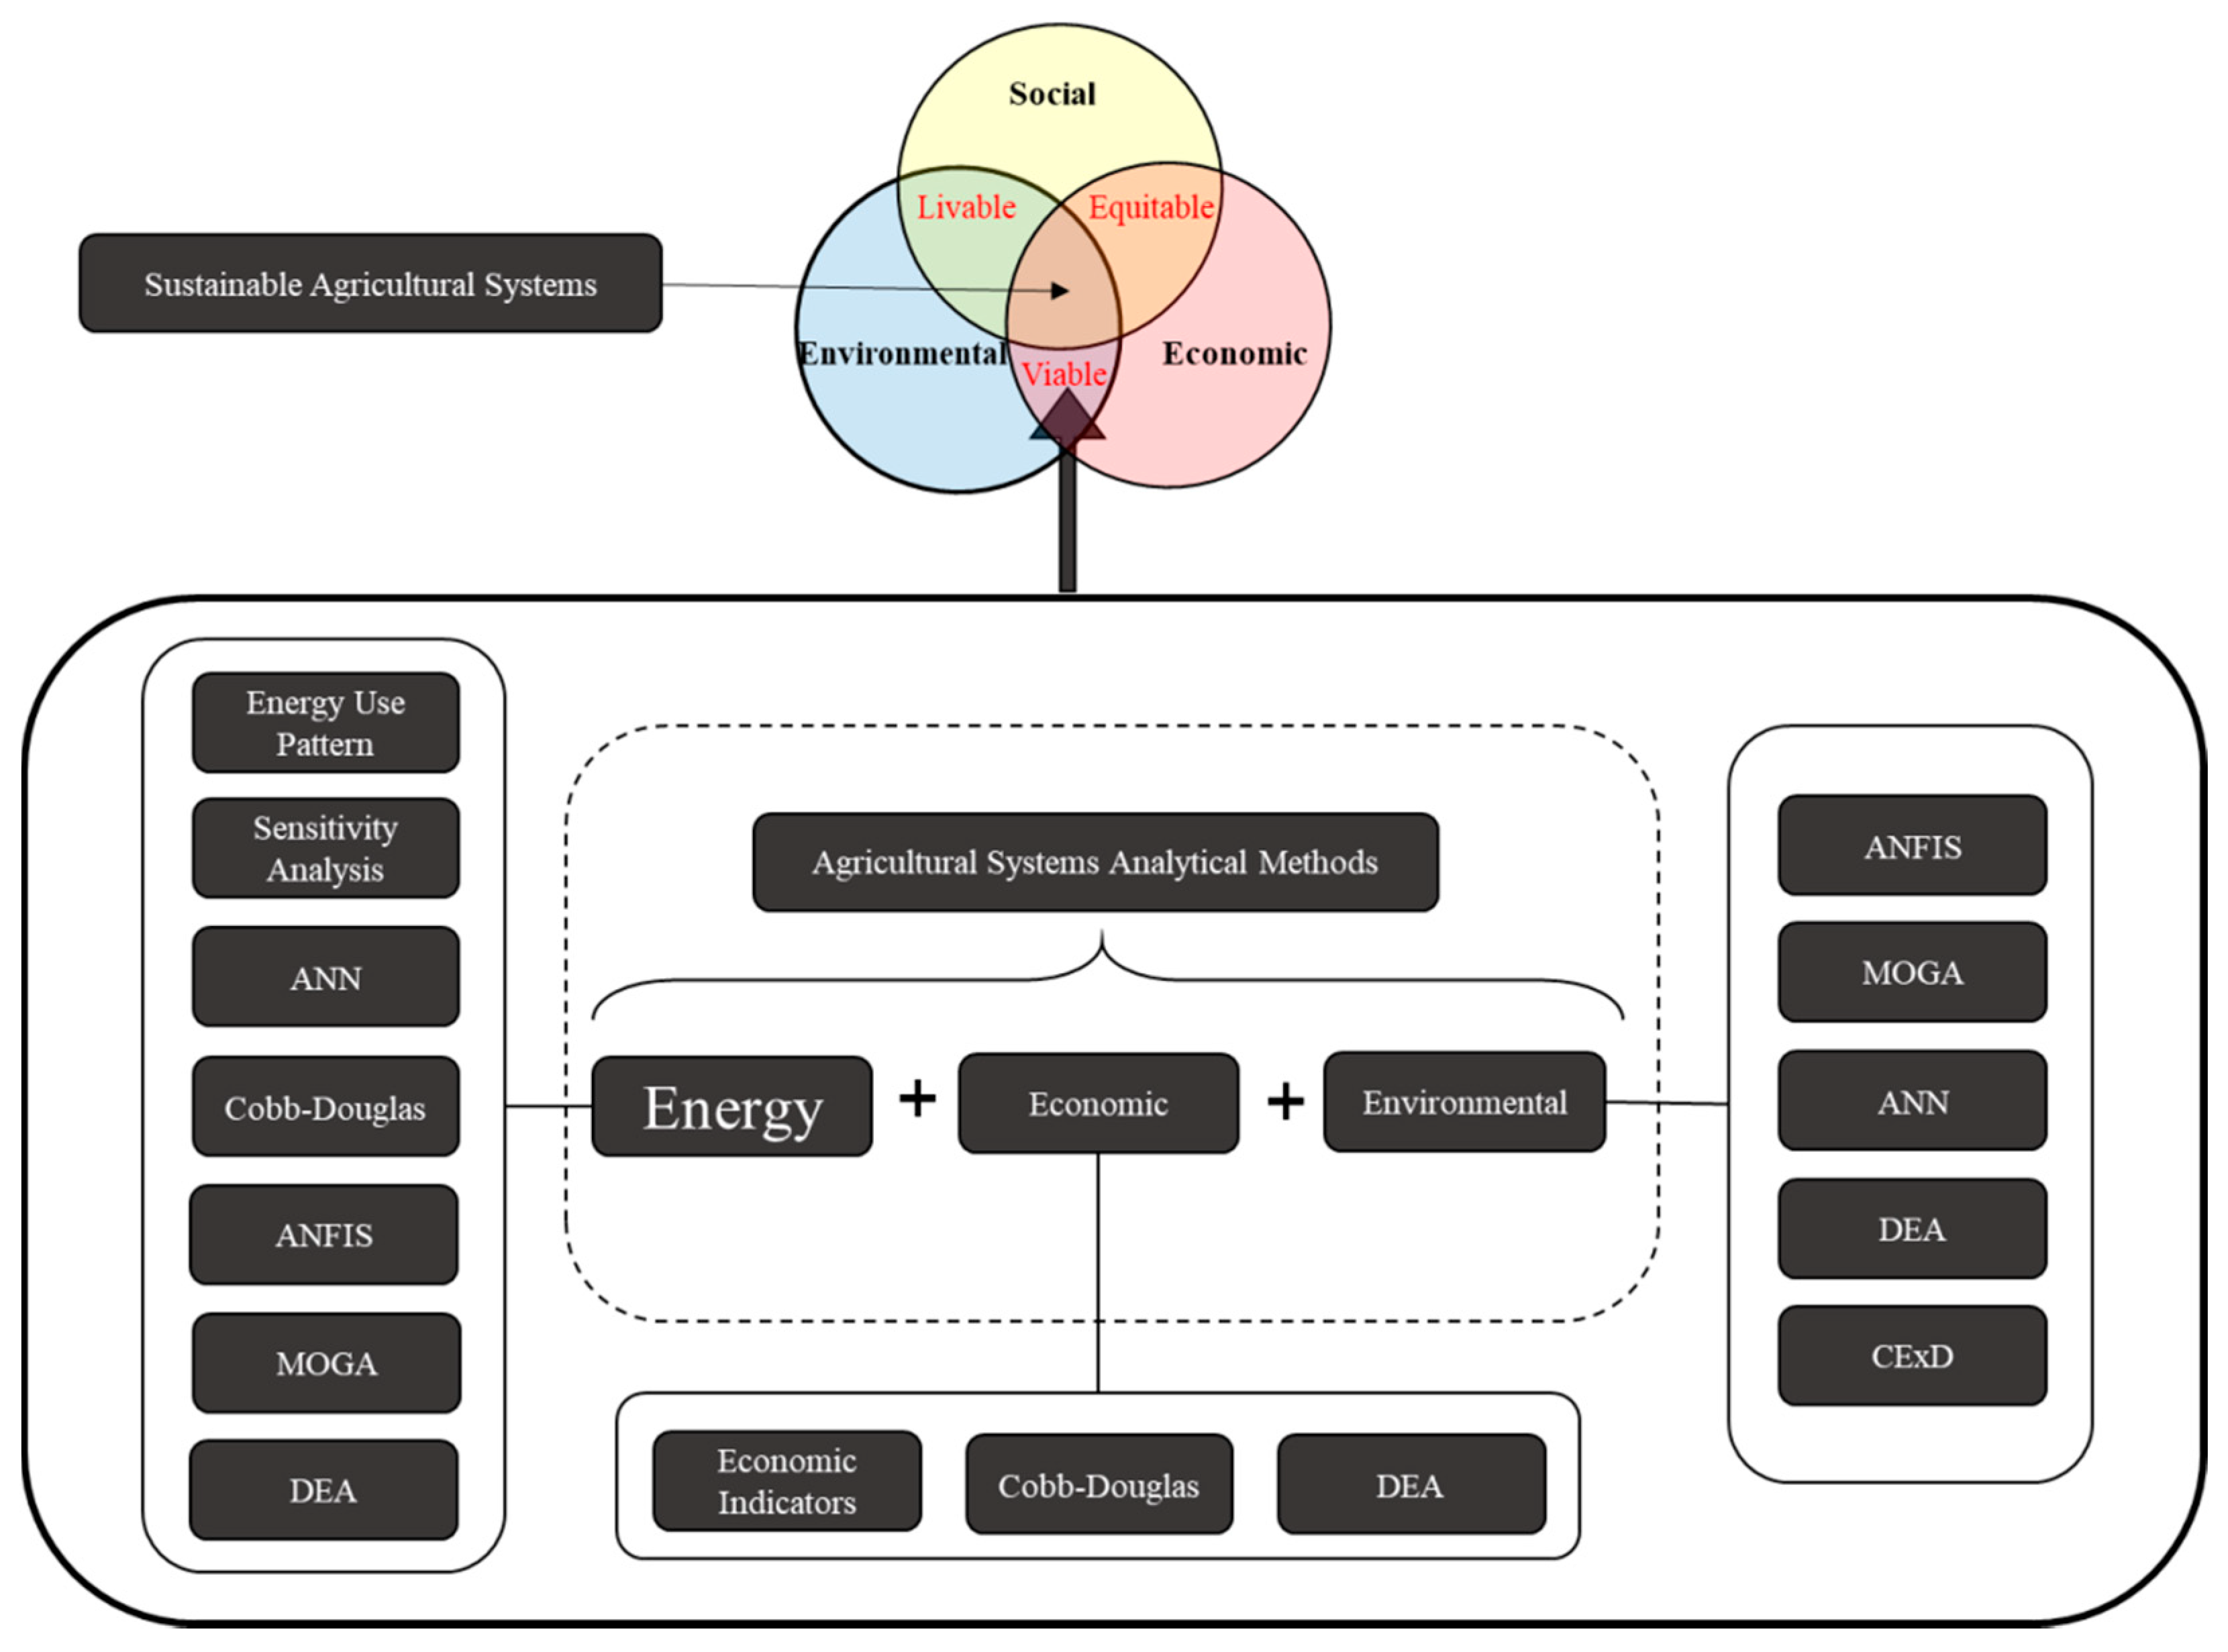
4. Discussion
4.1. Summary of Evidence
Artificial Intelligence Potential in Future Research
4.2. Limitations
4.2.1. Coordination of Research with Iranian Agriculture Sector
4.2.2. Local Energy Equivalents
4.2.3. Sample Size
4.3. Conclusions
Author Contributions
Funding
Conflicts of Interest
Abbreviations
| AI | Artificial Intelligence |
| ANFIS | Adaptive Neuro-Fuzzy Inference System |
| ANN | Artificial Neural Networks |
| ANOVA | Analysis of Variance |
| CExD | Cumulative Exergy Demand Analysis |
| DE | Direct Energy |
| DEA | Data Envelopment Analysis |
| EP | Energy Productivity |
| EUE | Energy Use Efficiency |
| FYM | Farm Yard Manure |
| GHG | Greenhouse Gas |
| GWP | Global Warming Potential |
| IDE | In-Direct Energy |
| IE | Input Energy |
| LCA | Life Cycle Analysis |
| LCI | Life Cycle Inventory |
| LCIA | Life Cycle Inventory Analysis |
| MOGA | Multi-Objective Genetic Algorithm |
| MPP | Marginal Physical Productivity |
| NRE | Non-Renewable Energy |
| PTE | Pure Technical Efficiency |
| RE | Renewable Energy |
| SE | Scale Efficiency |
| TE | Technical Efficiency |
| TEI | Total Input Energy |
| TES | Total Energy Saving |
References
- Hosseinzadeh-Bandbafha, H.; Nabavi-Pelesaraei, A.; Khanali, M.; Ghahderijani, M.; Chau, K.-W. Application of data envelopment analysis approach for optimization of energy use and reduction of greenhouse gas emission in peanut production of Iran. J. Clean. Prod. 2018, 172, 1327–1335. [Google Scholar] [CrossRef]
- Pishgar-Komleh, S.H.; Ghahderijani, M.; Sefeedpari, P. Energy consumption and CO 2 emissions analysis of potato production based on different farm size levels in Iran. J. Clean. Prod. 2012, 33, 183–191. [Google Scholar] [CrossRef]
- Zahedi, M.; Mondani, F.; Eshghizadeh, H. Analyzing the energy balances of double-cropped cereals in an arid region. Energy Rep. 2015, 1, 43–49. [Google Scholar] [CrossRef]
- Raheli, H.; Rezaei, R.M.; Jadidi, M.R.; Mobtaker, H.G. A two-stage DEA model to evaluate sustainability and energy efficiency of tomato production. Inf. Process. Agric. 2017, 4, 342–350. [Google Scholar] [CrossRef]
- Zangeneh, M.; Omid, M.; Akram, A. A comparative study on energy use and cost analysis of potato production under different farming technologies in Hamadan province of Iran. Energy 2010, 35, 2927–2933. [Google Scholar] [CrossRef]
- Taheri-Rad, A.; Khojastehpour, M.; Rohani, A.; Khoramdel, S.; Nikkhah, A. Energy flow modeling and predicting the yield of Iranian paddy cultivars using artificial neural networks. Energy 2017, 135, 405–412. [Google Scholar] [CrossRef]
- Pishgar-Komleh, S.H.; Akram, A.; Keyhani, A.; Raei, M.; Elshout, P.M.F.; Huijbregts, M.A.J.; van Zelm, R. Variability in the carbon footprint of open-field tomato production in Iran—A case study of Alborz and East-Azerbaijan provinces. J. Clean. Prod. 2017, 142, 1510–1517. [Google Scholar] [CrossRef]
- Kazemi, H.; Shahbyki, M.; Baghbani, S. Energy analysis for faba bean production: A case study in Golestan province, Iran. Sustain. Prod. Consum. 2015, 3, 15–20. [Google Scholar] [CrossRef]
- Pishgar Komleh, S.H.; Keyhani, A.; Rafiee, S.; Sefeedpary, P. Energy use and economic analysis of corn silage production under three cultivated area levels in Tehran province of Iran. Energy 2011, 36, 3335–3341. [Google Scholar] [CrossRef]
- Ramedani, Z.; Rafiee, S.; Heidari, M.D. An investigation on energy consumption and sensitivity analysis of soybean production farms. Energy 2011, 36, 6340–6344. [Google Scholar] [CrossRef]
- Yousefi, M.; Gazvineh, S. Diesel Fuel Consumption and Energy Use Effiicency of Rainfed Barley Production Systems in Iran. World Appl. Sci. J. 2011, 13, 1375–1379. [Google Scholar]
- Anonymous. Detailed Results of the General Agricultural Census of Golestan Province; Iran’s Statistics Center: Tehran, Iran, 2014. [Google Scholar]
- Kazemi, H.; Kamkar, B.; Lakzaei, S.; Badsar, M.; Shahbyki, M. Energy flow analysis for rice production in different geographical regions of Iran. Energy 2015, 84, 390–396. [Google Scholar] [CrossRef]
- Beheshti Tabar, I.; Keyhani, A.; Rafiee, S. Energy balance in Iran’s agronomy (1990–2006). Renew. Sustain. Energy Rev. 2010, 14, 849–855. [Google Scholar] [CrossRef]
- Banaeian, N.; Zangeneh, M. Study on energy efficiency in corn production of Iran. Energy 2011, 36, 5394–5402. [Google Scholar] [CrossRef]
- Nagy, C. Energy Coefficients for Agriculture Inputs in Western Canada; Centre for Studies in Agriculture, Law and the Environment, University of Saskatchewan: Saskatoon, SK, Canada, 1999. [Google Scholar]
- Pimentel, D. Handbook of Energy Utilization in Agriculture; CRC Press: Boca Raton, FL, USA, 1980. [Google Scholar]
- Mohammadi, A.; Tabatabaeefar, A.; Shahin, S.; Rafiee, S.; Keyhani, A. Energy use and economical analysis of potato production in Iran a case study: Ardabil province. Energy Convers. Manag. 2008, 49, 3566–3570. [Google Scholar] [CrossRef]
- Delshiri, A.; AghaAlikhani, M. Input-output and economic analysis of soybean production in the main cultivation areas in Iran. Afr. J. Agric. Res. 2012, 7, 4894–4899. [Google Scholar]
- Houshyar, E.; Kiani, S.; Davoodi, M.J.S. Energy consumption efficiency for corn production utilizing data envelopment analysis (DEA) and analytical hierarchy process (AHP) techniques. Res. Crop. 2012, 13, 754–759. [Google Scholar]
- Lorzadeh, S.H.; Mahdavidamghani, A.; Enayatgholizadeh, M.R.; Yousefi, M. Energy Input-Output Analysis for Maize Production Systems in Shooshtar, Iran. Adv. Environ. Biol. 2011, 5, 3641–3644. [Google Scholar]
- Naeimeh, S.; Rafiee, S.; Mobli, H.; Mohammadi, A. An analysis of energy use and relation between energy inputs and yield, costs and income of garlic production in Iran. Renew. Energy 2011, 36, 1808–1813. [Google Scholar]
- Sahabi, H.; Feizi, H.; Amirmoradi, S. Which crop production system is more efficient in energy use: Wheat or barley? Environ. Dev. Sustain. 2013, 15, 711–721. [Google Scholar] [CrossRef]
- Sahabi, H.; Feizi, H.; Karbasi, A. Is saffron more energy and economic efficient than wheat in crop rotation systems in northeast Iran? Sustain. Prod. Consum. 2016, 5, 29–35. [Google Scholar] [CrossRef]
- Avval, S.H.M.; Rafiee, S.; Jafari, A.; Mohammadi, A. Improving energy productivity of sunflower production using data envelopment analysis (DEA) approach. J. Sci. Food Agric. 2011, 91, 1885–1892. [Google Scholar] [CrossRef]
- Shahin, S.; Jafari, A.; Mobli, H.; Karimi, M. Effect of Farm Size on Energy Ratio for Wheat Production: A Case Study from Ardabil Province of Iran. Am. Eurasian J. Agric. Environ. Sci. 2008, 3, 604–608. [Google Scholar]
- Shahan, S.; Jafari, A.; Mobli, H.; Rafiee, S.; Karimi, M. Energy use and economical analysis of wheat production in Iran: A case study from Ardabil province. J. Agric. Technol. 2008, 4, 77–88. [Google Scholar]
- Ziaei, S.M.; Mazloumzadeh, S.M.; Jabbary, M. A comparison of energy use and productivity of wheat and barley (case study). J. Saudi Soc. Agric. Sci. 2015, 14, 19–25. [Google Scholar] [CrossRef]
- Mohammadi, A.; Omid, M. Economical analysis and relation between energy inputs and yield of greenhouse cucumber production in Iran. Appl. Energy 2010, 87, 191–196. [Google Scholar] [CrossRef]
- Yousefi, M.; Damghani, A.M.; Khoramivafa, M. Energy consumption, greenhouse gas emissions and assessment of sustainability index in corn agroecosystems of Iran. Sci. Total Environ. 2014, 493, 330–335. [Google Scholar] [CrossRef]
- Taghavifar, H.; Mardani, A. Energy consumption analysis of wheat production in West Azarbayjan utilizing life cycle assessment (LCA). Renew. Energy 2015, 74, 208–213. [Google Scholar] [CrossRef]
- ISO14004. Environmental Management Systems: General Guidelines on Principles, Systems and Supporting Techniques; International Organization for Standardization: Geneva, Switzerland, 1996; Volume 14004. [Google Scholar]
- Nikkhah, A.; Firouzi, S.; El Haj Assad, M.; Ghnimi, S. Application of analytic hierarchy process to develop a weighting scheme for life cycle assessment of agricultural production. Sci. Total Environ. 2019, 665, 538–545. [Google Scholar] [CrossRef]
- Khoshnevisan, B.; Bolandnazar, E.; Shamshirband, S.; Shariati, H.M.; Anuar, N.B.; Mat Kiah, M.L. Decreasing environmental impacts of cropping systems using life cycle assessment (LCA) and multi-objective genetic algorithm. J. Clean. Prod. 2015, 86, 67–77. [Google Scholar] [CrossRef]
- Yousefi, M.; Khoramivafa, M.; Mondani, F. Integrated evaluation of energy use, greenhouse gas emissions and global warming potential for sugar beet (Beta vulgaris) agroecosystems in Iran. Atmos. Environ. 2014, 92, 501–505. [Google Scholar] [CrossRef]
- Khoshnevisan, B.; Rafiee, S.; Omid, M.; Mousazadeh, H. Applying data envelopment analysis approach to improve energy efficiency and reduce GHG (greenhouse gas) emission of wheat production. Energy 2013, 58, 588–593. [Google Scholar] [CrossRef]
- Khoshnevisan, B.; Rafiee, S.; Omid, M.; Yousefi, M.; Movahedi, M. Modeling of energy consumption and GHG (greenhouse gas) emissions in wheat production in Esfahan province of Iran using artificial neural networks. Energy 2013, 52, 333–338. [Google Scholar] [CrossRef]
- Khoshnevisan, B.; Shariati, H.M.; Rafiee, S.; Mousazadeh, H. Comparison of energy consumption and GHG emissions of open field and greenhouse strawberry production. Renew. Sustain. Energy Rev. 2014, 29, 316–324. [Google Scholar] [CrossRef]
- Sefeedpari, P.; Ghahderijani, M.; Pishgar-Komleh, S.H. Assessment the effect of wheat farm sizes on energy consumption and CO 2 emission. J. Renew. Sustain. Energy 2013, 5, 023131. [Google Scholar] [CrossRef]
- Mobtaker, H.G.; Taki, M.; Salehi, M.; Shahamat, E.Z. Application of nonparametric method to improve energy productivity and CO2 emission for barley production in Iran. Agric. Eng. Int. CIGR J. 2013, 15, 84–93. [Google Scholar]
- Nabavi-Pelesaraei, A.; Rafiee, S.; Mohtasebi, S.S.; Hosseinzadeh-Bandbafha, H.; Chau, K.-w. Assessment of optimized pattern in milling factories of rice production based on energy, environmental and economic objectives. Energy 2019, 169, 1259–1273. [Google Scholar] [CrossRef]
- Stoellinger, T.; Righetti, T.; Coddington, K. Impact of social cost of carbon analyses in the development of energy projects on federal land. Electr. J. 2016, 29, 63–70. [Google Scholar] [CrossRef]
- Mousavi-Avval, S.H.; Rafiee, S.; Jafari, A.; Mohammadi, A. The Functional Relationship Between Energy Inputs and Yield Value of Soybean Production in Iran. Int. J. Green Energy 2011, 8, 398–410. [Google Scholar] [CrossRef]
- Banaeian, N.; Zangeneh, M. Estimating production function of walnut production in iran using cobb-douglas method. Agricultura Tropica et Subtropica 2011, 44, 177–189. [Google Scholar]
- Banaeian, N.; Zangeneh, M. Modeling energy flow and economic analysis for walnut production in Iran. Res. J. Appl. Sci. Eng. Technol. 2011, 3, 194–201. [Google Scholar]
- Troujeni, M.E.; Khojastehpour, M.; Vahedi, A.; Emadi, B. Sensitivity analysis of energy inputs and economic evaluation of pomegranate production in Iran. Inf. Process. Agric. 2018, 5, 114–123. [Google Scholar] [CrossRef]
- Banaeian, N.; Omid, M.; Ahmadi, H. Greenhouse strawberry production in Iran, efficient or inefficient in energy. Energy Effic. 2012, 5, 201–209. [Google Scholar] [CrossRef]
- Banaeian, N. Do the cattle farms of Iran produce economically efficient or not? Asian J. Agric. Sci. 2011, 3, 142–149. [Google Scholar]
- Charnes, A.; Cooper, W.W.; Rhodes, E. Measuring the efficiency of decision making units. Eur. J. Oper. Res. 1978, 2, 429–444. [Google Scholar] [CrossRef]
- Banker, R.D.; Charnes, A.; Cooper, W.W. Some models for estimating technical and scale efficiencies in data envelopment analysis. Manag. Sci. 1984, 30, 1078–1092. [Google Scholar] [CrossRef]
- Hu, J.L.; Kao, C.H. Efficient energy-saving targets for APEC economies. Energy Policy 2007, 35, 373–382. [Google Scholar] [CrossRef]
- Ghasemi Mobtaker, H.; Akram, A.; Keyhani, A.; Mohammadi, A. Optimization of energy required for alfalfa production using data envelopment analysis approach. Energy Sustain. Dev. 2012, 16, 242–248. [Google Scholar] [CrossRef]
- Pahlavan, R.; Omid, M.; Akram, A. Energy input–output analysis and application of artificial neural networks for predicting greenhouse basil production. Energy 2012, 37, 171–176. [Google Scholar] [CrossRef]
- Naderloo, L.; Alimardani, R.; Omid, M.; Sarmadian, F.; Javadikia, P.; Torabi, M.Y.; Alimardani, F. Application of ANFIS to predict crop yield based on different energy inputs. Measurement 2012, 45, 1406–1413. [Google Scholar] [CrossRef]
- Banaeian, N.; Namdari, M. Effect of ownership on energy use efficiency in watermelon farms—A data envelopment analysis approach. Int. J. Renew. Energy Res. 2011, 1, 75–82. [Google Scholar]
- Shamshirband, S.; Khoshnevisan, B.; Yousefi, M.; Bolandnazar, E.; Anuar, N.B.; Abdul Wahab, A.W.; Khan, S.U.R. A multi-objective evolutionary algorithm for energy management of agricultural systems—A case study in Iran. Renew. Sustain. Energy Rev. 2015, 44, 457–465. [Google Scholar] [CrossRef]
- Moradi, R.; Moghaddam, P.R.; Mansoori, H. Energy use and economical analysis of seedy watermelon production for different irrigation systems in Iran. Energy Rep. 2015, 1, 36–42. [Google Scholar] [CrossRef][Green Version]
- Khoshnevisan, B.; Bolandnazar, E.; Barak, S.; Shamshirband, S.; Maghsoudlou, H.; Altameem, T.A.; Gani, A. A clustering model based on an evolutionary algorithm for better energy use in crop production. Stoch. Environ. Res. Risk Assess. 2015, 29, 1921–1935. [Google Scholar] [CrossRef]
- Nabavi-Pelesaraei, A.; Abdi, R.; Rafiee, S.; Bagheri, I. Determination of efficient and inefficient units for watermelon production-a case study: Guilan province of Iran. J. Saudi Soc. Agric. Sci. 2016, 15, 162–170. [Google Scholar] [CrossRef]
- Nabavi-Pelesaraei, A.; Abdi, R.; Rafiee, S. Neural network modeling of energy use and greenhouse gas emissions of watermelon production systems. J. Saudi Soc. Agric. Sci. 2016, 15, 38–47. [Google Scholar] [CrossRef]
- Mohammadi-Barsari, A.; Firouzi, S.; Aminpanah, H. Energy-use pattern and carbon footprint of rain-fed watermelon production in Iran. Inf. Process. Agric. 2016, 3, 69–75. [Google Scholar] [CrossRef]
- Asgharipour, M.R.; Mondani, F.; Riahinia, S. Energy use efficiency and economic analysis of sugar beet production system in Iran: A case study in Khorasan Razavi province. Energy 2012, 44, 1078–1084. [Google Scholar] [CrossRef]
- Khanali, M.; Movahedi, M.; Yousefi, M.; Jahangiri, S.; Khoshnevisan, B. Investigating energy balance and carbon footprint in saffron cultivation—A case study in Iran. J. Clean. Prod. 2016, 115, 162–171. [Google Scholar] [CrossRef]
- Firouzi, S.; Vishekaei, M.N.S.; Aminpanah, H. Analysis of energy utilization of peanut-bean intercrop. J. Food Agric. Environ. 2012, 10, 655–658. [Google Scholar]
- Mousavi-Avval, S.H.; Rafiee, S.; Sharifi, M.; Hosseinpour, S.; Shah, A. Combined application of Life Cycle Assessment and Adaptive Neuro-Fuzzy Inference System for modeling energy and environmental emissions of oilseed production. Renew. Sustain. Energy Rev. 2017, 78, 807–820. [Google Scholar] [CrossRef]
- Mousavi-Avval, S.H.; Rafiee, S.; Sharifi, M.; Hosseinpour, S.; Notarnicola, B.; Tassielli, G.; Renzulli, P.A. Application of multi-objective genetic algorithms for optimization of energy, economics and environmental life cycle assessment in oilseed production. J. Clean. Prod. 2017, 140, 804–815. [Google Scholar] [CrossRef]
- Zangeneh, M.; Omid, M.; Akram, A. Assessment of machinery energy ratio in potato production by means of Artificial Neural Network. Afr. J. Agric. Res. 2010, 5, 993–998. [Google Scholar]
- Taki, M.; Mahmoudi, A.; Mobtaker, H.G.; Rahbari, H. Energy consumption and modeling of output energy with multilayer feed-forward neural network for corn silage in Iran. Agric. Eng. Int. CIGR J. 2012, 14, 93–101. [Google Scholar]
- Sheikhdavoodi, M.J.; Taki, M.; Monjezi, N. Application of artificial neural networks ANNs to predict energy output for wheat production in Iran. Afr. J. Agric. Res. 2013, 8, 2099–2105. [Google Scholar]
- Farjam, A.; Omid, M.; Akram, A.; Fazel Niari, Z. A neural network based modeling and sensitivity analysis of energy inputs for predicting seed and grain corn yields. J. Agric. Sci. Technol. 2014, 16, 767–778. [Google Scholar]
- Khoshnevisan, B.; Rafiee, S.; Omid, M.; Yousefi, M. Prediction of environmental indices of Iran wheat production using artificial neural networks. Int. J. Energy Environ. 2013, 4, 339–348. [Google Scholar]
- Khoshnevisan, B.; Rafiee, S.; Omid, M.; Mousazadeh, H.; Sefeedpari, P. Prognostication of environmental indices in potato production using artificial neural networks. J. Clean. Prod. 2013, 52, 402–409. [Google Scholar] [CrossRef]
- Elhami, B.; Khanali, M.; Akram, A. Combined application of Artificial Neural Networks and life cycle assessment in lentil farming in Iran. Inf. Process. Agric. 2017, 4, 18–32. [Google Scholar] [CrossRef]
- Taghavifar, H.; Mardani, A. Prognostication of energy consumption and greenhouse gas (GHG) emissions analysis of apple production in West Azarbayjan of Iran using Artificial Neural Network. J. Clean. Prod. 2015, 87, 159–167. [Google Scholar] [CrossRef]
- Nabavi-Pelesaraei, A.; Rafiee, S.; Hosseinzadeh-Bandbafha, H.; Shamshirband, S. Modeling energy consumption and greenhouse gas emissions for kiwifruit production using artificial neural networks. J. Clean. Prod. 2016, 133, 924–931. [Google Scholar] [CrossRef]
- Khoshnevisan, B.; Rafiee, S.; Omid, M.; Mousazadeh, H.; Shamshirband, S.; Hamid, S.H.A. Developing a fuzzy clustering model for better energy use in farm management systems. Renew. Sustain. Energy Rev. 2015, 48, 27–34. [Google Scholar] [CrossRef]
- Yousefi, M.; Khoshnevisan, B.; Shamshirband, S.; Motamedi, S.; Nasir, M.H.N.M.; Arif, M.; Ahmad, R. Support vector regression methodology for prediction of output energy in rice production. Stoch. Environ. Res. Risk Assess. 2015, 29, 2115–2126. [Google Scholar] [CrossRef]
- Rajabi Hamedani, S.; Liaqat, M.; Shamshirband, S.; Al-Razgan, O.S.; Al-Shammari, E.T.; Petković, D. Comparative Study of Soft Computing Methodologies for Energy Input–Output Analysis to Predict Potato Production. Am. J. Potato Res. 2015, 92, 426–434. [Google Scholar] [CrossRef]
- Khoshnevisan, B.; Rafiee, S.; Iqbal, J.; Shamshirband, S.; Omid, M.; Anuar, N.B.; Abdul Wahab, A.W. A comparative study between artificial neural networks and adaptive neuro-fuzzy inference systems for modeling energy consumption in greenhouse tomato production: A case study in isfahan province. J. Agric. Sci. Technol. 2015, 17, 49–62. [Google Scholar]
- Khoshnevisan, B.; Rafiee, S.; Omid, M.; Mousazadeh, H. Development of an intelligent system based on ANFIS for predicting wheat grain yield on the basis of energy inputs. Inf. Process. Agric. 2014, 1, 14–22. [Google Scholar] [CrossRef]
- Nabavi-Pelesaraei, A.; Hosseinzadeh-Bandbafha, H.; Qasemi-Kordkheili, P.; Kouchaki-Penchah, H.; Riahi-Dorcheh, F. Applying optimization techniques to improve of energy efficiency and GHG (greenhouse gas) emissions of wheat production. Energy 2016, 103, 672–678. [Google Scholar] [CrossRef]
- Elhami, B.; Akram, A.; Khanali, M. Optimization of energy consumption and environmental impacts of chickpea production using data envelopment analysis (DEA) and multi objective genetic algorithm (MOGA) approaches. Inf. Process. Agric. 2016, 3, 190–205. [Google Scholar] [CrossRef]
- Nabavi-Pelesaraei, A.; Rafiee, S.; Mohtasebi, S.S.; Hosseinzadeh-Bandbafha, H.; Chau, K.-w. Energy consumption enhancement and environmental life cycle assessment in paddy production using optimization techniques. J. Clean. Prod. 2017, 162, 571–586. [Google Scholar] [CrossRef]
- The Ministry of Jihad-Agriculture. A Survey on Harvest Area and Production Volume of Farm Crops in 36 Years; The Ministry of Jihad-Agriculture: Tehran, Iran, 2015.
- Hamedani, S.R.; Shabani, Z.; Rafiee, S. Energy inputs and crop yield relationship in potato production in Hamadan province of Iran. Energy 2011, 36, 2367–2371. [Google Scholar] [CrossRef]
- FAO. Food Energy—Methods of Analysis and Conversion Factors; Food and Agriculture Organization of the United Nations: Rome, Italy, 2003. [Google Scholar]


| Inputs (Unit) | Energy Equivalent (MJ Per Unit) | References | |
|---|---|---|---|
| Labor (h) | 1.96 | [18] | |
| Machinery (h) | 62.7 | [19] | |
| Diesel fuel (L) | 56.3 | [20] | |
| Fertilizers (kg) | Nitrogen | 66.14 | [21] |
| Phosphate | 12.44 | [21] | |
| Potassium | 11.15 | [3] | |
| Micro | 120 | [3] | |
| Farmyard Manure (kg) | 0.3 | [22] | |
| Chemicals (kg) | Herbicide | 356.29 | [23] |
| Pesticide | 280.44 | [23] | |
| Fungicide | 181.9 | [23] | |
| Insecticide | 101.9 | [8] | |
| Water (m3) | 1.02 | [24] | |
| Electricity (kWh) | 11.93 | [25] | |
| Inputs (Inventories) | Unit | CO2 Eq. Unit−1 | References |
|---|---|---|---|
| Machinery | MJ | 0.071 | [2] |
| Diesel fuel | L | 2.76 | [36] |
| Nitrogen | kg | 1.3 | [37] |
| Phosphorus | kg | 0.2 | [37] |
| Potassium | kg | 0.2 | [37] |
| Electricity | kWh | 0.608 | [36] |
| Natural Gas | m3 | 0.85 | [38] |
| FYM | kg | 0.126 | [39] |
| Herbicide | kg | 6.3 | [40] |
| Insecticide | kg | 5.1 | [39] |
| Fungicide | kg | 3.9 | [39] |
| Impact Category | Unit |
|---|---|
| Climate change, Global Warming, Greenhouse Gas | kg CO2 eq. |
| Ozone Layer Depletion | g CFC-11 eq. |
| Abiotic Depletion | kg Sb eq. |
| Acidification, Terrestrial Acidification | kg SO2 eq. |
| Eutrophication, Freshwater Eutrophication | kg PO4−3 |
| Human Toxicity, Freshwater Aquatic Ecotoxicity, Marine Aquatic Ecotoxicity, Terrestrial Ecotoxicity | kg 1,4-DB eq. |
| Photochemical Oxidation | kg C2H4 eq. |
| Cumulative Energy Demand | MJ eq. |
| Emission Indices | Emission Equivalent for Electricity Consumption (kg kWh−1) | Emission Equivalent for Diesel Fuel Consumption (g MJ−1) | Emission Equivalent for Natural Gas Consumption (kg m−3) | Emission Equivalent for Burning Straw (kg ton−1) |
|---|---|---|---|---|
| NOx | ||||
| SO2 | ||||
| CO | ||||
| SPM | ||||
| CO2 | ||||
| CH4 | ||||
| N2O |
| Social Cost for Emission Indices ($ kg−1) | CO2 | N2O | CH | PM 10 | NOx | SO2 | CO | NH3 |
| Amount | 0.01 | 4.58 | 0.21 | 4.3 | 0.6 | 1.825 | 0.187 | 2.83 |
Publisher’s Note: MDPI stays neutral with regard to jurisdictional claims in published maps and institutional affiliations. |
© 2020 by the authors. Licensee MDPI, Basel, Switzerland. This article is an open access article distributed under the terms and conditions of the Creative Commons Attribution (CC BY) license (http://creativecommons.org/licenses/by/4.0/).
Share and Cite
Banaeian, N.; Zangeneh, M.; Clark, S. Trends and Future Directions in Crop Energy Analyses: A Focus on Iran. Sustainability 2020, 12, 10002. https://doi.org/10.3390/su122310002
Banaeian N, Zangeneh M, Clark S. Trends and Future Directions in Crop Energy Analyses: A Focus on Iran. Sustainability. 2020; 12(23):10002. https://doi.org/10.3390/su122310002
Chicago/Turabian StyleBanaeian, Narges, Morteza Zangeneh, and Sean Clark. 2020. "Trends and Future Directions in Crop Energy Analyses: A Focus on Iran" Sustainability 12, no. 23: 10002. https://doi.org/10.3390/su122310002
APA StyleBanaeian, N., Zangeneh, M., & Clark, S. (2020). Trends and Future Directions in Crop Energy Analyses: A Focus on Iran. Sustainability, 12(23), 10002. https://doi.org/10.3390/su122310002