Article

Improvement of the Performance Balance between Thermal Comfort and Energy Use for a Building Space in the Mid-Spring Season

School of Architecture and Design Convergence, Hankyong National University, Anseong 17579, Korea
Sustainability 2020, 12(22), 9667; https://doi.org/10.3390/su12229667
Submission received: 21 October 2020 / Revised: 15 November 2020 / Accepted: 16 November 2020 / Published: 19 November 2020
(This article belongs to the Special Issue Thermal Behavior and Energy Efficiency of Buildings)

Abstract

:
In thermal controls in buildings, recent statistical and data-driven approaches to optimize supply air conditions have been examined in association with several types of building spaces and patterns of energy consumption. However, many strategies may have some problems where high-control precision may increase energy use, or low energy use in systems may decrease indoor thermal quality. This study investigates a neural network algorithm with an adaptive model on how to control the supply air conditions reflecting learned data. During the process, the adaptive model complements the signals from the network to independently maintain the comfort level within setting ranges. Although the proposed model effectively optimizes energy consumption and supply air conditions, it achieves quite improved comfort levels about 14% more efficient than comparison models. Consequently, it is confirmed that a network and learning algorithm equipped with an adaptive controller properly responds to users’ comfort levels and system’s energy consumption in a single space. The improved performance in space levels can be significant in places where many spaces are systematically connected, and in places which require a high consistency of indoor thermal comfort. Another advantage of the proposed model is that it properly reduces an increase in energy consumption despite an intensive strategy is utilized to improve thermal comfort.

1. Thermal Systems in Buildings

In building science, the improvement of energy efficiency has been regarded, beyond the purpose of saving costs for the building operation and maintenance, as a major factor that is closely related to the industrial workability and productivity. Therefore, no matter how efficient the building’s energy use is, it ignores the environmental requirements of the interior space. However, excluding the comfort of actual users will be an approach that undermines the sustainability of the building. However, not long ago, just improving the efficiency of energy use was quite a difficult problem for energy distribution systems that have become exponentially more complex as buildings have developed larger and more systematic. Unlike past systems reflecting limited test variables, many current diversified thermal control systems have pursued an efficient energy use by use of utilization of various control strategies to determine optimized rules. They have examined modern statistical models and advanced metering methods, and the various patterns were analyzed and compared each other. In the Heating, Ventilation, and Air Conditioning (HVAC) system, refined numerical information in its inner structure was utilized in reflecting the adjustment of various parameters, functions, and coefficients. Amongst this, the Proportional Integral Derivative (PID) model was frequently utilized to improve the control rules for generators, exchangers, and distributors, especially, in the field of rule-based thermal control systems [1,2,3].
The control effectiveness of the approaches facilitating advanced hardware was remarkably improved with useful mathematical and statistical tools dealing with complex problems such as the Fuzzy Inference System (FIS) and Artificial Neural Network (ANN). The FIS linguistic model can interpret some complex problems requiring deterministic numbers to solve. One distinct characteristic of the FIS is to utilize linguistic deterministic rules to define ambiguous situations which have some hardships to approach with clear numbers by traditional rule-based controls. With the PID model, fuzzy-based diagrammatic node topology was examined to define better control strategies in building thermal system operation. Several structures finding effective nodes were examined to adjust existing control rules for fuel injection in boilers, building systems, and energy distribution networks [4,5]. Through the use of the combination method of the fuzzy-based deterministic and conventional methods, several diversified tuning rules were examined to optimize control signals in thermal systems in buildings. Its membership functions derived from existing and simulated data have facilitated to solve ambiguous situations and helped to determine delicate numbers by reducing unpredicted errors [6,7]. In developing genetic algorithms for the analysis of regression models, the adjustment or modification of control signals by use of multicriteria approaches in the FIS has effectively calibrated real signals at the several cases of actual buildings’ HVAC systems [7,8,9]. The ANN model can help many researchers to solve complex calculation problems utilizing several polynomials which make them hard to handle by conventional approaches. Especially, when analyzing the effects of convection, radiation, ventilation, and infiltration between envelopes, the ANN models for various types of buildings have successfully provided precise regression models to find hidden interactions between several architectural elements [10,11]. Regarding various operational strategies in combustion and circulation of fuel depending on the types of energy systems in buildings, the ANN algorithm has been preferred to generate signals for sensitive controls of valves or dampers. The models based on the ANN were compared to traditional systems, and tested by means of combining theoretical rules responding to characterized conditions derived from various factors in actual buildings [12,13]. As effective components of dampers and resistance coils, they were examined to build auxiliary systems complementing main HVAC systems with newly analyzing multivariate regression models derived from situational and seasonal operation results. Connecting various building geometries and climate conditions, some systematic assumptions reflecting unpredictable occupant behaviors were investigated to define improved control or network strategies in combining the FIS and the ANN algorithms [14,15].
As the building thermal system aims to keep the indoor heat environment in association with user demands, many studies have been conducted on enhancing indoor thermal comfort as well as improving the efficiency in energy consumption. In order to effectively conclude the building performance of thermal comfort, survey-based and questionnaire-based studies were frequently utilized with subjective indicators based on various user’s responses and building’s characteristics [16,17]. In comparison with the qualitative approaches, objective and quantitative methods such as the Predicted Mean Vote (PMV) and the Predicted Percentage of Dissatisfied (PPD) have been preferred to effectively conclude the performance of thermal comfort in buildings as numerical indices. In order to assess more precise thermal sensation votes, the FIS and the ANN algorithms have been adopted in the PMV models to complement the interactions between initial configurations and adaptive processes. For the improved models to adjust conventional control rules, changes in occupant characteristics such as metabolic rates and clothing insulation in theoretical assumptions can be used to respond to changes in thermal situations associated with mechanical supply systems for cooling and heating air [18,19]. In addition to occupant related thermal factors, several conventional approaches reflecting spatial geometries, types of building envelopes, and motorized ventilation systems were developed to appropriately react extreme weather conditions. Meanwhile, comprehensive thermal comfort indices were gradually developed to approach specific requirements in respond to strengthened guidelines and regulations for local characteristics [20,21]. In many cases of modified approaches to effectively define meaningful interactions in the human factors, their inner structures of thermal systems and architectural components were investigated to compare mechanical functions with data-driven regression results for more reliable network-based models. Modified algorithms derived from experimental and presimulated data, in order to define several functions for several distinct situations, were examined to complement existing mechanical rules for energy supply and regression models for the PMV [22,23,24]. For more precise models in combining methods, cosimulation applications based on programming language were utilized to deal with the communication between thermal calculation and programming modules were to conduct their real-time correction reflecting analyses of predicted and resulted values in calculating thermal demands. Additionally, a calibration of virtual models by energy conservation measures was utilized to complement physical gaps between actual and simulated architectural elements such as walls, doors, windows, electrical equipment, and heating and cooling systems. Recent studies dealing with network structures concluded the results that successfully explained hidden interactions between architectural components and mechanical thermal factors by means of multidimensioned matrixes adopting several experimental regression models [25,26].
Despite the improvement of mechanical thermal models associated with advanced statistical tools have been performed, there is a necessity of the investigation of sensitive control models for supply heating and cooling energy into a single space scale which can be closely related to users’ workability and productivity. In addition, considering how to sustainably maintain the users’ thermal comfort, it is also necessary to examine control methods for the change of seasons when cooling and heating can be required at the same time. In this study, an adaptive controller-equipped, network-based model dealing with simultaneous controls of supply air mass and its temperature is proposed with comparative assessments by using thermal comfort indices and heat transfer. The proposed approaches are examined through the comparison of simple and fuzzy-based deterministic models in the Discussion, and both sides of the strengths and weaknesses are addressed to complement the proposed model by follow-up studies in the Conclusions.

2. Methodology

2.1. Overall Framework

This study aims to analyze the effectiveness of the ANN model with an adaptive controller to respond to the change of thermal demands through the deterministic methods of supply air conditions in a day of a mid-spring season. The inner structure of the combined model finds optimized points between the thermal energy transfer and the human comfort sensation vote, and sends refined signals to a room space. In order to understand the model’s work, a flow of the process is described as below:
(1)
A thermal transfer model calculates the heating and cooling energy transfer based on the characteristics of a small commercial office, occupant, and outdoor temperature conditions.
(2)
After the determination of the thermal energy transfer, the optimized supply air conditions go to the building space model to define thermal comfort levels by the PMV index at each one-minute time interval.
(3)
Based on the result, when the PMV level is over or under the setting range (−0.5 < x < 0.5), an equipped adaptive model changes Tset by ±0.5 for cooling or heating.
(4)
If the PMV level is still over or under the setting range (x < −0.5 or 0.5 < x), an adaptive model additionally adds values for Tset.
(5)
If the PMV level is still over or under the setting values, the adaptive model repeats the previous process. If not in any point, it stops the adaptive process and bypass the signals.
As it was generally known that the flow rate of air was linear-proportional, rather than that of water, it was assumed that the percentage of the damper opening was the same as the air amount into the space. In addition, it was assumed that the heat loss through the envelope occurred through the only conduction of walls, window, and roof, and the heat gain was from the HVAC model only. For the effective simulation process, the spatial variations of air pressure, velocity, and infiltration in the space, envelope, and duct systems were not considered.
Figure 1 and Table 1 display a conceptual framework for the deterministic processes and initial configurations for building geometries. Except for some assumptions, such as external work rate (0), relative humidity (50%), and air speed (0.1 m/s), the institutional standards and online-based template were utilized for specific parameters and values for recommended Troom, MET, and clo. The building thermal system was simulated by using separate heating and cooling systems in a single duct. As comparison models, a conventional thermostat and a fuzzy-based deterministic model were built. The proposed model was structured by use of the ANN algorithm with an adaptive controller which consisted of a dual switch for heating and cooling, and adjusted Tset according to the result of the PMV in the feedback process.

2.2. Heat Transfer Model

From the thermodynamic first law, the energy transfer by heat loss and gain through the building envelopes is given by [27]:
Q l o s s + Q g a i n = d u d t
where Q l o s s is heat loss through the building envelopes, Q g a i n is heat gain from the heater or cooler, U is internal energy, and t is time.
From the heat conduction transfer through the building envelopes, the heat loss of the building space, Q l o s s , is given by:
Q l o s s = T r o o m T o u t / 1 ( h o u t A ) + D k A + 1 h i n A
where h o u t and h i n are heat transfer coefficients, k is transmission coefficient, A is area, D is depth of envelope.
From the enthalpy and the mass flow rate, assuming that there is no work in the system, heat gain transfer of the building space, Q g a i n , is given by [27]:
Q g a i n = h t C p T h e a t e r T r o o m
The rate of internal energy is given by:
d u d t = m r o o m C v d T r o o m d t
From the processes, time derivative of Troom is rewritten by:
d T r o o m d t = 1 m r o o m C v T r o o m T o u t 1 / ( h o u t A ) + D / k A + 1 / ( h i n A ) + m . h t C p T h e a t e r T r o o m

2.3. PMV and PPD Models

Mathematically, indoor thermal comfort is measured by the PMV, and, from the PMV model developed by F.O. Fanger, the Predicted Percentage of Dissatisfied (PPD) is developed [28,29].
P M V = 3.155 0.303 e 0.114 M + 0.028 L
where M is metabolic rate, and L is thermal load.
L = q m e t , h e a t f c l h c T c l T a f c l h r T c l T r 156 W s k , r e q W a 0.42 q m e t , h e a t 18.43 0.00077 M 93.2 T a 2.78 M 0.0365 W a
Equation (6) and Equation (7) are used to detect thermal comfort level for buildings. Additionally, the PPD levels are defined by an exponential function of the PMV like below [28,29]:
P P D = 100 95 e 0.03353 P M V 4 0.2179 P M V 2

2.4. Three Different Controllers

As a comparison model, a thermostat controller works according to the setting value of Tset, 18 °C for heating and 25.5 °C for cooling. It automatically turns on and off within Tset = ± 1 °C, which is a dead-band as a default configuration frequently used in practice. For instance, if Troom reaches 26.5 °C, the thermostat sends an on-signal to the cooling system. On the contrary, if Troom reaches 24.5 °C, it sends an off-signal to the cooling system.
As an additional comparison model, the FIS algorithm is utilized and mainly investigate the effectiveness of real-time deterministic control by the decision numbers from multiple membership functions, which uses the temperature differences between Tset and Troom. A basic structure of two different membership functions is described by the differences between Tset and Troom (E) and their time serial derivative of EE) [30]:
E = T s e t T r o o m
Δ E = E n E n 1 Δ t
i f   x   i s   A   a n d   y   i s   C   t h e n   f 1 = p 1 x + q 1 y + r 1
Two output variables of the amount of air, from 0 (0%) to 1 (100%), and its temperature, from −10 °C to 10 °C, adopt multiple membership functions calculated from the two inputs, E and ΔE. The first layer consists of inputs 1 and 2, which delivers the values to the two membership functions for the mass and the temperature, then, each triangle membership function is chosen with maximum equal to 1 and minimum equal to 0 divided by 4 intervals like below.
μ x = t r i a n g l e x ; a i ,   b i ,   c i =   x a i 0 a i x b i   x a i b i a i b i x c i   c i x c i b i c i x 0
As a proposed model to be analyzed, the ANN algorithm is utilized as a main structure, which consists of a large class of several structures. The approximation of the function is the multilayer perception built by 2 input layers, 10 hidden layers, and 1 output layer. After, the inputs x1,…xk into the network are multiplied by weights wki, they are summed up with the constant bias term θi. The result of ni is the input to the activation function g [31,32]. Finally, the weights and thresholds are updated, this network runs with the gradient of errors as followings [31,32].
n = i = 1 K x i ω i θ
δ k p = ϑ y k p ϑ n k p e k p
In the ANN structure, two inputs are E and ΔE from the thermostat signals like the FIS. Then one output layer is sent as a control signal for air mass and temperature. Training of the ANN algorithm is conducted to investigate an optimized regression model which can maintain Troom to within the setting range of the PMV value. As data for training the ANN algorithm, the thermostat and the fuzzy controlled energy consumption pattern of 3 different building types (commercial office, retail, restaurant) in 7 weather conditions in the US from the Energy Efficiency & Renewable Energy report of the US Department of Energy was used with the heat transfer formula used in the heat transfer model. For source-effective results, a scale conjugate gradient algorithm was adopted in the simulation configuration of maximum 1000 times iterations, and under 10 times epoch number to receive a satisfactory statistical validation. After these repetitions, the simulation results displayed statistical validated R2 values as 0.99438 for controlling heating or cooling supply air mass and as 0.99749 for controlling its temperature, respectively.

2.5. Simulation Model

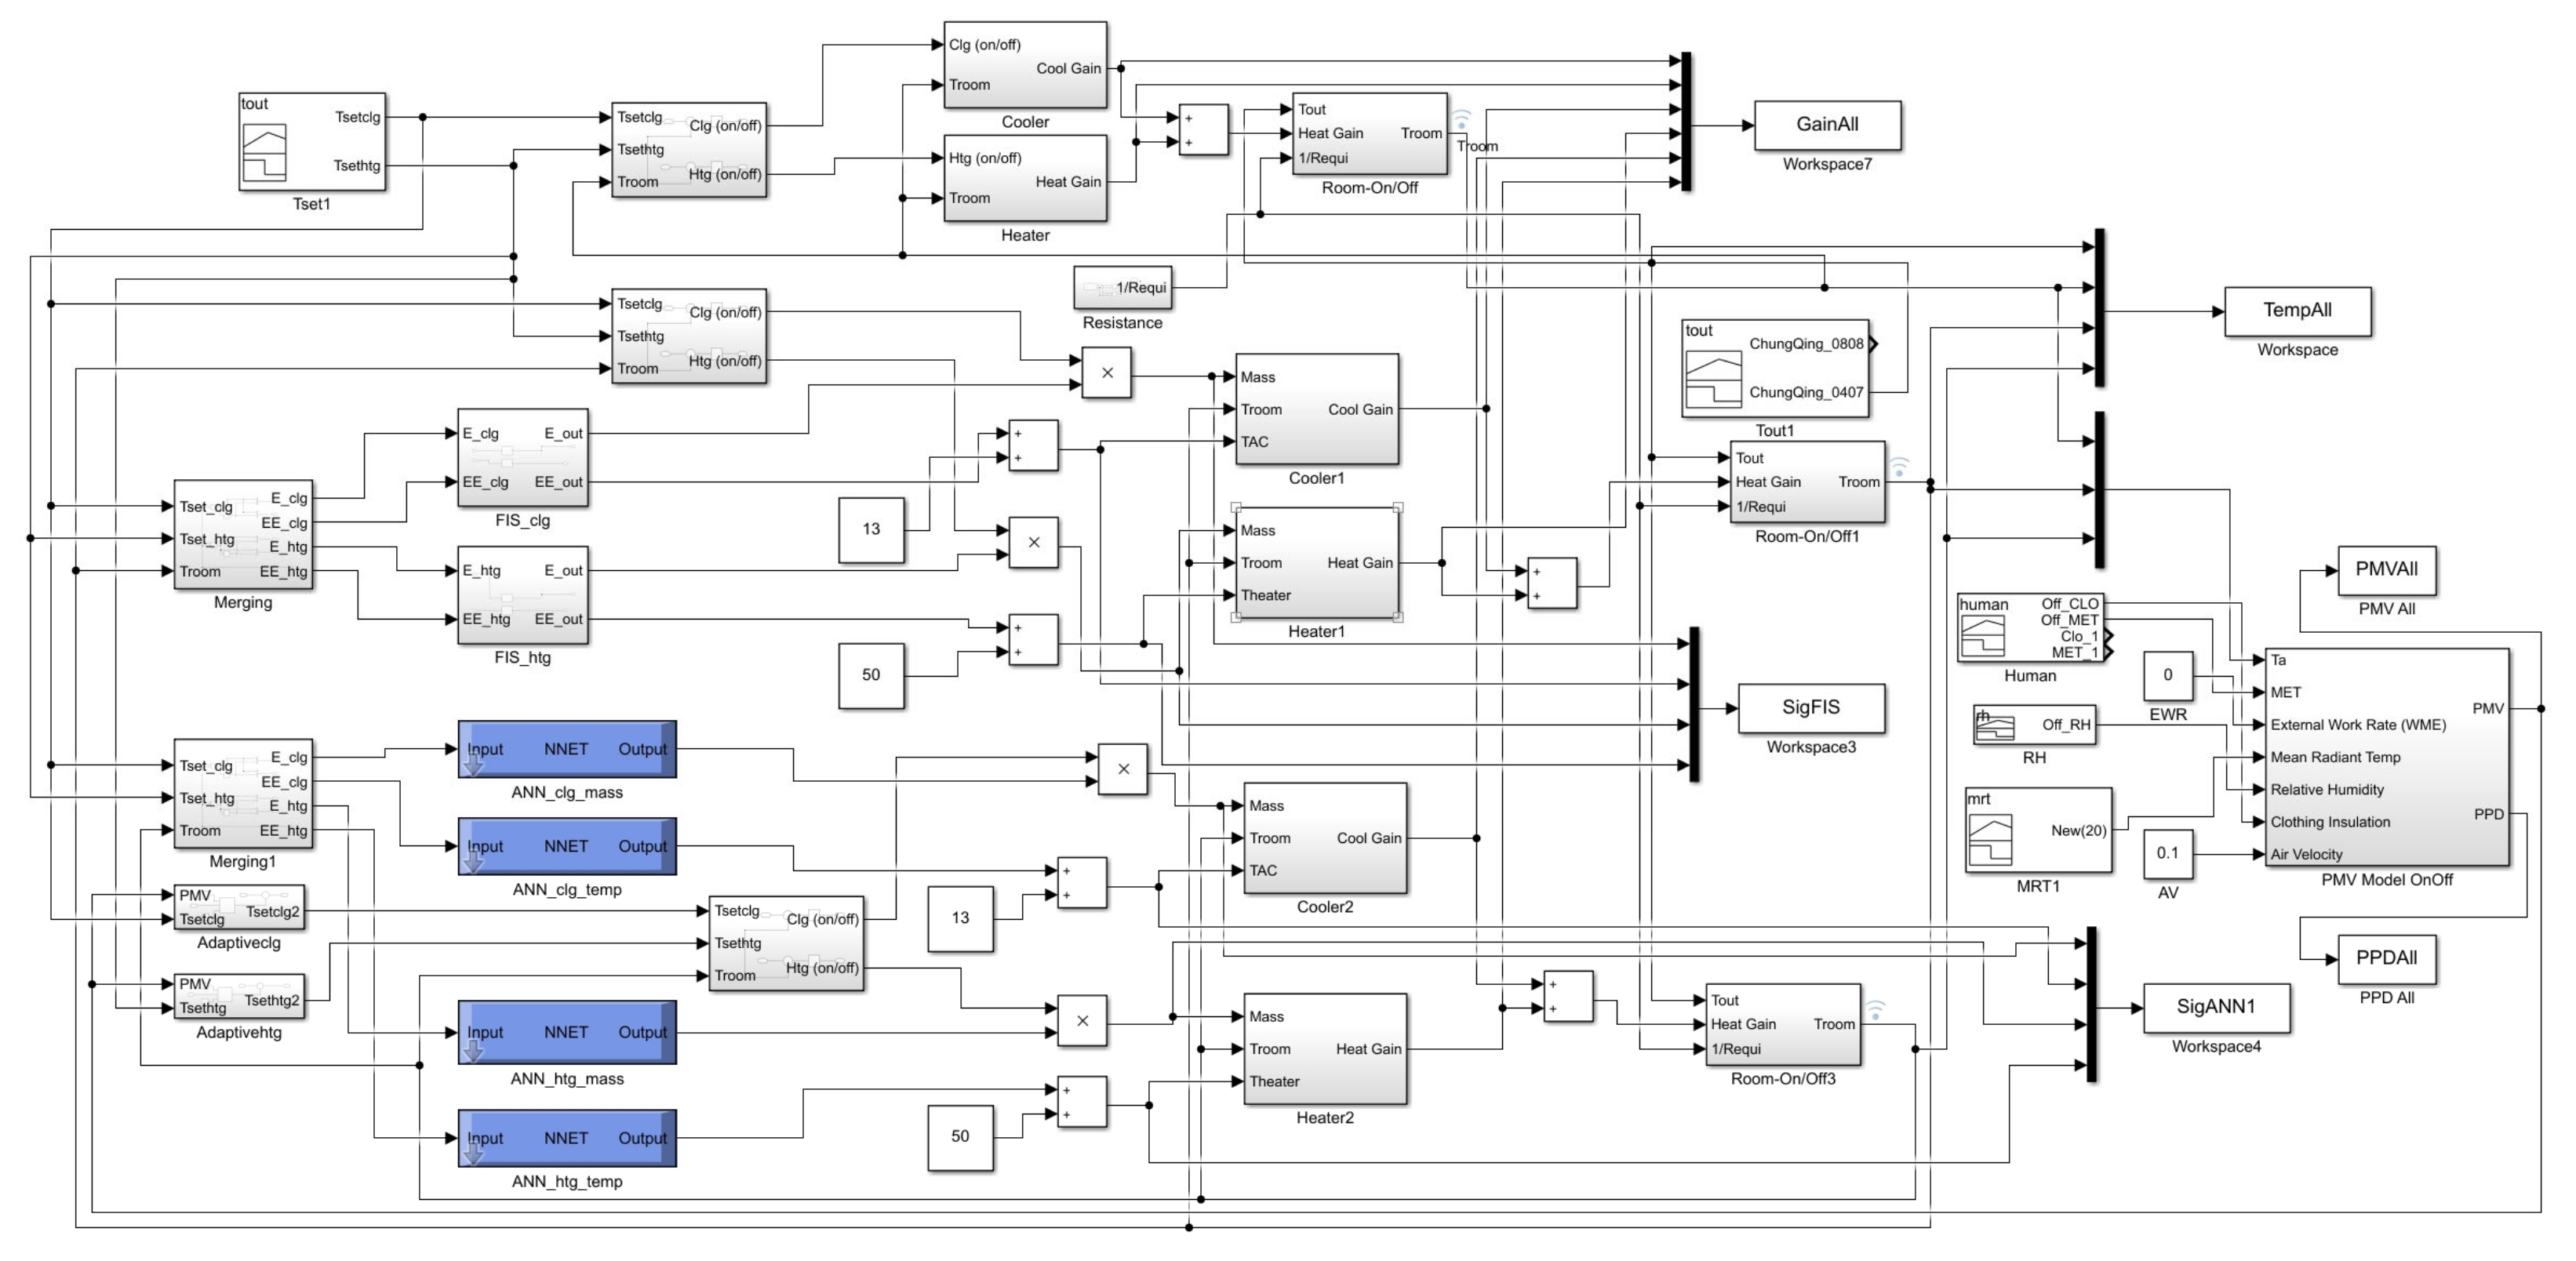
As indicated in Figure 2, a simulation block diagram for this study utilized the energy transfer which occurred through the difference between Troom and Tout. The thermal system sends optimized signals for heating or cooling supply air with appropriate air mass and its temperature. From the analysis of Troom and human factors, the PMV value at every 1 min was calculated and an adaptive comfort model adjusted Tset for recalculation of the amount of cooling or heating supply air to mitigate thermal dissatisfaction.
As previously mentioned, the results of the PMV index can be higher than 0.5 or lower than −0.5, then, the adaptive model sends modified signals for −0.5 for cooling or 0.5 heating. This additional signal is connected to the thermal system to adjust Tset by 0.5 °C higher or lower. The simulation process is conducted in a way that mitigates the difference between setting values and actual values in the PMV, but the energy consumption during the process can be increased. One of the main purposes of this simulation study is to explore how much this energy use is increasing, and how much the PMV value is increasing due to this increase is correspondingly.

3. Results

3.1. Room Temperature

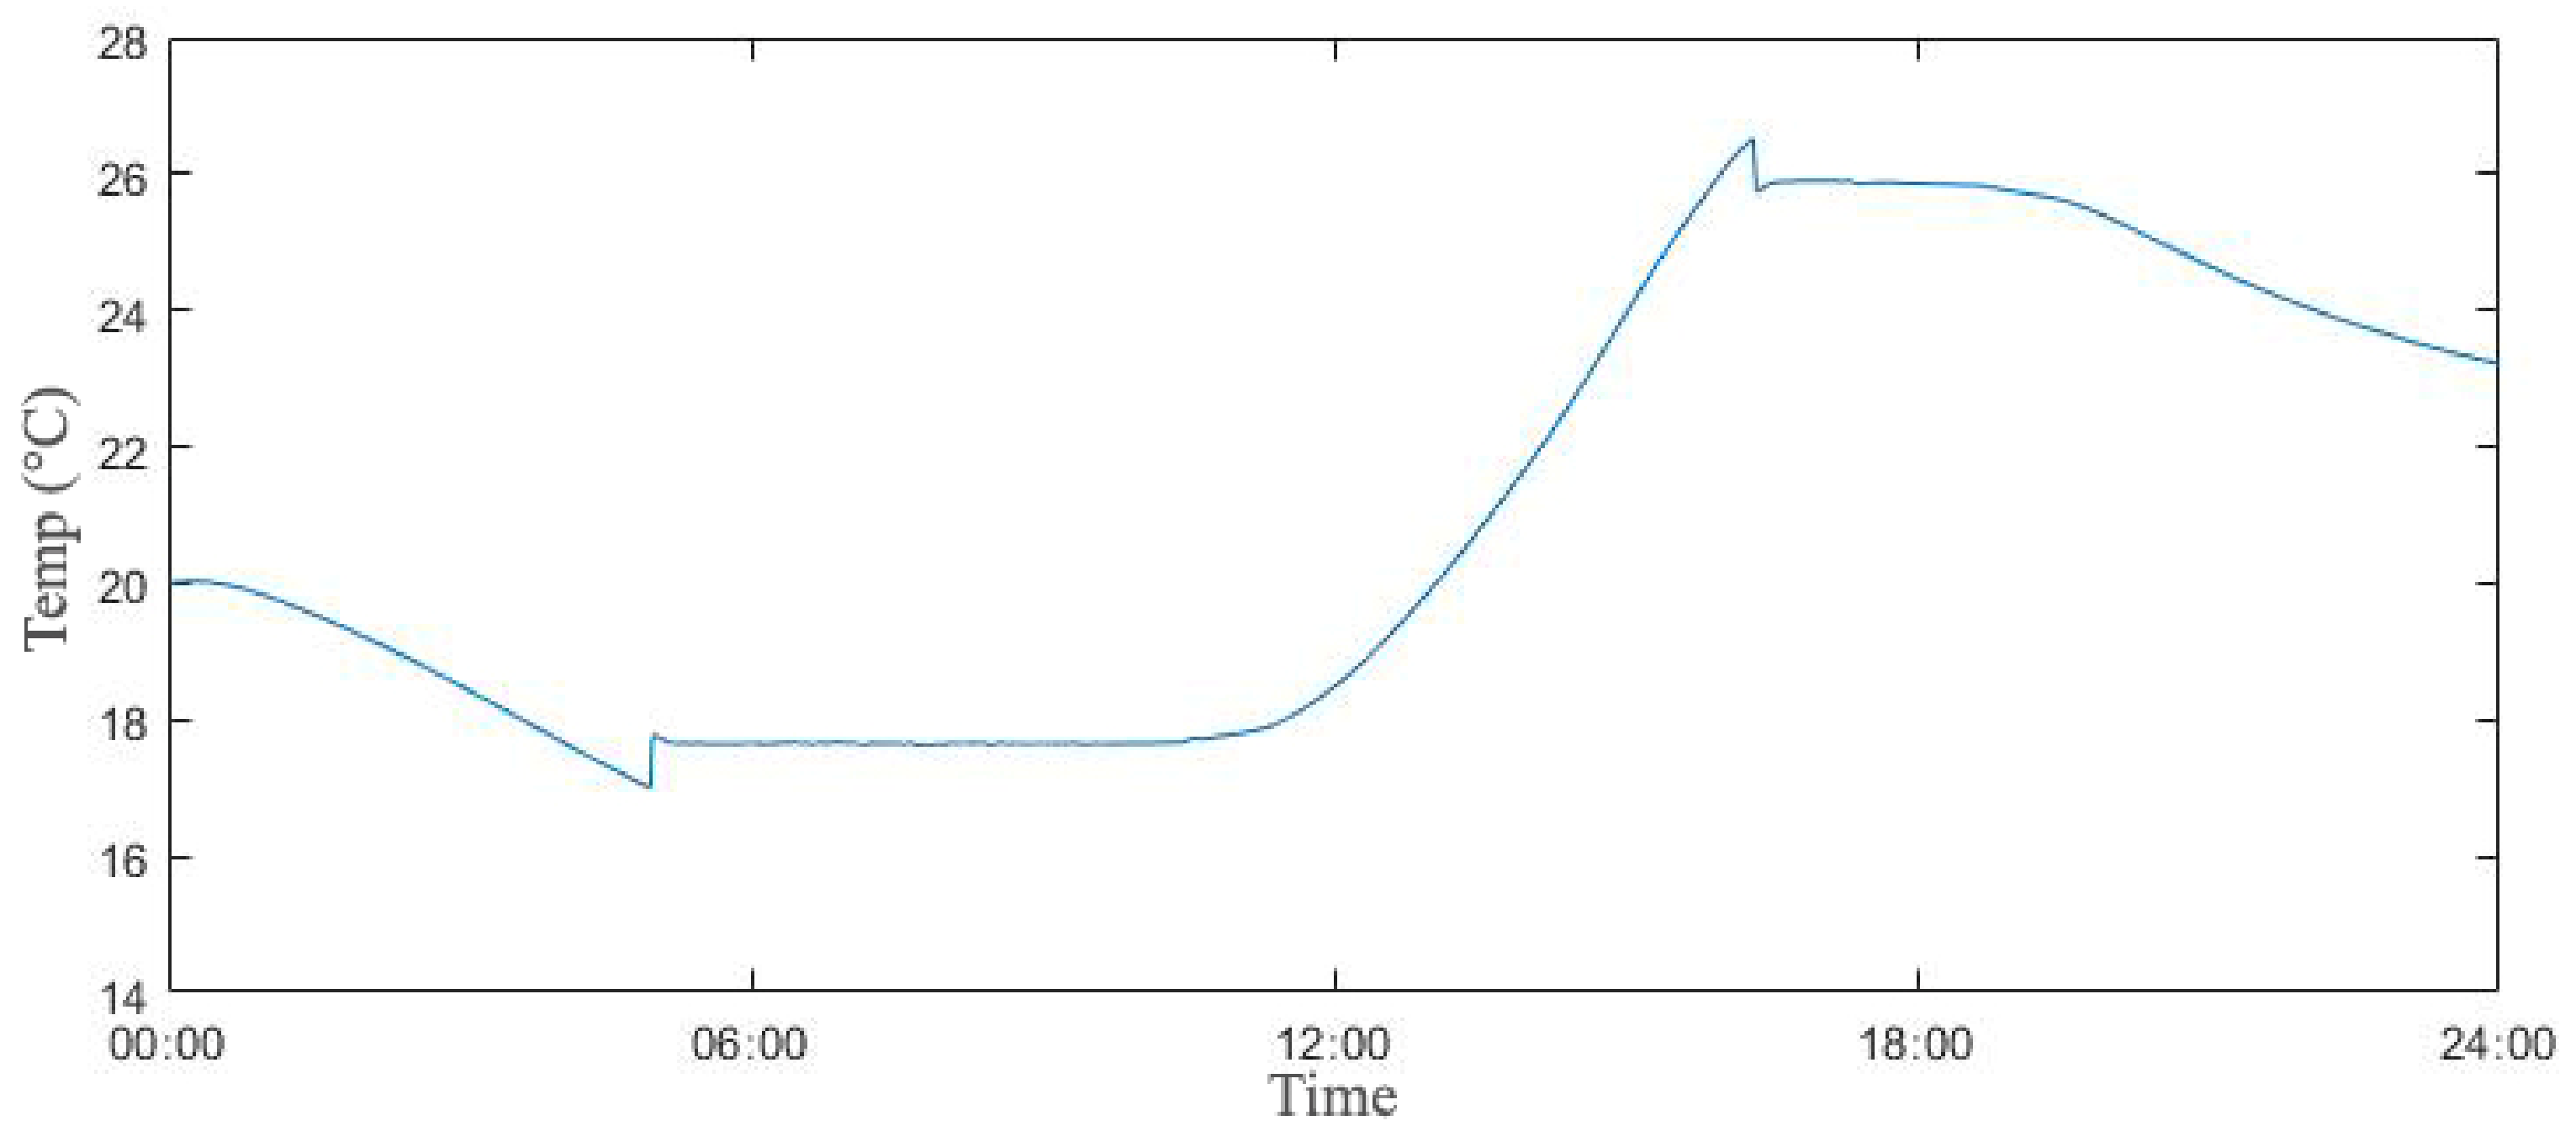
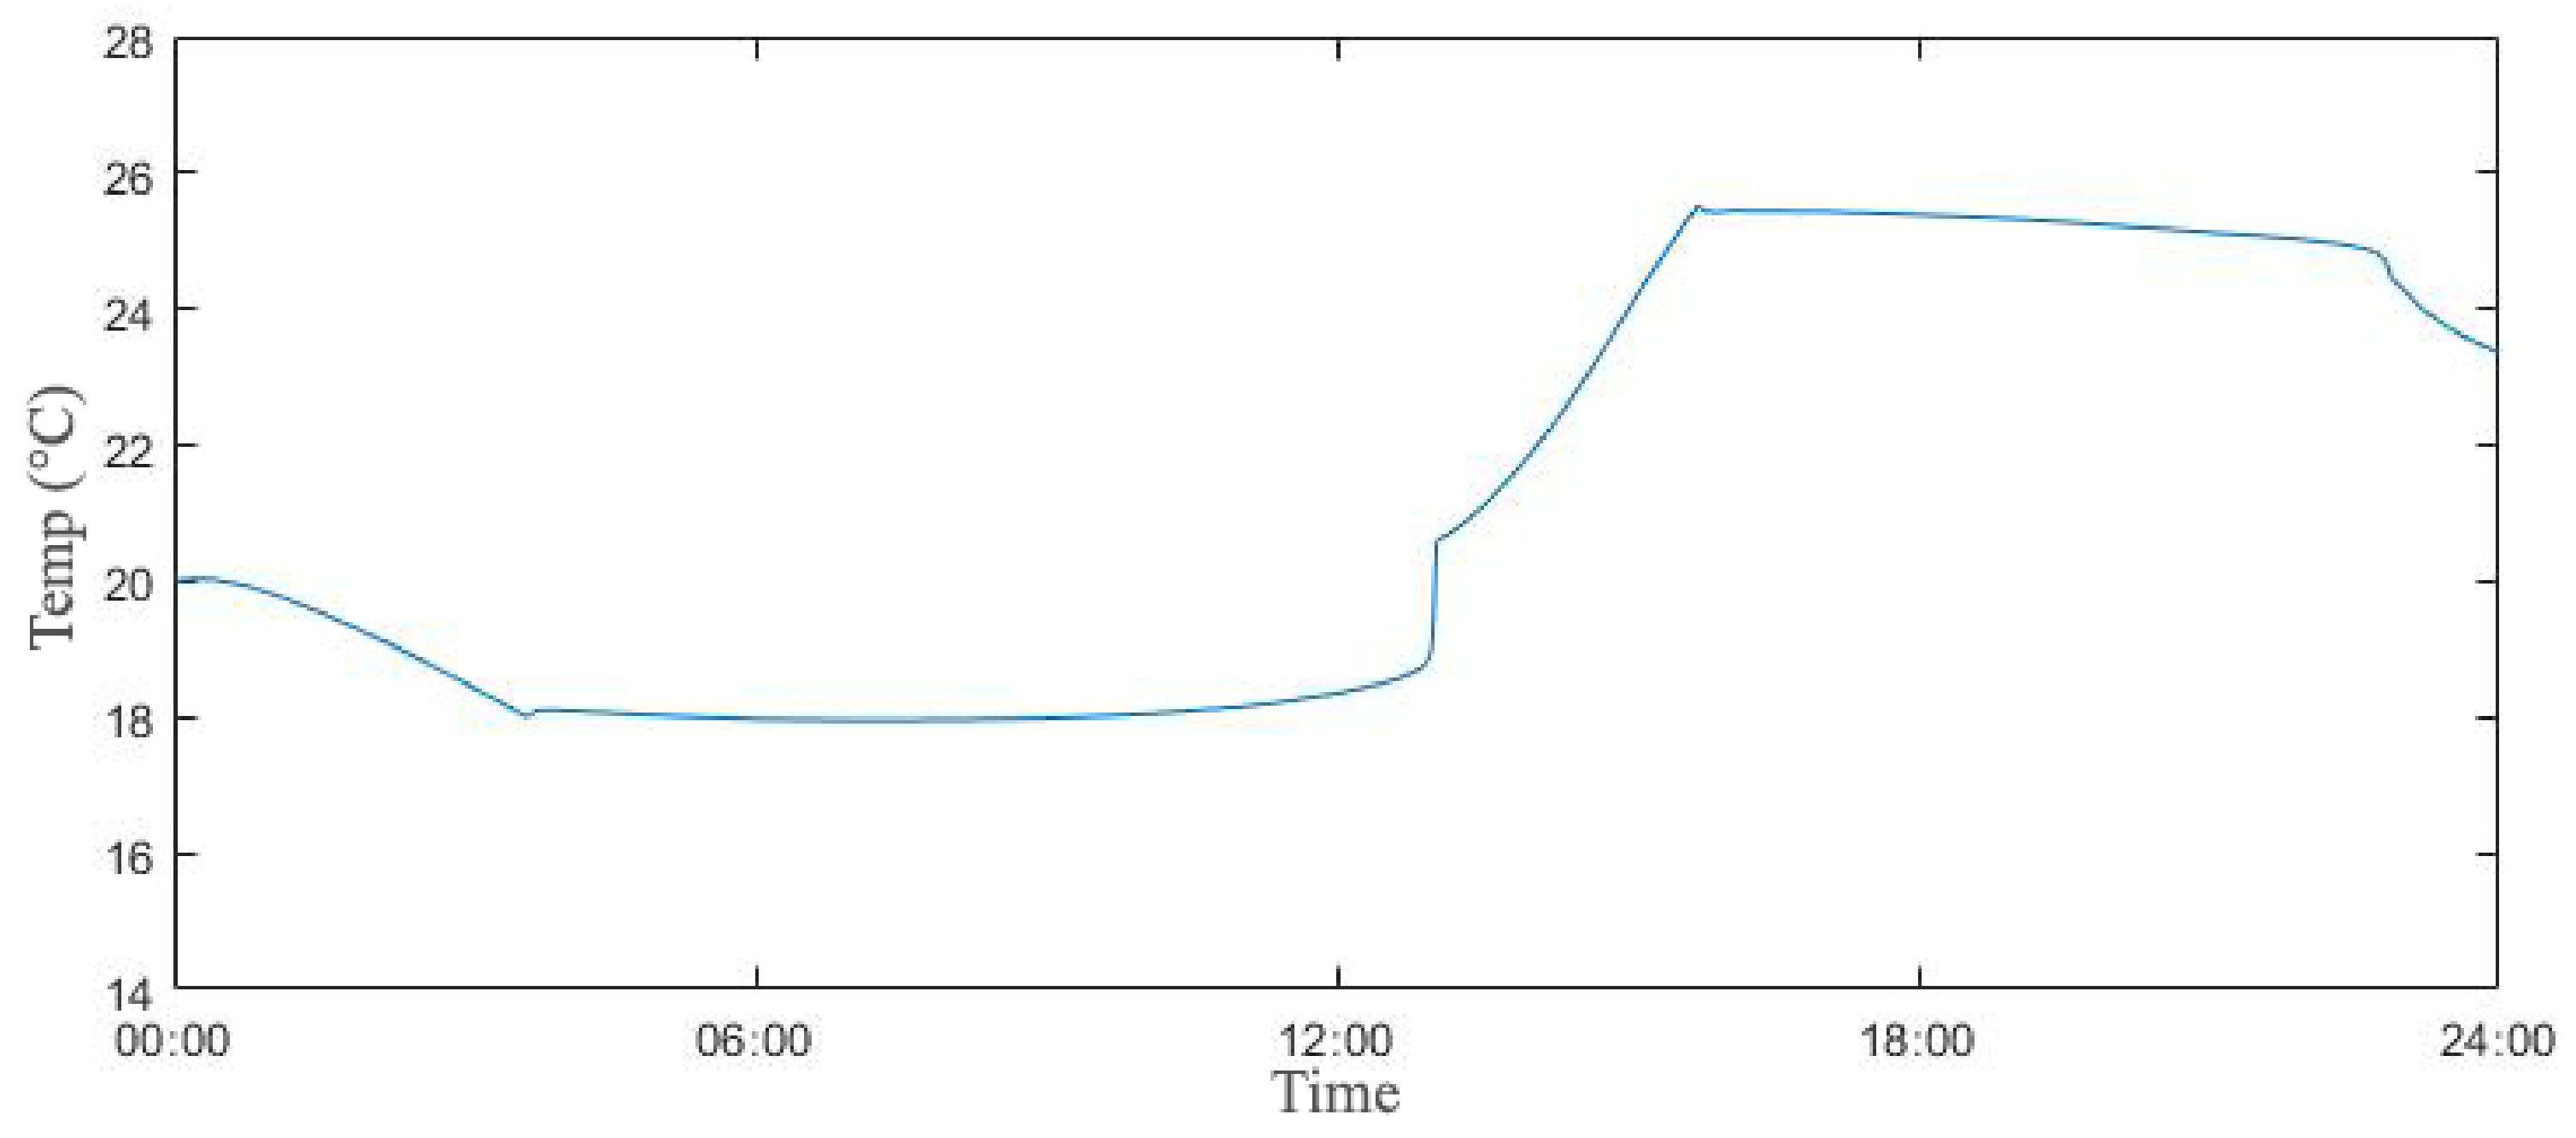
Figure 3 indicates Tout of Chungqing in China at April 7th, which was retrieved from the climate data of the China Standard Weather Data (CSWD). Uniquely, the temperature falls under 16 °C at night but rises over 27 °C at noon, which confirms the need to consider both of the heating and cooling methods in the mid-spring season. Figure 4, Figure 5 and Figure 6 show the comparison of Troom by three different control models. At night and noon, it is confirmed that the change patterns of Troom by the thermostat are clearly regular but the amount of fluctuations is quite large. An aspect of these fluctuations of the thermostat may be effective in reducing its energy use because it effectively stops using energy when it turns off. However, there could be a higher likelihood of disadvantages in producing users’ thermal dissatisfaction when it turns on and off repeatedly.
Figure 5 displays relatively smooth change patterns by the FIS control, which effectively reduces the amount of fluctuations as compared to the result of the thermostat. It is predicted that this reduction in fluctuations will help to increase users’ thermal comfort or the performance equipment safety by keeping Troom relatively constant. Figure 6 for the ANN model displays the improved results of Troom retention within the setting range of Tset. By use of the network-based learned and algorithm, the ANN model effectively maintains Troom as quite consistent and smooth, which implies the fact that its control algorithm achieves improved thermal comfort levels relatively. However, there is quite a high possibility that the energy consumption increases, especially, at the time range from 11:00 to 13:00 and from 21:00 to 23:00.

3.2. Energy Demand

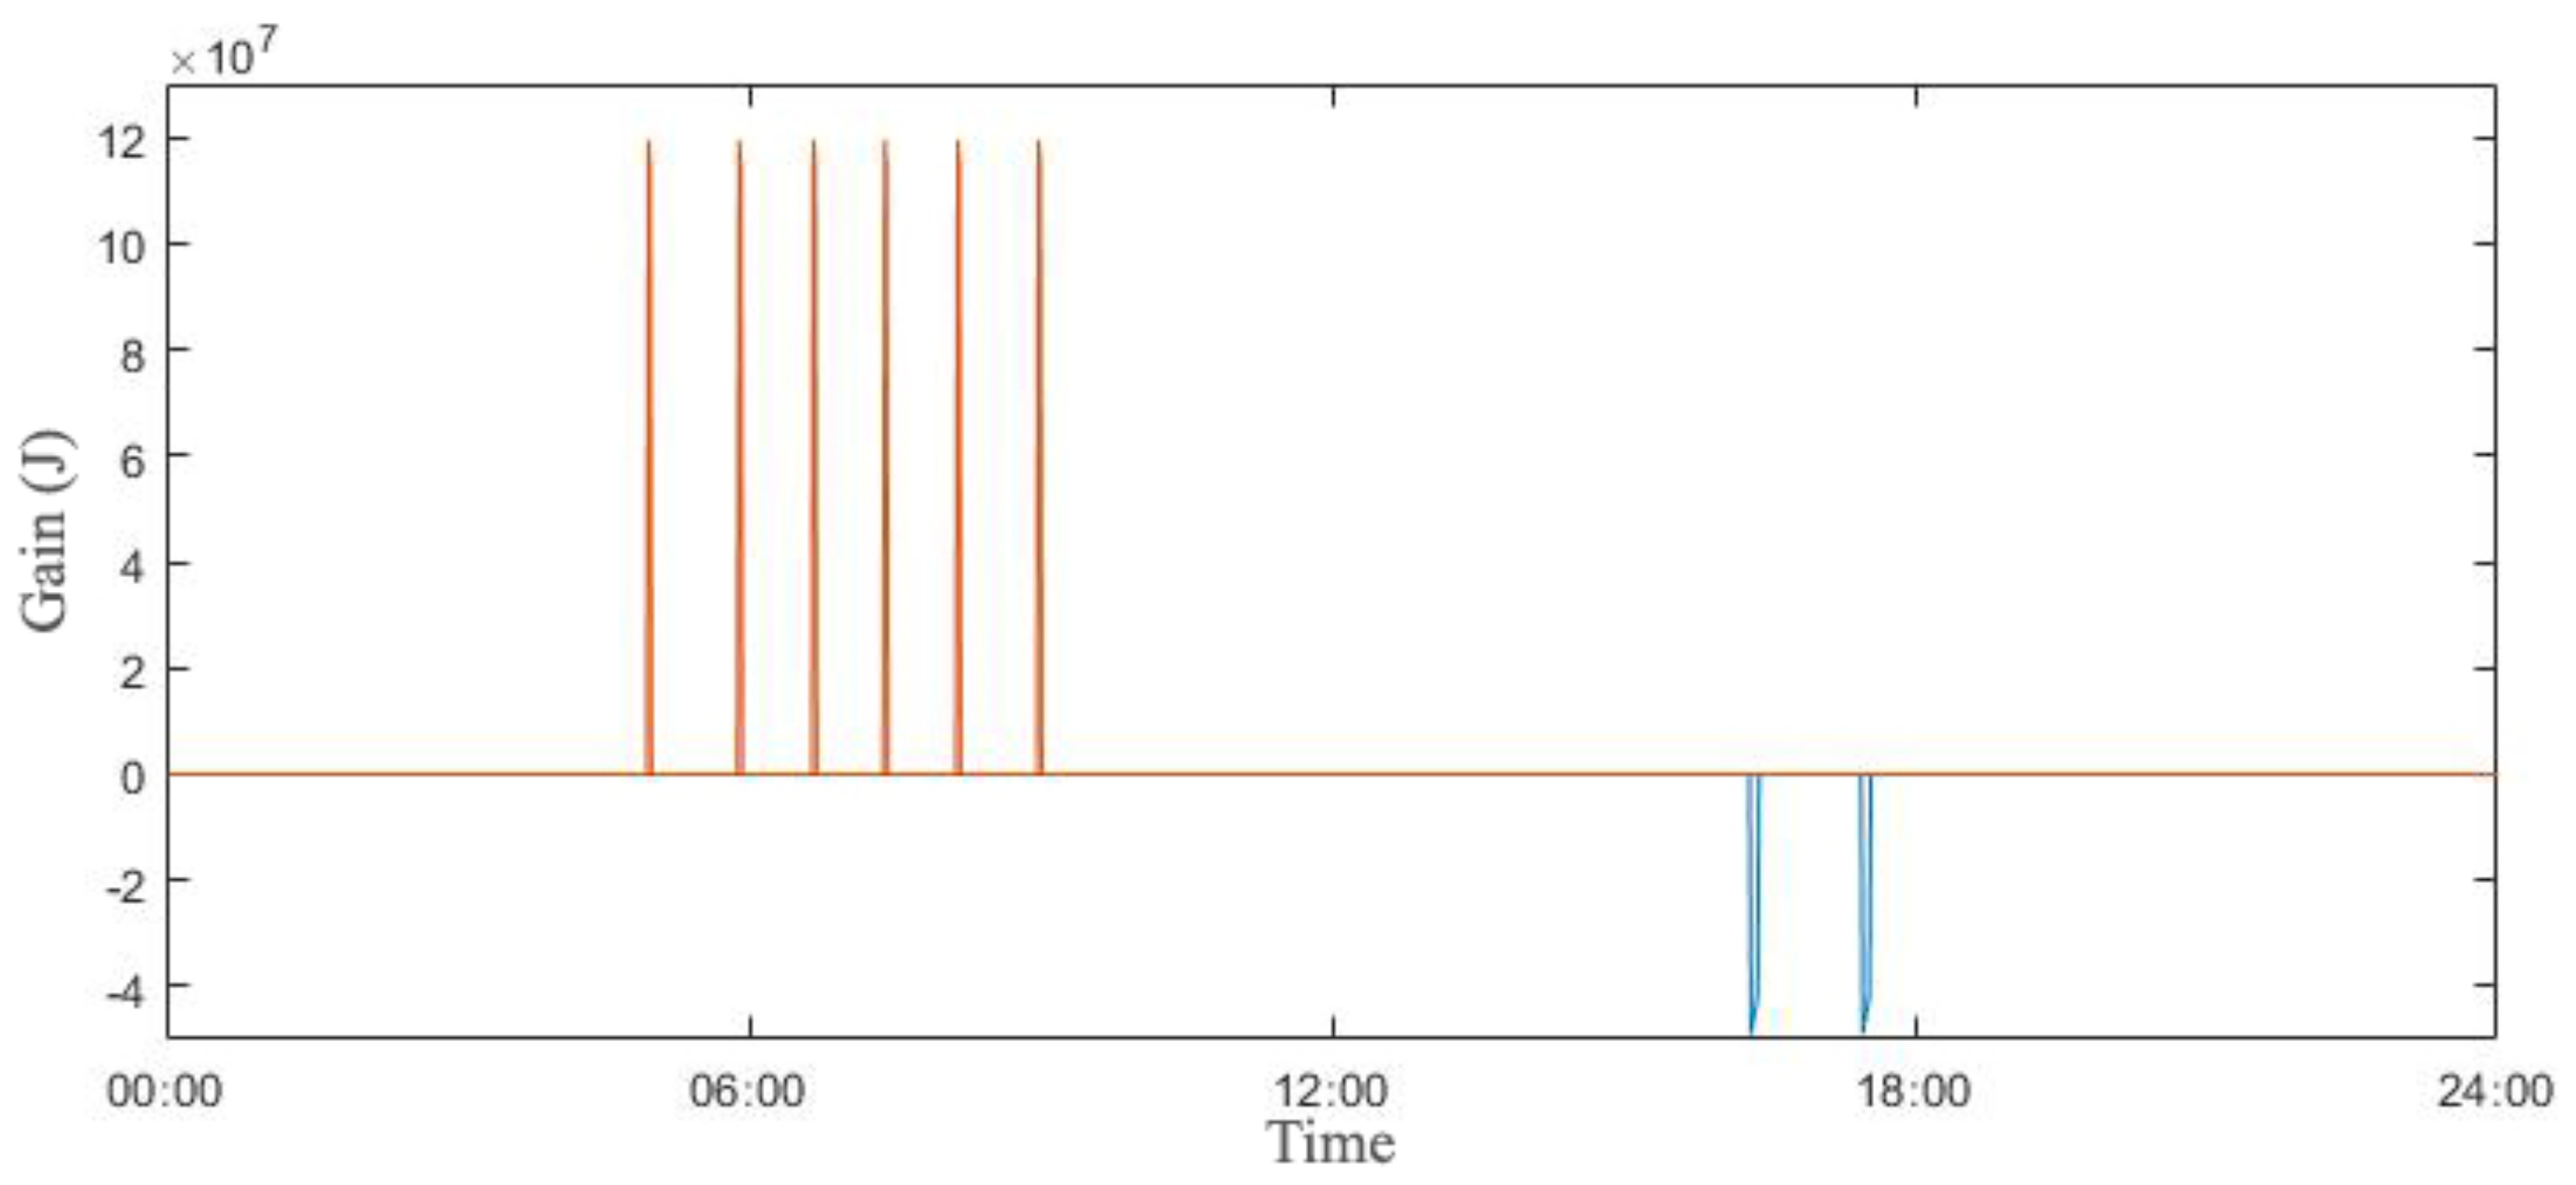
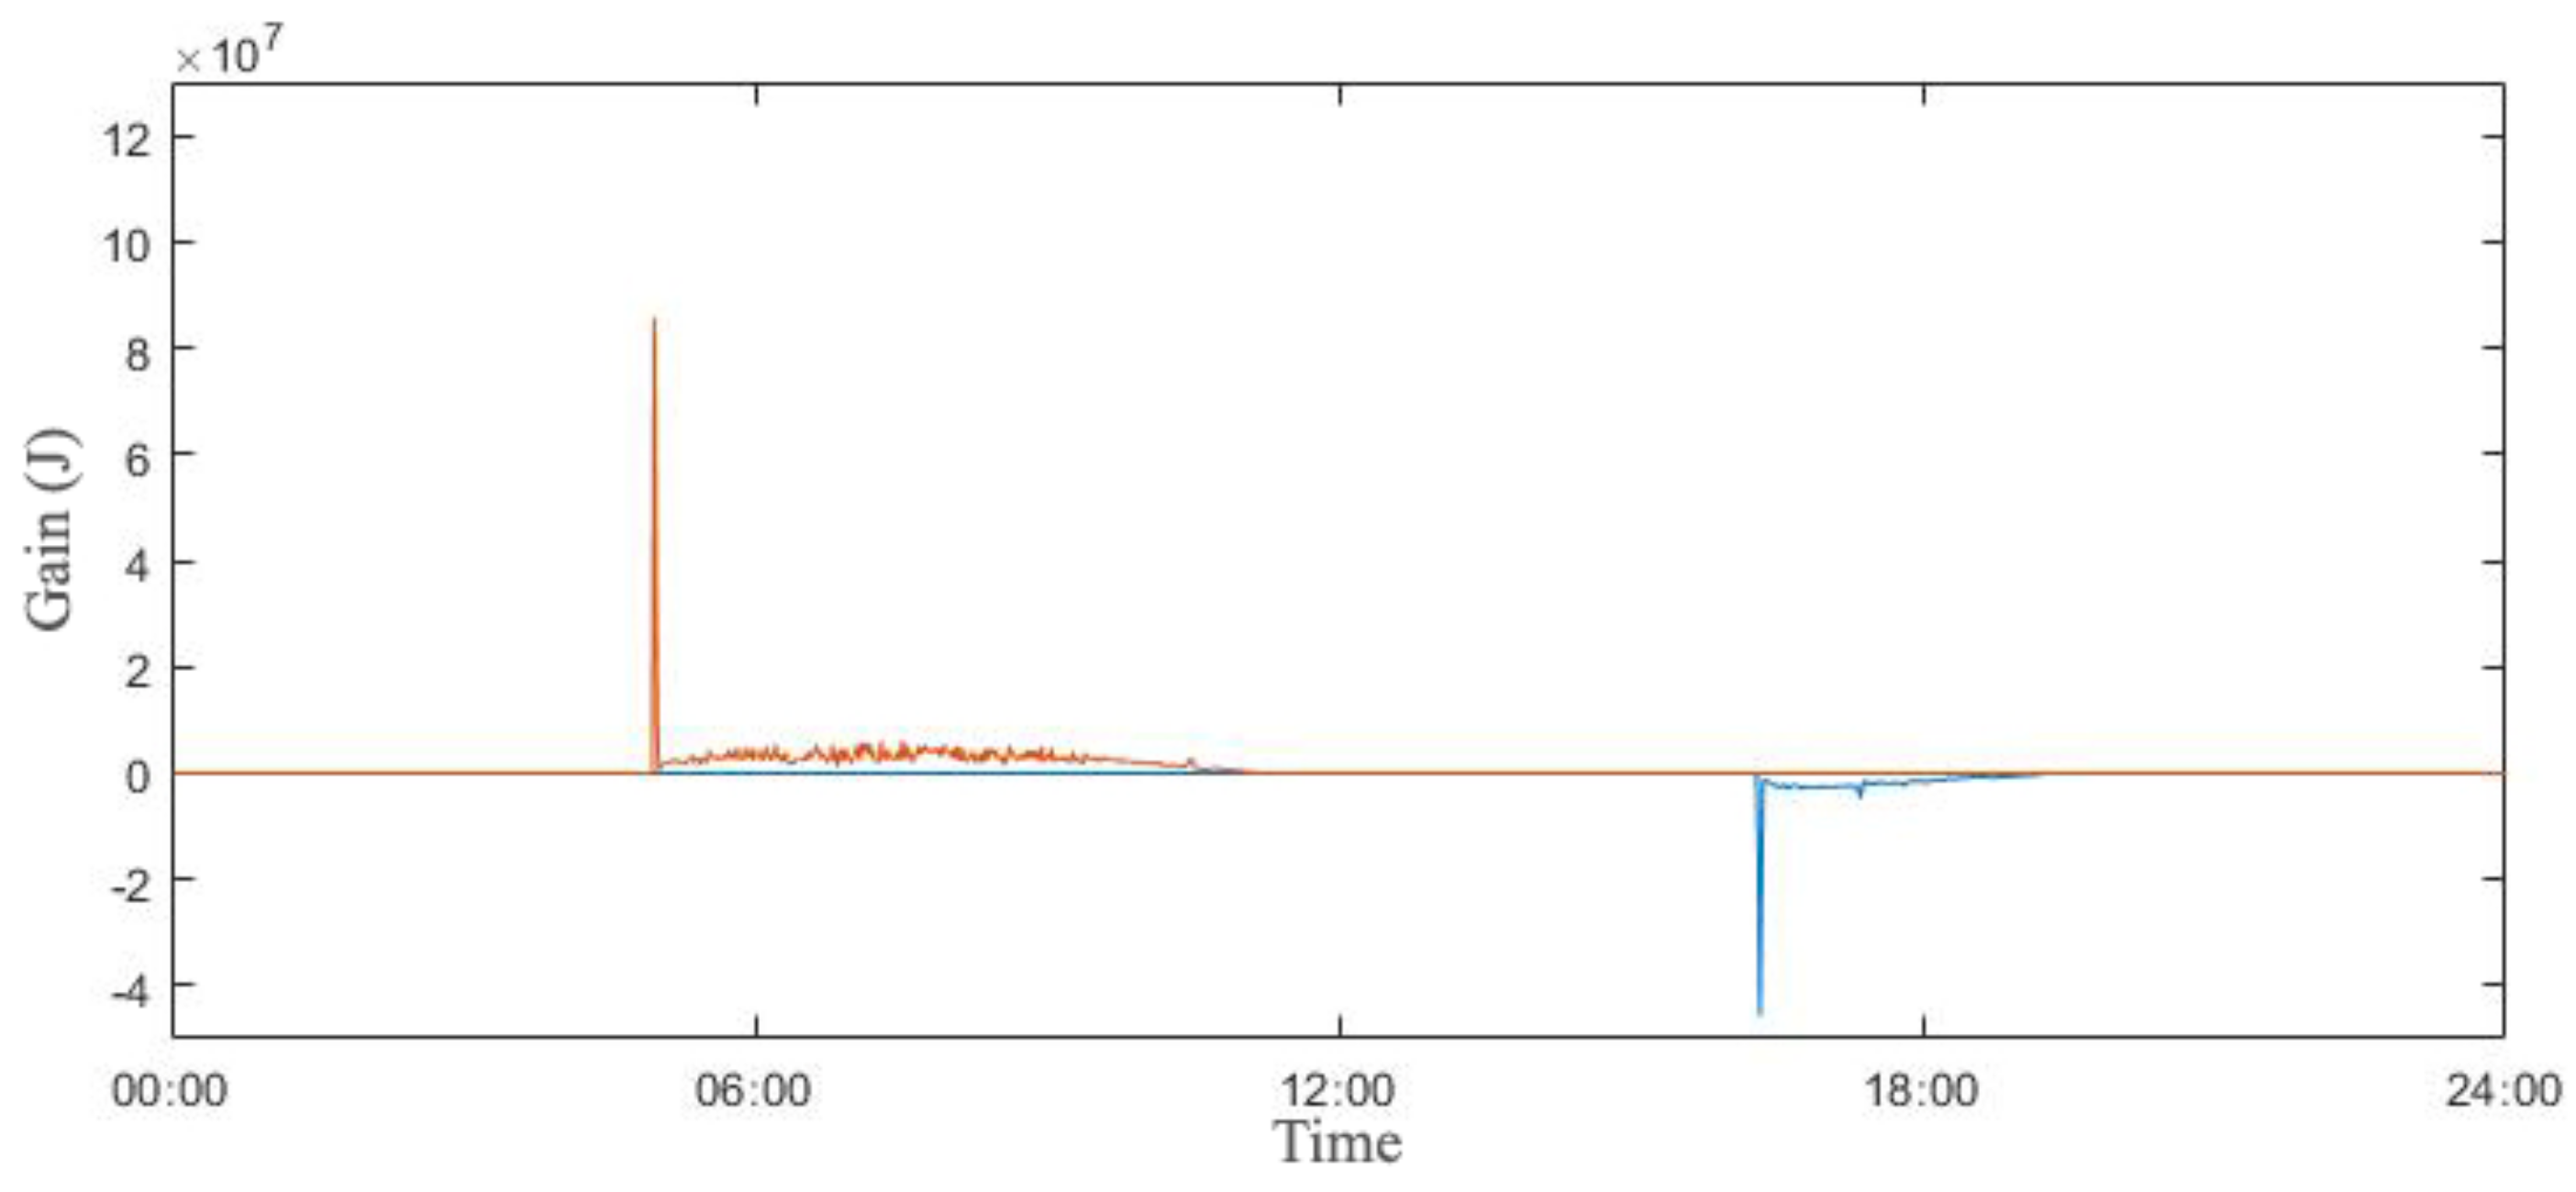
In the viewpoint of energy use, heating and cooling gains are described as a quite different pattern in retaining Tset by the three different thermal models in Figure 7, Figure 8 and Figure 9. For the result of the thermostat, as in the graph of Troom, there are regular changes of the heating and cooling gain at 24 h a day. The result from the FIS model has relatively complicated patterns, which means the fact that, in areas where Troom are controlled near 18 °C at night and 26 °C at noon, the heating and cooling gains appear quite constantly required. In addition, overall, it shows a time range of operations similar to the thermostat model.
Figure 9 reveals that the performance of the ANN model indicates quite different to the patterns of the thermostat and the FIS model as compared to Troom. For maintaining the consistency of the PMV values, the heating and cooling gains are required to keep Troom steady for wide time range from 04:00 to 13:00 and from 16:00 to 23:00. As clearly indicated in the thermostat graph, this aspect can help prevent undesirable overshooting in most time ranges, as well as reduce the system’s capacity by the predicted results of minimum and maximum requirements to supply appropriate heating and cooling energy.

4. Discussion

4.1. Sustainability in Thermal Comfort and Energy Transfer

Table 2 displays the results of the three different control models by the average of the absolute values of the PMV and comparative efficiency. As the PMV index utilizes both positive and negative values, the average of the absolute values were used to remove an ambiguity in interpretation of each performance. As indicated, the FIS is less efficient than the thermostat by about 0.81%, but the ANN is relatively highly efficient compared to the thermostat by 14.17%. As shown in the Troom graph, it can be assumed that the control patterns of ANN models, which remain steady in most time zones, have resulted in significant improvements in these PMV values. On the other hand, an examination of a quantitative comparison cannot be clearly conducted because the difference of the PMV results cannot be interpreted as the difference of economic productivity or workability unlike a bill for energy use. Therefore, it is necessary to examine how much energy transfer occurred to maintain these thermal comfort levels.
Table 3 indicates the energy transfer comparison. In the thermostat model, the most cooling energy transfer occurred, and, in the ANN model, the amount was significantly reduced. In the heating energy transfer, however, this was the opposite of the result for cooling, with a relatively large energy transfer occurring in two controllers, among which the ANN consumed the most energy. Therefore, in comparison with the energy transfer, it can be confirmed that the efficiency of the FIS is relatively lower than that of the thermoset model by 2.54% and the ANN is lower by 4.05%.
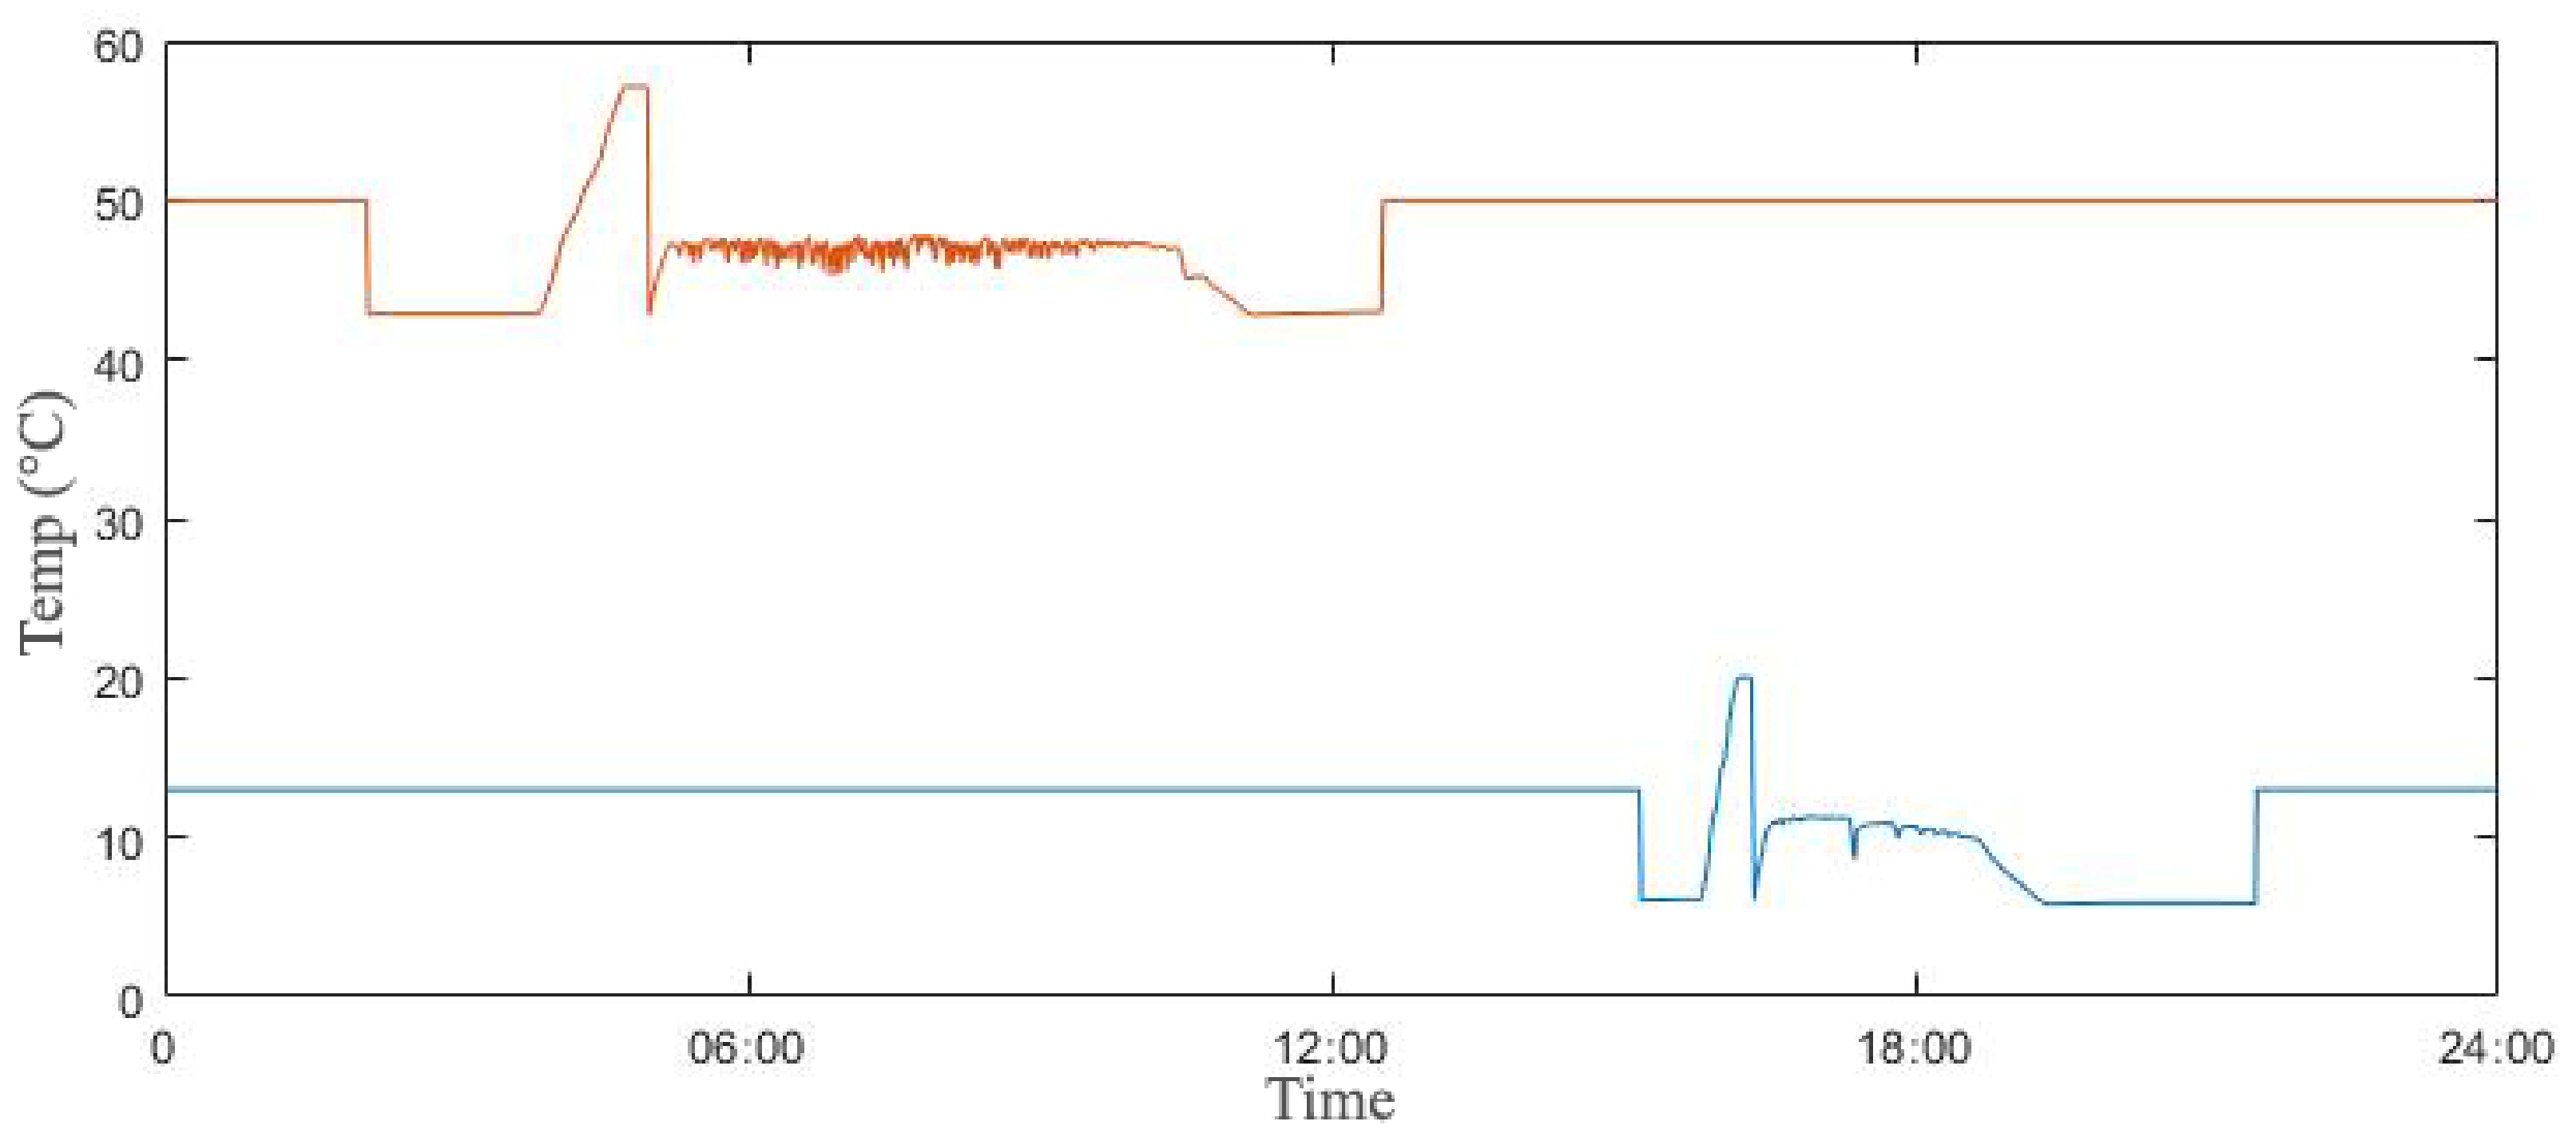
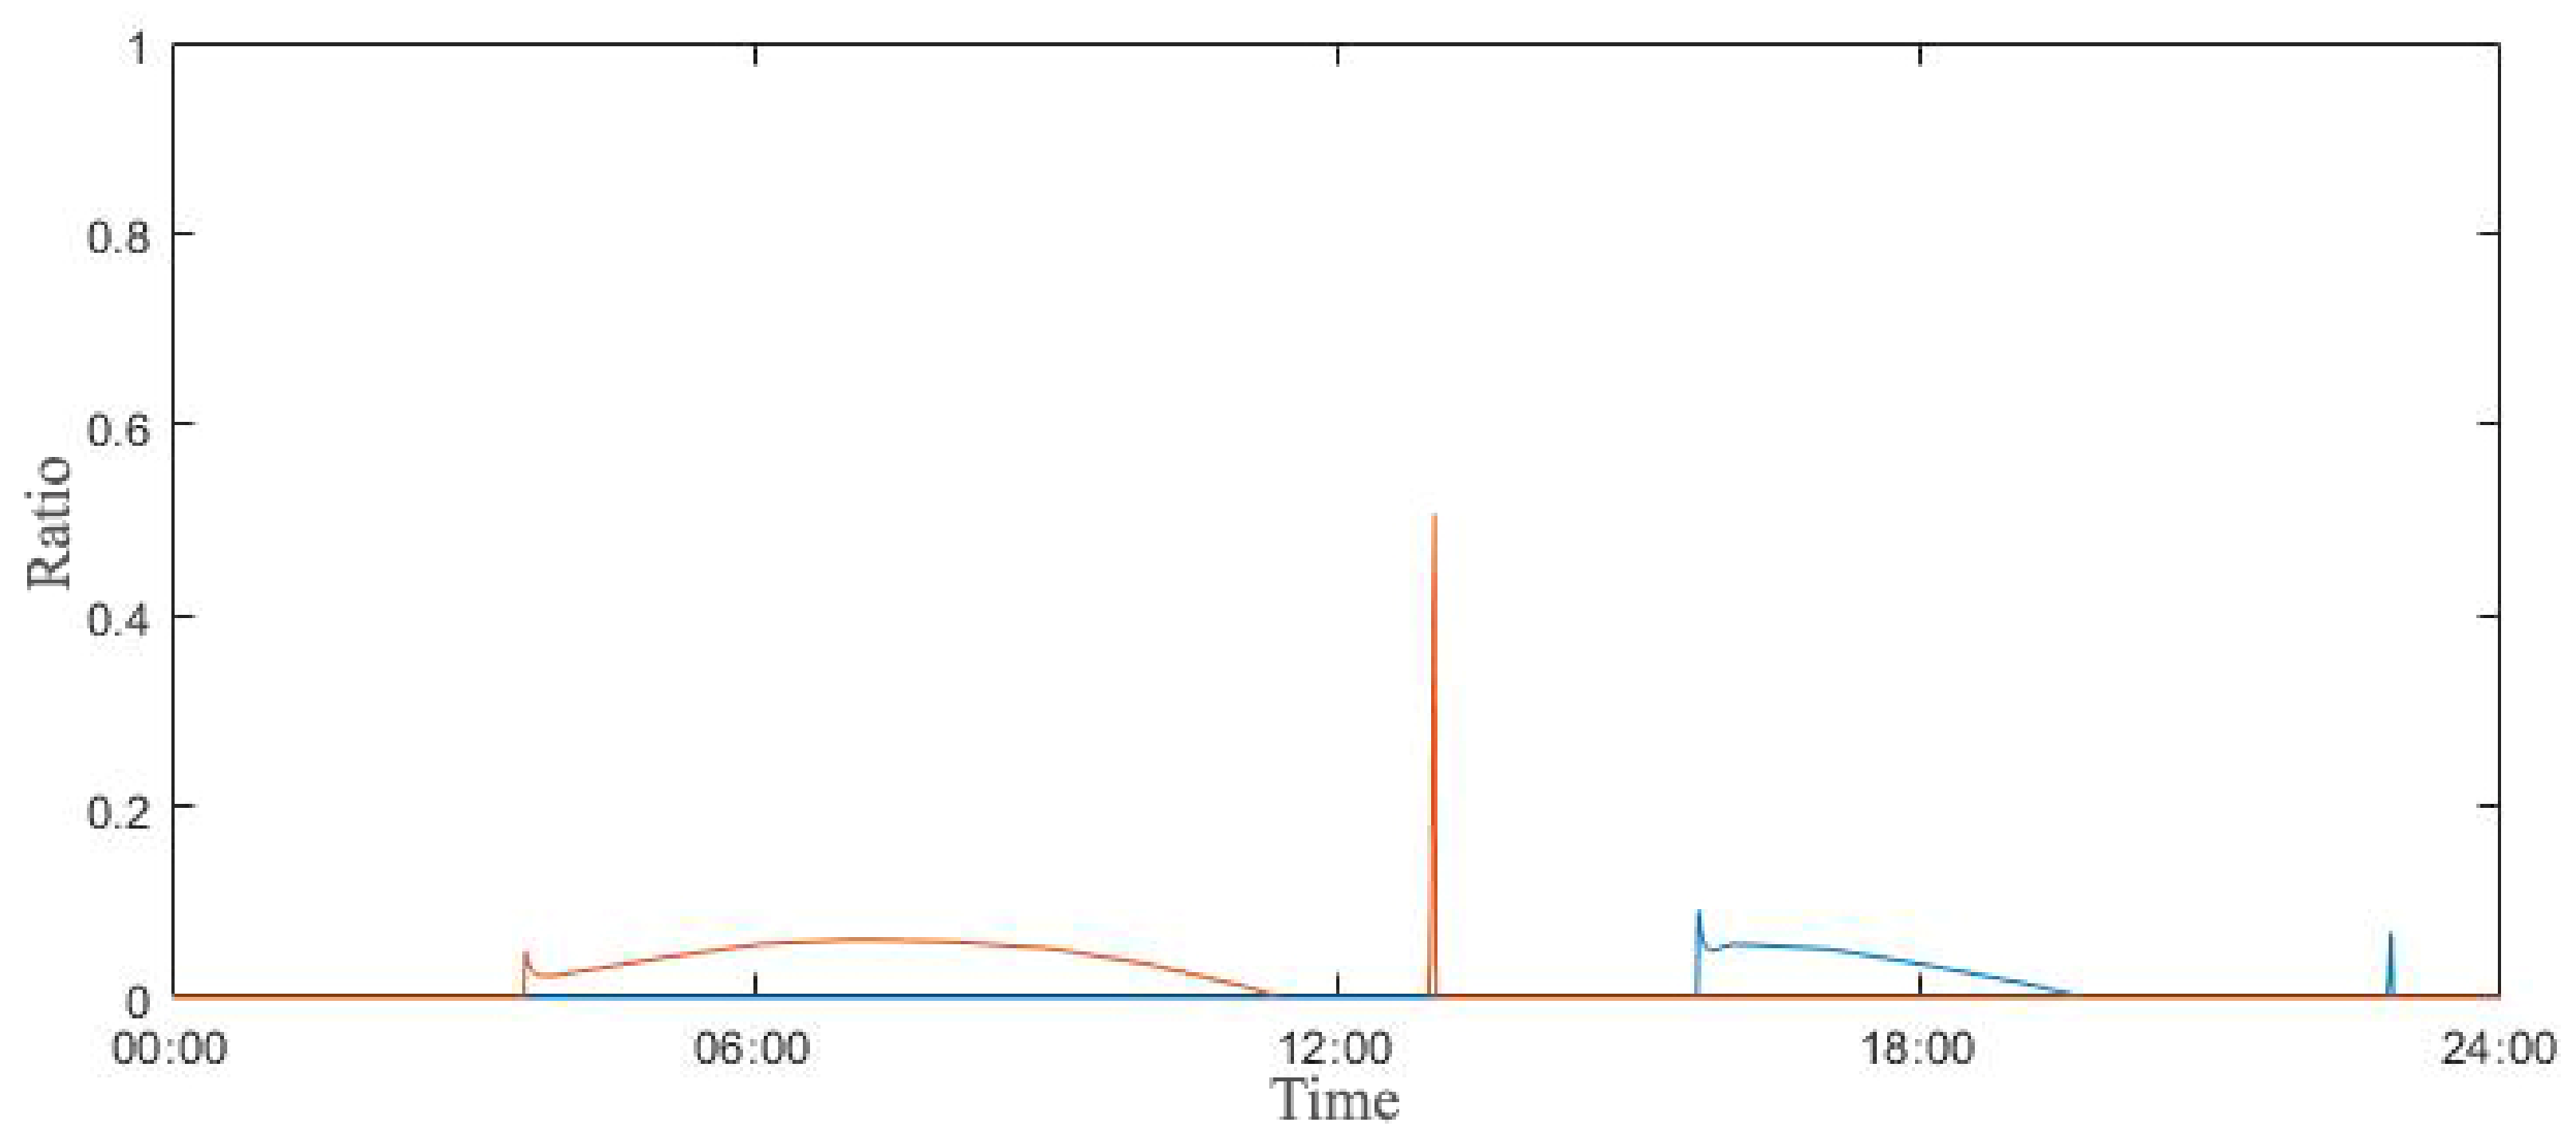
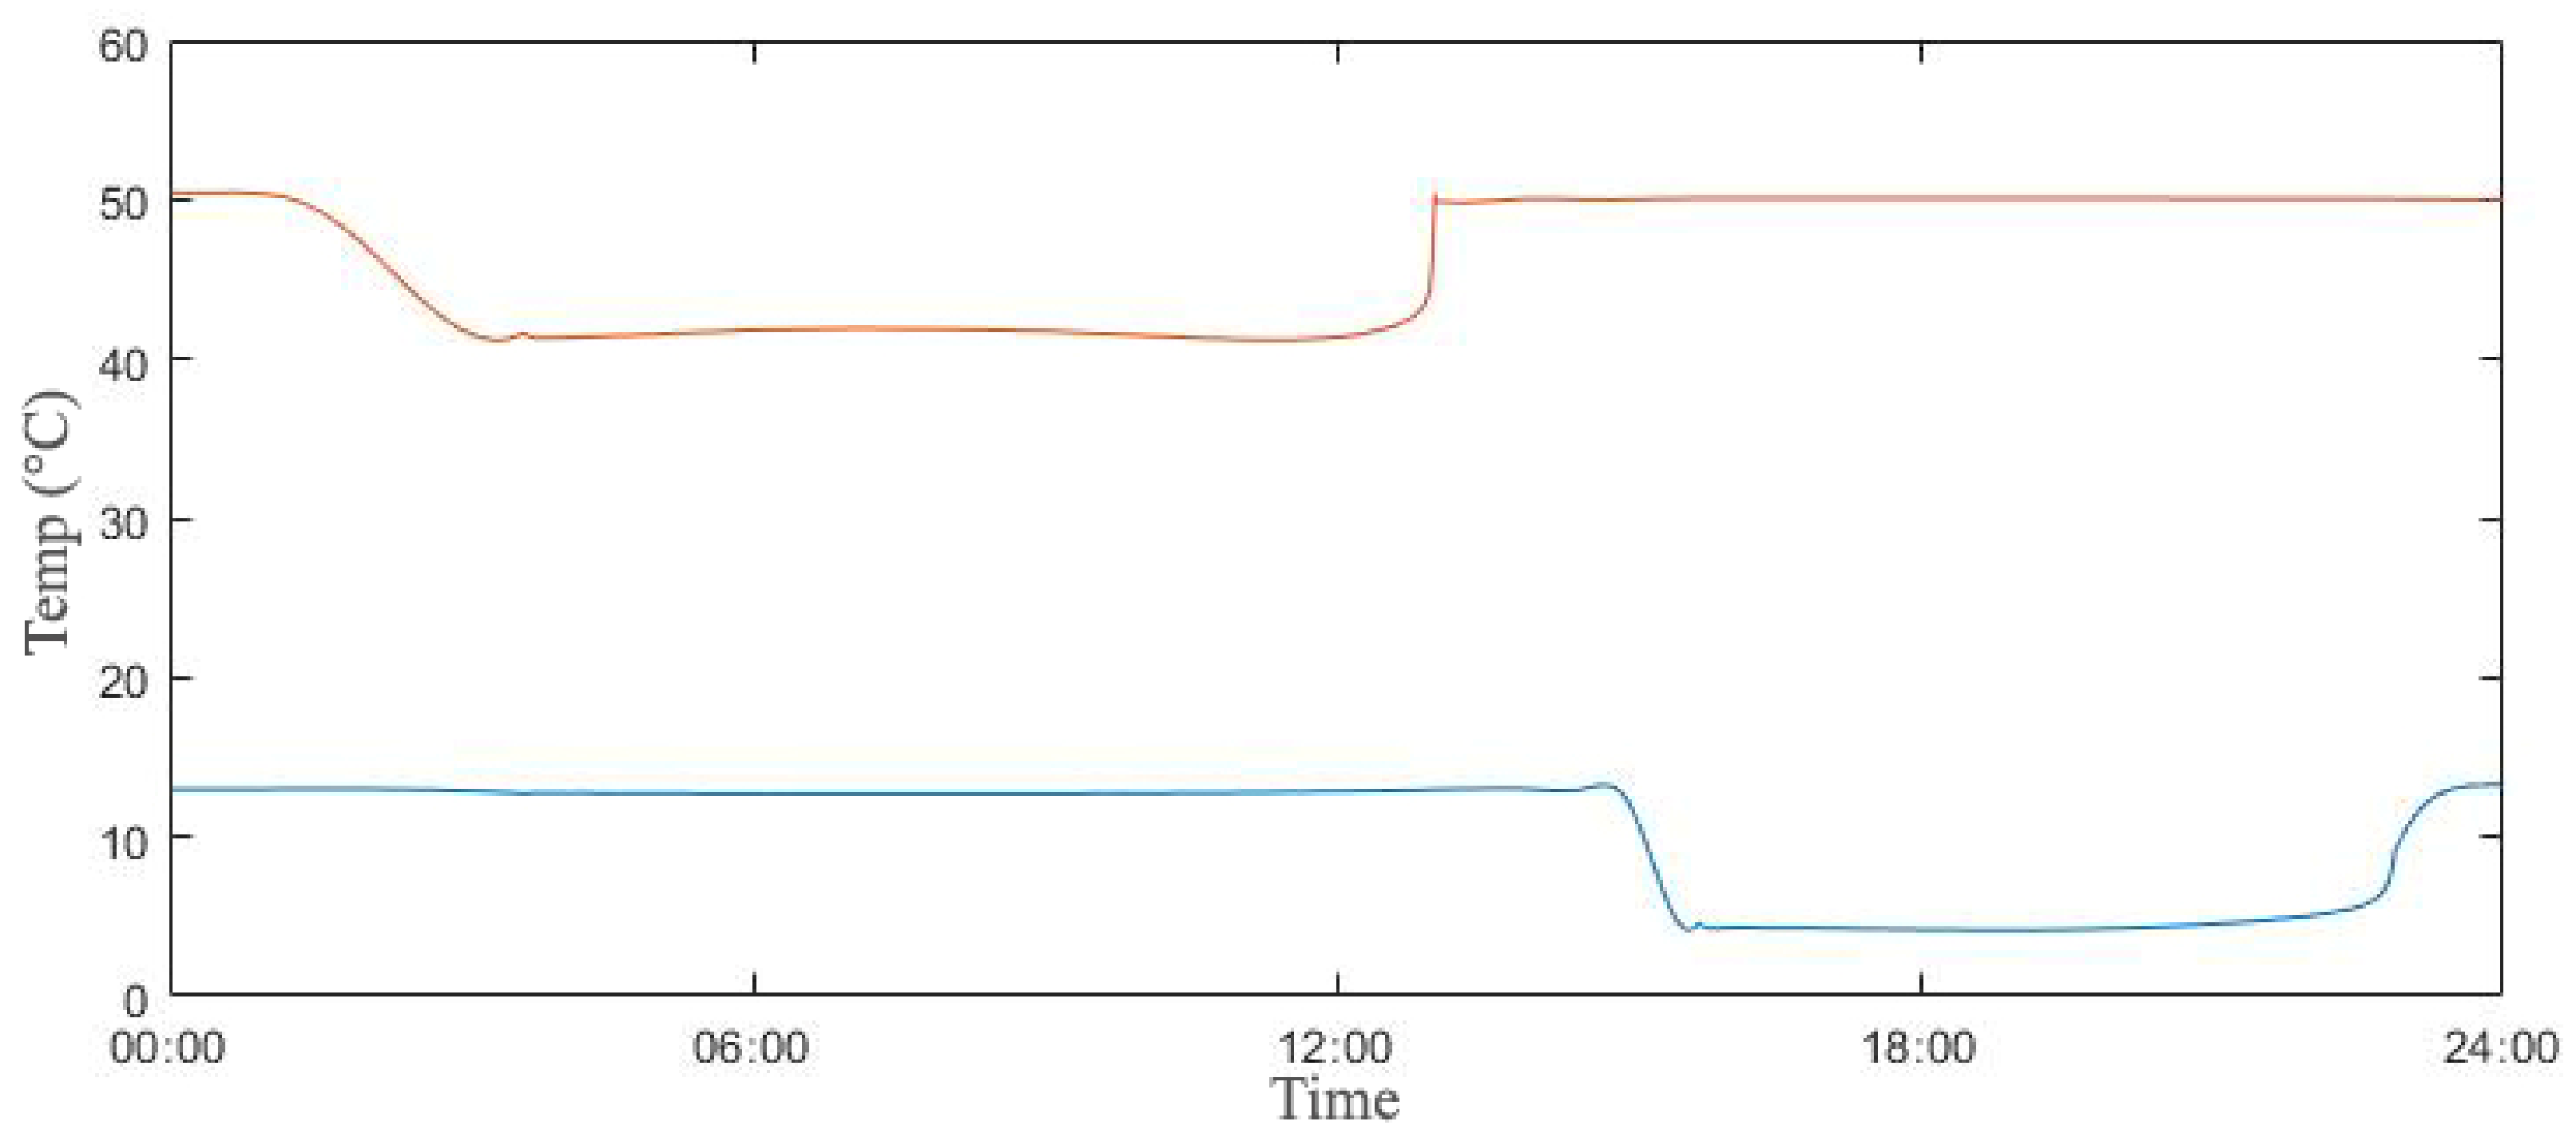
In comparison with the heating and cooling signal patterns for two controllers, the change in amount of the supply air and its temperature by the FIS and the ANN models in Figure 10, Figure 11, Figure 12 and Figure 13, respectively. In the case of the FIS results, the heating supply air was controlled from 05:00 to 11:00, so the membership function has operated its optimizing process to find more efficient control points. Regarding the case of heating the cooling, precise control was performed from 05:00 to 11:00 and 16:00 to 19:00, which can be effectively maintained within the range of Tset through the simultaneous control.
The ANN result is confirmed that it controlled the amount of supply air and its temperature was quite smooth and consistent as compared to the two different models. In particular, the damper’s opening and closing is controlled by using the range from 0 to 0.1 at the ratio axis (i.e., 0% to 10%) except for the beginning of the system when it turned on at 13:00. Compared with the result of the FIS model, the supply air temperature was also effectively controlled to a relatively uniform pattern, which will reduce the cycle of heating and cooling the resistance coil, which may bring significant economic benefits in capacity design or maintenance.

4.2. Strengths and Weaknesses of the Proposed Model

Regarding the results, the proposed ANN model can be applied in designing the capacity of mechanical systems where the heating and cooling strategies are simultaneously required in the mid-spring season. Since it can mitigate unnecessary overshooting and optimize the mass and temperature simultaneously. The results indicate that, in terms of the reduction of heating and cooling energy transfer only, the FIS model is still effective by means of a deterministic algorithm in ambiguous situations. However, for the ANN model, in addition to the primary signal for reducing heating and cooling energy transfer, it also properly operated with additional signal modification by the adaptive controller for users’ thermal comfort. This implies the fact that the ANN algorithm can effectively save additional work for the auxiliary system installation to complement existing systems without overall exchange of operation and management systems in new environmental conditions.

5. Conclusions

In this study, three distinct models were proposed to effectively maintain the room temperature within the setting range by controlling the conditions of heating and cooling supply air. During the process, an adaptive model complemented the network-based learning algorithm by the adjustment of output signals to reduce energy use within designated setting ranges for thermal comfort. In terms of the energy efficiency, the FIS and the ANN models resulted in a slight efficiency degradation which was caused as a result of precision control to improve indoor thermal comfort. As indicated in the results of thermal comfort by the PMV index, the ANN model showed an improved performance of more than 14% over the thermostat and the FIS models. Even though all of the effective elements and parameters in typical HVAC and comfort models were not considered in this simulation, theoretical advantages of combining network and adaptive algorithms were confirmed in terms of improving both aspects of energy consumption and thermal comfort.
As a result, a network and learning algorithm equipped with an adaptive controller properly worked to improve users’ comfort level and system’s energy use. This improvement implies the fact that the better thermal comfort levels can be remarkable in places where several types of building spaces systematically connected. Additionally, this improvement would be more significant where the place can be directly affected by the environmental comfort, so highly intensive workability and usability are required. With the improvement of the simulation framework and modification, a follow-up study with a lab-scaled model can be performed to examine the actual energy transfer and occupant responses by expanding thermal and architectural components.

Funding

This work was supported by the National Research Foundation of Korea (NRF) grant funded by the Korea government (MSIT) (No.2019R1G1A1006984).

Conflicts of Interest

The author declares no conflict of interest.

Nomenclature

Asurface area (m2)mroomairmass of room air (kg)
Cvspecific heat capacity at constant volume (J/kg·K)qmet,heatmetabolic rate (W/m2)
Cpspecific heat capacity at constant pressure (J/kg·K)Qlossconvection and transmission heat loss (J)
Ddepth of material (m)Qgainconvection and transmission heat gain (J)
EerrorRthermal resistance (m2·K/W)
ΔEderivative of errorTaair temperature (°C)
fclratio of clothed surface areaTclaverage surface temperature of clothed body (°C)
hcconvection heat transfer coefficient (W/m2·K)Theaterair temperature entered into room (°C)
hinconvection heat transfer coefficient inside (W/m2·K)Toutoutdoor temperature
houtconvection heat transfer coefficient outside (W/m2·K)Troomroom temperature (°C)
Iclclothing insulation (m2·C/W)Tsetthermostat set-point temperature (°C)
ktransmission coefficient (W/m·K)vaair speed (m/s)
Mmetabolic rate (W/m2)uinternal energy (J)
htmass flow-rate from heater (kg/h)Wwork (J)
inmass flow-rate into room (kg/h)Waair humidity ratio
outmass flow-rate out from room (kg/h)Wsksaturated humidity ratio at the skin temperature

References

  1. Blasco, C.; Montreal, J.; Benítez, I.; Lluna, A. Modelling and PID Control of HVAC System According to Energy Efficiency and Comfort Criteria. In Sustainability in Energy and Buildings; Springer: Berlin/Heidelberg, Germany, 2012; Volume 12, pp. 365–374. [Google Scholar]
  2. Wemhoff, A. Calibration of HVAC equipment PID coefficients for energy conservation. Energy Build. 2012, 45, 60–66. [Google Scholar] [CrossRef]
  3. WaTalib, R.; Nablim, N.; Choi, W. Optimization-Based Data-Enabled Modeling Technique for HVAC Systems Components. Buildings 2020, 10, 163. [Google Scholar] [CrossRef]
  4. Paris, B.; Eynard, J.; Grieu, S.; Polit, M. Hybrid PID-fuzzy control scheme for managing energy resources in buildings. Appl. Soft Comput. 2011, 11, 315–319. [Google Scholar] [CrossRef] [Green Version]
  5. Talebi, A.; Hatami, A. Online fuzzy control of HVAC systems considering demand response and users’ comfort. Energy Sources Part B Econ. Plan. Policy 2020. [Google Scholar] [CrossRef]
  6. Fazzolari, M.; Alcala, R.; Nojima, Y.; Ishibuchi, H.; Herrera, F. A Review of the Application of Multiobjective Evolutionary Fuzzy Systems: Current Status and Further Directions. Fuzzy Syst. 2013, 21, 45–65. [Google Scholar] [CrossRef]
  7. Zhang, J.; Ou, J.; Sun, D. Study on Fuzzy Control for HVAC Systems; ASHRAE: Peachtree Corners, GA, USA, 2003; pp. 13–36. [Google Scholar]
  8. Alcala, R. Fuzzy Control of HVAC Systems Optimized by Genetic Algorithms. Appl. Intell. 2003, 18, 155–177. [Google Scholar] [CrossRef]
  9. Killian, M.; Kozek, M. Implementation of cooperative Fuzzy model predictive control for an energy-efficient office building. Energy Build. 2018, 158. [Google Scholar] [CrossRef]
  10. Afram, A.; Janabi-Sharifi, F.; Fung, A.S.; Raahemifar, K. Artificial neural network (ANN) based model predictive control (MPC) and optimization of HVAC systems: A state of the art review and case study of a residential HVAC system. Energy Build. 2017, 141. [Google Scholar] [CrossRef]
  11. Kwater, T.; Topczewska, J. Forecasting the Utility Value of Hucul Horses by Means of Artificial Intelligence. Sustainability 2020, 12, 7989. [Google Scholar] [CrossRef]
  12. Rijal, H.B.; Humphreys, M.A.; Nicol, J.F. Adaptive model and the adaptive mechanisms for thermal comfort in Japanese dwellings. Energy Build 2019, 202, 109371. [Google Scholar] [CrossRef]
  13. Simanic, B.; Nordquist, B.; Bagge, H.; Johansson, D. Influence of User-Related Parameters on Calculated Energy Use in Low-Energy School Buildings. Energies 2020, 13, 2985. [Google Scholar] [CrossRef]
  14. Ahn, J.; Cho, S.; Chung, D. Analysis of energy and control efficiencies of fuzzy logic and artificial neural network technologies in the heating energy supply system responding to the changes of user demands. Appl. Energy 2017, 190. [Google Scholar] [CrossRef]
  15. Moon, J.; Ahn, J. Improving sustainability of ever-changing building spaces affected by users’ fickle taste: A focus on human comfort and energy use. Energy Build. 2020, 208. [Google Scholar] [CrossRef]
  16. Singh, M.K.; Attia, S.; Mahapatra, S.; Teller, J. Assessment of thermal comfort in existing pre-1945 residential building stock. Energy 2016, 98, 122–134. [Google Scholar] [CrossRef]
  17. Kim, S.; Shin, H.; Ahn, J. Energy performance analysis of airport terminal buildings by use of architectural, operational information and benchmark metrics. J. Air Transp. Manag. 2020, 83. [Google Scholar] [CrossRef]
  18. Kariminia, S.; Shamshirband, S.; Hashim, R.; Saberi, A.; Petković, D.; Roy, C.; Motamedi, S. A simulation model for visitors’ thermal comfort at urban public squares using non-probabilistic binary-linear classifier through soft-computing methodologies. Energy 2016, 101, 568–580. [Google Scholar] [CrossRef]
  19. Ahn, J.; Chung, D.; Cho, S. Performance analysis of space heating smart control models for energy and control effectiveness in five different climate zones. Build. Environ. 2017, 115. [Google Scholar] [CrossRef]
  20. Park, S.; Cho, S.; Ahn, J. Improving the quality of building spaces that are planned mainly on loads rather than residents: Human comfort and energy savings for warehouses. Energy Build. 2018, 178. [Google Scholar] [CrossRef]
  21. Kurte, K.; Munk, J.; Kotevska, O.; Amasyali, K.; Smith, R.; McKee, E.; Du, Y.; Cui, B.; Kuruganti, T.; Zandi, H. Evaluating the Adaptability of Reinforcement Learning Based HVAC Control for Residential Houses. Sustainability 2020, 12, 7727. [Google Scholar] [CrossRef]
  22. Sung, L.; Ahn, J. Comparative Analyses of Energy Efficiency between on-Demand and Predictive Controls for Buildings’ Indoor Thermal Environment. Energies 2020, 13, 1089. [Google Scholar] [CrossRef] [Green Version]
  23. Attia, S. Spatial and Behavioral Thermal Adaptation in Net Zero Energy Buildings: An Exploratory Investigation. Sustainability 2020, 12, 7961. [Google Scholar] [CrossRef]
  24. Ahn, J. Performance analyses of Temperature Controls by a Network-Based Learning Controller for an Indoor Space in a Cold Area. Sustainability 2020, 12, 8515. [Google Scholar] [CrossRef]
  25. Ahn, J.; Cho, S. Anti-logic or common sense that can hinder machine’s energy performance: Energy and comfort control models based on artificial intelligence responding to abnormal indoor environments. Appl. Energy 2017, 204. [Google Scholar] [CrossRef]
  26. Lee, S.; Joe, J.; Karava, P.; Bilionis, I.; Tzempelikos, A. Implementation of a self-tuned HVAC controller to satisfy occupant thermal preferences and optimize energy use. Energy Build 2019, 194, 301–316. [Google Scholar] [CrossRef]
  27. Bergman, T.L.; Lavine, A.S.; Incropera, F.P.; DeWitt, D.P. Fundamentals of Heat and Mass Transfer; Wiley: New York, NY, USA, 2018. [Google Scholar]
  28. Engineering Toolbox. Recommended Indoor Temperatures Summer and Winter. Engineering Toolbox. 2016. Available online: http://www.engineeringtoolbox.com (accessed on 11 November 2016).
  29. ASHRAE. ASHRAE Standard 55-2004; ASHRAE: Atlanta, GA, USA, 2004. [Google Scholar]
  30. Petković, D.; Protić, M.; Shamshirband, S.; Akib, S.; Raos, M.; Marković, D. Evaluation of the most influential parameters of heat load in district heating systems. Energy Build. 2015, 104, 264–274. [Google Scholar] [CrossRef]
  31. Graupe, D. Principle of Artificial Neural Networks; World Scientific Publishing Co. Pte. Ltd: Singapore, 2013; ISBN 978-981-4522-73-1. [Google Scholar]
  32. Priddy, K.; Keller, P. Artificial Neural Networks: An. Introduction; SPIE Press: Bellingham, WA, USA, 2005; ISBN 0-8194-5987-9. [Google Scholar]
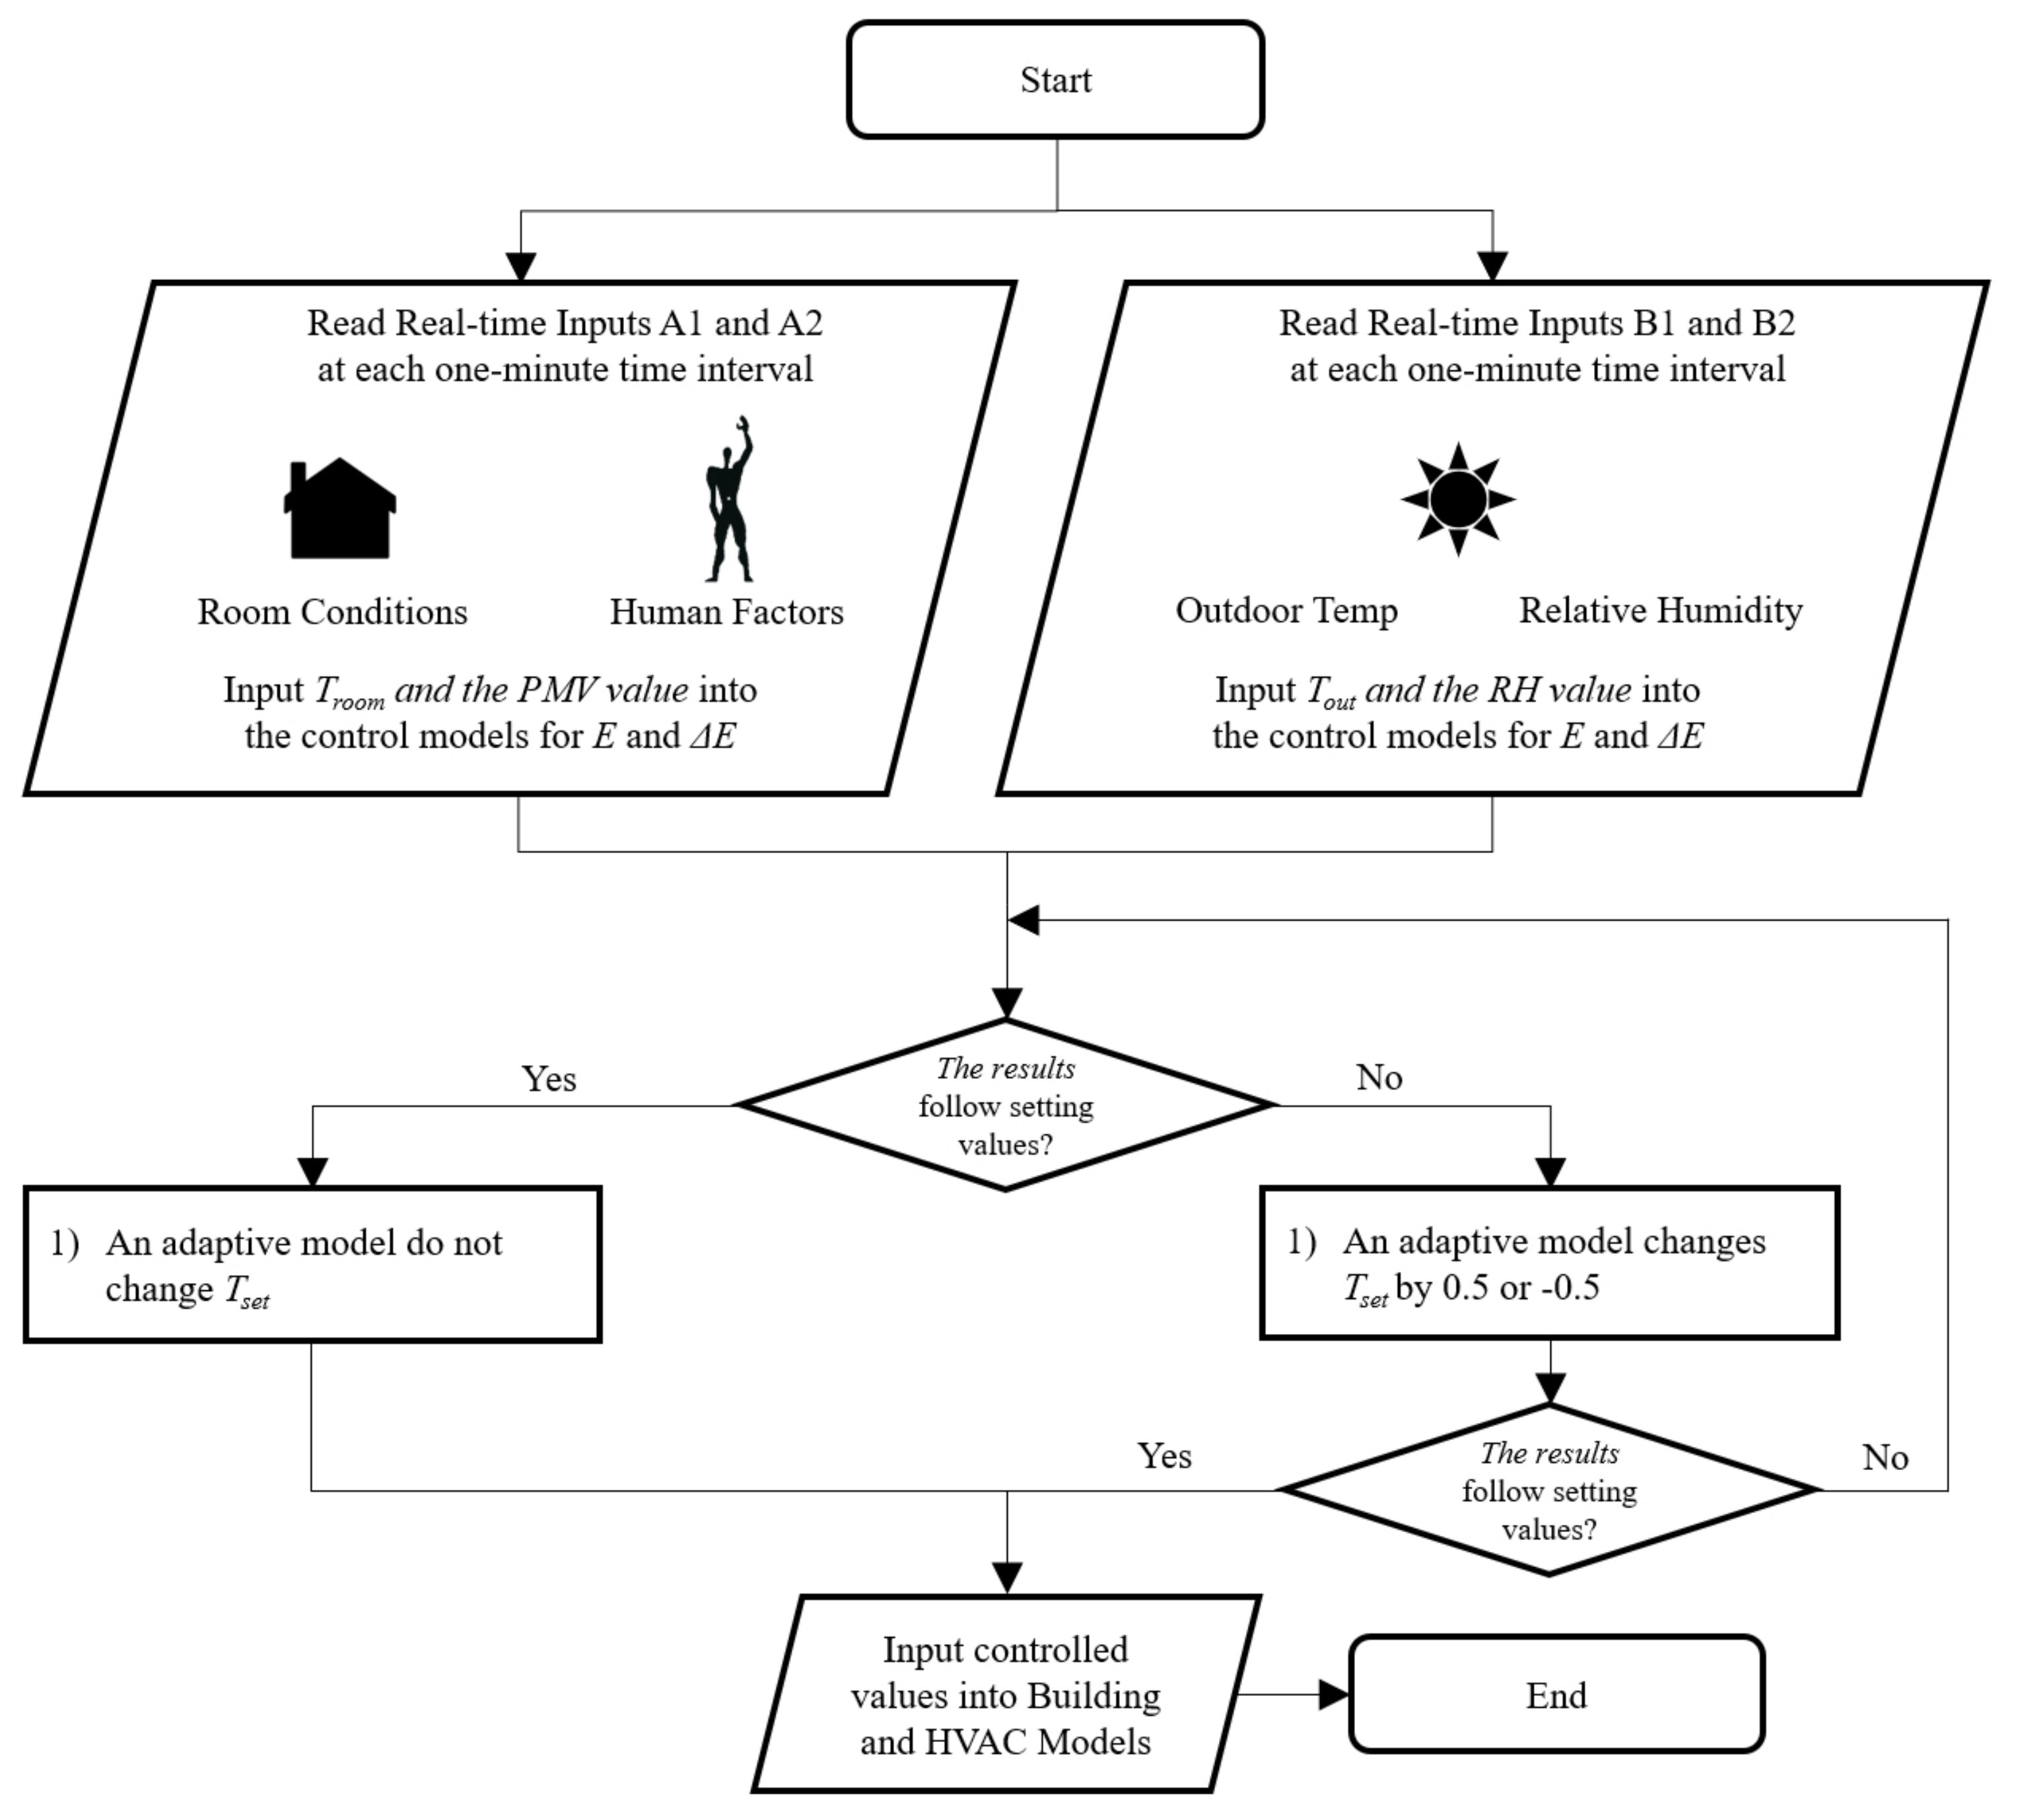
Figure 1. Schematic diagram.
Sustainability 12 09667 g001
Figure 2. Block diagram for entire simulations.
Sustainability 12 09667 g002
Figure 3. Tout of Chungquing at April 7th.
Sustainability 12 09667 g003
Figure 4. Troom by the thermostat control.
Sustainability 12 09667 g004
Figure 5. Troom by the FIS control.
Sustainability 12 09667 g005
Figure 6. Troom by the Artificial Neural Network (ANN) control.
Sustainability 12 09667 g006
Figure 7. Heating and cooling gains by the thermostat control.
Sustainability 12 09667 g007
Figure 8. Heating and cooling gains by the Fuzzy Interference System (FIS) model control.
Sustainability 12 09667 g008
Figure 9. Heating and cooling gains by the ANN control.
Sustainability 12 09667 g009
Figure 10. Signal patterns of the amount of air by the FIS control.
Sustainability 12 09667 g010
Figure 11. Signal patterns of the temperature by the FIS control.
Sustainability 12 09667 g011
Figure 12. Signal patterns of the amount of air by the ANN control.
Sustainability 12 09667 g012
Figure 13. Signal patterns of the temperature by the ANN control.
Sustainability 12 09667 g013
Table 1. Building geometries and specifications.
GeometryValue
Building type-Commercial Office
Building spaceWidth × Depth × Height25.50 × 22.50 × 3.55 (m)
WallArea362.10 (m2)
Thickness0.2 (m)
Thermal Resistance1.60 × 10−6 (h∙°C/J)
WindowArea6.00 (m2)
Thickness0.01 (m)
Thermal Resistance5.94 × 10−7 (h∙°C/J)
Table 2. Comparison of the Predicted Mean Vote (PMV) results.
Control-TypePMV (Avg. of Abs.)Efficiency (%)
Thermostat2.47-
FIS2.49+0.81
ANN2.12−14.17
Table 3. Comparison of the energy transfer results.
Control-TypeEnergy Transfer (kWh/m2∙Year)Efficiency (%)
For CoolingFor HeatingTotal
Thermostat197.55612.31809.86-
FIS158.21653.71811.92+2.54
ANN133.69709.01842.70+4.05
Publisher’s Note: MDPI stays neutral with regard to jurisdictional claims in published maps and institutional affiliations.