Article

Water Use Efficiency and Sensitivity Assessment for Agricultural Production System from the Water Footprint Perspective

1
Business School, Hohai University, Nanjing 211100, China
2
College of Agricultural Science and Engineering, Hohai University, Nanjing 210098, China
3
State Key Laboratory of Hydrology Water Resources and Hydraulic Engineering, Hohai University, Nanjing 210098, China
*
Author to whom correspondence should be addressed.
Sustainability 2020, 12(22), 9665; https://doi.org/10.3390/su12229665
Submission received: 16 October 2020 / Revised: 8 November 2020 / Accepted: 17 November 2020 / Published: 19 November 2020

Abstract

:
The increasing shortage of water resources and the growing demand for crops make water use efficiency a decisive factor for the sustainable and healthy development of the agricultural system. In order to evaluate agricultural water use efficiency from the water footprint perspective, the current study constructed the comprehensive water efficiency (CWE) index based on eight single agricultural water use efficiency performance parameters. The water resources utilization and efficiency in the wheat production system of China from 2006 to 2015 were analyzed and the sensitivity of single indices for CWE was identified. The results show that the national crop water footprint (CWF) for wheat production was estimated to be, including 46.3% blue, 36.6% green and 17.0% blue components, respectively. The spatial distribution patterns of water use efficiency performance indices were different. CWE of the country was 0.387, showing an upward trend over time and decreased from the southeast to the northwest geographically. Crop water productivity (CWP), productive water ratio (PWR) and rainwater consumption ratio (RCR) turned out to be the first three sensitive parameters for CWE in China. The improvement of China’s overall CWE relied on reducing inefficient blue-green water use and increasing the output capacity for per unit water. Advanced agricultural water-saving technologies were in high need for goal achievement, especially for the Huang-Huai-Hai plain, which held more than 70% of Chinese wheat production and CWF. The results provide support for efficient utilization and sustainable development of water resources in the agricultural system.

1. Introduction

Presently, the world is facing systematic risks caused by water shortage, and food security is the first problem [1,2]. Crop sowing consumes lots of water and produces non-point source pollution, to reduce the sustainability of water resources. With urbanization, population growth and climatic change, agriculture faces the issues of producing more food with less water [3,4]. Improving the efficiency of agricultural water use is regarded as an effective measure to deal with food crisis, water shortage and environmental degradation [5]. Consequently, it is important to quantify the utilization efficiency of water resources in the agricultural production process and identify the potential ways to improve it to promote the sustainable utilization of regional water resources [6,7,8].
Accounting for the water resource appropriation and constructing an appropriate index is a general way to assess the agricultural water use efficiency. Irrigation efficiency (IE) and water productivity (WP) are the most common paradigms of traditional methods [9,10]. The former is defined as the proportion of irrigation water consumed by crops in the field to the irrigation water introduced from water sources, and the latter is the crop yield obtained by unit water resource input. IE takes irrigation water as the description object, including the effective utilization part and loss part. The field crop evapotranspiration is the most common water input in WP accounting [11,12,13]. With the expansion of the observation perspective, the water input items of WP are diversified, such as generalized water use and irrigation water diversion [14]. The IE and WP paradigms play an important role in measuring agricultural water use efficiency while putting little attention on the environmental aspect. Water footprint (WF) is a comprehensive method to measure the impact of crop sowing on the quantity and quality of freshwater [15,16]. The crop water footprint (CWF) is the volume of water both consumed and affected by agricultural pollutants, such as chemical fertilizer and pesticide, during the crop season [17] and contains blue (the volume of effective precipitation consumed during crop season), green (the volume of irrigation consumed in crop production) and gray (the volume of freshwater that is required to assimilate the load of pollutants) components [15]. Compared with traditional methods, the progress of CWF is to distinguish between the attributes of blue and green water resources and quantify the negative impact of agricultural production on the water environment [18]. Numerous empirical studies have been conducted on the water footprint and efficiency in major crop production systems at global, national and regional scales [19,20,21]. By using the GEPIC model, Liu et al. [22] modeled the role of irrigation in winter wheat yield, crop water productivity and production in China; Chen et al. [23] analyzed the characteristics and driving forces of water footprint productivity in paddy rice cultivation at provincial scale; Sun et al., [24] revealed the spatial variability and attribution of the water footprint of wheat in China; and Cao et al. [14,25,26,27] assessed the crop–water relationship between main grain in irrigated and rainfed cultivated land of China from the of water footprint, productivity and efficiency perspectives. CWF has been concerned to integrate into agricultural water use efficiency evaluation, and the expression CWF for per unit product is an extension of the function of WP indices [28,29,30]. In addition, some scholars also assessed the WF components and traditional water use efficiency indexes on the field scale [31]. However, most of the exciting research in agricultural water use efficiency assessment focus on the effective utilization degree and production capacity of water resources, while hardly giving full play to the advantages of the WF mentioned above [32].
As the country with the largest population and food consumption in the world, China holds only a quarter of the world’s average water resources per person [14]. Evaluating and improving water use efficiency in grain crop production in China contributes to global food security and sustainable water use [26]. Taking wheat production in China as a case study, the current paper combines traditional paradigms and WF methods in crop water use efficiency assessment for the first time, calculates water use efficiency performance indices based on CWF quantification at the regional scale; constructs and analyses a comprehensive water use efficiency evaluation indicator; and identifies the sensitivity of performance indices to the comprehensive indicator and illustrates the novelty and serviceability of our indicators in crop–water relationship evaluation. These objectives provide the structural sub-headings used in the following Methods, Results and Discussions sections.

2. Methods

2.1. Water Use and Efficiency Performance Indices

Water use efficiency performance indicators in the crop production system were assessed based on the crop water footprint (CWF) quantification in the current study. CWF refers to total water resources used and polluted in the whole crop growth cycle, including blue, green and gray components [15]:
CWF = BWFA + GWF + GYWF
BWFA, GWF and GYWF in m3 are the blue water footprint, green water footprint and gray water footprint in m3, respectively. BWFA was actual blue water resources applied to the irrigation system and consumed through field evapotranspiration and loss in the water conveyance process [11]. CWF comprehensively weighed regional agricultural production and water resources, although it can not characterize water use efficiency. CWF involved items of improving the sustainability evaluation of agricultural water resources utilization, such as precipitation utilization, engineering standards, water-saving technologies, water withdrawal costs and pollution-controlling capabilities. Meaningful and comparative water use efficiency performance indices could be constructed from different perspectives based on CWF. CWF for per unit area (WFP) characterized regional water resource demand intensity. In areas where the same type of crop was planted, the larger the WFP, the more serious the water waste [31].
WFP = CWF / A
A was the crop planting area, ha. Blue water resources were more precious than green water for energy consumption and other costs needed in blue water withdrawal. That blue water apply ratio (BAR, Equation (3)) in the water footprint was not conducive to the sustainable use of water resources.
BAR = BWFA / CWF
However, reducing BAR cannot directly determine the composition of field crop water consumption, for that the GYWF, as well as irrigation and water delivery projects, also made effects to BAR. The rainwater consumption ratio (RCR) was to describe the field water consumption structure [26]:
RCR = GWF / CWC
where CWC was crop water consumption, which meant the total amount of water resources consumed by field crops in the form of evapotranspiration, m3. In addition, CWC was the theoretical minimum water requirement for crop production. The greater the proportion of CWC in CWF, the less useless water resources occupied in agricultural production systems and the higher the efficiency and sustainability of agricultural water resources. The ratio of CWC to CWF was defined here as productive water ratio (PWR) and calculated as follows [26]:
PWR = CWC / CWF
Taking GYWF as an indicator to quantify the negative impact of agricultural production on the environment was an innovation different from traditional agricultural water consumption measurement methods. GYWF ratio in CWF (GWR) can decompose the impact of agricultural production on water quantity and quality:
GWR = GYWF / CWF
Additionally, the traditional agricultural water use efficiency evaluation indicators: crop water productivity (CWP), global irrigation efficiency (GIE) and relative irrigation supply (RIS) should also be calculated and analyzed which indicated how irrigation matches theoretical irrigation water requirements [33].
CWP = Y × A / CWC
GIE = ET b / BWFA
RIS = ET b / IWR
In the formula, Y was crop yield in ton/ha and A was the crop planting area. GIE represented the regional irrigation efficiency. ETb was the amount of blue water resources consumed in the form of field crop evapotranspiration IWR was the water requirement for crop irrigation, that is, the crop irrigation water consumption not subject to water stress.

2.2. Comprehensive Efficiency and Sensitivity Identification

The above eight indices were all acceptable, but not sufficient to fully explain the efficiency and sustainability of agricultural water resources utilization [11,26]. Therefore, based on these single indices, the idea of a comprehensive evaluation was proposed here and the way to obtain comprehensive water use efficiency (CWE) was as follows:
CWE = [ α i × N ( I i ) ]
α meant weight, i was the code of the selected index, whose maximum was 8. N(Ii) was the standardized value of the index I (Ii). Both α and N(Ii) were ranged 0–1 and dimensionless. Ii didn’t directly correspond to the evaluation index of water use efficiency calculated above, because they contributed to CWE in different ways. For example, high WEP, BAR and GWR corresponded to low water use efficiency, while the other five indicators behaved oppositely. Consequently, the calculation method of Ii was clearly listed in Table 1. The objective weighting method, that is, the coefficient of variation method was adopted in the calculation of each index weight.
α i = COV i COV i α i = COV i COV i
COVi was the coefficient of variation of Ii. Table 1 also gave the calculated αi. It can be figured out from the construction process that CWE was a comprehensive description of the relationship between crop production and water resources based on water footprint. It can compare the relative size of water use efficiency in time and space. The higher the CWE, the higher the water use efficiency and sustainability in the year or region. Comprehensively, the sensitivity of CWE changes was measured to weigh the impact of each sub-index. The sensitivity of CWE changes was expressed as the extent to which CWE changed with a certain indicator. In order to facilitate the comparison of the sensitivity of different indicators, the study just calculated the SEN value as a certain indicator increased by 10%. Then the sensitivity parameter SENj of Ij was obtained by [24]:
SEN j = ABS α j × N 110 % × I j + [ α m × N ( I m ) CWE CWE × 100 %
SEN set the direction for improving regional agricultural water resources management strategies. By improving the indicators with high SEN, the water use efficiency and sustainability can get improved.

2.3. Estimation of Crop Water Footprint (CWF) Components

GWF is the total rainwater consumption in the form of field crop evapotranspiration and could not exceed the crop water requirement (CWR) [15]:
GWF = A × Min   ( CWR ,   P e )
Pe is effective precipitation in mm. Based on 10-day precipitation collection, Pe could be estimated and according to the following empirical method, which was recommended in the CROPWAT model and widely used in crop green water footprint estimation [15].
P e = P × 4.17 0.02 × P 4.17   ,   P < 83 41.7 + 0.1 × P ,   P 83
CWR is determined together by the climatic conditions and crop characteristics of the research site [12]:
CWR = K c × RCE
where, Kc is crop coefficient, dimensionless and RCE is reference crop evapotranspiration in mm. RCE was calculated with the Penman-Monteith method recommended in the Food and Agriculture Organization of the United Nations Irrigation and Drainage Paper No. 56.
BWFA for a specific crop is the product of irrigated cropland (Ai) and actual irrigation water applied:
BWFA = A × RIS × IWR GIE
Due to the complexity of agricultural water use, it is difficult to calculate the RIS of a special crop, such as wheat. Here, we assume that all crops shared the same RIS. In other words, only the regional RIS needs to be calculated. Regional RIS for all crops is estimated based on the irrigation water requirement and actual irrigation water use (IWU, mm) [33]:
RIS = GIE × IWU ( ET c P e )
GYWF is estimated following the standard computational methods [15]:
GYWF = α × NA c max c min
α is the leaching-runoff fraction and assumed as 10% following previous practices; AR is the rate of nitrogen application to the field per hectare, kg/ha; Cmax is the maximum acceptable concentration; Cmax is the concentration in natural water, assumed to be 0 mg/L.

2.4. Study Area and Data Resources

CWF, water use efficiency performance indices and CWE of wheat production in China were estimated and conducted in the current paper. The observation area and period were 30 provinces, municipalities and autonomous regions (PAMs) in the mainland of China (excluding Taiwan, Hainan, Hong Kong and Macao) and 2006–2015, respectively. PAMs were divided into five subregions named Northeast (including Heilongjiang, Jilin, Liaoning and Neimenggu), Southeast (including Fujian, Guangdong, Hubei, Hunan, Jiangxi, Shanghai and Zhejiang), Huang-Huai-Hai plain (including Anhui, Beijing, Hebei, Henan, Jiangsu, Shandong and Tianjin), Northwest (including Gansu, Ningxia, Qinghai, Shanxi, Shaanxi and Xinjiang) and Southwest (including Guangxi, Guizhou, Sichuan, Xizang, Yunnan and Chongqing). Meteorological data for wheat CWF estimation were downloaded from China Meteorological Data Network (http://data.cma.cn)); Provincial IWU and GIE were collected from the China Water Resources Bulletins of 2006–2015; Provincial wheat area (A), crop yield (Y) and nitrogen application (NA) were collected from the China Statistical Yearbooks of 2007–2016.

3. Results

3.1. Crop Production and Water Footprint

Annual planting area, crop yield and the total output of wheat in China for the observed period were 3.97 M ha, 4.89 ton/ha and 117.33 M t. Simultaneously, annual CWF in wheat production of the country was estimated to be 212.4 G m3, including about 98.5 G m3 of GWF, 77.8 G m3 of BWFA and 36.2 G m3 of GYWF. The proportions of green (POG), blue (BAR) and gray (GWR) components in CWF were 46.3%, 36.6% and 17.0% respectively. Yearly and provincial wheat production and water footprint in China are presented in Figure 1 and Table 2.
Figure 1a shows that the wheat sown area in China initially expanded slowly from less than 23 M ha in 2006 to 23.72 M ha in 2007 and then presented a very weak swing growth, reaching 24.14 M ha in 2015. Differently, wheat production increased sharply from less than 105 M t initially to more than 130 Mt in 2015. The increase in output was contributed by the improvement in crop yield. During the study period, Y raised from 4.55 t/ha to 5.39 t/ha, increased by 18.5% in 10 years. In addition to the crop varieties, agricultural production technology, such as the expansion of irrigation areas and the application of new irrigation technology, also benefited from the growth of Y. The CWF’s law of change with time resembled that of wheat output. CWF has exceeded 200 G m3 since 2007 and has grown to fluctuate with time. In 2015, it reached 232.02 G m3. The three components of CWF were all in growth. GWF, BWFA and GYWF increased from 87.55, 71.18 and 32.29 G m3 to 109.07, 82.80 and 40.15 Gm3, respectively. So that the proportion of each component in CWF has no obvious changes with time (Figure 1b). Precipitation was always the main water source for wheat production in China, even if the water loss during irrigation was added to CWF.
There was a big difference in the scale of wheat production among PAMs. Table 2 shows that Henan’s sown area exceeded 5000 Kha, which was the largest in the country and followed by 3593.9 Kha in Shandong. While the wheat sown area in the remaining provinces was not over 3000 Kha. Five provinces including Jilin, Liaoning, Fujian, Guangdong and Guangxi have no more than 10 Kha. Wheat yield varied from 1.90 (Guizhou) to 6.55 (Xizang) t/ha, indirectly reflecting the regional differences in agricultural production technology and management level. The yield was not the determinant of regional differences in output, but area was. The annual wheat production in Henan reached 31.35 Mt, much higher than others. The wheat production in Shandong was 21.14 Mt. Shandong was also the only place with an annual wheat output between 20–30 Mt. In addition, the output of Anhui, Hebei and Jiangsu also exceeded 10 Mt and the remaining regions except Xinjiang had less than 5 Mt. It can be seen from Table 2 that the provinces with large wheat planting area and yield were all located in the Huang-Huai-Hai plain where five provinces Anhui, Hebei, Henan, Jiangsu and Shandong contributed in total 74.98% of China’s grain output in the 10 years observed. In addition, 15 provinces (Jilin, Liaoning, Fujian, Guangdong, Hunan, Jiangxi, Shanghai, Zhejiang, Ningxia, Qinghai, Guangxi, Guizhou, Xizang, Yunnan and Chongqing) contributed only 3.15% together. The crop planting scale directly determines the amount of regional crop water footprint. The CWF in Xinjiang, Jiangsu, Anhui, Hebei, Shandong and Henan exceeded 15.0 Gm3, while Jilin, Fujian, Guangdong, Jiangxi and Guangxi had less than 0.1 Gm3. To further observe the regularity of CWF and its composition over time, the CWF and its composition of each region over the years are shown in Figure 2.
The average annual CWF of each subarea was 5.5 (Northeast), 5.6 (Southeast), 154.8 (Huang-Huai-Hai plain), 32.9 (Northwest) and 13.7 (Southwest) Gm3. The CWF of the Huang-Huai-Hai plain seemed significantly higher than others. The Northwest region also contributed considerable water footprint. It can also be seen from Figure 2 that the CWF of Huang-Huai-Hai plain and the Northwest showed an obvious increasing trend with time, from 137.1 Gm3 in 2006 to 169.9 Gm3 in 2015, the contribution rate to China’s wheat water footprint rose from 71.8% to 73.2%. The growth of regional CWF was mainly contributed by green water, which had a net increase of nearly 20 Gm3. The CWF in the Northwest increased by 8.2 Gm3 during the study period, of which 5.2 Gm3 was the blue water footprint. The water shortage in the Huang-Huai-Hai and Northwest turned more serious than that in other places. The increase in CWF in these two regions not only showed that the concentration of wheat water footprint was enhanced further but also meant that agricultural production was facing greater water risks. Evaluating and improving water use efficiency in major agricultural production areas became a major issue that the Chinese government needs to pay attention to. It can also be concluded from Figure 2 that the proportion of GYWF was between 15% and 20% in five regions, while the blue and green water footprint behaved reversely. BAWF accounted for more than 50% of the CWF in the Northeast and Northwest, while the green water footprint dominated in the other three districts. The GAWF ratio to CWF in the Southeast was only 2.3%, where the dependence on irrigation was very low because precipitation can meet 75.8% water requirement. The Huang-Huai-Hai plain was the area with the closest proportion of GWF (34.3%), BAWF (48.2%) and GYWF (17.5%). It consumed plenty of rainwater and a lot of irrigation water while forming a GYWF that cannot be ignored in the wheat production process. Therefore, it will be meaningful to assess and improve regional water use efficiency under the water footprint framework.

3.2. Agricultural Water Use Efficiency Performance Parameters

Data showed that from 2006 to 2015, the total wheat water footprint per unit area (WFP) in China was about 0.886 m, of which the productive water ratio (PWR) accounted for only 64.5%. During the same period, China’s irrigation efficiency was only 0.501 and irrigation water waste was one of the reasons for the high-water footprint and low water productivity. The crop water production per unit productive water consumption (CWP) was 0.856 kg. Rainwater consumption dominated in productive water at 71.8%. And the irrigation water requirement for wheat was calculated as 49.6 Gm3, yet only 77.9% of the relative irrigation supply (RIS) was met. Water use efficiency performance indices in wheat cultivation of China from 2006 to 2015 are mapped in Figure 3.
The indices varied with time. Since the wheat sown area did not expand as fast as CWF grew, WFP performed on an increasing trend. WFP changed from 0.832 m in 2006 to 0.961 m in 2015, with an increase of 15.5% during the study period. Like WFP, GIE made progress from 0.460 to 0.538, directly resulting from the improvement of agricultural water-saving technology. Statistics revealed the area of water-saving irrigation in China expanded from 22.4 Mha in 2006 to 31.1 Mha in 2015. PWR was also rising from 0.629 to 0.660, but the range was lower than WFP and GIE. In contrast, RCR went down from 0.729 in 2006 to 0.713 in 2015. Compared with other indices, CWP has no obvious change trend, while RIS had the strongest volatility. Over the years, RIS has changed between 0.726 and 0.808 with no noticeable law. RIS was determined by the region’s water supply capacity and climatic characteristics, especially precipitation, while little subject to technical intervention. The randomness of natural conditions may account for the changing trend of RIS. As with the national value, the index value of each province remained stable over time, so the annual average value of each index was measured to study the spatial pattern of water use efficiency, as shown in Figure 4.
Restricted by climate, especially precipitation, the water footprint per unit of arable land varied greatly between provinces. Figure 4a shows that provinces with high WFP were mainly concentrated in the Huang-Huai-Hai plain and Western, while low-value provinces were found south of the Yangtze River. Specifically, WFP in Xinjiang was 1.532 m, the largest in China; WFP in Xizang, Hebei and Shandong also exceeded 1.000 m; Beijing, Henan, Tianjin and Qinghai got WFP between 0.900 and 1.000 m; other provinces, including southern ones in China, were all below the national line (0.886 m). Six provinces (Jiangxi, Guangxi, Hunan, Guizhou, Hubei, Yunnan) have a WFP of less than 0.500 m, of which Jiangxi got the lowest in China (0.269 m). Crop field water productivity (CWP) behaved in a spatial pattern which was high in the central and low in western and southeastern coastal provinces (Figure 4b). Shanxi and Shaanxi shared a CWP of 1.037 kg/m and the rest were not over 1.000 kg/m3. Provinces with larger WFP (greater than 0.900 kg/m) were in the northeast (including Liaoning, Jilin and Heilongjiang) and southeast region (Jiangxi, Hunan and Hubei). The minimum value of wheat CWP was found in Fujian, only 0.573 kg/m3. Consistent with the distribution of precipitation in China, the field rainwater consumption ratio RCR presented a clear spatial pattern that decreased from southwest to northwest (Figure 4d) and the blue water application ratio BAR acted oppositely (Figure 4c). Xinjiang, one of the driest areas in China, has less than 200 mm precipitation in the wheat growth period and a large amount of irrigation water is needed to ensure crop growth and development. Therefore, the BAR in Xinjiang was close to 0.700, while the RCR was only 0.362. Xinjiang was the only province in China where the proportion of precipitation to crop field evapotranspiration was less than 0.500. The BAR of Neimenggu, Ningxia, Hebei and Tianjin also exceeded 0.500. Irrigation was also indispensable for these regions. On the contrary, the BAR of Zhejiang and Hunan was as low as 0.012, while their RCR exceeded 0.990. Due to the abundant precipitation during the crop growth period, irrigation water was almost not needed for wheat sowing in these provinces.
Significant spatial aggregation also happened in the GWR in that high-value provinces took Hubei as a center and concentrated in the middle and lower reaches of the Yangtze River and the Yellow River Basin (Figure 4e), while low-value provinces were distributed along the western and northern borders. The proportion of diluted water demand in Shanghai, Shaanxi, Jiangxi, Hunan and Hubei exceeded 20.0%. They were facing a high demand for improving fertilizer use efficiency and controlling water pollution. In contrast, Xinjiang’s GWR was only 0.114, the lowest value in the country. However, this did not mean that Xinjiang had water pollution and no attention should be paid to it. For the large-scale agricultural production, its crop water footprint CWF was as high as 15.3 Gm3 (ranking sixth in China), so the demand for diluted water was also considerable. Maintaining GYWF at a low level while meeting the demand for agricultural production is an important means to ensure long-term regional agriculture development and an effective way to improve the level of the efficient and healthy development of agriculture. Since precipitation played the main role in field water consumption, the spatial pattern of PWR in Figure 4f is like that of RCR in Figure 4d. The highest value occurred in Fujian and the ratio of productive water consumption was as high as 0.838. The provinces with high PWR gathered in the southeast. Neimenggu got a minimum effective water use rate of 0.495. The closer to the north and west, the smaller the PWR value. The proportion of ineffective water used for agricultural production in these areas was high and even exceeded the effective part. It limited the level and quality of agricultural development to a certain degree. Investing more water and improving efficient water-saving technologies can make a difference to make up for the gap in rainfall endowment between North and South as well as promote the efficient and sustainable development of agriculture in the northwest inland areas. GIE and RIS, which take irrigation water resources as the research object, did not show obvious spatial distribution rules. Jilin, Liaoning, Beijing, Tianjin and Gansu represented China’s high irrigation efficiency levels, mainly benefiting from advanced agricultural water-saving technologies. Gansu (0.665), Liaoning (0.700) and Jilin (0.727) performed relatively inferiorly at RIS, reflecting its short water supply capacity. Areas with high GIE and low RIS can continue to take advantage of efficient use of irrigation water and further develop rainfall to improve water supply capacity. On the contrary, Neimenggu, Ningxia, Guangxi, Xinjiang and other provinces with low GIE and high RIS should make full use of water resources endowment to further improve irrigation water use efficiency and expand the agricultural production value of blue water resources.
The above indices assessed regional agricultural water use efficiency from different angles. The different performances of the eight indicators in each province reflected the advantages and disadvantages of efficient water use. The difference in the spatial pattern of each indicator also indicated that it was difficult for a single indicator to comprehensively measure the relationship between agricultural production and water use. Consequently, the comprehensive evaluation method can be used here.

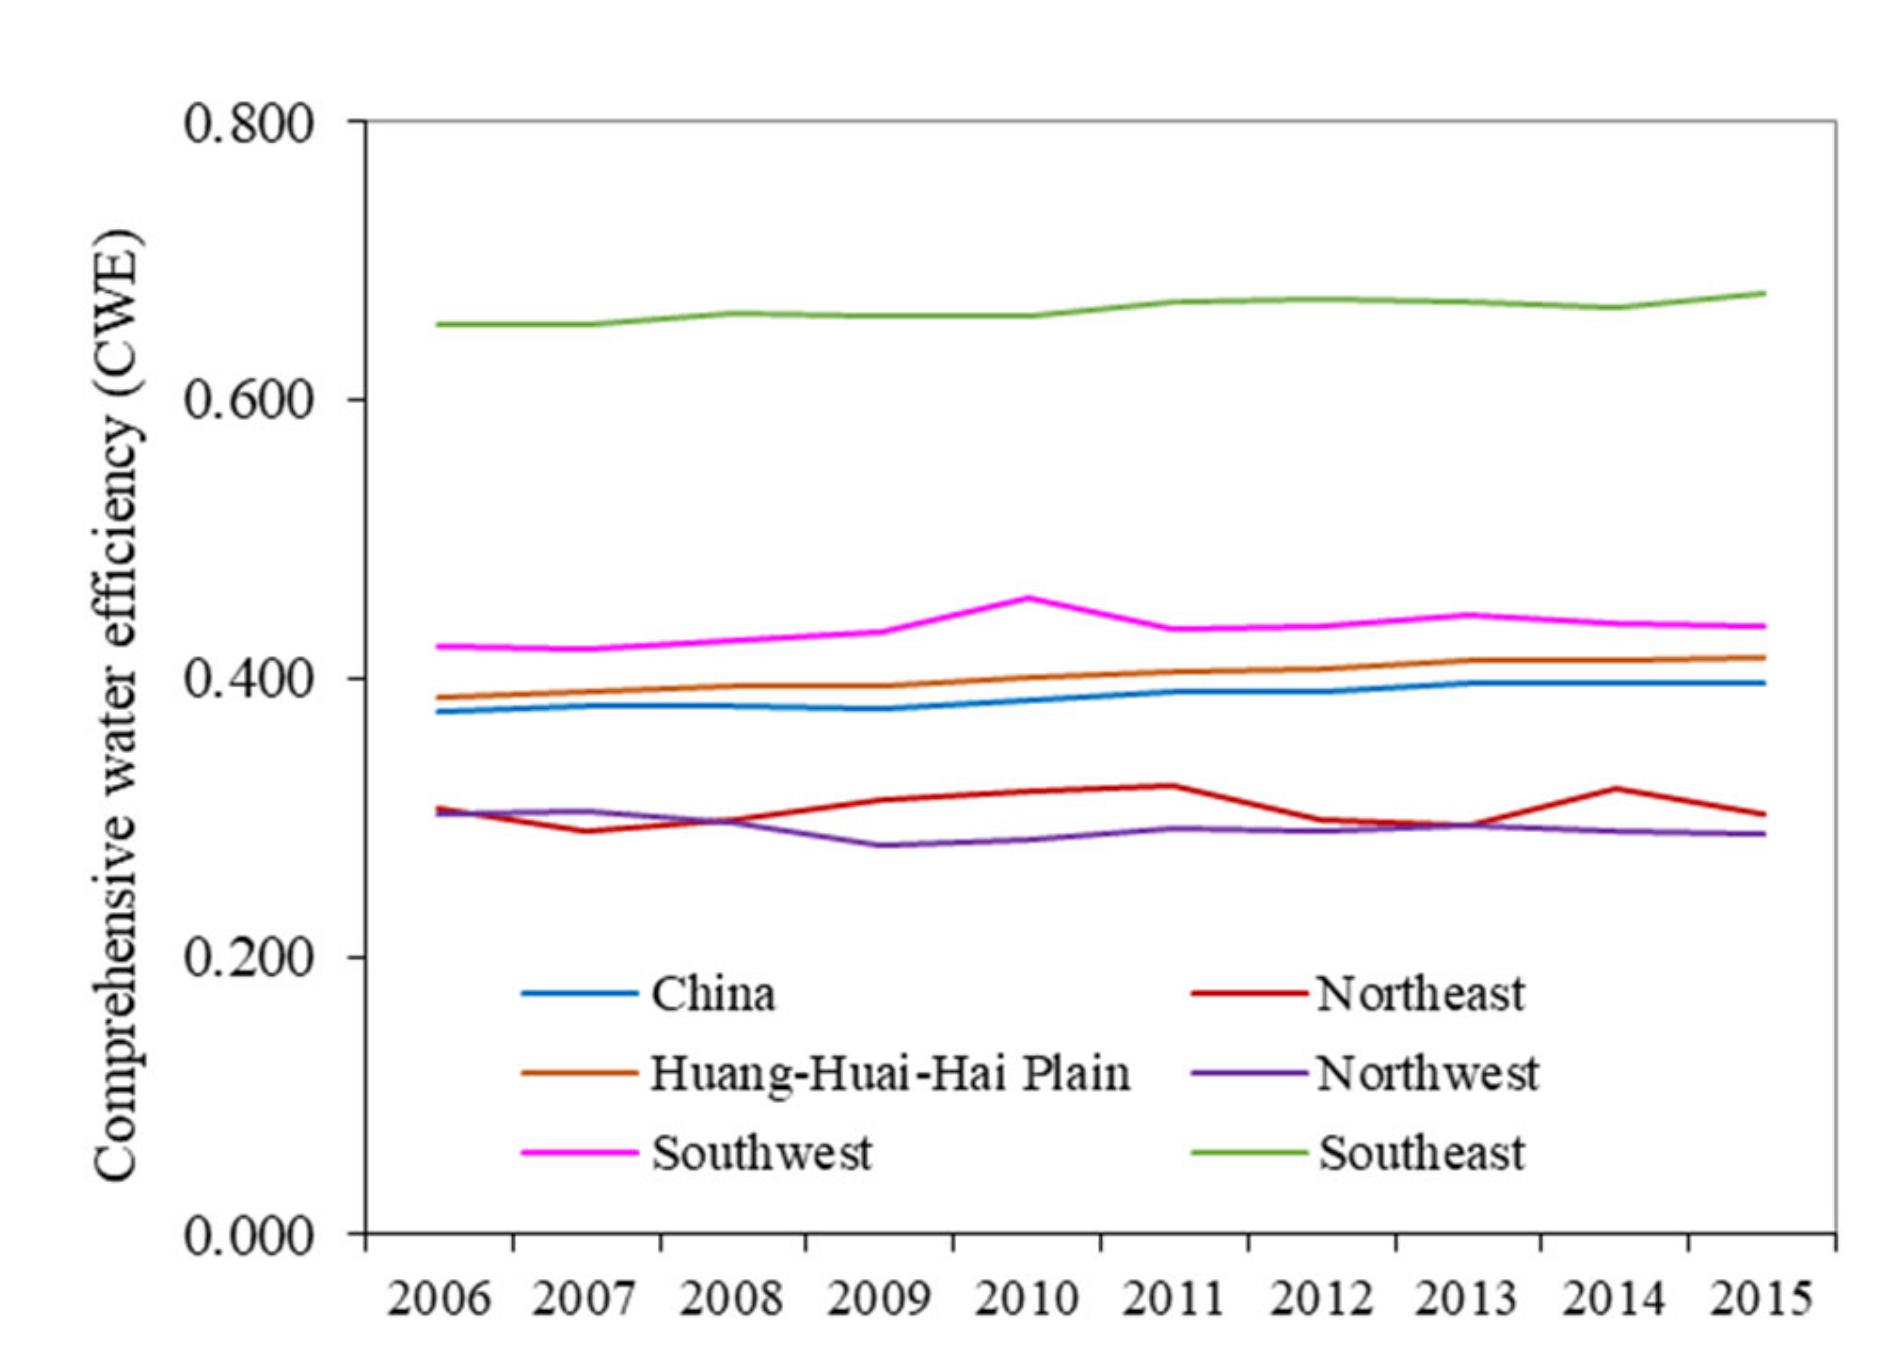
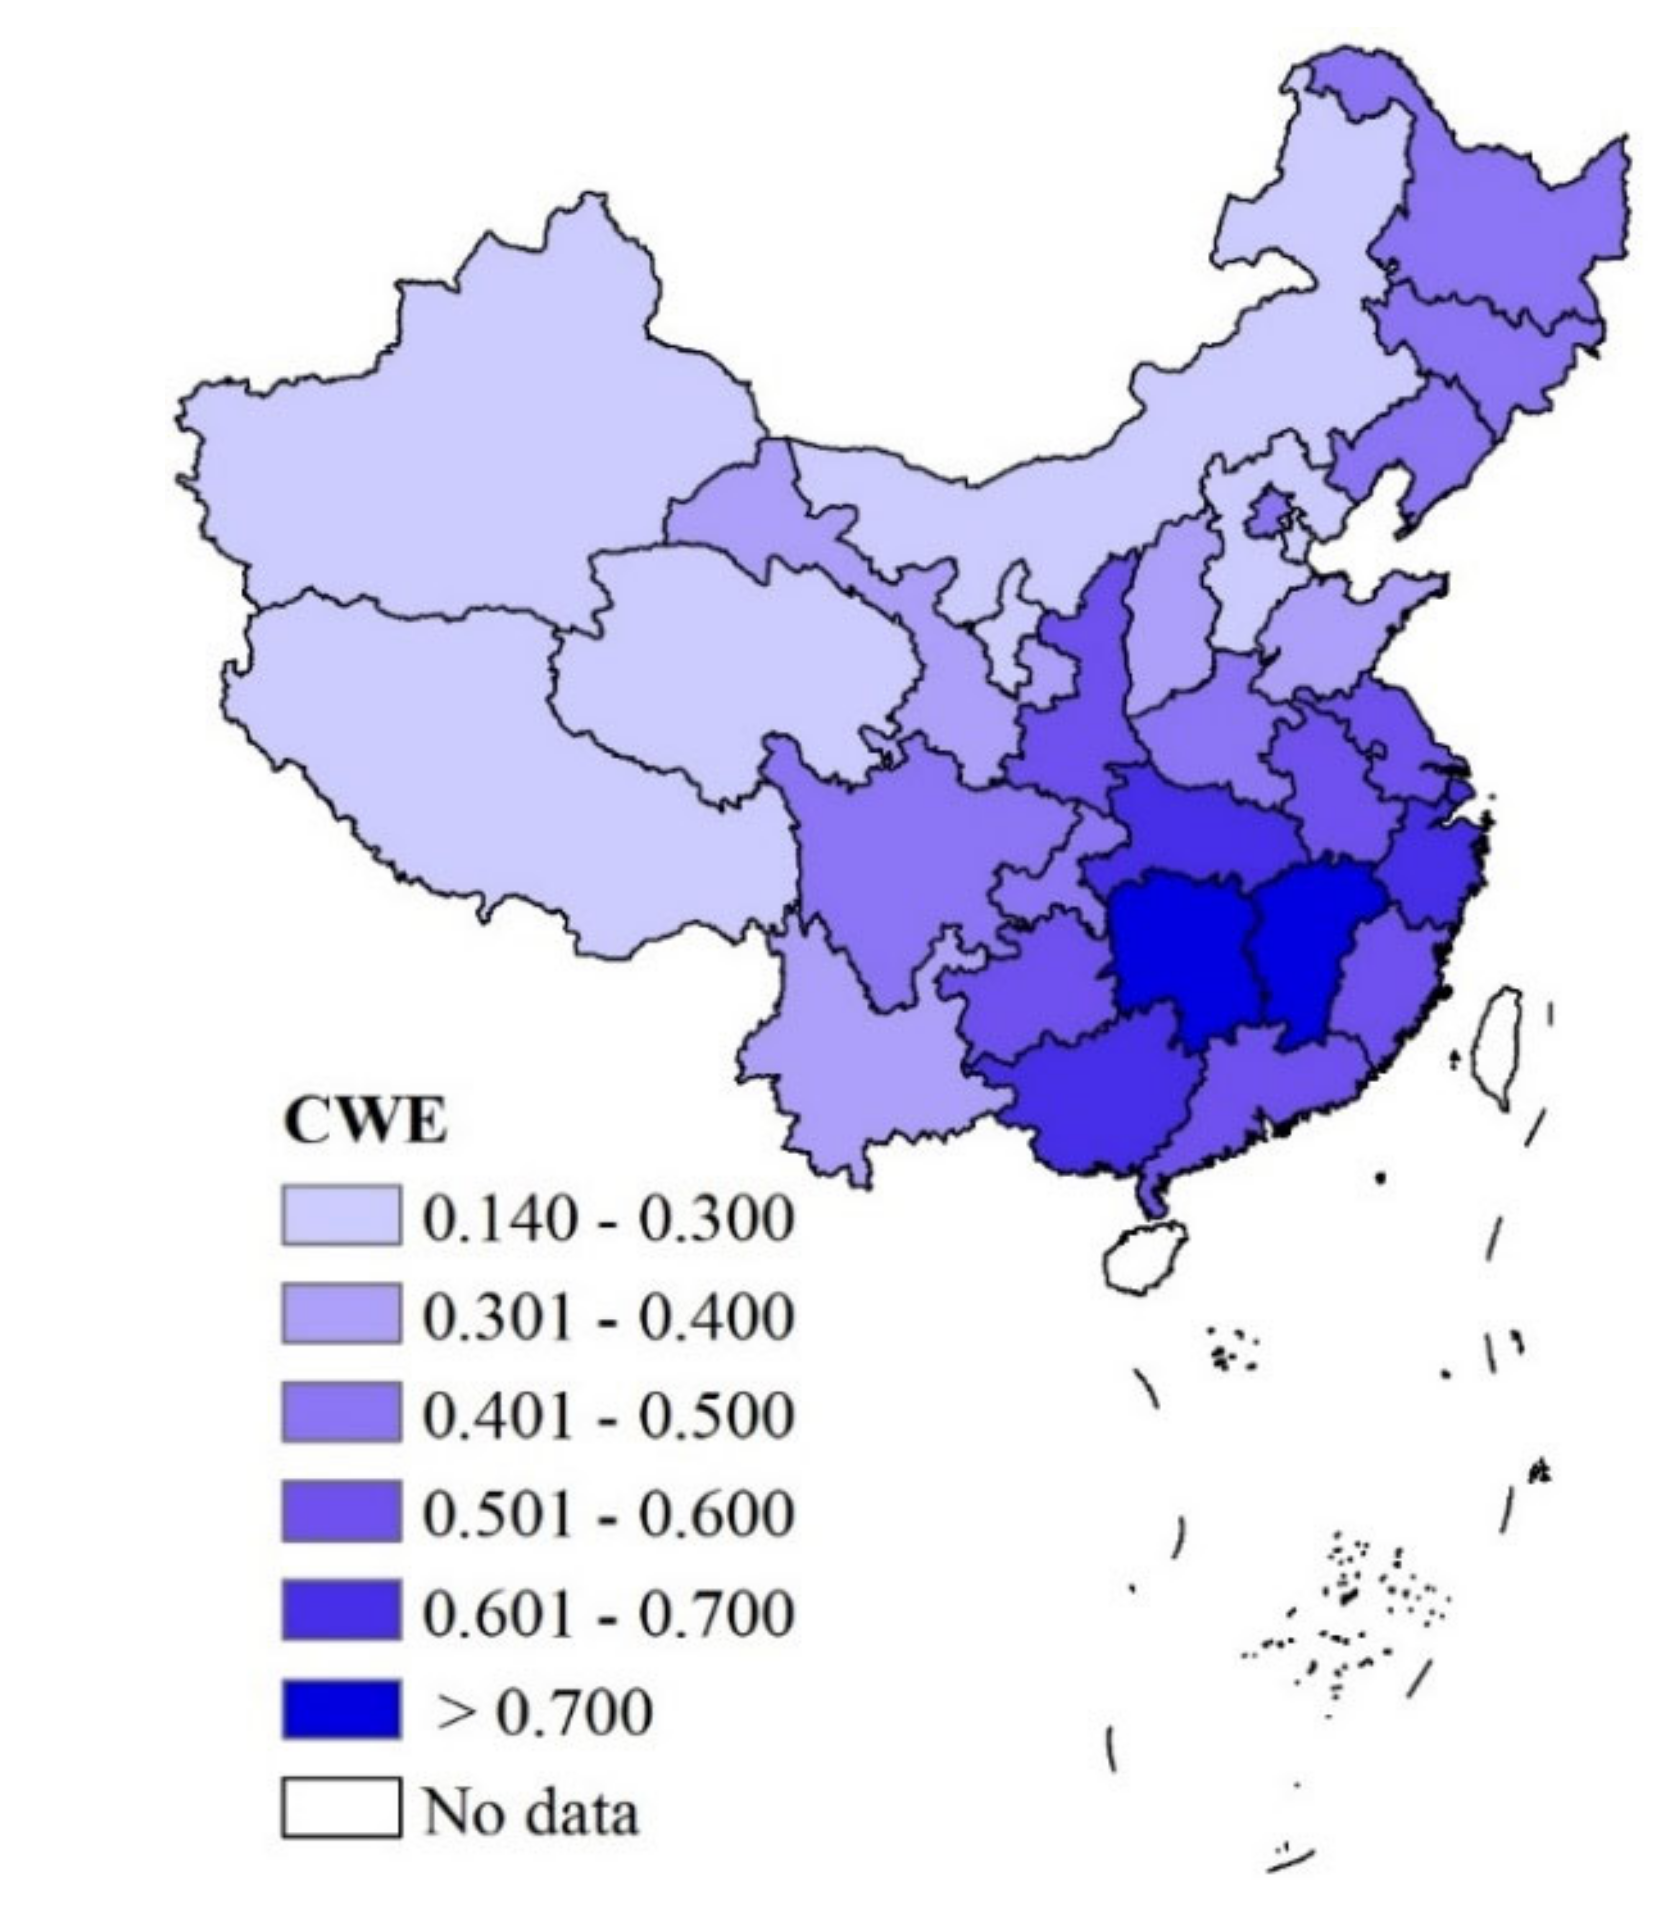
3.3. Comprehensive Water Use Efficiency

The annual average value of China’s CWE was 0.387, slowly increasing from 0.375 in 2006 to 0.396 in 2015 (Figure 5). Although the agricultural water use efficiency nationwide showed a 0.14% growth trend, it was still at a relatively low level. Among them, CWE in the southeast, southwest and Huang-Huai-Hai plain were above the national level and have steadily increased at various speeds. Thanks to superior rainfall conditions and advanced agricultural water-saving technologies, the annual CWE in the southeast was up to 0.665, far ahead of other areas. The water use efficiency in the southwest and Huang-Huai-Hai plain turned to be similar, lower than 0.500, and the agricultural water use efficiency in the northeast and northwest areas were under the national level. They had unstable interannual changes and behaved a downward trend. The efficiency of agricultural water uses nationwide presented a spatial distribution pattern that decreased from southeast to northwest, like the distribution feature of RCR and PWR, indicating that rainfall was still an important factor restricting the efficiency of water resources utilization. Among them, the CWE in Jiangxi and Hunan exceeded 0.700 (Figure 6), with the two provinces as the center, the CWE of the surrounding provinces decreased in sequence and the agricultural water use efficiency of Hubei, Shanghai and Zhejiang was 0.670, 0.646, 0.630; then that of Guangdong and Fujian was 0.579, 0.560; CWE in Chongqing, Sichuan, Henan and Northeast China fell below 0.5; Northwestern provinces such as Xizang, Neimenggu and Xinjiang got the lowest CWE in China. The nationwide CWE distribution pattern also created water use efficiency gaps between different regions. The CWE in the southeast was more than twice that in the northwest and Jiangxi (with the highest CWE) became nearly 5.4 times that of Xinjiang (with the lowest CWE). Three-fifths of the provinces in China showed a low CWE of less than 0.500, which pulled down the national level. That the distribution of CWE in each province had a large span made it difficult to coordinate arrangement. The change of CWE was a comprehensive manifestation of the change in the eight indicators. In order to improve the overall agricultural water use efficiency of China, it is necessary to further explore the impact factors of CWE in various regions.
The factor sensitivities of CWE to eight indicators in China and five regions were shown in Figure 7 and Table 3. Nationally, RCR and CWP made the most contribution to CWE and had the same size. During 2006–2015, the two fell from 4.53 to 4.19 at an average annual rate of 2.2%, followed by PWR with an average annual value of 3.98 and remained stable over the years. The three indicated that improving the rainfall use rate in agricultural production, increasing crop production for per unit water and reducing the inefficient water occupied in CWF could significantly promote the level of CWE. RIS, GIE and BAR are factors next to the first three in the second gradient, to which the sensitivities of CWE were in the range of 2.5–3.0, and the influence of GIE and RIS on CWE has an upward trend. Irrigation water is a supplementary resource for rainfall in agricultural production, but its cost was higher. The efficient use of blue water in regions with a low endowment of rainfall appeared particularly important. The greater crop water use efficiency would largely benefit from a lower proportion of blue water in CWF, higher irrigation efficiency and stronger irrigation water supply capacity. The realization of this goal depended heavily on advanced agricultural water-saving technologies to reduce irrigation losses, and on regional precipitation to reduce blue water occupancy and improve the irrigation water supply capacity. The impact of WFP on CWE declined year by year. The proportion of GYWF (GWR) had the smallest impact on CWE and was constant throughout the year, whose sensitivity was only 0.85. However, GYWF was still growing slightly. Wastewater will be added to CWF and cut down on CWE. The influence will be visible until the GYWF grows to a certain extent.
In the sensitivity study, 30 provinces performed differently against China. Figure 8 lists the top three indicators that each area had the greatest impact on CWE. The southeast with the highest agricultural water use efficiency mainly depended on CWP and PWR. Contrary to the national situation, the sensitivity coefficient of the southeast to RCR was only 0.30. The abundant rainwater in the southeast can better meet the crop water requirement, so a little degree of rainfall reduction will not affect the water use efficiency. However the southeast was short in improving productive water consumption ratio and crop water productivity for per unit area. In addition, the agricultural scale in the southeast was relatively small so that WFP made a great effect on CWE. The top three impact factors of most provinces in the southeast also appeared to be CWP, PWR and WEP, lining up in different orders. Among them, the sensitivity of Fujian, Shanghai and Zhejiang to RIS was close to 2.00, where agricultural irrigation water supply needs to be strengthened. The sensitivity of CWE to the eight indices in Northeast and Northwest showed a similar clue, and the contributions of CWP and PWR were still among the best. BAR and RCR closely followed. The lack of green water restricted agricultural production and blue water became the main source of water supply. The sensitivity of GIE and RIS appeared between 3.60–4.00. The main sensitive parameters of CWE in Heilongjiang, Jilin and Liaoning (Figure 8) were CWP, RCR and PWR. The CWE in Inner Mongolia was as low as 0.231. The maximum impact factor was BAR, whose sensitivity was as high as 7.191. Cutting down inefficient water is an important means to improve the coefficient of agricultural water use. The sensitivity of Shaanxi, Shanxi and Qinghai to RCR increased in sequence, and Xinjiang’s sensitivities to CWP, PWR and RIS were up to 9.00. Improving the output value of water resources, reducing useless water and meeting irrigation needs as much as possible were in high need to improve CWE. The sensitivity factors of all provinces in the Huang-Huai-Hai area are RCR, CWP and PWR. Thanks to water quantity limitation, improving the effective water use rate as well as crop output rate and further exploring rainfall are the current primary tasks in the eastern plains. On the contrary, the sensitivity of CWP in Southwest China was not high, RCR came the first and it was still very important to improve PWR. In addition, Guangxi, Guizhou and Yunnan’s sensitivities to WEP also reached about 3.00. Among the top three sensitive parameters in 30 provinces, CWP appeared 24 times, of which 15 were ranked the first. PWR appeared 26 times and RCR got 19 times. In general, rainfall was the main water resource for agricultural production, and increasing the ratio of GWF to CWF can effectively improve water use efficiency. The agricultural production in the northwest was particularly limited by rainfall, and RCR once became the first sensitive factor in each province. For the eastern regions rich in water availability, the crop output for per unit water can better affect CWE fluctuations. From Fujian to Tianjin, the regions from south to north were increasingly sensitive to CWP, with sensitivities ranging from 2.015 to 6.607. PWR had the highest frequency. It indicated that in addition to differences in climatic conditions, the effectiveness of crop water consumption is also an important criterion for evaluating agricultural water use efficiency. The development of CWE finally came down to the improvement of the crop yield per unit water and the effective utilization rate of crop water consumption, which maximized the effective absorption and the production conversion rate of water investment.

4. Discussion

Rational quantification of water resource utilization and its efficiency in crop production systems is beneficial to regional agricultural water management decision making. Table 4 compares the current result on WF for per unit wheat product of China to available documented values. Blue and green components were concerned in all researches, while Mekonnen and Hoekstra [19] and the current study were also related to the evaluation of GYWF and all literature clearly defined the observing period. Same as this study, Sun et al. [24] estimated field crop requirement by using the Penman–Monteith method recommended in the Food and Agriculture Organization of the United Nations Irrigation and Drainage Paper No. 56. Liu et al. [22] simulated crop Y and field water consumption for winter wheat at a grid resolution of five arc-minutes based on a GIS-based EPIC model (GEPIC). Cao et al. [25], quantified actual field evapotranspiration of wheat cultivated in both rain-fed and irrigated cropland by means of crop model coupled statistics. All the above three studies were only able to calculate the blue and green water components, and the results were close to each other, which indicated that the results of the model simulating the field water consumption of crops were credible. Mekonnen and Hoekstra [19] provided more comprehensive information on water utilization for wheat production, and the result was higher than the fore-mentioned three studies. The current study not only calculated the GYWF but also attempted to combine irrigation efficiency with crop water footprint assessment. The loss of irrigation water involved in water footprint and efficiency is the reason why the WFP of this study is higher than those of previous studies. In fact, some scholars have noted that WF could be linked with irrigation management when addressing the process of blue water withdrawal [11]; the regional WF reduction and water-saving potential could be explored by changing irrigation technology and fertilization measures [32]; and new evaluation framework and index system of agricultural water utilization could be established, combining with the traditional paradigms and WF performances indices [30]. Therefore, this study calculates CWF at the regional scale and conducts a comprehensive evaluation of agricultural water use efficiency. To quantify the relationship between crops and water by examining the whole process of agricultural water use is an obvious difference between this paper and the existing researches. In addition, due to functional limitations, there is no single indicator that can fully measure the water performance of agricultural production systems. It is necessary to consider multiple indices to comprehensively evaluate the agricultural water use efficiency. Therefore, this study has a promoting effect on the development and application of agricultural water use efficiency evaluation theory.

5. Conclusions

The aim of this study is to evaluate agricultural water use efficiency comprehensively under the framework of water footprint. It was found that the contribution of every single parameter would make clear directions for increasing the output value of agricultural water resources in different regions. From 2006 to 2015, with the continuous improvement of the agricultural level, the crop yield in China increased at a rate of 18%. The highest water use efficiency (0.748) appeared in Jiangxi, and CWE in China gradually declined from the southeast to the northwest. CWE had different performance in the sensitivities to the eight parameters. In the research of the three main sensitive parameters of each province, GWR, PWR and RCR ranked first and appeared most frequently. Precipitation played a great significant role in agricultural development. Improving the development and utilization of green water resources came to be a technical difficulty faced by both China and 30 provinces. Regardless of the differences in water resource endowments, the promotion of CWE largely depended on the effective utilization of water investment and the improvement of crop production per unit of water. Agricultural water-saving technologies were in high need to be further improved to reach the goal, especially in regions such as the Huang-Huai-Hai plain and Northwest China. This paper reveals the important role of the precipitation in CWE of wheat production. It is significant to focus on the impact of socio-economic factors, such as agricultural production input and social development level on agricultural water use efficiency, to seek more inclusive water management strategies in the future.

Author Contributions

Conceptualization, W.W. and X.C.; methodology, X.C.; software, X.C.; validation, X.C., W.W. and J.W.; formal analysis, W.W.; investigation, W.W.; resources, WW.; data curation, X.C.; writing—original draft preparation, W.W.; writing—review and editing, X.C.; visualization, W.W.; supervision, J.W.; project administration, X.C.; funding acquisition, X.C. All authors have read and agreed to the published version of the manuscript.

Funding

This research was jointly funded by the National Natural Science Foundation of China (51979074), the Fundamental Research Funds for the Central Universities (B200202095) and the Social Science Fund of Jiangsu Province (17GLC013).

Conflicts of Interest

The authors declare no conflict of interest.

References

  1. Gorgoglione, A.; Gregorio, J.; Ríos, A.; Alonso, J.; Chreties, C.; Fossati, M. Influence of Land Use/Land Cover on Surface-Water Quality of Santa Lucía River, Uruguay. Sustainability 2020, 12, 4692. [Google Scholar] [CrossRef]
  2. Wang, X.; Zhang, F. Effects of land use/cover on surface water pollution based on remote sensing and 3D-EEM fluorescence data in the Jinghe Oasis. Sci. Rep. 2018, 8, 13099. [Google Scholar] [CrossRef] [PubMed]
  3. Cao, X.; Wu, M.; Guo, X.; Zheng, Y.; Gong, Y.; Wu, N.; Wang, W. Assessing water scarcity in agricultural production system based on the generalized water resources and water footprint framework. Sci. Total Environ. 2017, 609, 587–597. [Google Scholar] [CrossRef]
  4. Fader, M.; Shi, S.; Von Bloh, W.; Bondeau, A.; Cramer, W. Mediterranean irrigation under climate change: More efficient irrigation needed to compensate for increases in irrigation water requirements. Hydrol. Earth Syst. Sci. 2016, 20, 953–973. [Google Scholar] [CrossRef] [Green Version]
  5. Kahil, M.T.; Dinar, A.; Albiac, J. Modeling water scarcity and droughts for policy adaptation to climate change in arid and semiarid regions. J. Hydrol. 2015, 522, 95–109. [Google Scholar] [CrossRef] [Green Version]
  6. Aggelides, S.; Karamanos, A.; Londra, P. Irrigation systems performance in Greece. In Irrigation Systems Performance; Lamaddalena, N., Lebdi, F., Todorovic, M., Bogliotti, C., Eds.; CIHEAM Bari: Valenzano, Italy, 2005; pp. 99–110. [Google Scholar]
  7. Kastridis, A.; Stathis, D. The effect of small earth dams and reservoirs on water management in North Greece (Kerkini Municipality). Silva Balc. 2015, 16, 71–84. [Google Scholar]
  8. Senzanje, A.; Boelee, E.; Rusere, S. Multiple use of water and water productivity of communal small dams in the Limpopo Basin, Zimbabwe. Irrig. Drain. Syst. 2008, 22, 225–237. [Google Scholar] [CrossRef]
  9. Cai, X.; McKinney, D.C.; Rosegrant, M.W. Sustainability analysis for irrigation water management in the Aral Sea region. Agric. Syst. 2003, 76, 1043–1066. [Google Scholar] [CrossRef] [Green Version]
  10. Pereira, H.; Marques, R.C. An analytical review of irrigation efficiency measured using deterministic and stochastic models. Agric. Water Manag. 2017, 184, 28–35. [Google Scholar] [CrossRef]
  11. Cao, X.; Zeng, W.; Wu, M.; Guo, X.; Wang, W. Hybrid analytical framework for regional agricultural water resource utilization and efficiency evaluation. Agric. Water Manag. 2020, 231, 106027. [Google Scholar] [CrossRef]
  12. Wang, W.; Yu, Z.; Zhang, Y.; Shao, Q.; Luo, Y.; Jiao, X.; Xu, J. Responses of rice yield, irrigation water requirement and water use efficiency to climate change in China: Historical simulation and future projections. Agric. Water Manag. 2014, 146, 249–261. [Google Scholar] [CrossRef]
  13. Boonwichai, S.; Shrestha, S.; Babel, M.S.; Weesakul, S.; Datta, A. Climate change impacts on irrigation water requirement, crop water productivity and rice yield in the Songkhram River Basin, Thailand. J. Clean. Prod. 2018, 198, 1157–1164. [Google Scholar] [CrossRef]
  14. Cao, X.; Wang, Y.; Wu, P.; Zhao, X.; Wang, J. An evaluation of the water utilization and grain production of irrigated and rain-fed croplands in China. Sci. Total Environ. 2015, 529, 10–20. [Google Scholar] [CrossRef] [PubMed]
  15. Hoekstra, A.Y.; Chapagain, A.K.; Aldaya, M.M.; Mekonnen, M.M. The Water Footprint Assessment Manual: Setting the Global Standard; Earthscan: London, UK, 2011; pp. 1–206. [Google Scholar]
  16. Zhang, Y.; Huang, K.; Yu, Y.; Yang, B. Mapping of water footprint research: A bibliometric analysis during 2006–2015. J. Clean. Prod. 2017, 149, 70–79. [Google Scholar] [CrossRef]
  17. Ababaei, B.; Etedali, H.R. Water footprint assessment of main cereals in Iran. Agric. Water Manag. 2017, 179, 401–411. [Google Scholar] [CrossRef]
  18. Toro-Mujica, P.; Aguilar, C.; Vera, R.; Cornejo, K. A simulation-based approach for evaluating the effects of farm type, management, and rainfall on the water footprint of sheep grazing systems in a semi-arid environment. Agric. Syst. 2016, 148, 75–85. [Google Scholar] [CrossRef]
  19. Mekonnen, M.M.; Hoekstra, A.Y. The green, blue and grey water footprint of crops and derived crop products. Hydrol. Earth Syst. Sci. 2011, 15, 1577–1600. [Google Scholar] [CrossRef] [Green Version]
  20. Lovarelli, D.; Bacenetti, J.; Fiala, M. Water Footprint of crop productions: A review. Sci. Total Environ. 2016, 548, 236–251. [Google Scholar] [CrossRef] [PubMed]
  21. Novoa, V.; Ahumada-Rudolph, R.; Rojas, O.; Sáez, K.; De La Barrera, F.; Arumí, J.L. Understanding agricultural water footprint variability to improve water management in Chile. Sci. Total Environ. 2019, 670, 188–199. [Google Scholar] [CrossRef]
  22. Liu, J.; Wiberg, D.; Zehnder, A.J.B.; Yang, H. Modeling the role of irrigation in winter wheat yield, crop water productivity, and production in China. Irrig. Sci. 2007, 26, 21–33. [Google Scholar] [CrossRef] [Green Version]
  23. Chen, S.; Wu, M.; Xinchun, C.; Guo, X. Analysis of the characteristics and driving forces of water footprint productivity in paddy rice cultivation in China. J. Sci. Food Agric. 2020, 100, 1764–1774. [Google Scholar] [CrossRef] [PubMed]
  24. Sun, S.; Wang, Y.; Wu, P.; Zhao, X. Spatial variability and attribution analysis of water footprint of wheat in China. Trans. Chin. Soc. Agric. Eng. 2015, 31, 142–148. [Google Scholar]
  25. Cao, X.C.; Wu, P.T.; Wang, Y.B.; Zhao, X.N. Assessing blue and green water utilisation in wheat production of China from the perspectives of water footprint and total water use. Hydrol. Earth Syst. Sci. 2014, 18, 3165–3178. [Google Scholar] [CrossRef] [Green Version]
  26. Cao, X.C.; Shu, R.; Guo, X.P.; Wang, W.G. Scarce water resources and priority irrigation schemes from agronomic crops. Mitig. Adapt. Strat. Glob. Chang. 2018, 24, 399–417. [Google Scholar] [CrossRef]
  27. Cao, X.; Ren, J.; Wu, M.; Guo, X.; Wang, Z.; Wang, W. Effective use rate of generalized water resources assessment and to improve agricultural water use efficiency evaluation index system. Ecol. Indic. 2018, 86, 58–66. [Google Scholar] [CrossRef]
  28. Bocchiola, D. Impact of potential climate change on crop yield and water footprint of rice in the Po valley of Italy. Agric. Syst. 2015, 139, 223–237. [Google Scholar] [CrossRef]
  29. Wang, W.; Zhuo, L.; Li, M.; Liu, Y.; Wu, P. The effect of development in water-saving irrigation techniques on spatial-temporal variations in crop water footprint and benchmarking. J. Hydrol. 2019, 577, 123916. [Google Scholar] [CrossRef]
  30. Lu, Y.; Zhang, X.; Chen, S.; Shao, L.; Sun, H. Changes in water use efficiency and water footprint in grain production over the past 35 years: A case study in the North China Plain. J. Clean. Prod. 2016, 116, 71–79. [Google Scholar] [CrossRef]
  31. Cao, X.; Wu, M.; Shu, R.; Zhuo, L.; Chen, D.; Shao, G.; Guo, X.; Wang, W.; Tang, S. Water footprint assessment for crop production based on field measurements: A case study of irrigated paddy rice in East China. Sci. Total Environ. 2018, 610, 84–93. [Google Scholar] [CrossRef]
  32. Wang, F.; Wang, S.; Li, Z.; You, H.; Aviso, K.; Tan, R.R.; Jia, X. Water footprint sustainability assessment for the chemical sector at the regional level. Resour. Conserv. Recycl. 2019, 142, 69–77. [Google Scholar] [CrossRef]
  33. Levine, G. Relative Water Supply: An Explanatory Variable for Irrigation Systems; Technical Report No. 6.; Cornell University: Ithaca, NY, USA, 1982. [Google Scholar]
Figure 1. Wheat production and water footprint in China during 2006–2015. (a) sown area, output, and crop yield; (b) crop water footprint and its composition.
Sustainability 12 09665 g001
Figure 2. Crop water footprint (CWF) and composition for five subregions of China; Pies are the composition of CWF in each subregion.
Sustainability 12 09665 g002
Figure 3. Water use efficiency performance indices in wheat cultivation of China from 2006 to 2015.
Sustainability 12 09665 g003
Figure 4. Spatial distribution of water use efficiency indices for wheat production in China. (a) water footprint density, (b) crop water productivity, (c) blue water apply ratio, (d) rainwater consumption ratio, (e) grey water footprint ratio, (f) productive water ratio, (g) global irrigation efficiency and (h) relative irrigation supply.
Sustainability 12 09665 g004
Figure 5. Yearly comprehensive water use efficiency (CWE) for subregions during 2006–2015.
Sustainability 12 09665 g005
Figure 6. The spatial distribution of comprehensive water use efficiency in China.
Sustainability 12 09665 g006
Figure 7. Yearly sensitivity of comprehensive water use efficiency (CWE) to 8 factors in China.
Sustainability 12 09665 g007
Figure 8. Main sensitive parameters for the CWE in 30 PAMs of China.
Sustainability 12 09665 g008
Table 1. Index and weight for comprehensive water use efficiency evaluation.
Index (I)I1I2I3I4I5I6I7I8
Calculation1/WFP1-BARRCR1-GWRCWPPWRGIERIS
Weight0.3030.1880.150.0210.0990.0870.0830.069
Table 2. Provincial wheat production and water footprint from 2006–2015.
RegionsPAMsPlant Area
(Kha)
Output (Mt)Contribution
(%)
Y
(t/ha)
CWF
(Gm3)
NortheastHeilongjiang215.20.740.633.441.2
Jilin3.00.010.013.39<0.1
Liaoning8.60.040.034.620.1
Neimenggu536.51.661.423.104.2
SoutheastFujian3.40.010.013.08<0.1
Guangdong1.4<0.01<0.013.01<0.1
Hubei1022.73.583.053.504.7
Hunan32.50.090.072.620.1
Jiangxi11.30.020.021.96<0.1
Shanghai47.00.190.164.010.3
Zhejiang69.60.260.223.740.4
Huang-Huai-Hai plainAnhui2363.712.2810.465.1919.6
Beijing48.10.240.204.990.4
Hebei2390.912.8910.995.3926.3
Henan5288.631.3526.725.9350.8
Jiangsu2074.810.318.794.9717.9
Shandong3593.921.1418.025.8838.7
Tianjin109.70.550.475.001.1
NorthwestGansu881.92.592.212.945.2
Ningxia187.50.600.513.181.3
Qinghai102.20.390.343.851.0
Shanxi702.52.432.073.464.0
Shaanxi1131.24.063.463.596.0
Xinjiang1000.55.504.685.4915.3
SouthwestGuangxi3.90.01<0.011.50<0.1
Guizhou270.10.510.441.901.1
Sichuan1241.94.313.683.478.9
Xizang37.90.250.216.550.6
Yunnan441.20.860.741.962.2
Chongqing149.60.460.393.051.0
Table 3. National and regional sensitivity of comprehensive water use efficiency (CWE) to various factors.
RegionWFPBARGWRRCRCWPPWRGIERIS
Northeast2.974.890.854.395.374.113.613.83
Southeast2.110.090.120.302.862.581.571.86
Huang-Huai-Hai plain1.682.320.824.274.263.882.942.72
Northwest2.754.991.004.315.454.783.783.99
Southwest2.351.790.664.272.973.872.422.60
China1.922.570.834.324.323.982.832.88
Table 4. Comparison between documented values on national WF per unit product with the current study.
StudyWF Per Unit Product
(m3/kg)
ColorYear/Period
Liu et al. [22]~1.100Blue, green2005
Mekonnen and Hoekstra [19]1.597Blue, green, gray1996–2005
Cao et al. [25]0.968Blue, green1998–2010
Sun et al. [24]1.071Blue, green2001–2010
This study1.811Blue, green, gray2006–2015
Publisher’s Note: MDPI stays neutral with regard to jurisdictional claims in published maps and institutional affiliations.

