A Comparative Cradle-to-Gate Life Cycle Study of Bio-Energy Feedstock from Camelina sativa, an Italian Case Study
Abstract
1. Introduction
2. Materials and Methods
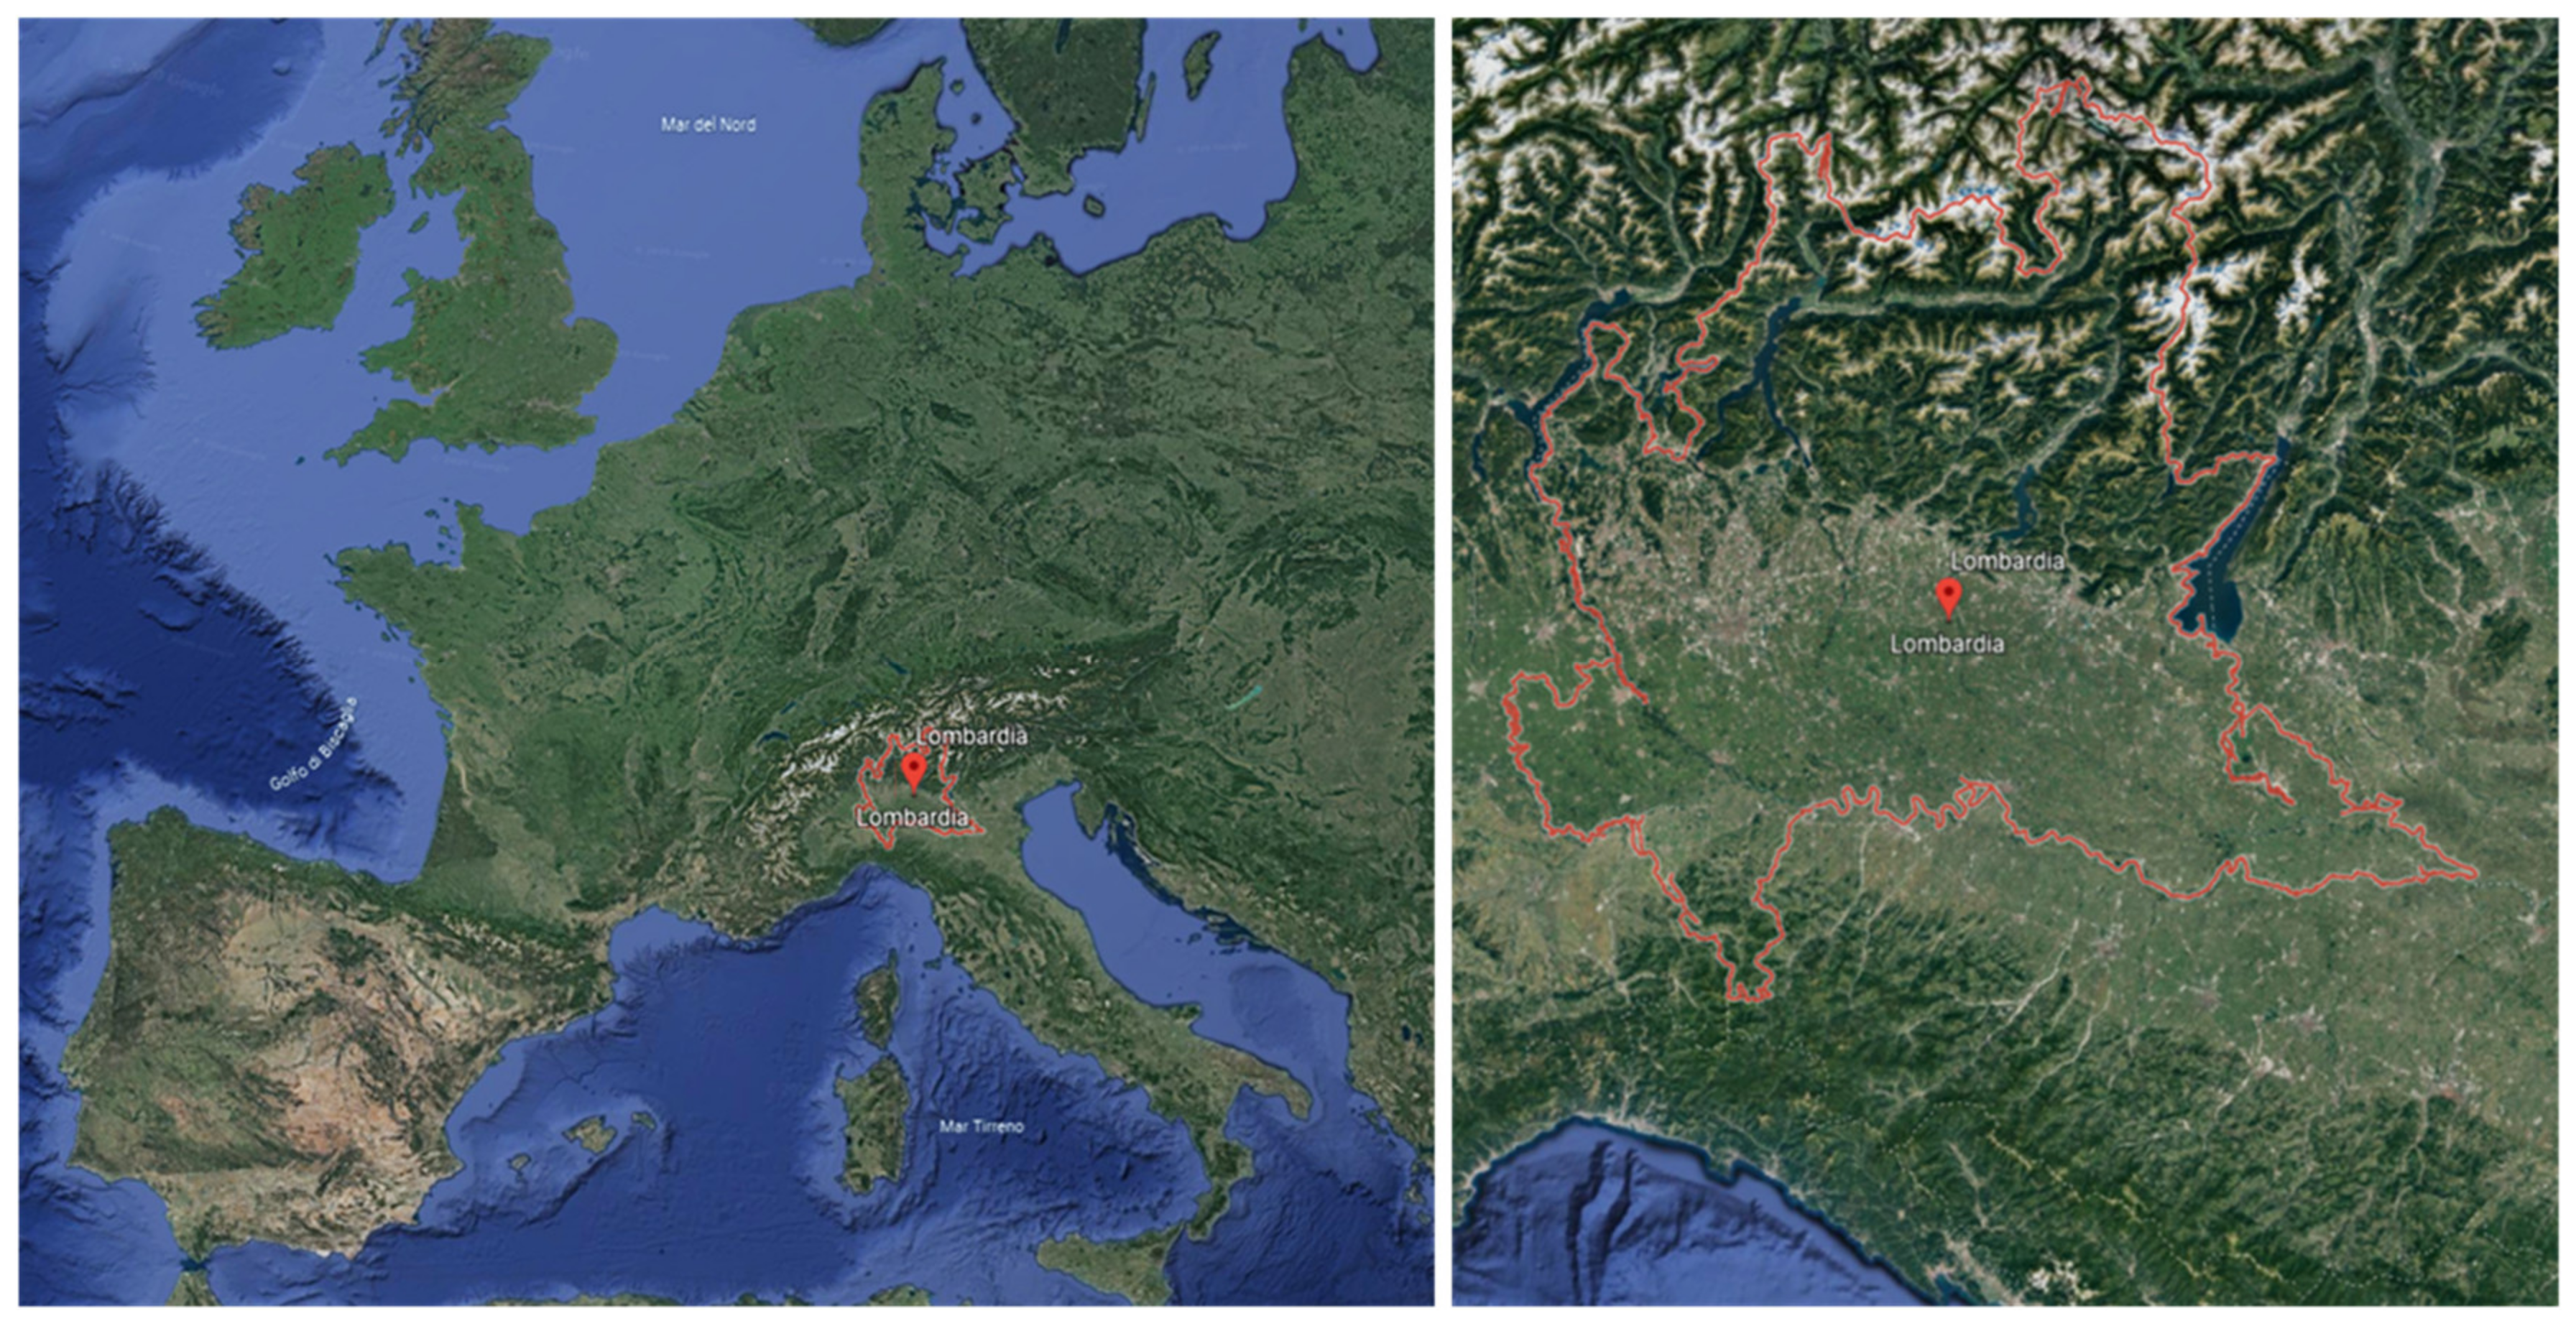
2.1. Case Study
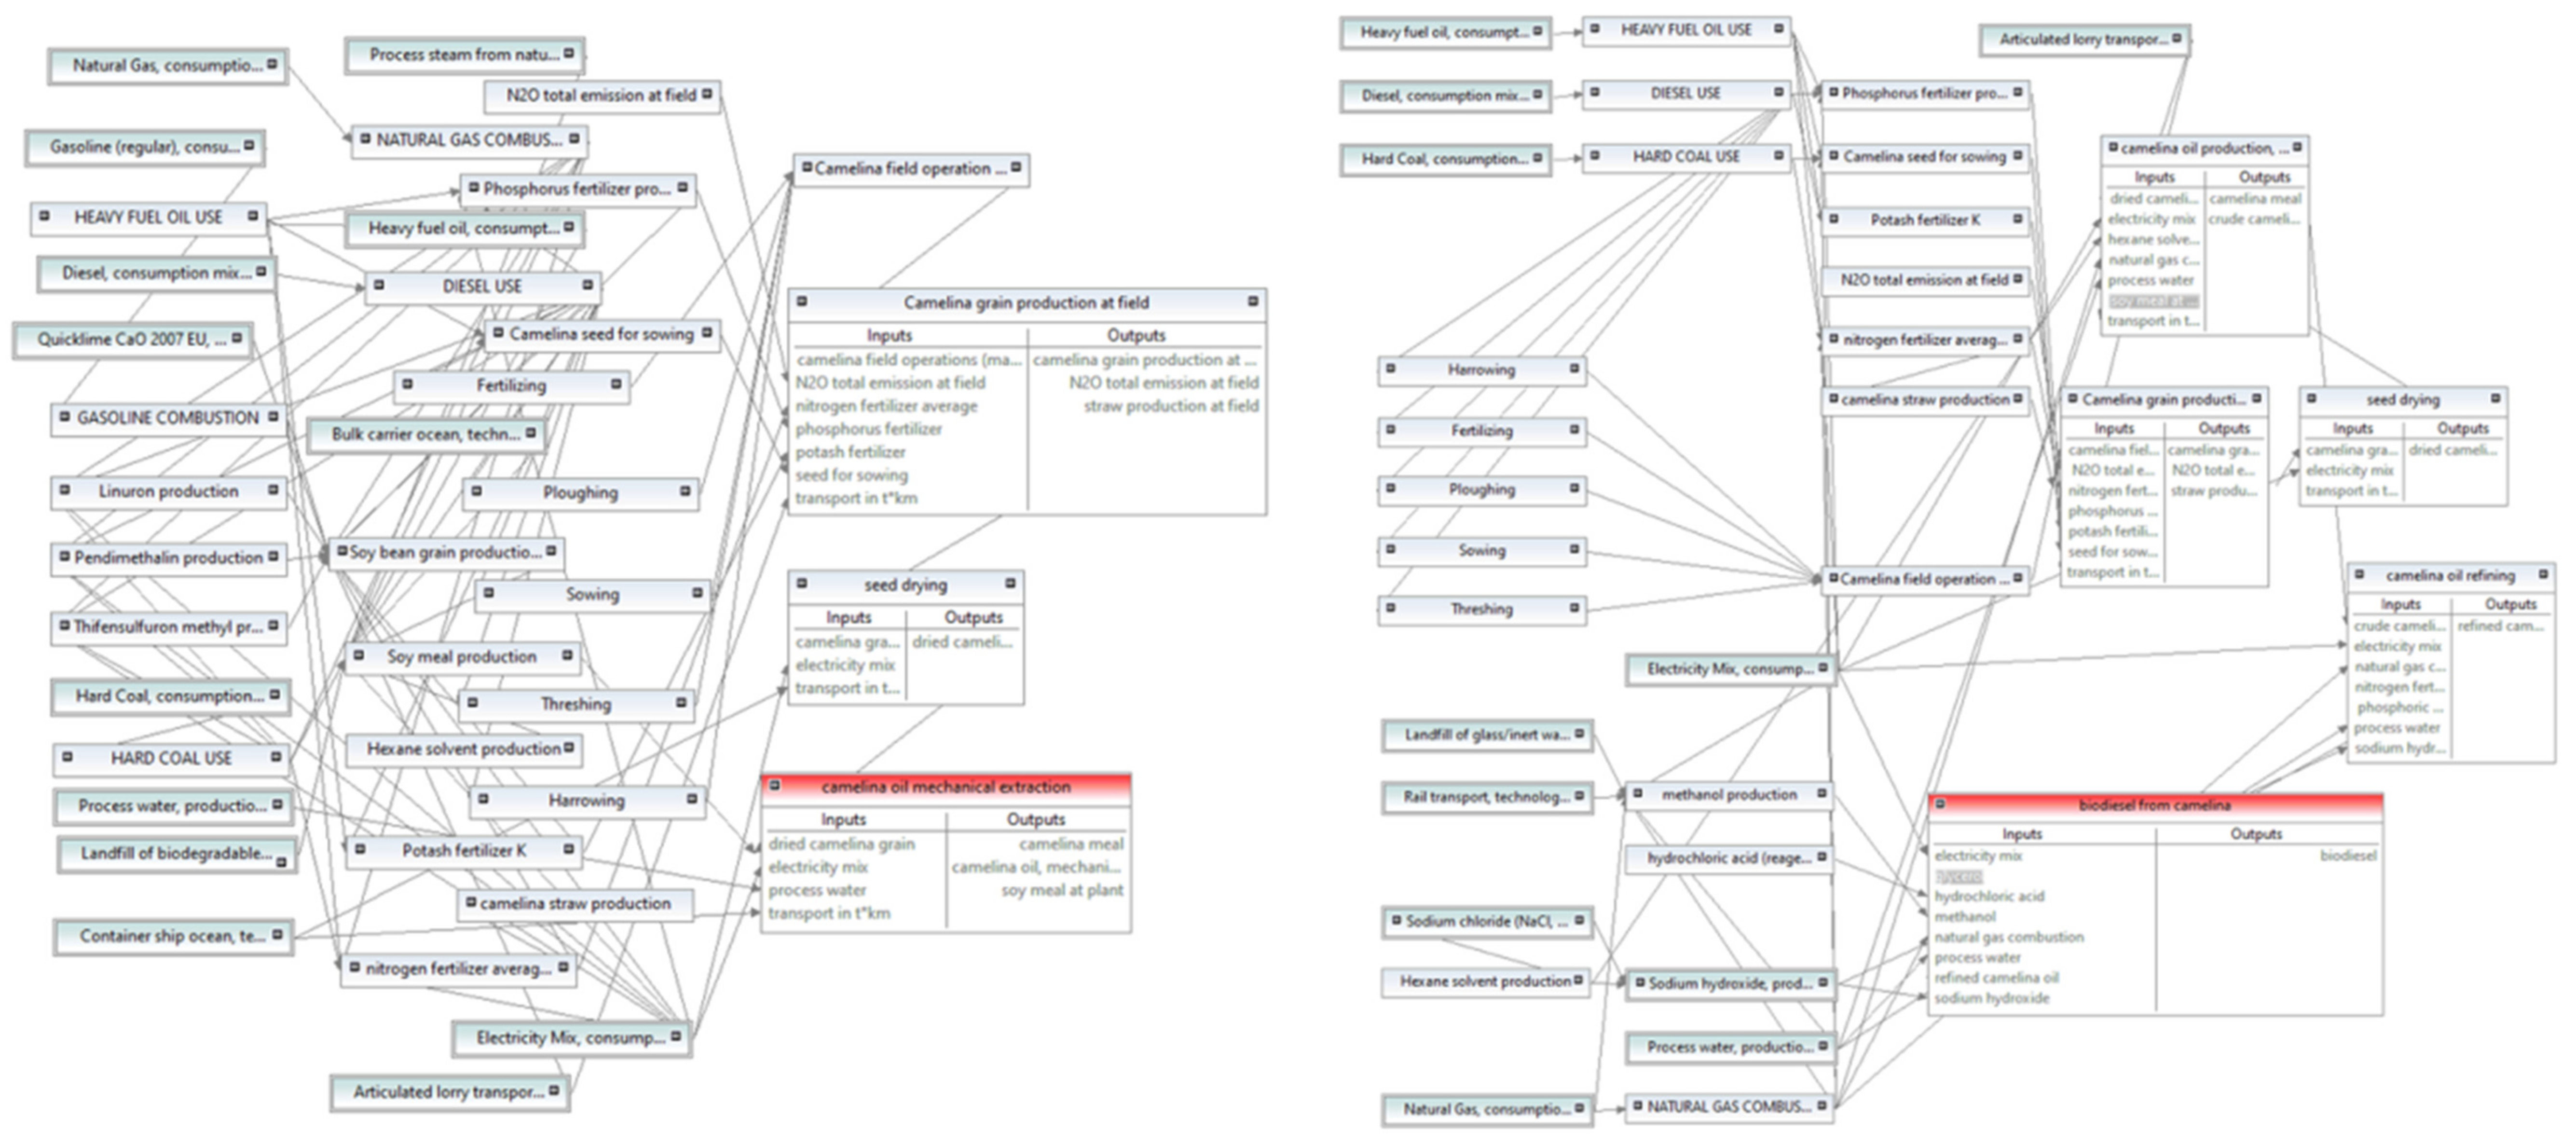
2.2. System Boundaries and Functional Unit
2.3. Primary Data and Indicators
- Data about camelina cultivation (rate of fertilizer, seed for sowing, grain yield, and oil and protein content of seed) were directly derived by camelina field trials performed in the region under study, whereas diesel input for machinery use was from Buratti et al. [21]; this agricultural stage is common to the two studied scenarios;
- Main processes for BD scenario are the oil extraction, oil refining, and transesterification. For these processes, data were taken from Buratti et al. [21], where actual values were from Italian operating biodiesel facilities;
- The main process for PVO scenario is the oil mechanical extraction. For this process data were taken from Esteban et al. [22], referring to conditions close to those under study (e.g., processing plants placed in Spain); data for seed drying were from the same source and also used for BD scenario;
- For electricity use, the Italian mix was always considered as structured in the ELCDIII [18]; the dataset represents the country/region specific situation, focusing on the main technologies, the region-specific characteristics, and import statistics;
- The ELCDIII database does not comprise inventories of fossil fuels use (e.g., natural gas, coal, or diesel combustion) stopping the related inventories at the stage of extraction/production; therefore, data on fuels use processes, comprehensive of transport, were derived from the CPM LCA Database and adjusted to the case study (transport) [19];
- Data about the following products are absent in the ELCDIII and were derived case by case as below specified: ammonia production (US NREL database); hydrochloric acid (US NREL database); methanol (US NREL database); nitric acid (CPM LCA Database); phosphoric acid (CPM LCA Database); and sulfuric acid (CPM LCA Database);
- Processes for soybean meal production, as well as glycerol production and the relative sub-processes used in the system expansion allocation were derived from the US NREL database, with the exception of pesticides production derived from Audsley et al. [23];
- Hexane is the main material input of oil solvent extraction process. Data for hexane are missing in the considered databases. Assuming the similarity of this substance with pentane, the relative complete production inventories data were taken from CPM LCA Database.
2.4. Insights on Computational Methods and Environmental Impact Assessment
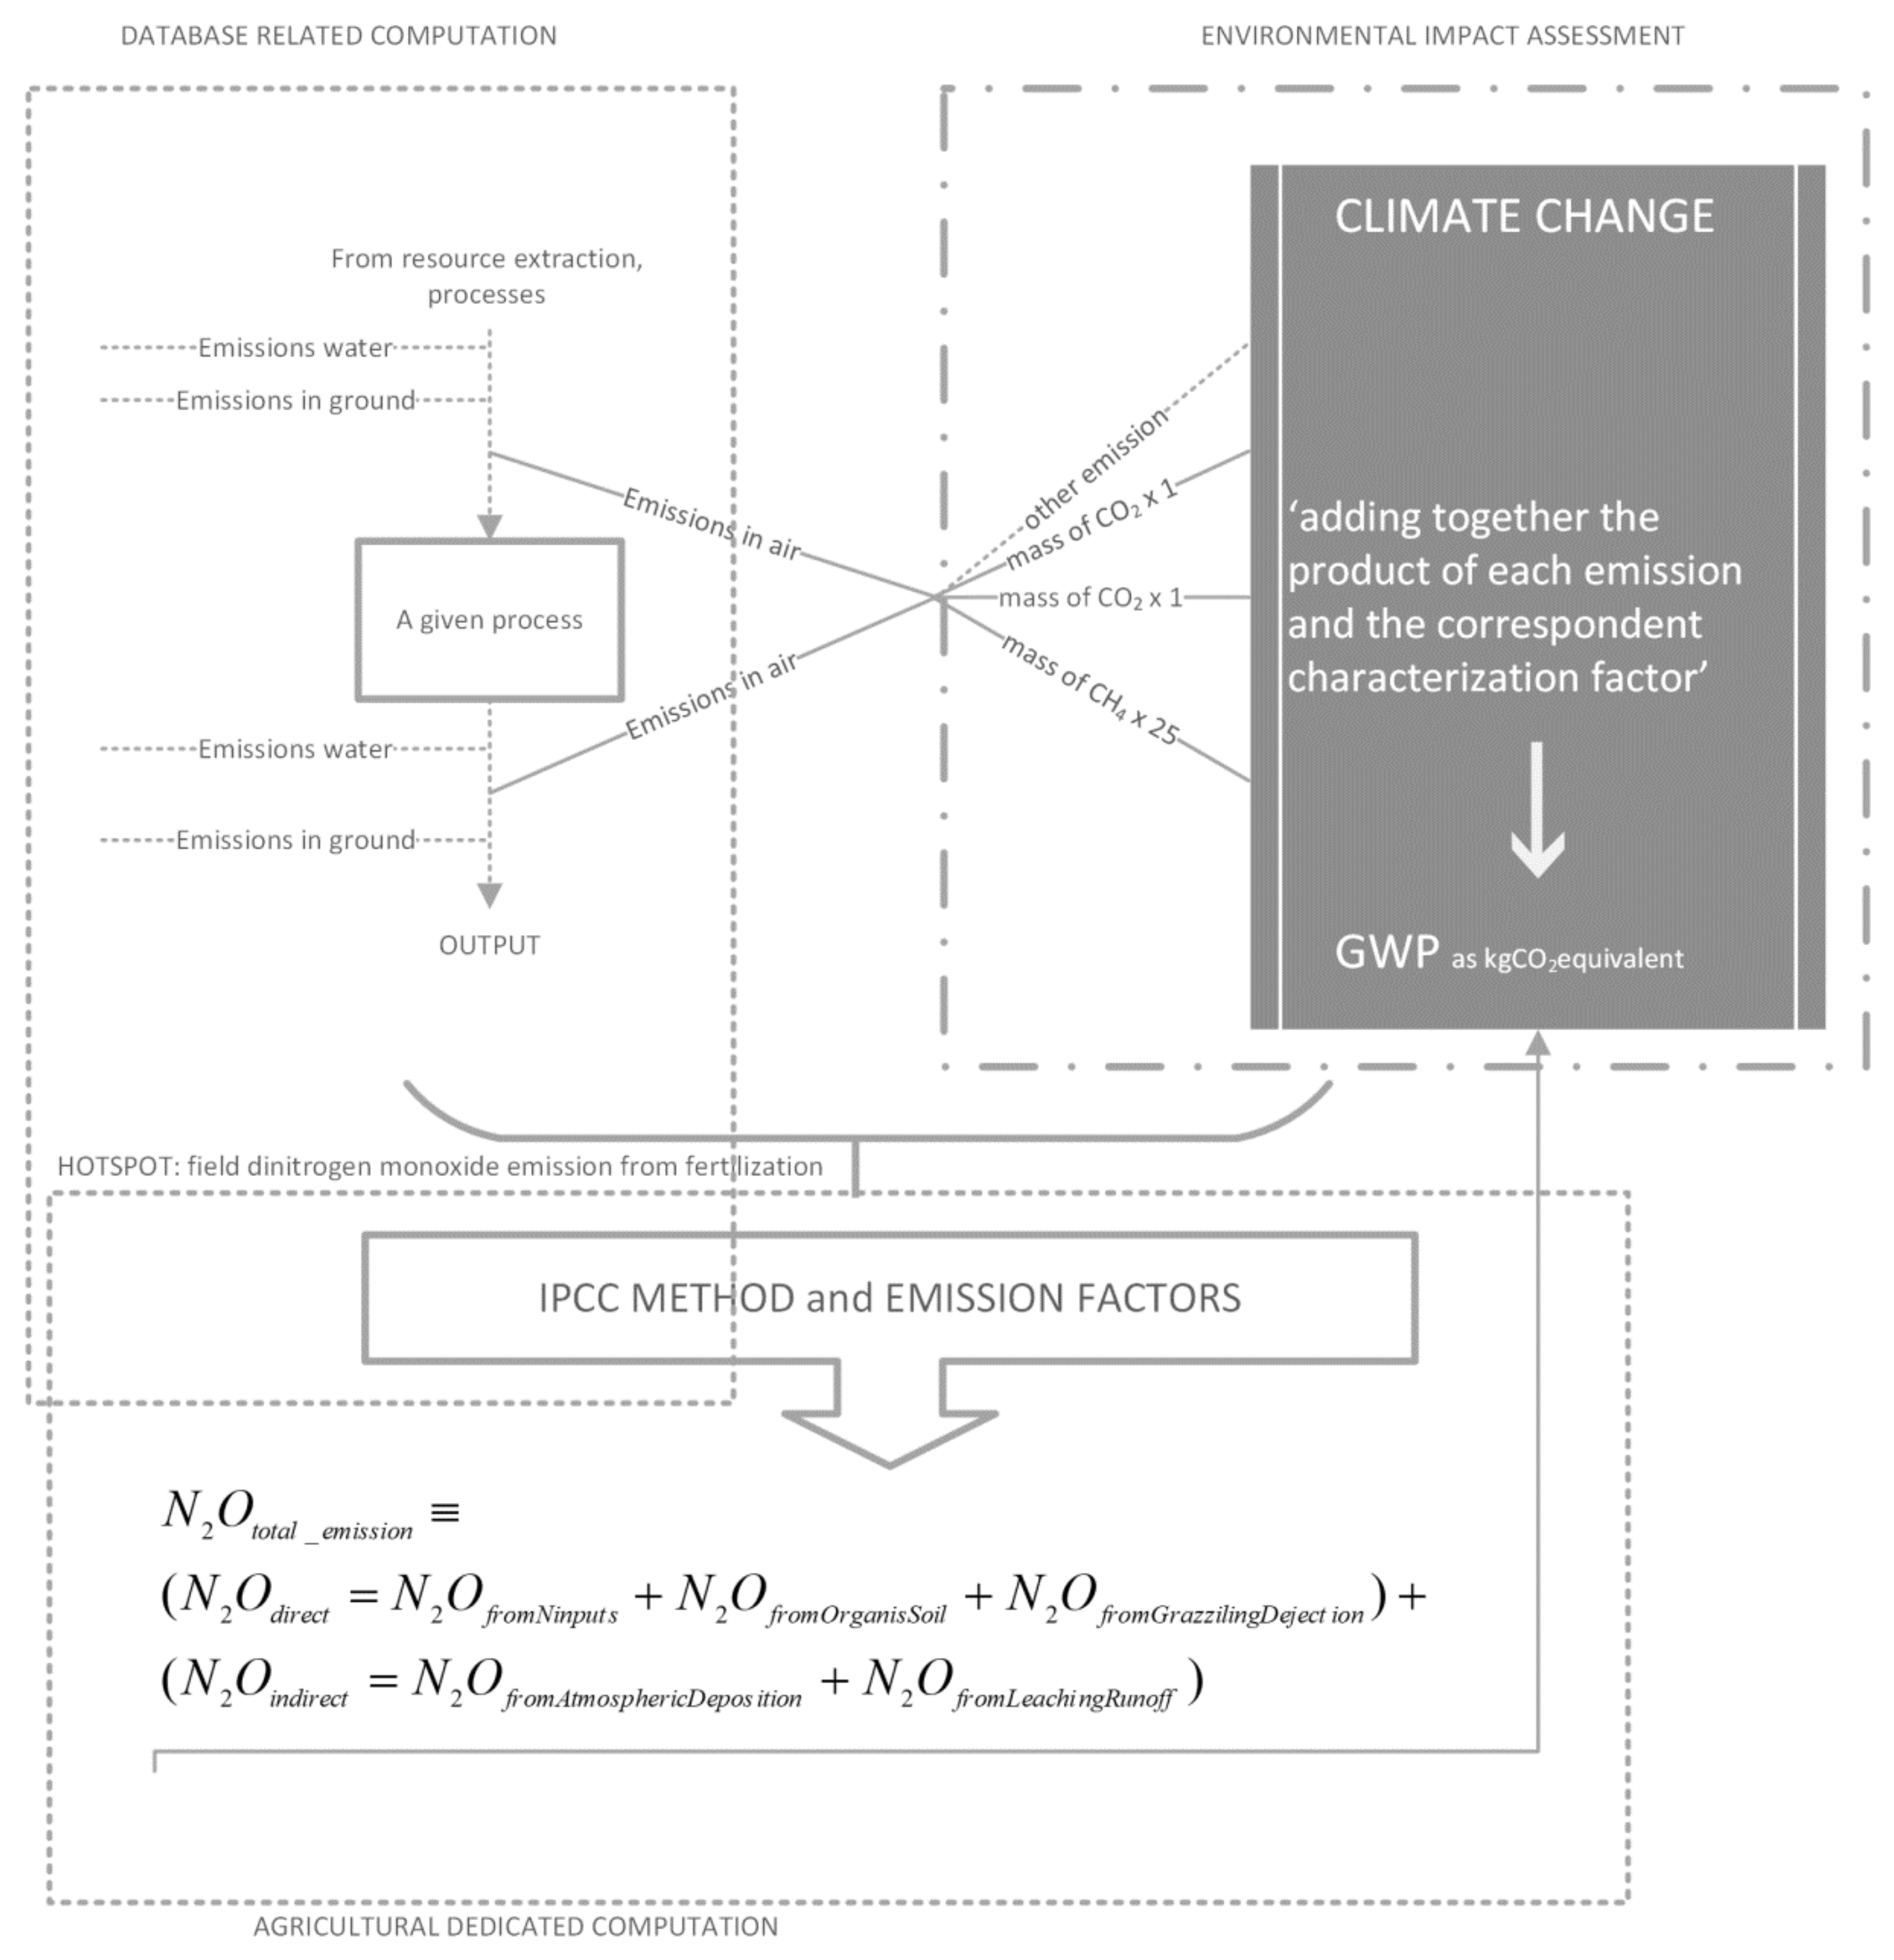
- Databases related computations, common to both the background system and part of the foreground system. In this case, the computation follows rules and procedures adopted in the specific database so that, process by process, the incoming (input) materials, energy and resources are quantified, as well as the out-coming (output) products, by-products, wastes, and emissions (in air, in water, in soil). Therefore, in this case, the so-called emission factors (i.e., rates of a given emission per unit of produced–used item) are precompiled in the database. As described above, the main data belonging to the ELCDIII database were used in the present study [18]. In a few cases, the database was integrated with external datasets as already reported.
- Agricultural dedicated computation. This set of computations depends on the evidence that agricultural activity implies the soil management, where a common issue is the addition of nitrogen (mineral or organic) to enhance its availability for the crops. This determines a boost of nitrification and denitrification rates, which then increase the production of N2O, an important greenhouse gas (GHG).
- N volatilization in the form of NH3 and oxides of N (NOx), and their deposition in soils and waters surfaces along with their products NH4+ and NO3−;
- Leaching and runoff of N: this potentially occurs from synthetic and organic fertilizer, crop residues, N mineralization due to land use change (loss of carbon), and dejection of grazing animals.
- Acidification;
- Climate change (100 years horizon);
- Freshwater (ecotoxicity and eutrophication);
- Human toxicity (carcinogenics and non-carcinogenics);
- Ionizing radiation (ecosystems and human health);
- Land use;
- Marine eutrophication;
- Ozone depletion;
- Particulate matter/Respiratory inorganics;
- Photochemical ozone formation;
- Resource depletion—mineral, fossils and renewables;
- Resource depletion—water;
- Terrestrial eutrophication.
- Non-renewable resources—fossil (hard coal, lignite, crude oil, natural gas, coal mining off-gas, peat, pit gas, methane, sulfur);
- Non-renewable resources—nuclear (uranium);
- Non-renewable resources—primary forest (wood and biomass from primary forests);
- Renewable resources—biomass (wood, food products, and biomass from agriculture, e.g., straw);
- Renewable resources—geothermal (geothermal energy);
- Renewable resources—solar (solar energy);
- Renewable resources—water (run-of-river hydro power, reservoir hydro power, and energy from waves);
- Renewable resources—wind (wind energy).
3. Results and Discussion
3.1. Inventory Analysis
3.2. Impact Assessment
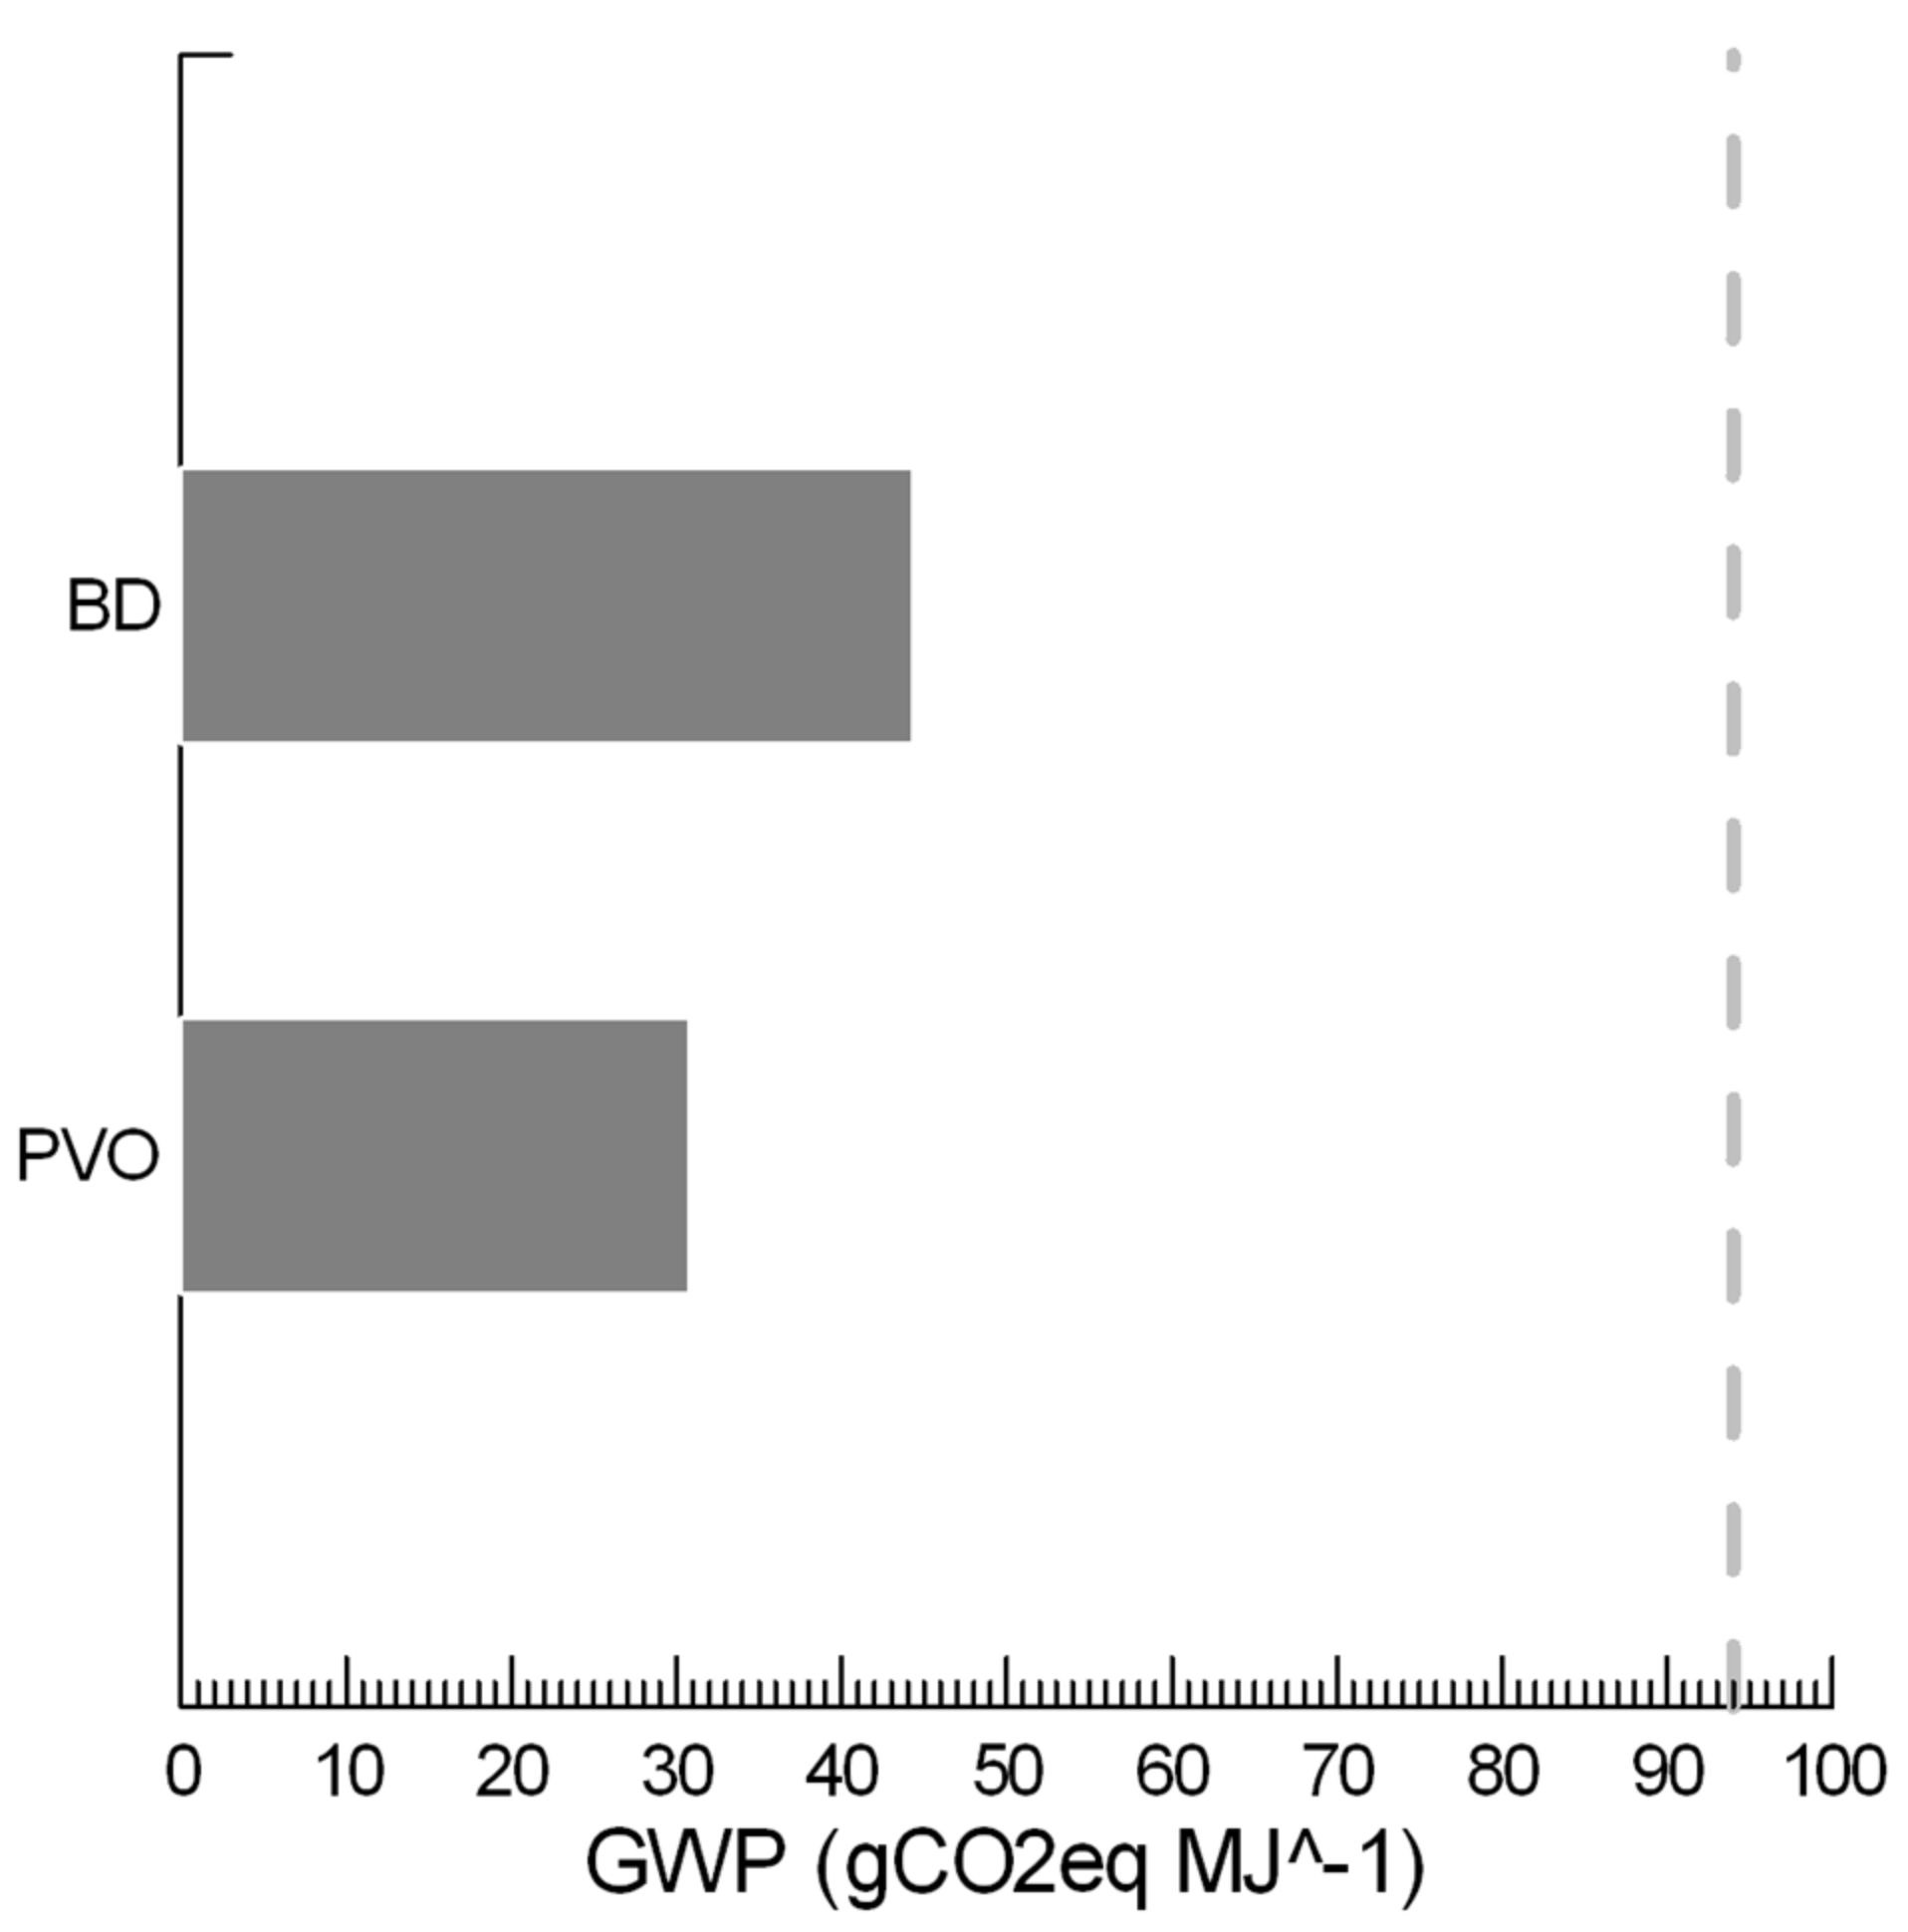
3.2.1. Global Warming Potential and Net Energy Ratio (for BD vs. PVO Based on Energy Allocation)
3.2.2. Uncertainty and Sensitivity
4. Conclusions
Author Contributions
Funding
Conflicts of Interest
References
- Allen, B.R.; Keegan, D.; Elbersen, B. Biomass and bioenergy in the wider land-use context of the European Union. Biofuels Bioprod. Bioref. 2013, 7, 207–216. [Google Scholar] [CrossRef]
- ISO. Environmental Management—Life Cycle Assessment—Principles and Frame Work; Norm ISO 14040:2006; International Organization for Standardization Publication: Geneva, Switzerland, 2006. [Google Scholar]
- Eynck, C.; Falk, K. Camelina (Camelina sativa). In Biofuel Crops: Production, Physiology and Genetics; Singh, B.P., Ed.; CAB International: Wallingford, UK, 2013; pp. 369–391. [Google Scholar]
- Martinez, S.; Alvarez, S.; Capuano, A.; del Mar Delgado, M. Environmental performance of animal feed production from Camelina sativa (L.) Crantz: Influence of crop management practices under Mediterranean conditions. Agric. Syst. 2020, 177, 102717. [Google Scholar] [CrossRef]
- Krzyżaniak, M.; Stolarski, M.J. Life cycle assessment of camelina and crambe production for biorefinery and energy purposes. J. Clean. Prod. 2019, 237, 117755. [Google Scholar] [CrossRef]
- Tabatabaie, S.M.H.; Tahami, H.; Murthy, G.S. A regional life cycle assessment and economic analysis of camelina biodiesel production in the Pacific Northwestern US. J. Clean. Prod. 2018, 172, 2389–2400. [Google Scholar] [CrossRef]
- Bacenetti, J.; Restuccia, A.; Schillaci, G.; Fiala, M.; Failla, S. Life cycle assessment of flax and camelina for biodiesel production in Sicily (Southern Italy). Chem. Eng. Trans. 2017, 58, 481–486. [Google Scholar]
- Berti, M.; Johnson, B.; Ripplinger, D.; Gesch, R.; Aponte, A. Environmental impact assessment of double- and relay-cropping with winter camelina in the northern Great Plains, USA. Agric. Syst. 2017, 156, 1–12. [Google Scholar] [CrossRef]
- Moeller, D.; Sieverding, H.L.; Stone, J.J. Comparative farm-gate life cycle assessment of oilseed feedstocks in the Northern Great Plains. Biophys. Econ. Resour. Qual. 2017, 2, 13. [Google Scholar] [CrossRef]
- Dangol, N.; Shrestha, D.S.; Duffield, J.A. Life cycle analysis and production potential of camelina biodiesel in the Pacific Northwest. Trans. ASABE 2015, 58, 465–475. [Google Scholar]
- Keshavarz-Afshar, R.; Mohammed, Y.A.; Chen, C. Energy balance and greenhouse gas emissions of dryland camelina as influenced by tillage and nitrogen. Energy 2015, 91, 1057–1063. [Google Scholar] [CrossRef]
- Masella, P.; Martinelli, T.; Galasso, I. Agronomic evaluation and phenotypic plasticity of Camelina sativa growing in Lombardia, Italy. Crop Pasture Sci. 2014, 65, 453–460. [Google Scholar] [CrossRef]
- Pecchia, P.; Russo, R.; Brambilla, I.; Reggiani, R.; Mapelli, S. Biochemical Seed Traits of Camelina sativa—An Emerging Oilseed Crop for Biofuel: Environmental and Genetic Influences. J. Crop Improv. 2014, 28, 465–483. [Google Scholar] [CrossRef]
- Colombini, S.; Broderick, G.A.; Galasso, I.; Martinelli, T.; Rapetti, L.; Russo, R.; Reggiani, R. Evaluation of Camelina sativa (L.) Crantz meal as an alternative protein source in ruminant rations. J. Sci. Food Agric. 2014, 94, 736–743. [Google Scholar] [CrossRef] [PubMed]
- Miller, P.; Kumar, A. Development of emission parameters and net energy ratio for renewable diesel from Canola and Camelina. Energy 2013, 58, 426–437. [Google Scholar] [CrossRef]
- Krohn, B.J.; Fripp, M. A life cycle assessment of biodiesel derived from the “niche filling” energy crop camelina in the USA. Appl. Energy 2012, 92, 92–98. [Google Scholar] [CrossRef]
- Paulsen, H.M.; Wichmann, V.; Schuemann, U.; Richter, B. Use of straight vegetable oil mixtures of rape and camelina as on farm fuels in agriculture. Biomass Bioenergy 2011, 35, 4015–4024. [Google Scholar] [CrossRef]
- Joint Research Center. European reference Life Cycle Database, ELCDIII database, v.3.2. 2015. Available online: https://nexus.openlca.org/database/ELCD (accessed on 15 March 2019).
- Swedish Life Cycle Center. CPM LCA Database. 2018. Available online: http://cpmdatabase.cpm.chalmers.se/Start.asp (accessed on 15 March 2019).
- Federal LCA Commons. US NREL Database. 2018. Available online: https://uslci.lcacommons.gov/uslci/search (accessed on 15 March 2019).
- Buratti, C.; Barbanera, M.; Fantozzi, F. A comparison of the European renewable energy directive default emission values with actual values from operating biodiesel facilities for sunflower, rape and soya oil seeds in Italy. Biomass Bioenergy 2012, 47, 26–36. [Google Scholar] [CrossRef]
- Esteban, B.; Baquero, G.; Puig, R.; Riba, J.R.; Rius, A. Is it environmentally advantageous to use vegetable oil directly as biofuel instead of converting it to biodiesel? Biomass Bioenergy 2011, 35, 1317–1328. [Google Scholar] [CrossRef]
- Audsley, E.; Alber, S.; Clift, R.; Cowell, S.; Cretta, P.; Gaillard, G.; Hausheer, J.; Jolliet, O.; Kleijn, R.; Mortensen, B.; et al. Harmonisation of Environmental Life Cycle Assessment for Agriculture; Final Reportconcerted Action AIR3-CT94-2028; European Commission DG VI: Brussels, Belgium, 1997. [Google Scholar]
- IPCC. IPCC Guidelines for National Greenhouse Gas Inventories, Prepared by the National Greenhouse Gas Inventories Programme; Eggleston, H.S., Buendia, L., Miwa, K., Ngara, T., Tanabe, K., Eds.; IGES: Kanagawa, Japan, 2006. [Google Scholar]
- European Commission-Joint Research Centre—Institute for Environment and Sustainability. International Reference Life Cycle Data System (ILCD) Handbook- Recommendations for Life Cycle Impact Assessment in the European context, 1st ed.; EUR 24571 EN; Publications Office of the European Union: Luxemburg, 2011. [Google Scholar]
- Directive 2009/28/EC of the European Parliament and of the Council of 23 April 2009 on the Promotion of the Use of Energy from Renewable Sources and Amending and Subsequently Repealing Directives 2001/77/EC and 2003/30/EC. 2009. Available online: https://eur-lex.europa.eu/LexUriServ/LexUriServ.do?uri=OJ:L:2009:140:0016:0062:en:PDF (accessed on 15 March 2019).
- Shonnard, D.R.; Williams, L.; Kalnes, T.N. Camelina-derived jet fuel and diesel: Sustainable advanced biofuels. Environ. Prog. Sustain. 2010, 29, 382–392. [Google Scholar] [CrossRef]
- Li, X.; Mupondwa, E. Life cycle assessment of camelina oil derived biodiesel and jet fuel in the Canadian Prairies. Sci. Total Environ. 2014, 481, 17–26. [Google Scholar] [CrossRef]
- Özdemir, E.D.; Härdtlein, M.; Eltrop, L. Land substitution effects of biofuel side products and implications on the land area requirement for EU 2020 biofuel targets. Energy Policy 2009, 37, 2986–2996. [Google Scholar] [CrossRef]
| Reference | Year | Location | Assessed Product | Main Indicator # | Range |
|---|---|---|---|---|---|
| Martinez et al. [4] | 2020 | Spain | grain | GWP | 0.530–1.470 kgCO2eq kg−1 |
| Krzyzaniak et al. [5] | 2019 | Poland | grain | GWP | 1.152–1.528 kgCO2eq kg−1 |
| Tabataie et al. [6] | 2018 | USA | biodiesel | GWP | 56.0–60.0 gCO2eq MJ−1 |
| Bacenetti et al. [7] | 2017 | Italy | biodiesel | GWP | 0.150 kgCO2eq MJ−1 |
| Berti et al. [8] | 2017 | USA | grain | GWP | 0.53–0.84 kgCO2eq kg−1 |
| Moeller at al. [9] | 2017 | USA | grain | GWP/NER | 0.451 kgCO2eq kg−1—3.91–4.12 MJ MJ−1 |
| Dangol et al. [10] | 2015 | USA | biodiesel | GWP/NER | 25.0 gCO2eq MJ−1—3.6 MJ MJ−1 |
| Keshavarz-Afshar et al. [11] | 2015 | USA | grain | GWP/NER | 0.134 kgCO2eq kg−1—3.7–10.4 MJ MJ−1 |
| Product | LHV # (MJ kg−1) | Energy Allocation | Mass Allocation | |
|---|---|---|---|---|
| BD # scenario | biodiesel | 37.2 | 0.95 | 0.90 |
| glycerol | 16.6 | 0.05 | 0.10 | |
| camelina oil | 37.2 | 0.56 | 0.28 | |
| meal | 11.3 | 0.44 | 0.72 | |
| PVO # scenario | pure camelina oil | 37.2 | 0.34 | 0.21 |
| meal | 11.3 | 0.66 | 0.79 |
| Statistics | Grain Yield (kg ha−1 at 9% Seed Moisture) | Seed Oil Content (% w w−1 Dry Matter) | Meal Protein Content (% w w−1 Dry Matter) |
|---|---|---|---|
| Number of Cases | 84 | 84 | 84 |
| Minimum | 133 | 21 | 242 |
| Maximum | 3945 | 37 | 407 |
| Range | 3812 | 16 | 165 |
| Median | 1262 | 32 | 339 |
| Arithmetic Mean | 1361 | 32 | 341 |
| Standard Error | 93.2 | 0.3 | 3.6 |
| 95.0% Lower Confidence Limit | 1175.2 | 31.5 | 334.2 |
| 95.0% Upper Confidence Limit | 1546.0 | 32.6 | 348.5 |
| Standard Deviation | 854.5 | 2.6 | 32.8 |
| Coefficient of Variation | 0.63 | 0.08 | 0.10 |
| Flows | Unit | Amount | Flows | Unit | Amount |
|---|---|---|---|---|---|
| Inputs | emission in water | ||||
| camelina field operations (machinery) | MJ | 2.29 | Chlorides, unspecified | kg | 5.18 × 10⁻³ |
| nitrogen fertilizer average | kg | 6.20 × 10⁻² | Particulates, >10 um | kg | 4.53 × 10⁻⁴ |
| land occupation, arable | m2 a | 3.13 | Sodium, ion | kg | 1.81 × 10⁻⁴ |
| phosphorus fertilizer | kg | 7.80 × 10⁻² | Carbonate | kg | 5.88 × 10⁻⁵ |
| potash fertilizer | kg | 7.10 × 10⁻² | Sulfate | kg | 7.31 × 10⁻⁵ |
| seed for sowing | kg | 5.39 × 10⁻³ | COD, Chemical Oxygen Demand | kg | 1.69 × 10⁻⁵ |
| Outputs | Oils, unspecified | kg | 1.06 × 10⁻⁵ | ||
| camelina grain production at field | kg | 1.00 | Sulfide | kg | 9.70 × 10⁻⁶ |
| straw | kg | 3.00 | TOC, Total Organic Carbon | kg | 2.20 × 10⁻⁶ |
| emission in air | Decane | kg | 1.60 × 10⁻⁶ | ||
| Carbon dioxide, fossil | kg | 4.89 × 10⁻¹ | emission in soil | ||
| Nitrogen oxides | kg | 4.05 × 10⁻³ | Ammonia | kg | 7.21 × 10⁻⁶ |
| Sulfur dioxide | kg | 1.52 × 10⁻³ | Strontium | kg | 4.56 × 10⁻⁶ |
| Carbon monoxide, fossil | kg | 8.67 × 10⁻⁴ | Phosphate | kg | 4.13 × 10⁻⁶ |
| Methane | kg | 7.55 × 10⁻⁴ | Chloride | kg | 2.48 × 10⁻⁶ |
| Hydrocarbons, unspecified | kg | 5.09 × 10⁻⁴ | Potassium | kg | 1.79 × 10⁻⁶ |
| Particulates, unspecified | kg | 3.16 × 10⁻⁴ | Sulfide | kg | 1.37 × 10⁻⁶ |
| Dinitrogen monoxide | kg | 2.95 × 10⁻⁴ | Sulfate | kg | 2.28 × 10⁻⁷ |
| Fluoride | kg | 7.08 × 10⁻⁸ | |||
| Iron | kg | 2.03 × 10⁻⁸ | |||
| Aluminium | kg | 1.56 × 10⁻⁸ | |||
| Chromium | kg | 1.39 × 10⁻⁸ |
| Flows | Process | Quantitative Reference | Unit | Amount |
|---|---|---|---|---|
| Inputs | ||||
| grain production | seed drying | per 1 kg of dried grain | kg | 1.04 |
| electricity mix | seed drying | per 1 kg of dried grain | MJ | 3.18 × 10⁻¹ |
| transport | seed drying | per 1 kg of dried grain | t * km | 2.07 × 10⁻¹ |
| dried grain | oil solvent extraction | per 1 kg of crude oil | kg | 3.57 |
| electricity mix | oil solvent extraction | per 1 kg of crude oil | MJ | 6.45 × 10⁻¹ |
| hexane solvent | oil solvent extraction | per 1 kg of crude oil | kg | 1.86 × 10⁻³ |
| natural gas combustion | oil solvent extraction | per 1 kg of crude oil | MJ | 2.21 |
| Clay, bentonite, in ground | oil refining | per 1 kg of refined oil | kg | 1.07 × 10⁻² |
| crude oil | oil refining | per 1 kg of refined oil | kg | 1.02 |
| electricity mix | oil refining | per 1 kg of refined oil | MJ | 5.52 × 10⁻² |
| natural gas combustion | oil refining | per 1 kg of refined oil | MJ | 7.22 × 10⁻¹ |
| phosphoric acid | oil refining | per 1 kg of refined oil | kg | 1.16 × 10⁻³ |
| sodium hydroxide | oil refining | per 1 kg of refined oil | kg | 6.98 × 10⁻³ |
| electricity mix | oil transesterification | per 1 kg of biodiesel | MJ | 3.68 × 10⁻² |
| hydrochloric acid | oil transesterification | per 1 kg of biodiesel | kg | 1.02 × 10⁻² |
| methanol | oil transesterification | per 1 kg of biodiesel | kg | 1.11 × 10⁻¹ |
| natural gas combustion | oil transesterification | per 1 kg of biodiesel | MJ | 7.70 × 10⁻¹ |
| process water | oil transesterification | per 1 kg of biodiesel | kg | 3.90 × 10⁻¹ |
| refined camelina oil | oil transesterification | per 1 kg of biodiesel | kg | 1.02 |
| sodium hydroxide | oil transesterification | per 1 kg of biodiesel | kg | 1.06 × 10⁻³ |
| Outputs | ||||
| camelina meal | oil solvent extraction | per 1 kg of crude oil | kg | 2.57 |
| glycerol | oil transesterification | per 1 kg of biodiesel | kg | 1.07 × 10⁻¹ |
| Flows | Unit | Amount | Flows | Unit | Amount |
|---|---|---|---|---|---|
| emission in air | emission in water | ||||
| Carbon dioxide, fossil | kg | 6.50 × 10⁻¹ | Chloride | kg | 1.58 × 10⁻³ |
| Methane | kg | 1.92 × 10⁻³ | Particulates, >10 um | kg | 6.47 × 10⁻⁴ |
| Sulfur dioxide | kg | 1.48 × 10⁻³ | COD, Chemical Oxygen Demand | kg | 9.93 × 10⁻⁵ |
| Nitrogen dioxide | kg | 1.04 × 10⁻³ | Calcium | kg | 2.07 × 10⁻⁵ |
| Nitrogen oxides | kg | 5.59 × 10⁻⁴ | Carbonate | kg | 1.99 × 10⁻⁵ |
| Carbon monoxide | kg | 2.72 × 10⁻⁴ | Iron | kg | 1.03 × 10⁻⁵ |
| emission in soil | Sulfate | kg | 8.75 × 10⁻⁶ | ||
| Ammonia | kg | 1.47 × 10⁻⁵ | Sodium | kg | 4.32 × 10⁻⁶ |
| Strontium | kg | 9.298 × 10⁻⁶ | Fluoride | kg | 3.97 × 10⁻⁶ |
| Phosphate | kg | 8.436 × 10⁻⁶ | TOC, Total Organic Carbon | kg | 3.57 × 10⁻⁶ |
| Chloride | kg | 5.044 × 10⁻⁶ | Sulfide | kg | 4.68 × 10⁻⁶ |
| Potassium | kg | 3.7 × 10⁻⁶ | Ammonia | kg | 1.47 × 10⁻⁶ |
| Sulfide | kg | 2.836 × 10⁻⁶ | BOD5, Biological Oxygen Demand | kg | 1.36 × 10⁻⁶ |
| Sulfate | kg | 4.727 × 10⁻⁷ | Chlorine | kg | 1.21 × 10⁻⁶ |
| Calcium | kg | 3.453 × 10⁻⁷ | Nitrate | kg | 1.06 × 10⁻⁶ |
| Sodium | kg | 1.533 × 10⁻⁷ | Aluminium | kg | 8.79 × 10⁻⁷ |
| Fluoride | kg | 1.437 × 10⁻⁷ | |||
| Decane | kg | 6.169 × 10⁻⁸ | |||
| Magnesium | kg | 5.03 × 10⁻⁸ | |||
| Iron | kg | 4.128 × 10⁻⁸ | |||
| Aluminium | kg | 3.25 × 10⁻⁸ | |||
| Chromium | kg | 2.858 × 10⁻⁸ |
| Flows | Process | Quantitative Reference | Unit | Amount |
|---|---|---|---|---|
| Inputs | ||||
| grain production | seed drying | per 1 kg of dried grain | kg | 1.04 |
| electricity mix | seed drying | per 1 kg of dried grain | MJ | 3.18 × 10⁻¹ |
| dried camelina grain | oil mechanical extraction | per 1 kg of pure vegetable oil | kg | 4.84 |
| electricity mix | oil mechanical extraction | per 1 kg of pure vegetable oil | MJ | 3.30 × 10⁻¹ |
| process water | oil mechanical extraction | per 1 kg of pure vegetable oil | kg | 2.00 × 10⁻² |
| transport in t × km | oil mechanical extraction | per 1 kg of pure vegetable oil | t * km | 2.42 × 10⁻¹ |
| Outputs | ||||
| camelina meal | oil mechanical extraction | per 1 kg of pure vegetable oil | kg | 3.84 |
| Flows | Unit | Amount | Flows | Unit | Amount |
|---|---|---|---|---|---|
| emission in air | emission in soil | ||||
| Carbon dioxide | kg | 3.93 × 10⁻¹ | Ammonia | kg | 5.54 × 10⁻⁶ |
| Sulfur dioxide | kg | 1.38 × 10⁻³ | Strontium | kg | 3.49 × 10⁻⁶ |
| Nitrogen dioxide | kg | 1.08 × 10⁻³ | Phosphate | kg | 3.16 × 10⁻⁶ |
| Methane | kg | 7.99 × 10⁻⁴ | Chloride | kg | 1.92 × 10⁻⁶ |
| Carbon monoxide | kg | 2.25 × 10⁻⁴ | Potassium | kg | 1.45 × 10⁻⁶ |
| emission in water | Sulfide | kg | 1.11 × 10⁻⁶ | ||
| Chloride | kg | 1.45 × 10⁻³ | Calcium | kg | 2.40 × 10⁻⁷ |
| Particulates, >10 um | kg | 3.74 × 10⁻⁴ | Sulfate | kg | 1.86 × 10⁻⁷ |
| Sulfate | kg | 9.59 × 10⁻⁵ | Decane | kg | 5.79 × 10⁻⁸ |
| COD, Chemical Oxygen Demand | kg | 6.54 × 10⁻⁵ | Fluoride | kg | 5.46 × 10⁻⁸ |
| Sodium | kg | 4.11 × 10⁻⁵ | Magnesium | kg | 3.31 × 10⁻⁸ |
| Carbonate | kg | 2.81 × 10⁻⁵ | Sodium | kg | 2.10 × 10⁻⁸ |
| Iron | kg | 8.84 × 10⁻⁶ | Iron | kg | 1.58 × 10⁻⁸ |
| Sulfide | kg | 5.13 × 10⁻⁶ | Aluminium | kg | 1.29 × 10⁻⁸ |
| Calcium | kg | 3.15 × 10⁻⁶ | Chromium | kg | 1.11 × 10⁻⁸ |
| Fluoride | kg | 2.26 × 10⁻⁶ | |||
| TOC, Total Organic Carbon | kg | 1.66 × 10⁻⁶ | |||
| Chlorine | kg | 1.14 × 10⁻⁶ | |||
| Ammonia | kg | 9.08 × 10⁻⁷ |
| Impact Category | Reference Unit | PVO | BD |
|---|---|---|---|
| Acidification | Mole H+ eq. | 2.51 × 10⁻⁴ | 3.26 × 10⁻⁴ |
| Freshwater ecotoxicity | CTUe | 3.09 × 10⁻³ | 4.01 × 10⁻³ |
| Freshwater eutrophication | kg P eq. | 7.64 × 10⁻⁸ | 1.36 × 10⁻⁷ |
| Human toxicity—carcinogenics | CTUh | 1.78 × 10⁻¹¹ | 3.33 × 10⁻¹¹ |
| Human toxicity—non-carcinogenics | CTUh | 1.21 × 10⁻¹⁰ | 1.86 × 10⁻¹⁰ |
| Ionizing radiation—ecosystems | CTUe | 2.99 × 10⁻⁹ | 4.76 × 10⁻⁹ |
| Ionizing radiaton—human health | kg U235 eq. | 3.02 × 10⁻⁴ | 4.81 × 10⁻⁴ |
| Land use | kg SOC | 1.40 | 1.67 |
| Marine eutrophication | kg N eq. | 7.49 × 10⁻⁵ | 9.69 × 10⁻⁵ |
| Ozone depletion | kg CFC-11 eq. | 2.45 × 10⁻¹⁰ | 3.91 × 10⁻¹⁰ |
| Particulate matter/Respiratory inorganics | kg PM2.5 eq. | 6.86 × 10⁻⁶ | 8.89 × 10⁻⁶ |
| Photochemical ozone formation | kg C2H4 eq. | 2.08 × 10⁻⁴ | 2.69 × 10⁻⁴ |
| Resource depletion—mineral, fossils and renewables | kg Sb eq. | 9.16 × 10⁻⁹ | 1.73 × 10⁻⁸ |
| Resource depletion—water | m3 | −3.48 × 10⁻⁶ | −5.69 × 10⁻⁶ |
| Terrestrial eutrophication | mole N eq. | 8.20 × 10⁻⁴ | 1.06 × 10⁻³ |
Publisher’s Note: MDPI stays neutral with regard to jurisdictional claims in published maps and institutional affiliations. |
© 2020 by the authors. Licensee MDPI, Basel, Switzerland. This article is an open access article distributed under the terms and conditions of the Creative Commons Attribution (CC BY) license (http://creativecommons.org/licenses/by/4.0/).
Share and Cite
Masella, P.; Galasso, I. A Comparative Cradle-to-Gate Life Cycle Study of Bio-Energy Feedstock from Camelina sativa, an Italian Case Study. Sustainability 2020, 12, 9590. https://doi.org/10.3390/su12229590
Masella P, Galasso I. A Comparative Cradle-to-Gate Life Cycle Study of Bio-Energy Feedstock from Camelina sativa, an Italian Case Study. Sustainability. 2020; 12(22):9590. https://doi.org/10.3390/su12229590
Chicago/Turabian StyleMasella, Piernicola, and Incoronata Galasso. 2020. "A Comparative Cradle-to-Gate Life Cycle Study of Bio-Energy Feedstock from Camelina sativa, an Italian Case Study" Sustainability 12, no. 22: 9590. https://doi.org/10.3390/su12229590
APA StyleMasella, P., & Galasso, I. (2020). A Comparative Cradle-to-Gate Life Cycle Study of Bio-Energy Feedstock from Camelina sativa, an Italian Case Study. Sustainability, 12(22), 9590. https://doi.org/10.3390/su12229590


