Remote Sensing and Modelling Based Framework for Valuing Irrigation System Efficiency and Steering Indicators of Consumptive Water Use in an Irrigated Region


Abstract
1. Introduction
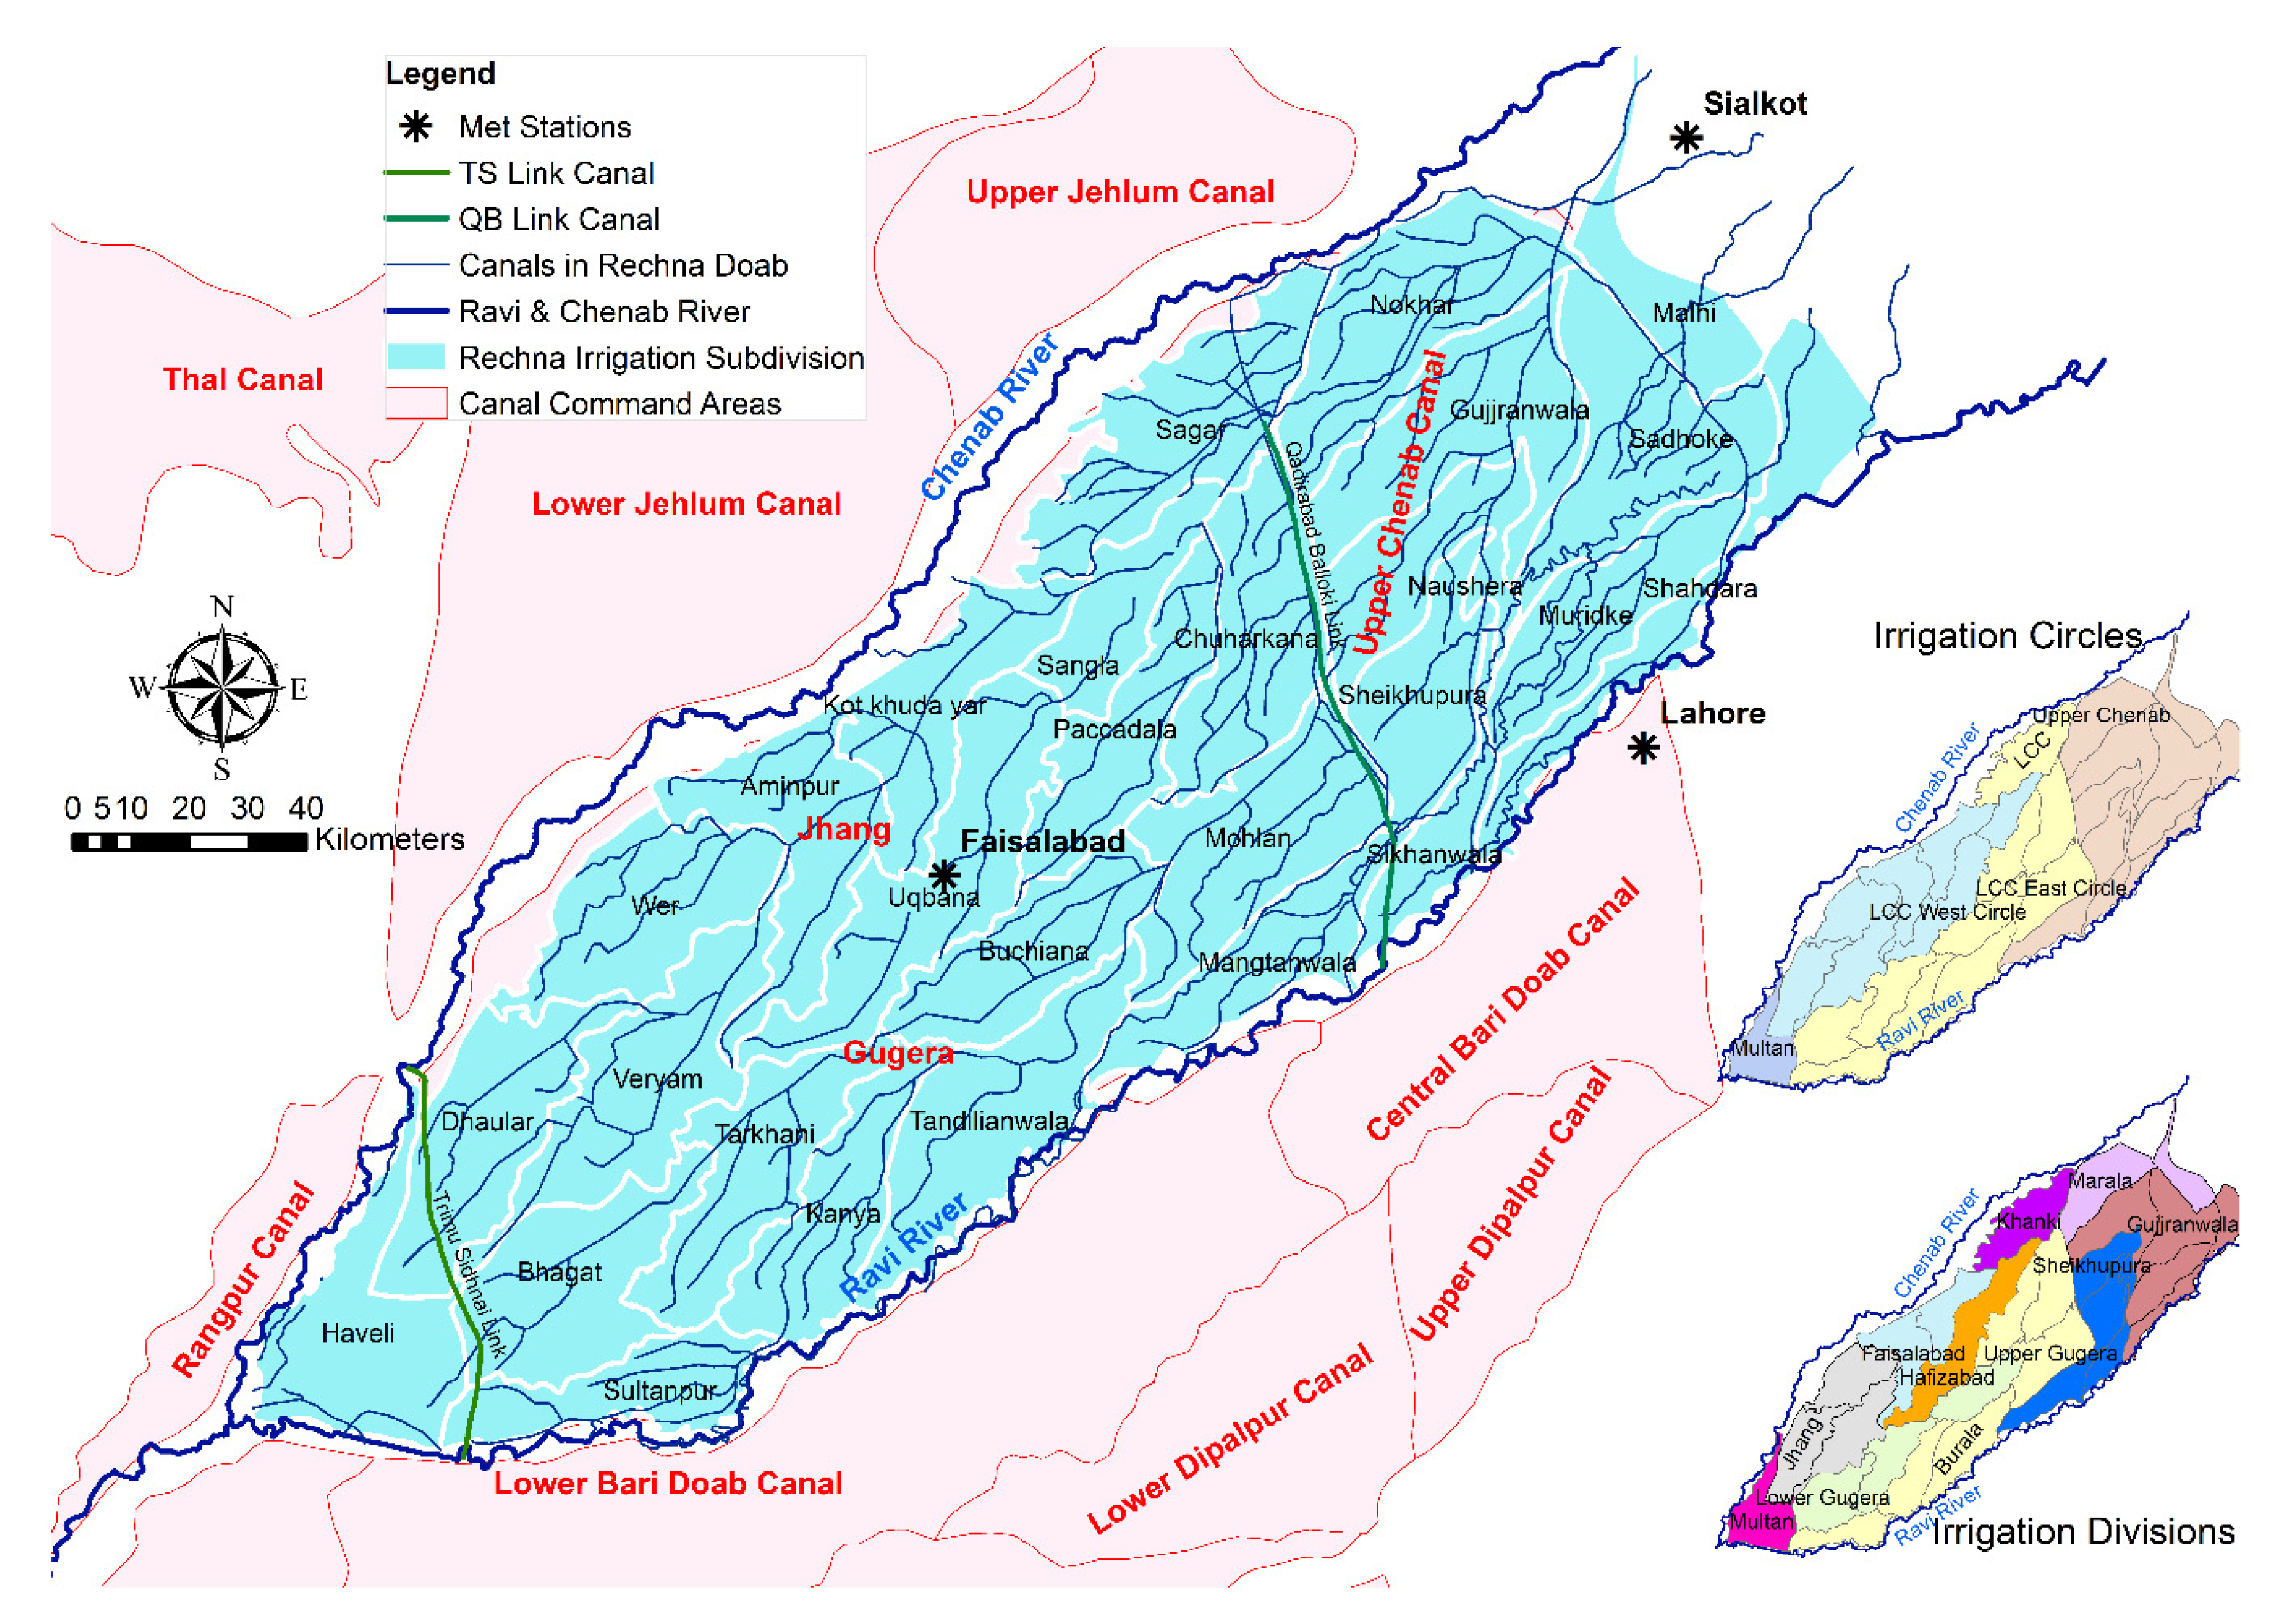
2. Study Region
2.1. Irrigation System
2.2. Agriculture and Climate
3. Datasets
3.1. Remote Sensing Data
3.2. Geographical Information System (GIS) Data
3.3. Field Data
3.4. Secondary Data
4. Methods
4.1. Land Use Land Cover Mapping
4.2. SEBAL for Estimating Consumptive Water Use
4.3. Validation/Plausibility Analysis of SEBAL ETa Results
4.4. Calculation of Performance Indicators
4.4.1. Equity of Irrigation Distribution
4.4.2. Adequacy of Irrigation System
Overall Consumed Ratio (ep)
Relative Water Supply (RWS)
Relative Evapotranspiration
4.4.3. Reliability of Irrigation System
4.5. Spatio-Temporal Scales for Assessment
4.6. Factors/Variables Importance Analysis
4.6.1. Set of Factors
- Physical factors influence the cropping system in various ways that drive the water utilization and its supply [47,48,49,50]. The major variables include slope, canal density, road density, soil texture, elevation, and population density. Land slope influences consumptive water use, as some slopes create hindrance in reachability and flow of water, and therefore result in increased efforts for irrigation [51]. Higher canal densities would enable easy access to irrigation water and resultantly higher cropping intensities. Moreover, better soil moisture can be maintained in such regions due to low soil temperatures [51]. Road density does not have a direct impact, but could influence crop water use indirectly by facilitating better extension services. This could help in adopting better technologies and informed decision making, in time [51]. Moreover, crop husbandry could be improved due to easy and frequent access to the field by the farmers. Soil texture is a variable that influences water demands directly due to varying crop rotations, crop inputs, and due to different water holding capacities [52]. The elevation is another vital variable, which influences consumptive water use in multiple ways. Higher elevation usually results in fewer irrigation demands due to lower temperatures and higher precipitation, however, it increases the energy demands for pumping irrigation water and land leveling efforts. Population density could affect crop water utilization as better technical services for irrigation could be available in the vicinity of larger cities. However, it could influence adversely because of the lowering of farming interest due to fragmented and small landholdings among larger populations. Additionally, increased population leads to tough competition for water availability among various sectors competing for water, for instance, water diversion for agriculture, industry, and domestic needs [53].
- Proximity factors are another class of variables influencing crop water use/availability. Such variables include distances of farms from water bodies, from irrigation canals, from roads, from cities, and from canal outlets (i.e., mogha) [54]. Distances from water bodies help to maintain ecosystem balance, ground surface cooling, and a better supply of irrigation water, however, there are very few water bodies located in the Rechna Doab. Distances from canal infrastructures could be very vital, as longer distances result in more loss of canal water through seepage and resultantly less flows in the remote regions [55]. Distances from road and cities could affect better access to fields to adopt diversified cropping practices and to perform various advanced cropping activities. It influences the farmer’s interest in diversified agriculture and therefore making adjustments within their irrigation resources for resource optimization [33,56]. Canal outlets are the exit points of irrigation canals from where water is distributed among various farms. Farms near to canal outlet receive generally more water, as longer distances could lead to more water loss during the channel flow. This might not always be true, considering soil texture and lining of water distribution channels [48,57,58].
- The third set of variables are related to the cropping system, as it includes Simpson cropping diversity that takes care of spatial heterogeneity, and rotation diversity that caters to the multi-temporal pattern of cropping practices. According to [59], cropping and rotation diversity could influence crop conditions and water utilization due to improved soil conditions. Healthier soils result in better soil moisture-holding and improved irrigation water delivery at farms. The Simpson Diversity Index (SDI; [60]) reflects the probability of the next crop species being another species, thus indicates the spatial pattern of cropping diversity in a certain region [52,61]. It can be measured as below:where n is the number of fields in a particular class m (i.e., covered area of a class). M is the total number of crop classes, and N is the total amount of fields under consideration.
4.6.2. Implementation of Random Forest Regression modelling
4.7. Statistical Analyses
5. Results
5.1. The Status of Canal Water Supply and Rainfall
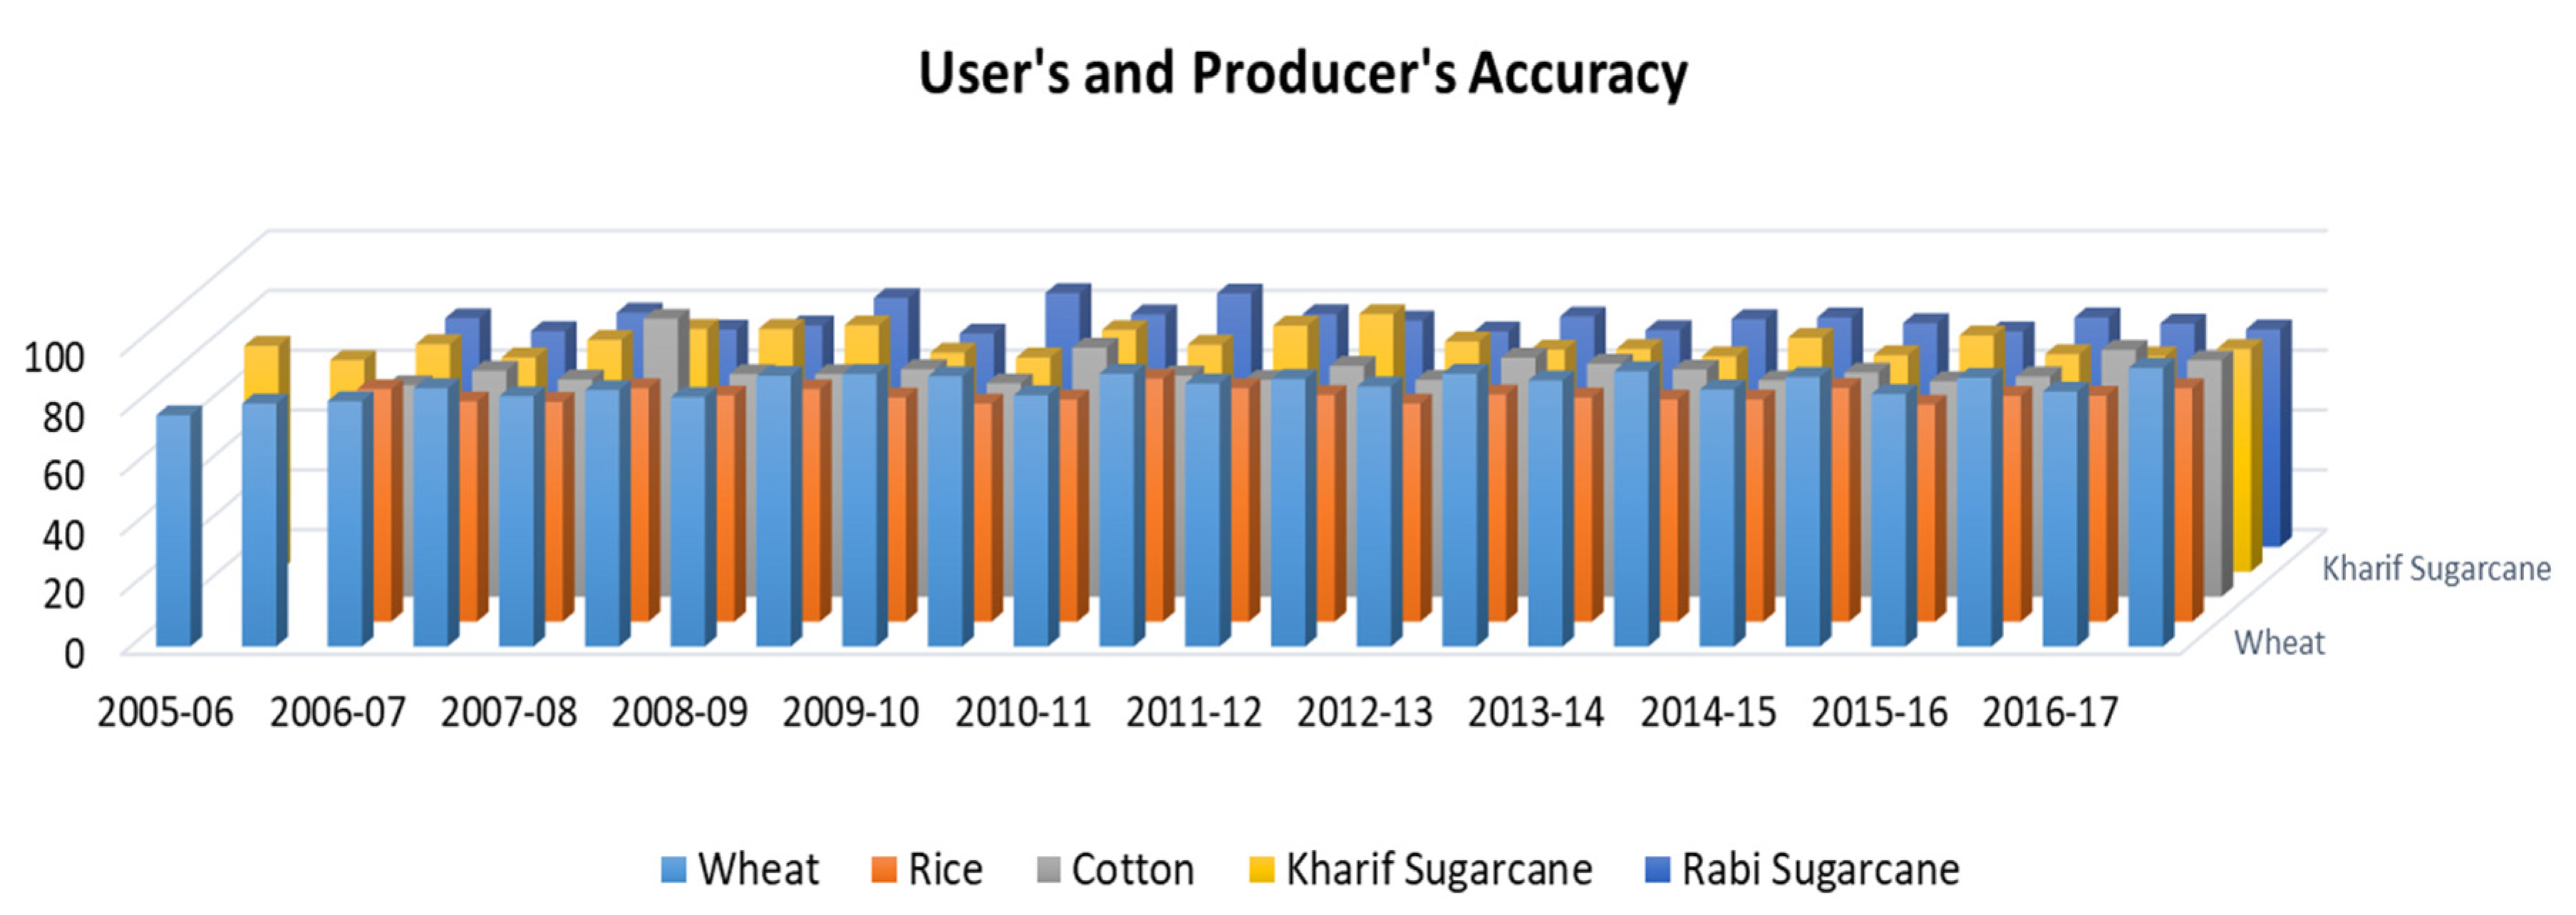
5.2. Land Use Land Cover Mapping
5.3. Plausibility Analysis of SEBAL Results
5.4. Analysis of Consumptive Water Use
5.4.1. Crop Water Consumption in Rechna Doab
5.4.2. Crop Water Consumption in Irrigation Circles
5.4.3. Crop Water Consumption in Irrigation Divisions
5.4.4. Crop Water Consumption in Irrigation Subdivisions
5.4.5. Water Consumption by Major Crops of Rechna Doab
5.5. Performance Assessment Results
5.5.1. Equity
5.5.2. Adequacy
Overall Consumed Ratio (ep)
Relative Water Supply (RWS)
Relative ET
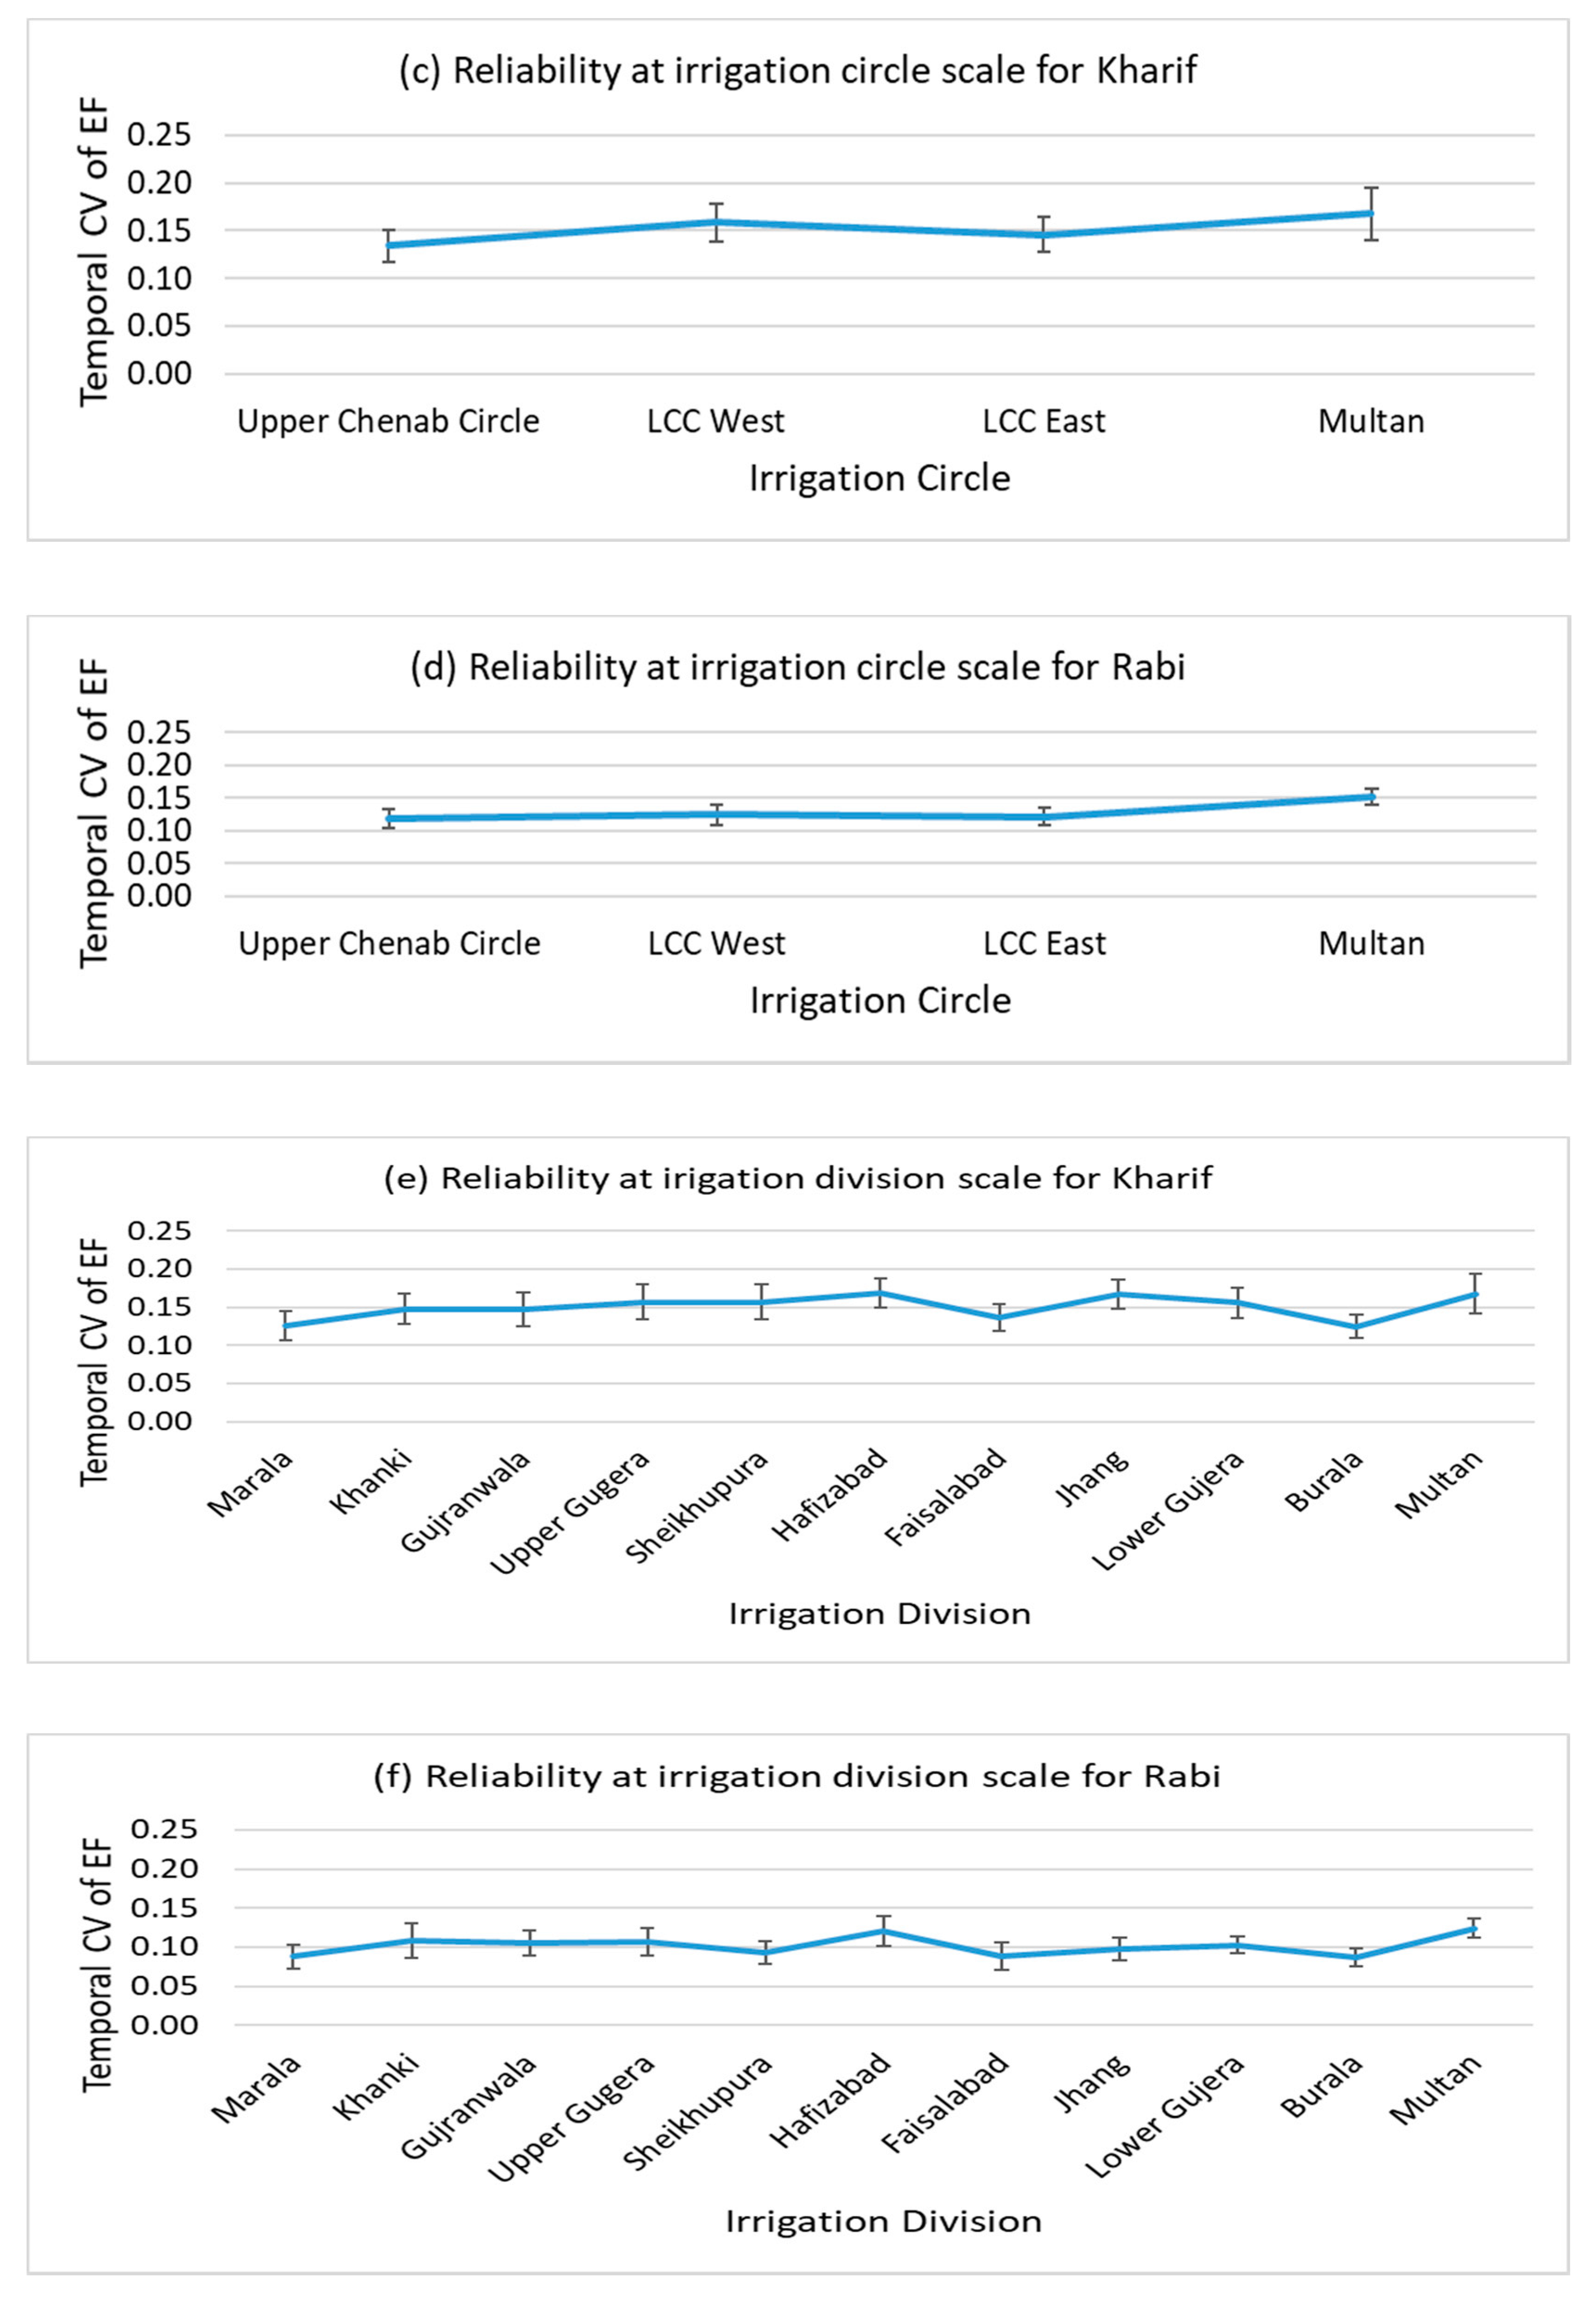
5.5.3. Reliability
Temporal Variation of EF
Crop Water Deficit (CWD)
5.6. Indicators/Variables Importance Assessment
5.6.1. Importance Assessment by Different Seasons
5.6.2. Importance Assessment by Crop Types
5.6.3. Importance Assessment by Overall Consumptive Water Use
6. Discussion
6.1. Validation & Plausibility Assessment
6.2. Irrigation Source and Consumptive Water Usage
6.3. Canal Water Supplies and Irrigation System Performance
6.4. The Current Balance of Crop Water Usage and Required Actions
7. Conclusions
Author Contributions
Funding
Conflicts of Interest
References
- Global Risk Report, 14th ed.; World Economic Forum: Cologny, Switzerland, 2019; ISBN 978-1-944835-15-6. Available online: https://www.weforum.org/reports/the-global-risks-report-2019 (accessed on 20 September 2020).
- Momblanch, A.; Papadimitriou, L.; Jain, S.K.; Kulkarni, A.; Ojha, C.S.P.; Adeloye, A.J.; Holman, I.P. Untangling the water-food-energy-environment nexus for global change adaptation in a complex Himalayan water resource system. Sci. Total Env. 2019, 655, 35–47. [Google Scholar] [CrossRef]
- World Population Prospects. United Nations, 2019. Available online: https://population.un.org/wpp/ (accessed on 20 September 2020).
- Usman, M.; Liedl, R.; Awan, U.K. Spatio-temporal estimation of consumptive water use for assessment of irrigation system performance and management of water resources in irrigated Indus Basin, Pakistan. J. Hydrol. 2015, 525, 26–41. [Google Scholar] [CrossRef]
- Alexandratos, N.; Bruinsma, J. World Agriculture towards 2030/2050: 2012. Available online: http://www.fao.org/fileadmin/templates/esa/Global_persepctives/world_ag_2030_50_2012_rev.pdf (accessed on 20 September 2020).
- Gowda, P.; Chávez, J.L.; Colaizzi, P.D.; Evett, S.R.; Howell, T.A.; Tolk, J.A. Remote sensing-based energy balance algorithms for mapping ET: Current status and future challenges. Trans. Asabe. 2007, 50, 1639–1644. [Google Scholar] [CrossRef]
- USAID. Securing Water for Food: A Grand Challenge for Development Announces Fourth Call for Innovations. 2016. Available online: https://2012-2017.usaid.gov/news-information/press-releases/aug-15-2016-securing-water-food-grand-challenge-development-announces-fourth (accessed on 20 September 2020).
- World Bank. A Water-Secure World for All; World Bank: Washington, DC, USA, 2016; Available online: http://pubdocs.worldbank.org/en/980511475504050046/Water-GP-Brochure-Final-Oct01-2016-web.pdf (accessed on 20 September 2020).
- Sanchis-Ibor, C.; García-Mollá, M.; Avellà-Reus, L. Effects of drip irrigation promotion policies on water use and irrigation costs in Valencia. Spain. Water Policy. 2017, 19, 165–180. [Google Scholar] [CrossRef]
- Scott, C.; Vicuña, S.; Blanco-Gutiérrez, I.; Meza, F.; Varela-Ortega, C. Irrigation efficiency and water-policy implications for river basin resilience. Hydrol. Earth Syst. Sci. 2014, 18, 1339–1348. [Google Scholar] [CrossRef]
- Pfeiffer, L.; Lin, C.Y.C. Does efficient irrigation technology lead to reduced groundwater extraction? Empirical evidence. J. Env. Econ. Manag. 2014, 67, 189–208. [Google Scholar] [CrossRef]
- Keller, A.; Keller, J. Effective efficiency: A water use concept for allocating freshwater resources. In Resources and Irrigation Division Discussion Paper 22; Winrock Int.: Arlington, VA, USA, 1995; Available online: https://www.pacificwater.org/userfiles/file/IWRM/Toolboxes/WUE/Effective%20Efficiency%20and%20water.pdf (accessed on 20 September 2020).
- Simons, G.W.H.; Bastiaanssen, W.G.M.; Cheema, M.J.M.; Ahmad, B.; Immerzeel, W.W. A novel method to quantify consumed fractions and non-consumptive use of irrigation water: Application to the Indus Basin Irrigation System of Pakistan. Agric. Water Manag. 2020, 236. [Google Scholar] [CrossRef]
- Dagnino, M.; Ward, F.A. Economics of agricultural water conservation: Empirical analysis and policy implications. Int. J. Water Resour. Dev. 2012, 28, 577–600. [Google Scholar] [CrossRef]
- Simons, G.W.H.; Bastiaanssen, W.G.M.; Immerzeel, W.W. Water reuse in river basins with multiple users: A literature review. J. Hydrol. 2015, 522, 558–571. [Google Scholar] [CrossRef]
- Wiener, M.J.; Jafvert, C.T.; Nies, L.F. The assessment of water use and reuse through reported data: A US case study. Sci. Total Env. 2016, 539, 70–77. [Google Scholar] [CrossRef]
- Molden, D. Accounting for Water Use and Productivity SWIM Paper 1; International Irrigation Management Institute (IIMI): Colombo, Sri Lanka, 1997; Available online: http://www.iwmi.cgiar.org/Publications/SWIM_Papers/PDFs/SWIM01.PDF (accessed on 20 September 2020).
- Karatas, B.S.; Akkuzu, E.; Unal, H.B.; Asik, S.; Avci, M. Using satellite remote sensing to assess irrigation performance in Water User Associations in the Lower Gediz Basin, Turkey. Agric. Water Manag. 2009, 96, 982–990. [Google Scholar] [CrossRef]
- Usman, M.; Liedl, R.; Shahid, M.A. Managing irrigation water by yield and water productivity assessment of a rice-wheat system using remote sensing. J. Irrig. Drain. Eng. 2014, 140. [Google Scholar] [CrossRef]
- Awan, U.; Tischbein, B.; Conrad, C. Remote sensing and hydrological measurements for irrigation performance assessments in a water user association in the lower Amu Darya River Basin. Water Resour. Manag. 2011. [Google Scholar] [CrossRef]
- Bos, M.G.; Burton, M.A.; Molden, D.J. Irrigation and Drainage Performance Assessment: Practical Guidelines; CABI Publishing: Wallingford, UK, 2005; p. 158. [Google Scholar]
- Ahmad, M.D.; Turral, H.; Nazeer, A. Diagnosing irrigation performance and water productivity through satellite remote sensing and secondary data in a large irrigation system of Pakistan. Agric. Water Manag. 2009, 96, 551–564. [Google Scholar] [CrossRef]
- Allen, R.G.; Tasumi, M.; Trezza, R. Satellite-based energy balance for mapping evapotranspiration with internalized calibration (METRIC) model. J. Irrig. Drain Eng. 2007, 133, 380–394. [Google Scholar] [CrossRef]
- Bastiaanssen, W.G.M.; Menenti, M.; Feddes, R.A.; Holtslag, A.A.M. A remote sensing surface energy balance algorithm for land (SEBAL) formulation. J. Hydrol. 1998, 212–213, 198–212. [Google Scholar] [CrossRef]
- Menenti, M.; Choudhury, B.J. Parameterization of land surface evapotranspiration using a location dependent potential evapotranspiration and surface temperature range. In Exchange Processes at the Land Surface for a Range of Space and Time Scale; Bolle, H.J., Feddes, R.A., Kalma, J.D., Eds.; IAHS Publication: Wallingford, UK, 1993; Volume 212, pp. 561–568. [Google Scholar]
- Roerink, G.J.; Su, Z.; Menenti, M. S-SEBI: A simple remote sensing algorithm to estimate the surface energy balance. Phys. Chem. Earth 2000. [Google Scholar] [CrossRef]
- Sun, L.; Anderson, M.C.; Gao, F.; Hain, C.R.; Alfieri, J.G.; Sharifi, A.; McCarty, G.; Yang, Y.; Yang, Y. Investigating water use over the Choptank River Watershed using a multisatellite data fusion approach. Water Resources Res. 2017, 53, 5298–5319. [Google Scholar] [CrossRef]
- Yang, Y.; Anderson, M.C.; Gao, F.; Hain, C.; Kustas, W.P.; Meyers, T.; Crow, W.; Finocchiaro, R.G.; Otkin, J.A.; Sun, L.; et al. Impact of tile drainage on evapotranspiration (ET) in South Dakota, USA based on high spatiotemporal resolution ET time series from a multi satellite data fusion system. J. Sel. Top. Appl. Earth Obs. Remote Sens. 2017, 10, 2550–2564. [Google Scholar] [CrossRef]
- Kustas, W.P.; Norman, J.M. A two-source approach for estimating turbulent fluxes using multiple angle thermal infrared observations. Water Resour Res. 1997, 33, 1495–1508. [Google Scholar] [CrossRef]
- Bastiaanssen, W.G.M.; Molden, D.J.; Makin, I.W. Remote sensing for irrigated agriculture: Examples from research and possible applications. Agr. Wat. Mngmnt. 2000, 46, 137–155. [Google Scholar] [CrossRef]
- Allen, R.; Irmak, A.; Trezza, R. Satellite based ET estimation in agriculture using SEBAL and METRIC. Hydrol. Process 2011. [Google Scholar] [CrossRef]
- Fang, S.; Jia, R.; Tu, W.; Sun, Z. Assessing Factors Driving the Change of Irrigation Water-Use Efficiency in China Based on Geographical Features. Water 2017, 9, 759. [Google Scholar] [CrossRef]
- Huang, Q.; Xu, Y.; Kovacs, K.; West, G. Analysis of factors that influence the use of irrigation technologies and water management practices in Arkansas. J. Agric. Appl. Econ. 2017, 49, 159–185. [Google Scholar] [CrossRef]
- Samian, M.; Mahdei, K.N.; Saadi, H.; Movahedi, R. Identifying factors affecting optimal management of agricultural water. J. Saudi Soc. Agr. Sci. 2015, 14, 11–18. [Google Scholar] [CrossRef]
- Aslam, M.; Prathapar, S.A. Strategies to mitigate secondary salinization in theIndus Basin of Pakistan: A selective review. In Research Report 97; International Water Management Institute (IWMI): Colombo, Sri Lanka, 2006; Available online: https://www.iwmi.cgiar.org/publications/iwmi-research-reports/iwmi-research-report-97/ (accessed on 20 September 2020).
- Kazmi, S.I.; Ertsen, M.W.; Asi, M.R. The impact of conjunctive use of canal and tubewell water in Lagar irrigated area, Pakistan. Phys. Chem. Earth. 2012, 47–48, 86–98. [Google Scholar] [CrossRef]
- Badruddin, M. Country Profile. Pakistan Internal Report; International Water Management Institute (IWMI): Lahore, Pakistan, 1996. [Google Scholar]
- Usman, M.; Qamar, M.U.; Becker, R.; Zaman, M.; Conrad, C.; Salim, S. Numerical modelling and remote sensing based approaches for investigating groundwater dynamics under changing land-use and climate in the agricultural region of Pakistan. J. Hydrol. 2020, 581, 124408. [Google Scholar] [CrossRef]
- Latifovic, R.; Olthof, I. Accuracy assessment using sub-pixel fractional error matrices of global land cover products derived from satellite data. Remote. Sens. Environ. 2004, 90, 153–165. [Google Scholar] [CrossRef]
- Kongo, M.; Jewitt, G.; Lorentz, S. Evaporative water use of different land uses in the upper-Thukela river basin assessed from satellite imagery. Agric. Water Manag. 2011, 98, 1727–1739. [Google Scholar] [CrossRef]
- Liaqat, U.W.; Choi, M.; Awan, U.K. Spatio-temporal distribution of actual evapotranspiration in the Indus Basin Irrigation System. Hydrol. Process. 2015, 29, 2613–2627. [Google Scholar] [CrossRef]
- Perry, C.J. Quantification and Measurement of a Minimum Set of Indicators of the Performance of Irrigation Systems; International Irrigation Management Institute: Colombo, Sri Lanka, 1996. [Google Scholar]
- Bos, M.G.; Nugteren, J. On irrigation efficiencies. In International Institute for Land Reclamation and Improvement (ILRI); ILRI Publication: Wageningen, The Netherlands, 1990; Volume 19, p. 138. [Google Scholar]
- Roerink, G.J.; Bastiaanssen, W.G.M.; Chambouleyron, J.; Menenti, M. Relating crop water consumption to irrigation water supply by remote sensing. Water Resour. Manag. 1997, 11, 445–465. [Google Scholar] [CrossRef]
- Bastiaanssen, W.G.M.; Bos, M.G. Irrigation performance indicators based on remotely sensed data: A review of literature. Irrig. Drain. Syst. 1999, 13, 291–311. [Google Scholar] [CrossRef]
- Bastiaanssen, W.G.M.; Brito, R.A.L.; Bos, M.G.; Souza, R.A.; Cavalcanti, E.B.; Bakker, M.M. Low cost satellite data for monthly irrigation performance monitoring: Benchmarks from Nilo Coelho, Brazil. Irrig. Drain. Syst. 2001, 15, 53–79. [Google Scholar] [CrossRef]
- Tischbein, B.; Manschadi, A.M.; Conrad, C.; Hornidge, A.; Bhaduri, A.; Hassan, M.U.; Lamers, J.P.A.; Awan, U.K.; Vlek, P.L.G. Adapting to water scarcity:constraints and opportunities for improving irrigation management inKhorezm, Uzbekistan. Water Sci. Technol. Water Supply. 2013, 337–348. [Google Scholar] [CrossRef]
- Reddy, J.M.; Muhammedjanov, S.; Jumaboev, K.; Eshmuratov, D. Analysis of cotton water productivity in Fergana Valley of central Asia. Agric. Sci. 2012, 3, 822–834. [Google Scholar] [CrossRef]
- Sichoongwe, K.; Mapemba, L.; Tembo, G.; Ng’ong’ola, D. The determinants and extent of crop diversification among smallholder farmers: A case study of southern province Zambia. J. Agric. Sci. 2014, 6, 150–159. [Google Scholar] [CrossRef]
- Rahman, S.; Kazal, M.M.H. Determinan.ts of crop diversity in the regions of Bangladesh (1990 e 2008). Singap. J. Trop. Geogr. 2015, 36, 83–97. [Google Scholar] [CrossRef]
- Panahi, F.; Malek-Mohammadi, I.; Chizari, M.; Samani, J. The role of optimizing agricultural water resource management to livelihood poverty abolition in rural Iran. Aust. J. Basic Appl. Sci. 2009, 3, 3841–3849. [Google Scholar]
- Conrad, C.; Löw, F.; Lamers, J.P.A. Mapping and assessing crop diversity in the irrigated Fergana Valley, Uzbekistan. Appl. Geogr. 2017, 86, 102–117. [Google Scholar] [CrossRef]
- Jalilov, S.M.; Keskinen, M.; Varis, O.; Amer, S.; Ward, F.A. Managing the water-energy-food nexus: Gains and losses from new water development in Amu Darya River Basin. J. Hydrol. 2016, 539, 648–661. [Google Scholar] [CrossRef]
- Pereira, L.S.; Oweis, T.; Zairi, A. Irrigation management under water scarcity. Agric. Water Manag. 2002, 57, 175–206. [Google Scholar] [CrossRef]
- Usman, M.; Liedl, R.; & Kavousi, A. Estimation of distributed seasonal net recharge by modern satellite data in irrigated agricultural regions of Pakistan. Environ. Earth Sci. 2015, 74, 1463–1486. [Google Scholar] [CrossRef]
- Panda, R.K.; Behera, S.K.; Kashyap, P.S. Effective management of irrigation water for maize under stressed conditions. Agric. Water Manag. 2004, 66, 181–203. [Google Scholar] [CrossRef]
- Martius, C.; Rudenko, I.; Lamers, J.P.A.; Vlek, P.L.G. Cotton, Water, Salts and Soums: Economic and Ecological Restructuring in Khorezm, Uzbekistan; Martius, C., Rudenko, I., Lamers, J., Vlek, P., Eds.; Springer Netherlands: Heidelberg, Germany, 2012. [Google Scholar] [CrossRef]
- Usman, M.; Kazmi, I.; Khaliq, T.; Ahmad, A.; Saleem, M.F.; Shabbir, A. Variability in water use, crop water productivity and profitability of rice and wheat in Rechna Doab, Punjab, Pakistan. J. Anim. Plant Sci. 2012, 22, 998–1003. [Google Scholar]
- Löw, F.; Biradar, C.; Fliemann, E.; Lamers, J.P.A.; Conrad, C. Assessing gaps in irrigated agricultural productivity through satellite earth observations—A case study of the Fergana Valley, Central Asia. Int. J. Appl. Earth Obs. Geoinf. 2017, 59, 118–134. [Google Scholar] [CrossRef]
- Simpson, E.H. Measurement of diversity. Nature 1949. [Google Scholar] [CrossRef]
- Magurran, A.E. Measuring Biological Diversity; Blackwell Publishing: Oxford, UK, 2004. [Google Scholar]
- Hastie, T.; Tibshirani, R.; Friedman, J. The Elements of Statistical Learning: Data Mining, Inference, and Prediction, 2nd ed.; Springer: Berlin/Heidelberg, Germany, 2009; Available online: https://web.stanford.edu/~hastie/ElemStatLearn/ (accessed on 20 September 2020).
- Breiman, L. Random forests. Mach. Learn. 2001, 45, 5–32. [Google Scholar] [CrossRef]
- Gessner, U.; Machwitz, M.; Conrad, C.; Dech, S. Estimating the fractional cover of growth forms and bare surface in savannas. A multi-resolution approach based on regression tree ensembles. Remote Sens. Environ. 2013, 129, 90–102. [Google Scholar] [CrossRef]
- Strobl, C.; Boulesteix, A.L.; Kneib, T.; Augustin, T.; Zeileis, A. Conditional variable importance for random forests. BMC Bioinf 2008, 9. Available online: https://bmcbioinformatics.biomedcentral.com/articles/10.1186/1471-2105-9-307 (accessed on 20 September 2020). [CrossRef] [PubMed]
- Hothorn, T.; Hornik, K.; Zeileis, A. Party: A Laboratory for Recursive Partitioning. 2006. Available online: https://cran.r-project.org/web/packages/party/vignettes/party.pdf (accessed on 20 September 2020).
- Hothorn, T.; Hornik, K.; Zeileis, A. Unbiased recursive partitioning: A conditional inference framework. J. Comput. Graph. Stat. 2006, 15, 651–674. [Google Scholar] [CrossRef]
- Mann, H.B. Non-parametric tests against trend. Econometrica 1945, 13, 163–171. [Google Scholar] [CrossRef]
- Kendall, M.G. Rank Correlation Methods, 4th ed.; Charles Griffin: London, UK, 1975. [Google Scholar]
- Gilbert, R.O. Statistical Methods for Environmental Pollution Monitoring; Wiley: New York, NY, USA, 1987. [Google Scholar]
- Usman, M.; Reimann, T.; Liedl, R.; Abbas, A.; Conrad, C.; Saleem, S. Inverse Parametrization of a Regional Groundwater Flow Model with the Aid of Modelling and GIS: Test and Application of Different Approaches. Isprs Int. J. Geo-Inf. 2018, 7, 22. [Google Scholar] [CrossRef]
- Hofmann, W.; Gawronski, B.; Gschwendner, T.; Le, H.; Schmitt, M. A meta-analysis on the correlation between the Implicit Association Test and explicit self-report measures. Personal. Soc. Psychol. Bull. 2005, 31, 1369–1385. [Google Scholar] [CrossRef] [PubMed]
- Bos, M.G. Performance indicators for irrigation and drainage. Irrig. Drain. Syst. 1997, 11, 119–137. [Google Scholar] [CrossRef]
- Cheema, M.J.M.; Immerzeel, W.W.; Bastiaanssen, W.G.M. Spatial Quantification of Groundwater Abstraction in the Irrigated Indus Basin. Groundwater 2013. [Google Scholar] [CrossRef] [PubMed]
- Arshad, A.; Zhang, Z.; Zhang, W.; Gujree, I. Long-Term Perspective Changes in Crop Irrigation Requirement Caused by Climate and Agriculture Land Use Changes in Rechna Doab, Pakistan. Water 2019, 11, 1567. [Google Scholar] [CrossRef]
- Jabeen, M.; Ahmad, Z.; Ashraf, A. Predicting behaviour of the Indus basin aquifer susceptible to degraded environment in the Punjab province, Pakistan. Modeling Earth Syst. Environ. 2020, 6, 1633–1644. [Google Scholar] [CrossRef]
- Foster, S.; Pulido-Bosch, A.; Vallejos, Á.; Molina, L.; Llop, A.; MacDonald, A.M. Impact of irrigated agriculture on groundwater-recharge salinity: A major sustainability concern in semi-arid regions. Hydrogeol. J. 2018, 26, 2781–2791. [Google Scholar] [CrossRef]
- Qureshi, A.S.; Asghar, M.N.; Ahmad, S.; Masih, I. Sustaining crop production in saline groundwater areas: A case study from Pakistani Punjab. Aust. J. Agric. Res. 2004, 55, 421–431. [Google Scholar] [CrossRef]
- Ali, S.; Liu, Y.; Ishaq, M.; Shah, T.; Abdullah, I.A.; Din, I. Climate Change and Its Impact on the Yield of Major Food Crops: Evidence from Pakistan. Foods 2017, 6, 39. [Google Scholar] [CrossRef]
- Nelson, G.C.; Rosegrant, M.W.; Koo, J.; Robertson, R.; Sulser, T.; Zhu, T.; Ringler, C.; Msangi, S.; Palazoo, A.; Batka, M.; et al. Climate Change: Impact on Agriculture and Costs of Adaptation; International Food Policy Research Institute: Washington, DC, USA, 2009; Volume 21, Available online: https://www.ifpri.org/publication/climate-change-impact-agriculture-and-costs-adaptation (accessed on 20 September 2020).
- Qaseem, M.F.; Qureshi, R.; Shaheen, H. Effects of Pre-Anthesis Drought, Heat and Their Combination on the Growth, Yield and Physiology of diverse Wheat (Triticum aestivum L.) Genotypes Varying in Sensitivity to Heat and drought stress. Sci. Rep. 2019, 9, 1–12. [Google Scholar] [CrossRef] [PubMed]
- Duggan, B.L.; Domitruk, D.R.; Fowler, D.B. Yield component variation in winter wheat grown under drought stress. Can. J. Plant Sci. 2000, 80, 739–745. [Google Scholar] [CrossRef]
- Sharif, I.; Aleem, S.; Farooq, J.; Rizwan, M.; Younas, A.; Sarwar, G.; Chohan, S.M. Salinity stress in cotton: Effects, mechanism of tolerance and its management strategies. Physiol. Mol. Biol. Plants 2019, 25, 807–820. [Google Scholar] [CrossRef] [PubMed]
- Rizwan, M.; Bakhsh, A.; Li, X.; Anjum, L.; Jamal, K.; Hamid, S. Evaluation of the impact of water management technologies on water savings in the Lower Chenab Canal command area, Indus river Basin. Water 2018, 10, 681. [Google Scholar] [CrossRef]
- Mahmood, N.; Ah, T.; Ahmad, M.; Maan, A.A. Identification of the adoption level of water saving interventions and reasons for non-adoption in Faisalabad district. Pak. J. Agric. Sci. 2015, 52, 521–525. [Google Scholar]


| Predictor Variable Name | Type | Description | Unit/Source |
|---|---|---|---|
| Slope (X1) | Site specific | Land suitability for irrigation: Higher slopes increase the irrigation efforts. | Percent slope as derived from Digital Elevation Model (DEM). |
| Canal density (X2) | Site specific | Better access and availability to canal water. Short distances enable more crop diversity and facilitate the growth of higher delta crops (e.g., Rice, Cotton). | Km/km2, waterway layers were analyzed using the density function of the spatial analyst tool (ArcGIS). |
| Road density (X3) | Site specific | Strong connectivity means better extension services from research and academia about the latest technologies. | Km/km2, polylines of open street map were analyzed using the density function of the spatial analyst tool (ArcGIS). |
| Soil texture (X4) | Site specific | Categorical information about soil distribution: A variable that influences water demand, varying crop rotation, and other crop inputs. | Zones of major soil types were extracted from spatial data collected from IWMI, Pakistan |
| Elevation (X5) | Site specific | Terrain elevation from GTOPO at 1km resolution. A higher elevation means higher energy demands for pumping irrigation water and decreased irrigation demands due to more precipitation. | GTOPO30 global Digital Elevation Model (DEM), https://earthexplorer.usgs.gov/. |
| Water bodies distance (X6) | Proximity | Fewer distances mean better environmental conditions and better irrigation water availability in the vicinity regions. | Meter, Euclidean distance measured with geospatial data collected from Punjab Irrigation Department, GOVT of Punjab, Pakistan. |
| Canal distance (X7) | Proximity | Long distances imply a reduced amount of irrigation water availability and vice versa due to decrease flow and higher transmission losses. | Meter, Euclidean distance measured with geospatial data collected from Punjab Irrigation Department, GOVT of Punjab, Pakistan. |
| Road distance (X8) | Proximity | Better access to field and irrigation systems for improved management of the agricultural system. | Meter, Euclidean distance measured with open street map. |
| City distance (X9) | Proximity | Near infrastructure is assumed to increase management skills due to advisory services, and also easy and economical access to the latest technologies, along with more demand for water for human needs, etc. | Meters, Euclidean distance measured with open street map. |
| Population density (X10) | Site specific | Better services availability with bigger cities. Adversely affecting agricultural inputs due to small landholdings, resulting in lower farming interest. More population density leads to more demand for domestic human consumption. | Density/arc-second, https://sedac.ciesin.columbia.edu/data/set/gpw-v3-population-density/data-download. |
| Mogha (outlet) distance (X11) | Proximity | Similar to canal distances, but at a higher level. Lower distances mean better availability of irrigation water to crops | Meter, Euclidean distance measured with geospatial data collected from Punjab Irrigation Department, GOVT of Punjab, Pakistan. |
| Cropping diversity (Simpson) (X12) | Cropping system | Simpson index of cropping diversity. | Dimensionless. |
| Rotation diversity (multi-temporal) (x13) | Cropping system | Simpson index of the diversity of crop types from 2010–2015. | Dimensionless. |
Publisher’s Note: MDPI stays neutral with regard to jurisdictional claims in published maps and institutional affiliations. |
© 2020 by the authors. Licensee MDPI, Basel, Switzerland. This article is an open access article distributed under the terms and conditions of the Creative Commons Attribution (CC BY) license (http://creativecommons.org/licenses/by/4.0/).
Share and Cite
Usman, M.; Mahmood, T.; Conrad, C.; Bodla, H.U. Remote Sensing and Modelling Based Framework for Valuing Irrigation System Efficiency and Steering Indicators of Consumptive Water Use in an Irrigated Region. Sustainability 2020, 12, 9535. https://doi.org/10.3390/su12229535
Usman M, Mahmood T, Conrad C, Bodla HU. Remote Sensing and Modelling Based Framework for Valuing Irrigation System Efficiency and Steering Indicators of Consumptive Water Use in an Irrigated Region. Sustainability. 2020; 12(22):9535. https://doi.org/10.3390/su12229535
Chicago/Turabian StyleUsman, Muhammad, Talha Mahmood, Christopher Conrad, and Habib Ullah Bodla. 2020. "Remote Sensing and Modelling Based Framework for Valuing Irrigation System Efficiency and Steering Indicators of Consumptive Water Use in an Irrigated Region" Sustainability 12, no. 22: 9535. https://doi.org/10.3390/su12229535
APA StyleUsman, M., Mahmood, T., Conrad, C., & Bodla, H. U. (2020). Remote Sensing and Modelling Based Framework for Valuing Irrigation System Efficiency and Steering Indicators of Consumptive Water Use in an Irrigated Region. Sustainability, 12(22), 9535. https://doi.org/10.3390/su12229535