A Method for the Definition of Local Vulnerability Domains to Climate Change and Relate Mapping. Two Case Studies in Southern Italy


Abstract
1. Introduction
2. Related Works
2.1. Risks and Related Measure on Climate Change
2.2. The Need for Local Climate Vulnerability Studies
- -
- Potential physical impacts related to physical structures such as settlements, roads, railways, airports, harbors, thermal power plants and refineries;
- -
- Potential social impacts of climate change, related to Europe’s population, which is also mainly sensitive to extreme events that are driven by climate change: coastal storm surges exacerbated by sea-level rise, increases in river flood heights, increasing flash floods, but also increasing heat events. Sensitivity to these changes is a matter of location, age group distribution, but also the density and size of urban areas that create urban heat island (UHI) effects;
- -
- Potential cultural impacts of climate change, focused on tangible cultural assets because intangibles like norms and attitudes were considered part of the adaptive capacity of a region;
- -
- Potential economic impacts of climate change were analyzed in regard to especially climate-sensitive economic sectors, namely agriculture and forestry, energy production and consumption as well as summer and winter tourism;
- -
- Potential environmental impacts analyzed relate to protected natural areas, soil organic carbon content and the propensity of soil erosion and forest fires.
3. Methods
3.1. Climate Change Vulnerability Domain
3.1.1. Climate Exposure Component
3.1.2. Sensitivity Component
3.1.3. Adaptive Capacity Component
3.2. Synthesis and Elaboration of Vulnerability Map
- Assessment of the indicators of climate exposure, sensitivity and adaptive capacity;
- Association of the indicator information to minimum territorial units by geographic information system (GIS);
- Normalization of data;
- Calculation of the three synthetic indicators ();
- Estimation of the local vulnerability level.
4. Results
4.1. Vulnerability Domains
4.1.1. Local Climate Profiles Assessment
4.1.2. Local Sensitivity Profiles Assessment
4.1.3. Local Adaptive Capacities Assessment
4.1.4. Vulnerability Maps Elaboration
5. Discussion
6. Conclusions
- -
- An examination of the scientific literature analyzed through a systematic literature review process useful for contextualizing the research topic addressed (Section 2);
- -
- The quantitative definition of the three vulnerability domains—climate exposure, sensitivity and adaptive capacity—as well as the process of synthesis and mapping of local vulnerability on the territory (Section 3);
- -
- The application of the proposed method on two case studies (Section 4).
Author Contributions
Funding
Conflicts of Interest
References
- Veizer, J.; Godderis, Y.; François, L.M. Evidence for decoupling of atmospheric CO2 and global climate during the Phanerozoic eon. Nat. Cell Biol. 2000, 408, 698–701. [Google Scholar] [CrossRef]
- Jasanoff, S. A New Climate for Society. Theory Cult. Soc. 2010, 27, 233–253. [Google Scholar] [CrossRef]
- Stott, P.A.; Tett, S.F.B.; Jones, G.S.; Allen, M.R.; Ingram, W.J.; Mitchell, J.F.B. Attribution of twentieth century temperature change to natural and anthropogenic causes. Clim. Dyn. 2001, 17, 1–21. [Google Scholar] [CrossRef]
- Stern, D.I.; Kaufmann, R.K. Anthropogenic and natural causes of climate change. Clim. Chang. 2014, 122, 257–269. [Google Scholar] [CrossRef]
- Houghton, A.; Castillo-Salgado, C. Analysis of correlations between neighborhood-level vulnerability to climate change and protective green building design strategies: A spatial and ecological analysis. Build. Environ. 2020, 168, 106523. [Google Scholar] [CrossRef]
- Osborne, P.E.; Sanches, T. Quantifying how landscape composition and configuration affect urban land surface temperatures using machine learning and neutral landscapes. Comput. Environ. Urban Syst. 2019, 76, 80–90. [Google Scholar] [CrossRef]
- Logan, T.; Zaitchik, B.; Guikema, S.; Nisbet, A. Night and day: The influence and relative importance of urban characteristics on remotely sensed land surface temperature. Remote. Sens. Environ. 2020, 247, 111861. [Google Scholar] [CrossRef]
- Chen, C.; Wang, B.; Feng, P.; Xing, H.; Fletcher, A.L.; Lawes, R.A. The shifting influence of future water and temperature stress on the optimal flowering period for wheat in Western Australia. Sci. Total. Environ. 2020, 737, 139707. [Google Scholar] [CrossRef]
- Osipov, V.I.; Rumyantseva, N.A.; Eremina, O.N. Living with risk of natural disasters. Russ. J. Earth Sci. 2019, 19, 1–10. [Google Scholar] [CrossRef]
- Acharjee, S. Urban land use and geohazards in Itanagar, Arunachal Pradesh, India: The need for geotechnical intervention and geoethical policies in urban disaster resilience programmes in a changing climate. Geol. Soc. Lond. Spéc. Publ. 2015, 419, 63–68. [Google Scholar] [CrossRef]
- Yasuhara, K.; Nhuan, M.T.; Truc, N.N. Adaptation to climate change-induced geodisasters in coastal zones of the Asia-Pacific region. In Engineering Geology for Society and Territory; Lollino, G., Manconi, A., Clague, J., Shan, W., Chiarle, M., Eds.; Springer: Cham, Germany, 2015; Volume 1, pp. 149–152. [Google Scholar] [CrossRef]
- Khadka, D.; Pathak, D. Climate change projection for the marsyangdi river basin, Nepal using statistical downscaling of GCM and its implications in geodisasters. Geoenviron. Disasters 2016, 3, 15. [Google Scholar] [CrossRef]
- Islam, S.; Chu, C.; Smart, J.C.R.; Liew, L. Integrating disaster risk reduction and climate change adaptation: A systematic literature review. Clim. Dev. 2019, 12, 255–267. [Google Scholar] [CrossRef]
- Islam, S.; Chu, C.; Smart, J.C. Challenges in integrating disaster risk reduction and climate change adaptation: Exploring the Bangladesh case. Int. J. Disaster Risk Reduct. 2020, 47, 101540. [Google Scholar] [CrossRef]
- Fleming, K.C.; Abad, J.; Booth, L.; Schueller, L.; Baills, A.; Scolobig, A.; Petrovic, B.; Zuccaro, G.; Leone, M. The use of serious games in engaging stakeholders for disaster risk reduction, management and climate change adaption information elicitation. Int. J. Disaster Risk Reduct. 2020, 49, 101669. [Google Scholar] [CrossRef]
- Bertin, M.; Maragno, D.; Musco, F. Pianificare l’adattamento al cambiamento climatico come gestione di una macro-emergenza locale. Territorio 2019, 89, 138–144. [Google Scholar] [CrossRef]
- 2009 UNISDR Terminology on Disaster Risk Reduction. Available online: https://www.undrr.org/publication/2009-unisdr-terminology-disaster-risk-reduction (accessed on 5 November 2020).
- Intergovernmental Panel on Climate Change. Glossary of terms. In Managing the Risks of Extreme Events and Disasters to Advance Climate Change Adaptation; Field, C.B., Barros, V., Stocker, T.F., Qin, D., Dokken, D.J., Ebi, K.L., Mastrandrea, M.D., Mach, K.J., Plattner, G.-K., Allen, S.K., et al., Eds.; A Special Report of Working Groups I and II of the Intergovernmental Panel on Climate Change (IPCC); Cambridge University Press: Cambridge, UK; New York, NY, USA, 2012; pp. 555–564. ISBN 978-1-107-60780-4. [Google Scholar]
- Communication from the Commission to the European Parliament, the Council, the European Economic and Social Committee and the Committee of the Regions. An EU Strategy on Adaptation to Climate Change. Available online: https://eur-lex.europa.eu/legal-content/IT/ALL/?uri=CELEX:52013SC0137 (accessed on 30 October 2020).
- Füssel, H.-M. Vulnerability: A generally applicable conceptual framework for climate change research. Glob. Environ. Chang. 2007, 17, 155–167. [Google Scholar] [CrossRef]
- Kasperson, J.X.; Kasperson, R.E.; Turner, B.; Hsieh, W.; Schiller, A. Vulnerability to Global Environmental Change. In The Social Contours of Risk; Kasperson, R.E., Ed.; Taylor and Francis: Oxford, UK, 2012; Volume II, pp. 245–285. ISBN 9781849772549. [Google Scholar]
- Ludena, C.E.; Yoon, S.W.; Sánchez-Aragón, L.; Miller, S.; Yu, B.K. Vulnerability indicators of adaptation to climate change and policy implications for investment projects. Int. Am. Dev. Bank 2015, 858, IDB-TN-858. [Google Scholar]
- Pachauri, R.K.; Allen, M.R.; Barros, V.R.; Broome, J.; Cramer, W.; Christ, R.; Church, J.A.; Clarke, L.; Dahe, Q.; Dasgupta, P.; et al. Climate Change 2014: Synthesis Report; Contribution of Working Groups I, II and III to the Fifth Assessment Report of the Intergovernmental Panel on Climate Change; IPCC: Geneva, Switzerland, 2014; ISBN 978-92-9169-143-2. [Google Scholar]
- World Meteorological Organization. WMO Statement on the State of the Global Climate in 2019; WMO: Geneva, Switzerland, 2020; p. 1248. ISBN 978-92-63-11248-4. [Google Scholar]
- Thaler, T.; Seebauer, S. Bottom-up citizen initiatives in natural hazard management: Why they appear and what they can do? Environ. Sci. Policy 2019, 94, 101–111. [Google Scholar] [CrossRef]
- Botzen, W.J.W.; Bergh, J.C.V.D.; Bouwer, L.M. Climate change and increased risk for the insurance sector: A global perspective and an assessment for the Netherlands. Nat. Hazards 2009, 52, 577–598. [Google Scholar] [CrossRef]
- Jacobsen, J.K.S.; Leiren, M.D.; Saarinen, J. Natural hazard experiences and adaptations: A study of winter climate-induced road closures in Norway. Nor. Geogr. Tidsskr. Nor. J. Geogr. 2016, 70, 292–305. [Google Scholar] [CrossRef]
- Takemi, T.; Okada, Y.; Ito, R.; Ishikawa, H.; Nakakita, E. Assessing the impacts of global warming on meteorological hazards and risks in Japan: Philosophy and achievements of the SOUSEI program. Hydrol. Res. Lett. 2016, 10, 119–125. [Google Scholar] [CrossRef]
- Pregnolato, M.; Dawson, D.A. Adaptation investments for transport resilience: Trends and recommendations. Int. J. Saf. Secur. Eng. 2018, 8, 515–527. [Google Scholar] [CrossRef]
- Doktycz, C.; Abkowitz, M.D. Loss and Damage Estimation for Extreme Weather Events: State of the Practice. Sustainability 2019, 11, 4243. [Google Scholar] [CrossRef]
- Petrova, E.G. Natural factors of technological accidents: The case of Russia. Nat. Hazards Earth Syst. Sci. 2011, 11, 2227–2234. [Google Scholar] [CrossRef]
- Pinnegar, J.K.; Engelhard, G.H.; Norris, N.J.; Theophille, D.; Sebastien, R.D. Assessing vulnerability and adaptive capacity of the fisheries sector in Dominica: Long-term climate change and catastrophic hurricanes. ICES J. Mar. Sci. 2019, 76, 1353–1367. [Google Scholar] [CrossRef]
- Scyphers, S.; Beck, M.W.; Furman, K.L.; Haner, J.; Josephs, L.I.; Lynskey, R.; Keeler, A.G.; Landry, C.E.; Powers, S.P.; Webb, B.M.; et al. A Waterfront View of Coastal Hazards: Contextualizing Relationships among Geographic Exposure, Shoreline Type, and Hazard Concerns among Coastal Residents. Sustainability 2019, 11, 6687. [Google Scholar] [CrossRef]
- Pi, Y.; Yu, Y.; Zhang, Y.; Xu, C.; Yu, R. Extreme Temperature Events during 1960–2017 in the Arid Region of Northwest China: Spatiotemporal Dynamics and Associated Large-Scale Atmospheric Circulation. Sustainability 2020, 12, 1198. [Google Scholar] [CrossRef]
- Ross, M.; Santiago, J.; Lagmay, A.M. Integrating and Applying Technology in Response to the Super Typhoon Bopha Disaster. Procedia Eng. 2015, 107, 100–109. [Google Scholar] [CrossRef]
- Rodolfo, K.S.; Lagmay, A.M.F.; Eco, R.C.; Herrero, T.M.; Mendoza, J.E.; Minimo, L.G.; Santiago, J.T. The December 2012 Mayo River debris flow triggered by Super Typhoon Bopha in Mindanao, Philippines: Lessons learned and questions raised. Nat. Hazards Earth Sys. 2016, 16, 2683–2695. [Google Scholar] [CrossRef]
- Luu, T.A.; Nguyen, A.T.; Trinh, Q.A.; Pham, V.T.; Le, B.B.; Nguyen, D.T.; Hoang, Q.N.; Pham, H.T.; Nguyen, T.K.; Luu, V.N.; et al. Farmers’ Intention to Climate Change Adaptation in Agriculture in the Red River Delta Biosphere Reserve (Vietnam): A Combination of Structural Equation Modeling (SEM) and Protection Motivation Theory (PMT). Sustainability 2019, 11, 2993. [Google Scholar] [CrossRef]
- Salomon, F.; Bernal-Casasola, D.; Díaz, J.J.; Lara, M.; Domínguez-Bella, S.; Ertlen, D.; Wassmer, P.; Adam, P.; Schaeffer, P.; Hardion, L.; et al. High-resolution late Holocene sedimentary cores record the long history of the city of Cádiz (south-western Spain). Sci. Drill. 2020, 27, 35–47. [Google Scholar] [CrossRef]
- Van Ackere, S.; Beullens, J.; Vanneuville, W.; De Wulf, A.A.; De Maeyer, P. FLIAT, An Object-Relational GIS Tool for Flood Impact Assessment in Flanders, Belgium. Water 2019, 11, 711. [Google Scholar] [CrossRef]
- Weber, K.; Wernhart, S.; Stickler, T.; Fuchs, B.; Balas, M.; Hübl, J.; Damyanovic, D. Risk Communication on Floodings: Insights into the Risk Awareness of Migrants in Rural Communities in Austria. Mt. Res. Dev. 2019, 39. [Google Scholar] [CrossRef]
- Magalhães, S.D.S.; Miranda, D.K.; Miranda, D.M.; Malloy-Diniz, L.F.; Romano-Silva, M.A. The Extreme Climate Event Database (EXCEED): Development of a picture database composed of drought and flood stimuli. PLoS ONE 2018, 13, e0204093. [Google Scholar] [CrossRef]
- Parker, L.; Bourgoin, C.; Martinez-Valle, A.; Läderach, P. Vulnerability of the agricultural sector to climate change: The development of a pan-tropical Climate Risk Vulnerability Assessment to inform sub-national decision making. PLoS ONE 2019, 14, e0213641. [Google Scholar] [CrossRef]
- Zhao, Y.; Yang, N.; Wei, Y.; Hu, B.; Cao, Q.; Tong, K.; Liang, Y. Eight Hundred Years of Drought and Flood Disasters and Precipitation Sequence Reconstruction in Wuzhou City, Southwest China. Water 2019, 11, 219. [Google Scholar] [CrossRef]
- Do, X.K.; Kim, M.; Nguyen, H.T.; Jung, K. Analysis of landslide dam failure caused by overtopping. Procedia Eng. 2016, 154, 990–994. [Google Scholar] [CrossRef]
- Andres, N.; Badoux, A. The Swiss flood and landslide damage database: Normalisation and trends. J. Flood Risk Manag. 2018, 12, e12510. [Google Scholar] [CrossRef]
- Vaculisteanu, G.; Niculita, M.; Mărgărint, M.C. Natural hazards and their impact on rural settlements in NE Romania A cartographical approach. Open Geosci. 2019, 11, 765–782. [Google Scholar] [CrossRef]
- Lader, R.; Bhatt, U.S.; Walsh, J.E.; Rupp, T.S.; Bieniek, P.A. Two-Meter Temperature and Precipitation from Atmospheric Reanalysis Evaluated for Alaska. J. Appl. Meteorol. Clim. 2016, 55, 901–922. [Google Scholar] [CrossRef]
- Nel, J.L.; Le Maitre, D.C.; Nel, D.C.; Reyers, B.; Archibald, S.; Van Wilgen, B.W.; Forsyth, G.G.; Theron, A.K.; O’Farrell, P.J.; Kahinda, J.M.; et al. Natural Hazards in a Changing World: A Case for Ecosystem-Based Management. PLoS ONE 2014, 9, e95942. [Google Scholar] [CrossRef] [PubMed]
- Kothawale, D.R.; Revadekar, J.V.; Kumar, K.R. Recent trends in pre-monsoon daily temperature extremes over India. J. Earth Syst. Sci. 2010, 119, 51–65. [Google Scholar] [CrossRef]
- Grothmann, T.; Leitner, M.; Glas, N.; Prutsch, A. A Five-Steps Methodology to Design Communication Formats That Can Contribute to Behavior Change. SAGE Open 2017, 7, 2158244017692014. [Google Scholar] [CrossRef]
- Zander, K.K.; Wilson, T.; Garnett, S.T. Understanding the role of natural hazards in internal labour mobility in Australia. Weather. Clim. Extremes 2020, 29, 100261. [Google Scholar] [CrossRef]
- Punziano, G.; Urso, G. Local development strategies for inner areas in Italy. A comparative analysis based on plan documents. Ital. J. Plan. Pract. 2016, 6, 76–109. [Google Scholar]
- Tiainen, J.; Hyvönen, T.; Hagner, M.; Huusela-Veistola, E.; Louhi, P.; Miettinen, A.; Nieminen, T.; Palojärvi, A.; Seimola, T.; Taimisto, P.; et al. Biodiversity in intensive and extensive grasslands in Finland: The impacts of spatial and temporal changes of agricultural land use. Agric. Food Sci. 2020, 29, 68–97. [Google Scholar] [CrossRef]
- Dalsgaard, B. Land-Use and Climate Impacts on Plant–Pollinator Interactions and Pollination Services. Diversity 2020, 12, 168. [Google Scholar] [CrossRef]
- Zhao, W.W.; Liu, Y.; Feng, Q.; Wang, Y.P.; Yang, S.Q. Ecosystem services for coupled human and environment systems. Prog. Geog. 2018, 37, 139–151. [Google Scholar] [CrossRef]
- Dai, E.; Yin, L.; Wang, Y.; Ma, L.; Tong, M. Quantitative Assessment of the Relative Impacts of Land Use and Climate Change on the Key Ecosystem Services in the Hengduan Mountain Region, China. Sustainability 2020, 12, 4100. [Google Scholar] [CrossRef]
- Mngumi, L.E. Ecosystem services potential for climate change resilience in peri-urban areas in Sub-Saharan Africa. Landsc. Ecol. Eng. 2020, 16, 1–12. [Google Scholar] [CrossRef]
- Devi, R.M.; Sinha, B.; Bisaria, J.; Saran, S. Multitemporal analysis of forest cover change using remote sensing and GIS of kanha tiger reserve, Central India. ISPRS Int. Arch. Photogramm. 2018, 211–219. [Google Scholar] [CrossRef]
- Groisman, P.Y.; Bulygina, O.; Henebry, G.M.; Speranskaya, N.; Shiklomanov, A.; Chen, Y.; Tchebakova, N.; Parfenova, E.; Tilinina, N.; Zolina, O.; et al. Dryland belt of Northern Eurasia: Contemporary environmental changes and their consequences. Environ. Res. Lett. 2018, 13, 115008. [Google Scholar] [CrossRef]
- Lieu, J.; Spyridaki, N.-A.; Tinoco, R.A.; Van Der Gaast, W.; Tuerk, A.; Van Vliet, O. Evaluating Consistency in Environmental Policy Mixes through Policy, Stakeholder, and Contextual Interactions. Sustainability 2018, 10, 1896. [Google Scholar] [CrossRef]
- Zhou, C.W.; Yang, R.; Yu, L.F.; Zhang, Y.; Yan, L.B. Hydrological and ecological effects of climate change in Caohai watershed based on SWAT model. Appl. Ecol. Environ. Res. 2019, 17, 161–172. [Google Scholar] [CrossRef]
- Jiang, X.; Shen, W.; Bai, X. Response of net primary productivity to vegetation restoration in Chinese Loess Plateau during 1986-2015. PLoS ONE 2019, 14, e0219270. [Google Scholar] [CrossRef]
- Zhang, X.; Zhang, B.; Feeley, K.J.; Wang, G.G.; Zhang, J.; Zhai, L. Ecological contingency in species shifts: Downslope shifts of woody species under warming climate and land-use change. Environ. Res. Lett. 2019, 14, 114033. [Google Scholar] [CrossRef]
- Yang, H.; Huntingford, C.; Wiltshire, A.; Sitch, S.; Mercado, L. Compensatory climate effects link trends in global runoff to rising atmospheric CO2 concentration. Environ. Res. Lett. 2019, 14, 124075. [Google Scholar] [CrossRef]
- De Caro, M.; Perico, R.; Crosta, G.B.; Frattini, P.; Volpi, G. A regional-scale conceptual and numerical groundwater flow model in fluvio-glacial sediments for the Milan Metropolitan area (Northern Italy). J. Hydrol. Reg. Stud. 2020, 29, 100683. [Google Scholar] [CrossRef]
- Labat, M.M.; Foldes, G.; Kohnova, S.; Hlavcova, K. Land use and climate change impact on runoff in a small mountainous catchment in Slovakia. IOP Conf. Series Earth Environ. Sci. 2020, 444, 012036. [Google Scholar] [CrossRef]
- Touseef, M.; Chen, L.; Masud, T.; Khan, A.; Yang, K.; Shahzad, A.; Ijaz, M.W.; Wang, Y. Assessment of the Future Climate Change Projections on Streamflow Hydrology and Water Availability over Upper Xijiang River Basin, China. Appl. Sci. 2020, 10, 3671. [Google Scholar] [CrossRef]
- Xu, D.; Lyon, S.W.; Mao, J.; Dai, H.; Jarsjö, J. Impacts of multi-purpose reservoir construction, land-use change and climate change on runoff characteristics in the Poyang Lake basin, China. J. Hydrol. Reg. Stud. 2020, 29, 100694. [Google Scholar] [CrossRef]
- Holland, R.A.; Beaumont, N.; Hooper, T.; Austen, M.; Gross, R.J.; Heptonstall, P.J.; Ketsopoulou, I.; Winskel, M.; Watson, J.; Taylor, G. Incorporating ecosystem services into the design of future energy systems. Appl. Energy 2018, 222, 812–822. [Google Scholar] [CrossRef]
- Vaughan, N.E.; Gough, C.; Mander, S.; Littleton, E.W.; Welfle, A.; Gernaat, D.E.H.J.; Van Vuuren, D.P. Evaluating the use of biomass energy with carbon capture and storage in low emission scenarios. Environ. Res. Lett. 2018, 13, 044014. [Google Scholar] [CrossRef]
- Creutzig, F.; Breyer, C.; Hilaire, J.; Minx, J.C.; Peters, G.P.; Socolow, R.H. The mutual dependence of negative emission technologies and energy systems. Energy Environ. Sci. 2019, 12, 1805–1817. [Google Scholar] [CrossRef]
- Randle-Boggis, R.; White, P.; Cruz, J.; Parker, G.; Montag, H.; Scurlock, J.; Hooper, T. Realising co-benefits for natural capital and ecosystem services from solar parks: A co-developed, evidence-based approach. Renew. Sustain. Energy Rev. 2020, 125, 109775. [Google Scholar] [CrossRef]
- Knight, T.; Price, S.; Bowler, D.; King, S. How effective is ‘greening’ of urban areas in reducing human exposure to ground-level ozone concentrations, UV exposure and the ‘urban heat island effect’? A protocol to update a systematic review. Environ. Évid. 2016, 5, 8. [Google Scholar] [CrossRef]
- Lin, B.B.; Meyers, J.; Beaty, R.M.; Barnett, G.B. Urban Green Infrastructure Impacts on Climate Regulation Services in Sydney, Australia. Sustainability 2016, 8, 788. [Google Scholar] [CrossRef]
- Boeri, A.; Gaspari, J.; Gianfrate, V.; Longo, D. Accelerating Urban Transition: An approach to greening the Built Environment. WIT Tr. Ecol. Envir. 2017, 223, 3–14. [Google Scholar] [CrossRef]
- Tor-Ngern, P.; Leksungnoen, N. Investigating carbon dioxide absorption by urban trees in a new park of Bangkok, Thailand. BMC Ecol. 2020, 20, 20. [Google Scholar] [CrossRef]
- Kloster, S.; Mahowald, N.M.; Randerson, J.T.; Lawrence, P.J. The impacts of climate, land use, and demography on fires during the 21st century simulated by CLM-CN. Biogeosciences 2012, 9, 509–525. [Google Scholar] [CrossRef]
- Uriarte, M.; Schwartz, N.; Powers, J.S.; Marín-Spiotta, E.; Liao, W.; Werden, L.K. Impacts of climate variability on tree demography in second growth tropical forests: The importance of regional context for predicting successional trajectories. Biotropica 2016, 48, 780–797. [Google Scholar] [CrossRef]
- Sleeter, B.M.; Wilson, T.S.; Sharygin, E.; Sherba, J.T. Future Scenarios of Land Change Based on Empirical Data and Demographic Trends. Earth’s Futur. 2017, 5, 1068–1083. [Google Scholar] [CrossRef]
- Hong, J.-W.; Hong, J.; Kwon, E.E.; Yoon, D. Temporal dynamics of urban heat island correlated with the socio-economic development over the past half-century in Seoul, Korea. Environ. Pollut. 2019, 254, 112934. [Google Scholar] [CrossRef] [PubMed]
- Bamber, N.; Jones, M.; Nelson, L.; Hannam, K.; Nichol, C.; Pelletier, N. Life cycle assessment of mulch use on Okanagan apple orchards: Part 1 Attributional. J. Clean. Prod. 2020, 267, 121960. [Google Scholar] [CrossRef]
- Pihlainen, S.; Zandersen, M.; Hyytiäinen, K.; Andersen, H.E.; Bartosova, A.; Gustafsson, B.; Jabloun, M.; McCrackin, M.L.; Meier, H.M.; Olesen, J.E.; et al. Impacts of changing society and climate on nutrient loading to the Baltic Sea. Sci. Total. Environ. 2020, 731, 138935. [Google Scholar] [CrossRef]
- Rabin, S.S.; Alexander, P.; Henry, R.; Anthoni, P.; Pugh, T.A.M.; Rounsevell, M.; Arneth, A. Impacts of future agricultural change on ecosystem service indicators. Earth Syst. Dyn. 2020, 11, 357–376. [Google Scholar] [CrossRef]
- Fischer, S.; Pietroń, J.; Bring, A.; Thorslund, J.; Jarsjö, J. Present to future sediment transport of the Brahmaputra River: Reducing uncertainty in predictions and management. Reg. Environ. Chang. 2016, 17, 515–526. [Google Scholar] [CrossRef]
- Inturri, G.; Ignaccolo, M.; Le Pira, M.; Caprì, S.; Giuffrida, N. Influence of Accessibility, Land Use and Transport Policies on the Transport Energy Dependence of a City. Transp. Res. Procedia 2017, 25, 3273–3285. [Google Scholar] [CrossRef]
- Lewis, R.; Zako, R.; Biddle, A.; Isbell, R. Reducing greenhouse gas emissions from transportation and land use: Lessons from West Coast states. J. Transp. Land Use 2018, 11, 343–366. [Google Scholar] [CrossRef]
- Chalov, S.; Golosov, V.; Collins, A.; Stone, M. Preface: Land use and climate change impacts on erosion and sediment transport. Proc. Int. Assoc. Hydrol. Sci. 2019, 381, 1. [Google Scholar] [CrossRef]
- Yasuhara, K.; Komine, H.; Murakami, S.; Chen, G.; Mitani, Y.; Duc, D. Effects of climate change on geo-disasters in coastal zones and their adaptation. Geotext. Geomembranes 2012, 30, 24–34. [Google Scholar] [CrossRef]
- Fournier, M.; Larrue, C.; Alexander, M.; Hegger, D.L.T.; Bakker, M.H.N.; Pettersson, M.; Crabbé, A.; Mees, H.; Choryński, A. Flood risk mitigation in Europe: How far away are we from the aspired forms of adaptive governance? Ecol. Soc. 2016, 21. [Google Scholar] [CrossRef]
- Longo, D.; Boeri, A.; Gianfrate, V.; Palumbo, E.; Boulanger, S.O. Resilient cities: Mitigation measures for urban districts. a feasibility study. Int. J. Sustain. Dev. Plan. 2018, 13, 734–745. [Google Scholar] [CrossRef]
- Mori, S.; Washida, T.; Kurosawa, A.; Masui, T. Assessment of mitigation strategies as tools for risk management under future uncertainties: A multi-model approach. Sustain. Sci. 2018, 13, 329–349. [Google Scholar] [CrossRef] [PubMed]
- Moon, D.R.; Taverna, G.S.; Anduix-Canto, C.; Ingham, T.; Chipperfield, M.P.; Seakins, P.W.; Baeza-Romero, M.-T.; Heard, D.E. Heterogeneous reaction of HO2 with airborne TiO2 particles and its implication for climate change mitigation strategies. Atmos. Chem. Phys. Discuss. 2018, 18, 327–338. [Google Scholar] [CrossRef]
- Sareen, S.; Rommetveit, K. Smart gridlock? Challenging hegemonic framings of mitigation solutions and scalability. Environ. Res. Lett. 2019, 14, 075004. [Google Scholar] [CrossRef]
- Tica, G.; Grubic, A.R. Mitigation of climate change from the aspect of controlling F-gases in the field of cooling technology. Mater. Sci. Eng. 2019, 477, 012056. [Google Scholar] [CrossRef]
- Abarca-Álvarez, F.J.; Navarro-Ligero, M.L.; Valenzuela-Montes, L.M.; Campos-Sánchez, F.S. European Strategies for Adaptation to Climate Change with the Mayors Adapt Initiative by Self-Organizing Maps. Appl. Sci. 2019, 9, 3859. [Google Scholar] [CrossRef]
- Thaler, T.; Attems, M.-S.; Bonnefond, M.; Clarke, D.; Gatien-Tournat, A.; Gralepois, M.; Fournier, M.; Murphy, C.; Rauter, M.; Papathoma-Köhle, M.; et al. Drivers and barriers of adaptation initiatives How societal transformation affects natural hazard management and risk mitigation in Europe. Sci. Total. Environ. 2019, 650, 1073–1082. [Google Scholar] [CrossRef]
- Becsi, B.; Hohenwallner-Ries, D.; Grothmann, T.; Prutsch, A.; Huber, T.; Formayer, H. Towards better informed adaptation strategies: Co-designing climate change impact maps for Austrian regions. Clim. Chang. 2019, 158, 393–411. [Google Scholar] [CrossRef]
- Karki, S.; Burton, P.R.; Mackey, B. Climate change adaptation by subsistence and smallholder farmers: Insights from three agro-ecological regions of Nepal. Cogent Soc. Sci. 2020, 6, 1720555. [Google Scholar] [CrossRef]
- Rasmus, S.; Turunen, M.T.; Luomaranta, A.; Kivinen, S.; Jylhä, K.; Räihä, J. Climate change and reindeer management in Finland: Co-analysis of practitioner knowledge and meteorological data for better adaptation. Sci. Total. Environ. 2020, 710, 136229. [Google Scholar] [CrossRef] [PubMed]
- Rasul, G.; Pasakhala, B.; Mishra, A.; Pant, S. Adaptation to mountain cryosphere change: Issues and challenges. Clim. Dev. 2019, 12, 297–309. [Google Scholar] [CrossRef]
- Sustainable Urban Transport: Avoid-Shift-Improve (A-S-I). 2012. Available online: https://ledsgp.org/wp-content/uploads/2016/01/SUTP_GIZ_FS_Avoid-Shift-Improve_EN.pdf (accessed on 5 November 2020).
- Cavalieri, C. Extreme-city-territories. Coastal geographies in the Veneto region. J. Urban. Int. Res. Placemaking Urban Sustain. 2020, 1–19. [Google Scholar] [CrossRef]
- Maragno, D.; Ruzzante, F.; Negretto, V.; Musco, F. Climate Proof Planning: l’uso del remote sensing a supporto della vulnerabilità a scala urbana. GEOmedia 2019, 23, 6–11. [Google Scholar]
- Nistor, M.-M.; Mîndrescu, M. Climate change effect on groundwater resources in Emilia-Romagna region: An improved assessment through NISTOR-CEGW method. Quat. Int. 2019, 504, 214–228. [Google Scholar] [CrossRef]
- Khan, S. Vulnerability assessments and their planning implications: A case study of the Hutt Valley, New Zealand. Nat. Hazards 2012, 64, 1587–1607. [Google Scholar] [CrossRef]
- Harvey, A.; Hinkel, J.; Horrocks, L.; Klein, R.; Lasage, R.; Hodgson, N.; Sajwaj, T.; Benzie, M. Preliminary Assessment and Roadmap for the Elaboration of Climate Change Vulnerability Indicators at Regional Level; AEA: London, UK, 2009. [Google Scholar]
- Schmeltz, M.; Marcotullio, P.J. Examination of Human Health Impacts Due to Adverse Climate Events Through the Use of Vulnerability Mapping: A Scoping Review. Int. J. Environ. Res. Public Health 2019, 16, 3091. [Google Scholar] [CrossRef]
- Natividade-Jesus, E.; Almeida, A.; Sousa, N.; Coutinho-Rodrigues, J. A Case Study Driven Integrated Methodology to Support Sustainable Urban Regeneration Planning and Management. Sustainability 2019, 11, 4129. [Google Scholar] [CrossRef]
- Bellard, C.; Leclerc, C.; Leroy, B.; Bakkenes, M.; Veloz, S.; Thuiller, W.; Courchamp, F. Vulnerability of biodiversity hotspots to global change. Glob. Ecol. Biogeogr. 2014, 23, 1376–1386. [Google Scholar] [CrossRef]
- Dawson, T.P.; Jackson, S.T.; House, J.I.; Prentice, I.C.; Mace, G.M. Beyond Predictions: Biodiversity Conservation in a Changing Climate. Science 2011, 332, 53–58. [Google Scholar] [CrossRef] [PubMed]
- Li, D.; Wu, S.; Liu, L.; Zhang, Y.; Li, S. Vulnerability of the global terrestrial ecosystems to climate change. Glob. Chang. Biol. 2018, 24, 4095–4106. [Google Scholar] [CrossRef] [PubMed]
- Hoffmann, S.; Beierkuhnlein, C. Climate change exposure and vulnerability of the global protected area estate from an international perspective. Divers. Distrib. 2020, 26, 1496–1509. [Google Scholar] [CrossRef]
- Garcia, R.A.; Cabeza, M.; Rahbek, C.; Araújo, M.B. Multiple Dimensions of Climate Change and Their Implications for Biodiversity. Science 2014, 344, 1247579. [Google Scholar] [CrossRef] [PubMed]
- ESPON. Climate Change May Hamper Territorial Cohesion. 2013. Available online: https://www.espon.eu/sites/default/files/attachments/ESPON_MoM_190112.pdf (accessed on 5 November 2020).
- Füssel, H.M.; Jol, A.; Hildén, M. Climate Change, Impacts and Vulnerability in Europe 2012; An Indicator-based Report 12/2012; European Environment Agency: Copenhagen, Denmark, 2012. [CrossRef]
- Castellari, S.; Venturini, S.; Ballarin Denti, A.; Bigano, A.; Bindi, M.; Bosello, F.; Carrera, L.; Chiriaco, M.V.; Danovaro, R.; Desiato, F.; et al. Rapporto sullo Stato delle Conoscenze Scientifiche su Impatti, Vulnerabilità ed Adattamento ai Cambiamenti Climatici in Italia; Ministero dell’Ambiente e della Tutela del Territorio e del Mare: Roma, Italia, 2014. [Google Scholar]
- Hallegatte, S.; Corfee-Morlot, J. Understanding climate change impacts, vulnerability and adaptation at city scale: An introduction. Clim. Chang. 2010, 104, 1–12. [Google Scholar] [CrossRef]
- Lankao, P.R.; Qin, H. Conceptualizing urban vulnerability to global climate and environmental change. Curr. Opin. Environ. Sustain. 2011, 3, 142–149. [Google Scholar] [CrossRef]
- McCormick, S.A. Assessing climate change vulnerability in urban America: Stakeholder-driven approaches. Clim. Chang. 2016, 138, 397–410. [Google Scholar] [CrossRef]
- El-Zein, A.; Tonmoy, F.N. Assessment of vulnerability to climate change using a multi-criteria outranking approach with application to heat stress in Sydney. Ecol. Indic. 2015, 48, 207–217. [Google Scholar] [CrossRef]
- Tapia, C.; Abajo, B.; Feliu, E.; Mendizabal, M.; Martinez, J.A.; Fernández, J.G.; Laburu, T.; Lejarazu, A. Profiling urban vulnerabilities to climate change: An indicator-based vulnerability assessment for European cities. Ecol. Indic. 2017, 78, 142–155. [Google Scholar] [CrossRef]
- Lioubimtseva, E. A multi-scale assessment of human vulnerability to climate change in the Aral Sea basin. Environ. Earth Sci. 2014, 73, 719–729. [Google Scholar] [CrossRef]
- Strategia Nazionale di Adattamento ai Cambiamenti Climatici. Available online: https://www.minambiente.it/notizie/strategia-nazionale-di-adattamento-ai-cambiamenti-climatici-0 (accessed on 31 October 2020).
- Transforming Our World: The 2030 Agenda for Sustainable Development. Available online: https://www.un.org/ga/search/view_doc.asp?symbol=A/RES/70/1&Lang=E (accessed on 31 October 2020).
- The European Green Deal Sets Out how to Make Europe the First Climate-Neutral Continent by 2050, Boosting the Economy, Improving People’s Health and Quality of Life, Caring for Nature, and Leaving No One Behind. Available online: https://ec.europa.eu/commission/presscorner/detail/e%20n/ip_19_6691 (accessed on 31 October 2020).
- Alexander, L.V.; Zhang, X.; Peterson, T.C.; Caesar, J.; Gleason, B.; Tank, A.M.G.K.; Haylock, M.; Collins, D.; Trewin, B.; Rahimzadeh, F.; et al. Global observed changes in daily climate extremes of temperature and precipitation. J. Geophys. Res. Space Phys. 2006, 111. [Google Scholar] [CrossRef]
- MASTER ADAPT. MAinSTreaming Experiences at Regional and Local Level for ADAPTation toc Limate Chance. Available online: https://masteradapt.eu/strumenti/ (accessed on 16 June 2020).
- Giordano, F.; Sebbio, C.; Antolini, G.; Botarelli, L.; Flapp, F.; Bonati, V.; Onorato, L.; Loglisci, N.; Priod, G.; Pelosini, R.; et al. Criteri per la definizione di indicatori prioritari di impatto dei cambiamenti climatici: Verso un set a livello nazionale. Ingegneria dell’Ambiente 2018, 5, 213–227. [Google Scholar] [CrossRef]
- Variazioni e Tendenze Degli Estremi di Temperatura in Italia. Available online: https://www.isprambiente.gov.it/it/pubblicazioni/stato-dellambiente/variazioni-e-tendenze-degli-estremi-di-temperatura-e-precipitazione-in-italia (accessed on 31 October 2020).
- Peterson, T.; Folland, C.; Gruza, G.; Hogg, W.; Mokssit, A.; Plummer, N. Report on the Activities of the Working Group on Climate Change Detection and Related Rapporteurs 1998–2001; World Meteorological Organization: Geneva, Switzerland, 2001. [Google Scholar]
- Mackay, A.W. Climate Change 2007: Impacts, Adaptation and Vulnerability. Contribution of Working Group II to the Fourth Assessment Report of the Intergovernmental Panel on Climate Change. J. Environ. Qual. 2008, 37, 2407. [Google Scholar] [CrossRef]
- Baresi, U.; Vella, K.; Sipe, N.G. Bridging the divide between theory and guidance in strategic environmental assessment: A path for Italian regions. Environ. Impact Assess. Rev. 2017, 62, 14–24. [Google Scholar] [CrossRef][Green Version]
- Joint Research Centre-European Commission. Handbook on Constructing Composite Indicators: Methodology and User Guide; OECD Publishing: Paris, French, 2008; ISBN 978-92-64-04345-9. [Google Scholar]
- Freudenberg, M. Composite Indicators of Country Performance: A Critical Assessment; OECD Publishing: Paris, French, 2003. [Google Scholar] [CrossRef]
- Jacobs, R.; Smith, P.C.; Goddard, M. Measuring Performance: An Examination of Composite Performance Indicators: A Report for the Department of Health. Centre for Health Economics; Technical Paper; Series 29; University of New York: New York, NY, USA, 2004. [Google Scholar]
- Sheppard, S.R. Landscape visualisation and climate change: The potential for influencing perceptions and behaviour. Environ. Sci. Policy 2005, 8, 637–654. [Google Scholar] [CrossRef]
- Preston, B.L.; Brooke, C.; Measham, T.G.; Smith, T.F.; Gorddard, R. Igniting change in local government: Lessons learned from a bushfire vulnerability assessment. Mitig. Adapt. Strat. Glob. Chang. 2008, 14, 251–283. [Google Scholar] [CrossRef]
- Clark, G.E.; Moser, S.C.; Ratick, S.J.; Dow, K.; Meyer, W.B.; Emani, S.; Jin, W.; Kasperson, J.X.; Kasperson, R.E.; Schwarz, H.E. Assessing the Vulnerability of Coastal Communities to Extreme Storms: The Case of Revere, MA, USA. Mitig. Adapt. Strat. Glob. Chang. 1998, 3, 59–82. [Google Scholar] [CrossRef]
- Lynch, A.H.; Tryhorn, L.; Abramson, R. Working at the Boundary: Facilitating Interdisciplinarity in Climate Change Adaptation Research. Bull. Am. Meteorol. Soc. 2008, 89, 169–179. [Google Scholar] [CrossRef]
- European Data Journalism Network. Il Riscaldamento Climatico in Europa, Comune per Comune. Available online: https://www.europeandatajournalism.eu/ita/Notizie/Data-news/Il-riscaldamento-climatico-in-Europa-comune-per-comune (accessed on 31 October 2020).
- Geoportale della Regione Calabria. Available online: http://geoportale.regione.calabria.it/opendata (accessed on 6 November 2020).
- Open Data in ISTAT. Available online: https://www.istat.it/it/dati-analisi-e-prodotti/open-data (accessed on 6 November 2020).


| Mitigation (M) and Adaption (A) Measures | Examples of Structural (S) and Nonstructural (NS) Actions |
|---|---|
| Avoid the demand for private motorized mobility (M) | Promote integrated transport planning (NS) |
| Support the implementation of urban plans for sustainable mobility (NS) | |
| Encourage the construction and the development of infrastructure for cycle and pedestrian mobility (S) | |
| Shift mobility quotas towards more sustainable forms (M) | Promote intermodality through the improvement of services (NS) |
| Improve the attractiveness of local public transport (NS) | |
| Promote modal interchange (NS) | |
| Redevelop railway stations and their accessibility (S) | |
| Improve the environmental performance of vehicles (M) | Promote incentives to reduce the cost/performance ratio on electric vehicles (NS) |
| Renewal of the public vehicle fleet and support for the renewal of the private vehicle fleet in circulation (S) | |
| Development of a widespread network of electric charging points and distribution of biofuels (S) | |
| Contain damage to infrastructure (A) | Redevelopment and maintenance of roads, the railway network and stations (S) |
| Reduce the impact on mobility management (A) | Promote integrated planning and effective management of mobility and transport data (NS) |
| Support the implementation of urban plans for sustainable mobility (NS) | |
| Development of ICT technologies to support infomobility (S) | |
| Reduce negative security impacts (A) | Enhance the synergies between sustainable mobility and road safety objectives (NS) |
| Promote environmentally sustainable behaviors (NS) |
| Code | Name | Definition |
|---|---|---|
| FD0 | Frost days | Annual count when TN (daily minimum) < 0 °C |
| TR20 | Tropical nights | Annual count when TN (daily minimum) > 20 °C |
| TNx | Max Tmin | Annual maximum value of daily minimum temperature |
| TNn | Min Tmin | Annual minimum value of daily minimum temperature |
| TN10p | Cold nights | Percentage of days when TN < 10th percentile |
| TN90p | Warm nights | Percentage of days when TN > 90th percentile |
| SU25 | Summer days | Annual count when TX (daily maximum) > 25 °C |
| TXx | Max Tmax | Annual maximum value of daily maximum temperature |
| TXn | Min Tmax | Annual minimum value of daily maximum temperature |
| TX10p | Cold days | Percentage of days when TX < 10th percentile |
| TX90p | Warm days | Percentage of days when TX > 90th percentile |
| WSDI | Warm spell duration indicator | Annual count of days with at list 6 consecutive days when TX > 90th percentile |
| RX1day | Max 1-day precipitation amount | Annual maximum 1-day precipitation |
| RX5day | Max 5-day precipitation amount | Annual maximum consecutive 5-day precipitation |
| R10 | Number of heavy precipitation days | Annual count of days when PRCP ≥ 10 mm |
| R20 | Number of very heavy precipitation days | Annual count of days when PRCP ≥ 20 mm |
| R95p | Very wet days | Annual total PRCP when RR > 95th percentile |
| SDII | Simple daily intensity index | Annual total precipitation divided by the number of wet days (defined as PRCP ≥ 1 mm) in the year |
| Code | Name | Definition |
|---|---|---|
| EnvC-1 | Areas submitted to landscape bound | Military architecture and Byzantine monuments, waterways, buildings and areas of public interest, alpine and Apennine territories, territories bordering lakes, coastal territories, architectural constraints |
| EnvC-2 | Wetlands | Wetlands (Level 1), inland and maritime wetlands (Level 2) (CORINE Land Cover) |
| EnvC-3 | Urbanized areas of residential type | Artificial surfaces (Level 1), urban fabric (Level 2), continuous and discontinuous urban fabric (Level 3) (CORINE Land Cover) |
| EnvC-4 | Wooded territories and semi-natural environments | Forest and semi-natural areas (Level 1), forest, scrub and/or herbaceous vegetation associations, open spaces with little or no vegetation (Level 2) (CORINE Land Cover) |
| EnvC-5 | Areas under environmental protection | Site of community interest (SCI), national interest site (NIS), regional Interest Site (RIS), special protection area (SPA) |
| EnvC-6 | Landslide and hydraulic risk area | Areas at high and very high risk from landslides or flooding (Hydrogeological Plan) |
| SocC-1 | Elderly population | Percentage of the population over 65 years of age (Italian National Statistics Institute) |
| SocC-2 | Young population | Percentage of the population under the age of 24 (Italian National Statistics Institute) |
| EcoC-3 | Utilized agricultural areas | Agricultural areas (Level 1), arable land, permanent crops, pastures, heterogeneous areas (Level 2) (CORINE Land Cover) |
| EcoC-4 | Unemployment rate | Ratio of the unemployed to the corresponding labor force (Italian National Statistics Institute) |
| EcoC-5 | Impact of households with potential economic distress | Percentage ratio of the number of households with children to the reference person aged up to 64 in which no person is employed or retired from work and total households (Italian National Statistics Institute) |
| Code | Name | Definition |
|---|---|---|
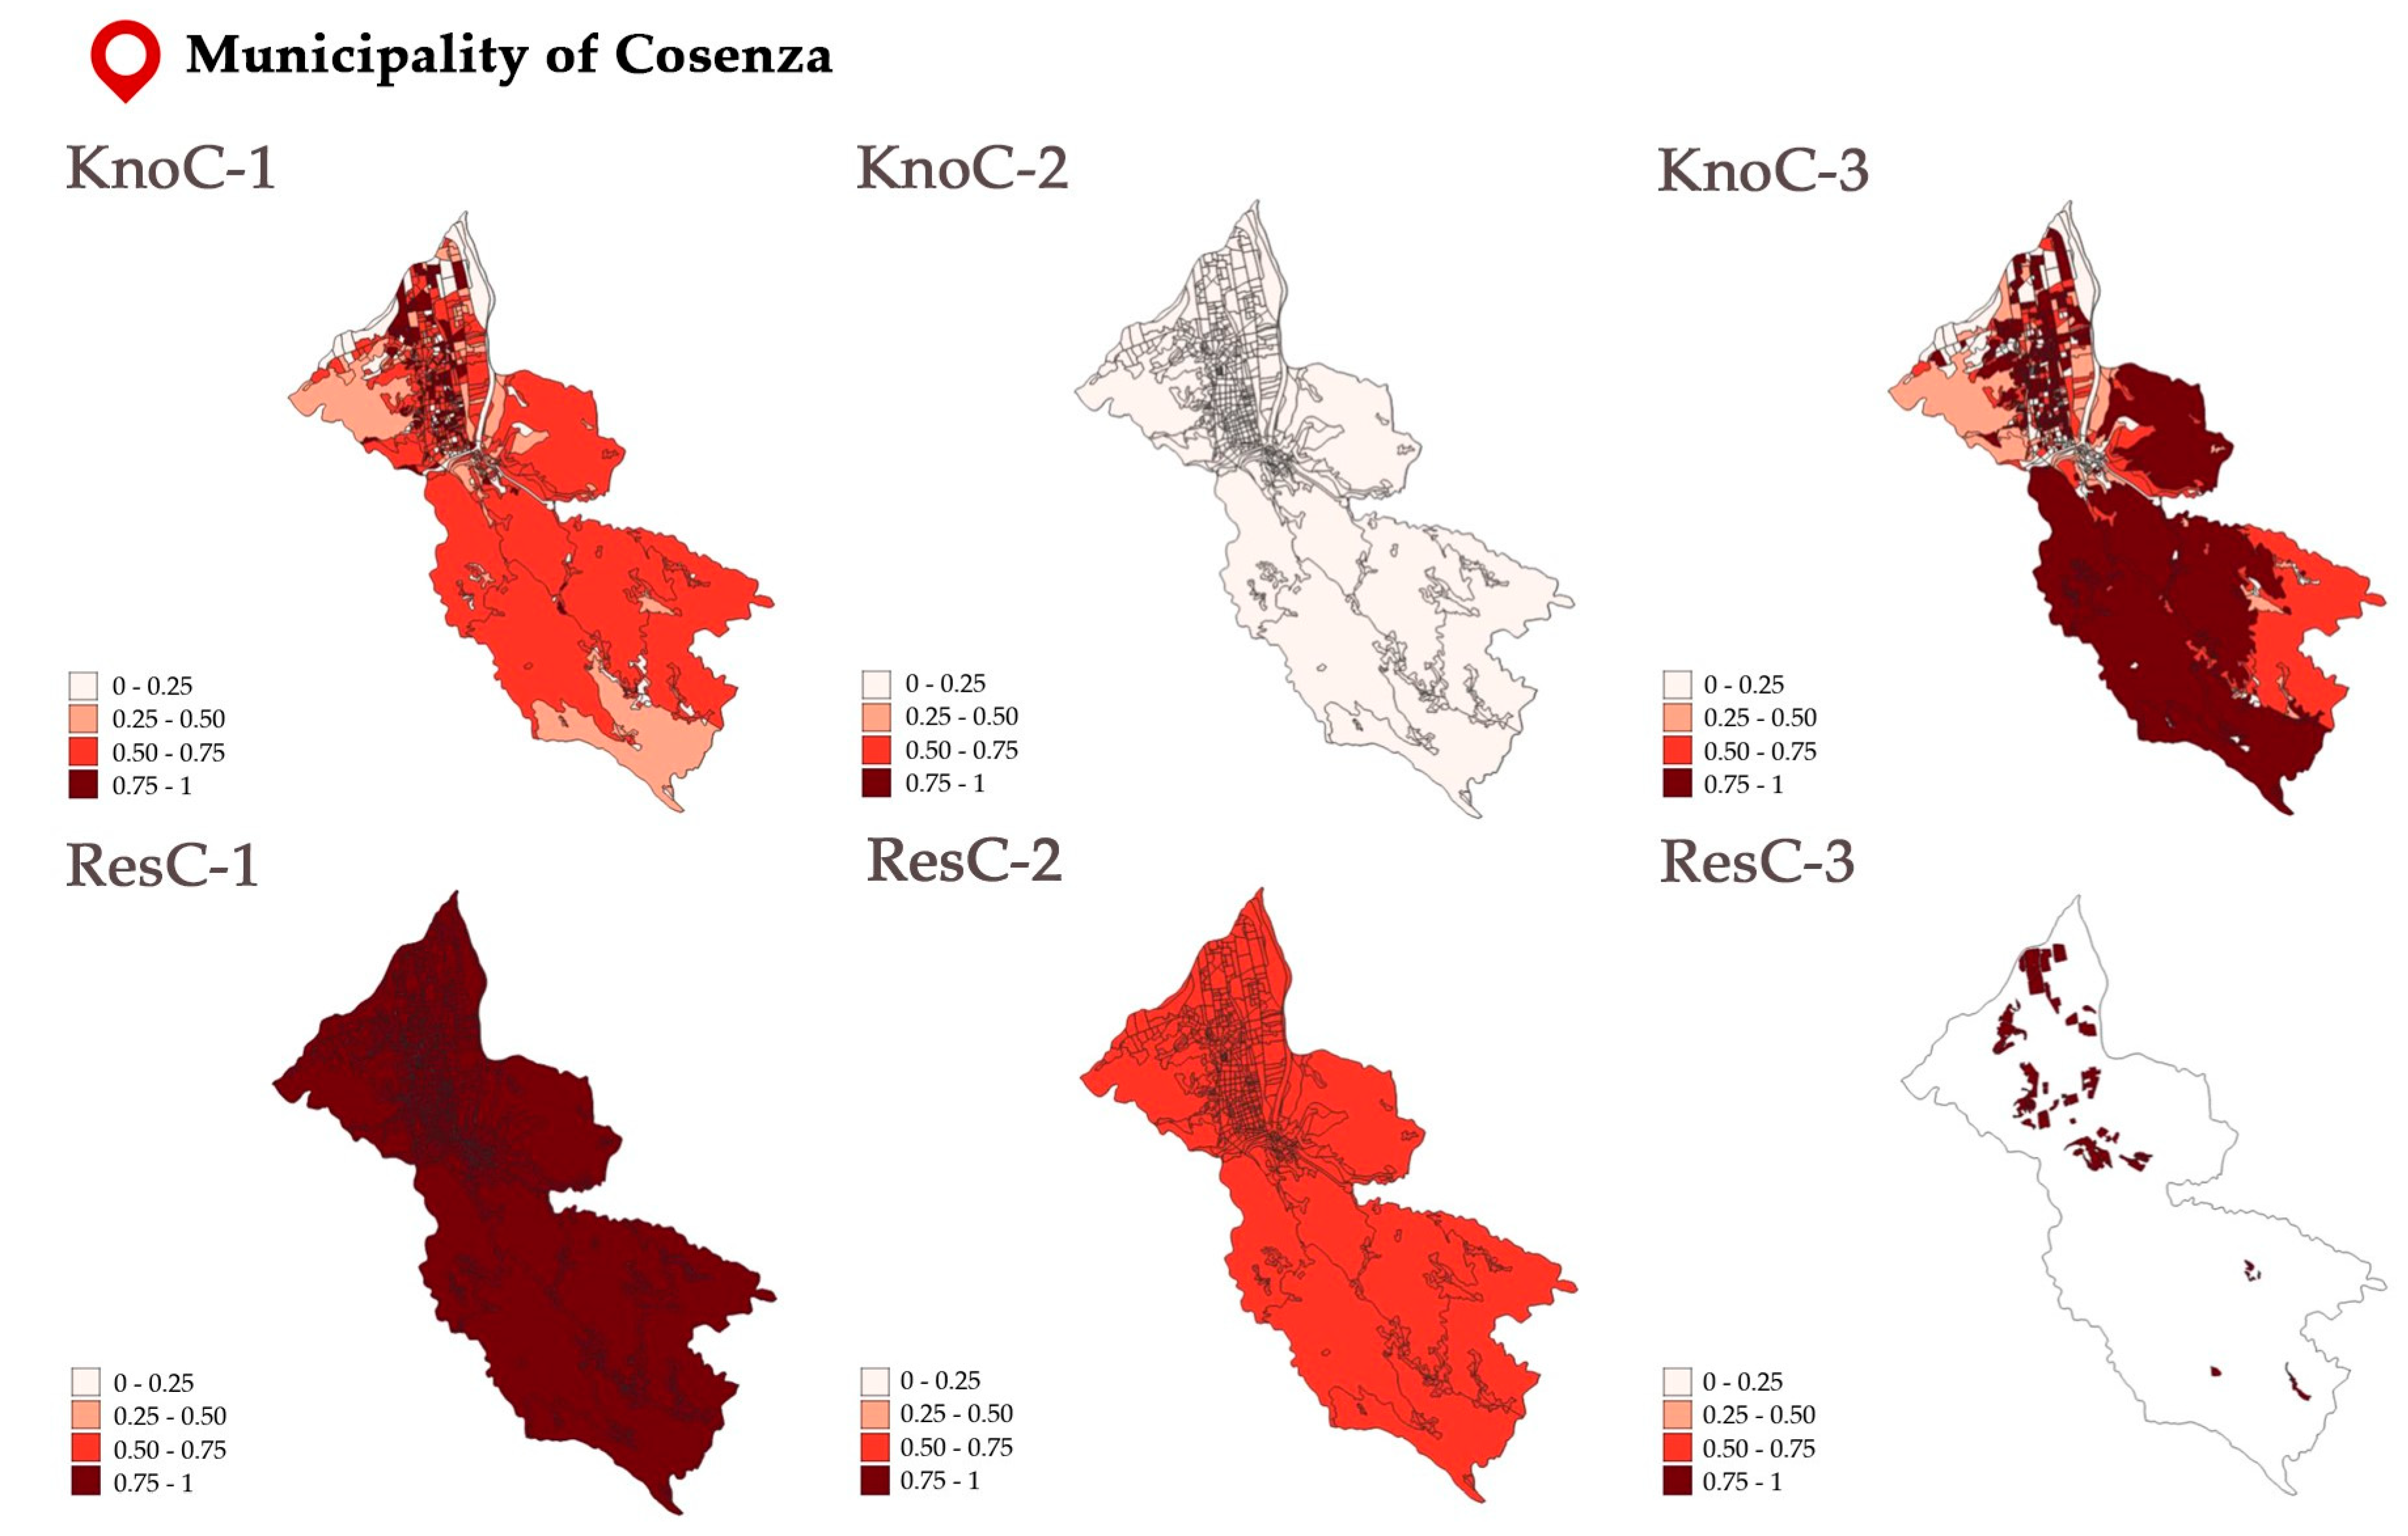
| KnoC-1 | Level of education and literacy rate | The share of the population aged 25–64 with at least one higher secondary education qualification and reading and writing skills |
| KnoC-2 | Internet connection | Optical fiber and ADSL coverage |
| KnoC-3 | Planning of climate actions | Level of awareness, cooperation, communication and dissemination of information on climate change adaptation and mitigation actions |
| ResC-1 | Peripherality level from services | Distance measured in journey times from essential health, education and mobility services |
| ResC-2 | State of conservation of residential buildings | Presence of buildings for residential use in good or excellent condition |
| ResC-3 | Green areas in urban centers | Identification of green areas included in urban centers obtained from the comparison of the municipal urban and satellite images |
Publisher’s Note: MDPI stays neutral with regard to jurisdictional claims in published maps and institutional affiliations. |
© 2020 by the authors. Licensee MDPI, Basel, Switzerland. This article is an open access article distributed under the terms and conditions of the Creative Commons Attribution (CC BY) license (http://creativecommons.org/licenses/by/4.0/).
Share and Cite
Francini, M.; Chieffallo, L.; Palermo, A.; Viapiana, M.F. A Method for the Definition of Local Vulnerability Domains to Climate Change and Relate Mapping. Two Case Studies in Southern Italy. Sustainability 2020, 12, 9454. https://doi.org/10.3390/su12229454
Francini M, Chieffallo L, Palermo A, Viapiana MF. A Method for the Definition of Local Vulnerability Domains to Climate Change and Relate Mapping. Two Case Studies in Southern Italy. Sustainability. 2020; 12(22):9454. https://doi.org/10.3390/su12229454
Chicago/Turabian StyleFrancini, Mauro, Lucia Chieffallo, Annunziata Palermo, and Maria Francesca Viapiana. 2020. "A Method for the Definition of Local Vulnerability Domains to Climate Change and Relate Mapping. Two Case Studies in Southern Italy" Sustainability 12, no. 22: 9454. https://doi.org/10.3390/su12229454
APA StyleFrancini, M., Chieffallo, L., Palermo, A., & Viapiana, M. F. (2020). A Method for the Definition of Local Vulnerability Domains to Climate Change and Relate Mapping. Two Case Studies in Southern Italy. Sustainability, 12(22), 9454. https://doi.org/10.3390/su12229454