Abstract
Vegetation is essential for the provision of ecosystem services. To ensure that ecosystem services are provided, urban planning must consider vegetation cover in both urban core areas and in peripheral areas. This study explored changes in vegetation cover in both urban core and peripheral areas (buffers of 5, 10 and 15 km from the urban core areas) and the relationships between these changes and urban development. To compare the differences in vegetation cover between the urban core and peripheral areas, we developed two vegetation indices, the vegetation influence strength index (VISI) and the vegetation restoration index (VRI), using normalized difference vegetation index datasets and nighttime stable light data from 50 cities in southern China. Using these two indices, we clustered the cities into four types based on their vegetation cover characteristics. The city types varied among the different regions of the study area and cities of the same type tended to occur together geographically. In addition, the two indices showed temporal changes during the study period: A downtrend from 1992 to 2000, an uptrend from 2000 to 2005, and stability from 2005 to 2013. Furthermore, in all cities, the range of the VISI was larger in the peripheral areas than in the urban core areas. However, the range of the VRI was smaller in the peripheral areas than in the urban core areas. As the distance to the urban core areas increased, the fluctuation range of both the VISI and VRI decreased, suggesting that there was less vegetation disturbance farther from the urban core areas. We also showed that changes in vegetation cover were related to differences in urbanization rates, gross domestic products, population densities, and stages of urban development among the cities. These results provide scientific support for urban planning and sustainable development in rapid urbanization areas.
1. Introduction
The urbanization process, which is a type of extreme anthropogenic landscape change, includes urban expansion, population growth and migration, and economic development; the process is accelerating worldwide [1]. Urban expansion is more likely to take place in peripheral areas, resulting in the radial development of urban core areas. China has undergone rapid urbanization since the 1980s, when the opening-up policy was first implemented [2]. Urbanization has caused some environmental problems, such as the urban heat island effect and air and water pollution, which constitute significant threats to human health. There is a growing need to combat these problems.
Vegetation cover changes, which have been regarded as an essential part of global changes in terrestrial ecosystems [3], are long and complicated processes and are strongly influenced by urbanization [4]. As an integral component of the urban environment, vegetation plays vital roles in urban ecosystems [5]. Urban vegetation patches are essential for birds and other animals. Urban vegetation also provides other crucial ecosystem services, including reducing noise [6], absorbing pollution [7,8], improving air quality [9], mitigating the urban heat island effect [10], and conserving soil and water. Plants can be affected during the processes of the initial habitat transformation or during landscape fragmentation [11]; as a result, the vegetation conditions in urban and peripheral areas are important indicators of urbanization pressure on biodiversity. On the other hand, vegetation patches, which are included in urban planning and design, are expected to increase aesthetic value and provide recreational spaces in cities [12].
Urban expansion converts forests, grasslands, and croplands to impervious surfaces [13] and alters the composition and structure of the ecosystem, thus decreasing the ability of the ecosystem to provide ecosystem services [14]. Rapidly urbanized cities were found to have a high probability of vegetation degradation (a reduced vegetation amount and quality); however, some studies have found that not all rapidly urbanized cities experience extreme vegetation degradation. Some large cities may experience vegetation restoration (an increased vegetation amount and quality) rather than degradation because the percent of vegetation degradation decreases as the urban area is enlarged through the process of urban expansion [15]. The influence of urbanization on vegetation is different among cities, and the degree of its influence may vary among different periods. Vegetation in urban areas may be destroyed at the early stage of urbanization and then be restored gradually later as a result of vegetation restoration and conservation efforts.
Urban peripheral areas, especially areas without vegetation, are typically chosen for urban expansion [16]. The existence of vegetation remnants in these areas, on the other hand, presents opportunities for vegetation conservation [17] and for city dwellers to stay close to nature. In addition, vegetation in peripheral areas as well as in urban core areas is a good indicator of the intensity of urbanization pressure on biodiversity [15]. Thus, vegetation in peripheral areas should be considered in studies of urban vegetation change.
Previous studies have explored changes in vegetation cover at various temporal and spatial scales [18,19,20]. The indicators of vegetation include net primary production (NPP), the leaf area index (LAI), and the normalized difference vegetation index (NDVI) [21,22,23]; these indicators reflect vegetation conditions in different ways. The factors affecting vegetation change include natural and anthropogenic variables [24]. At a global scale, the variations in vegetation cover can be mostly attributed to climate [25], water availability and drought [26]. However, urbanization was found to have a disproportionately negative effect on vegetation [27]. Human activities have greatly intensified beyond the original urban fringe; urban extension, rather than climate fluctuations, was shown to be the main cause of changes in the regional net primary productivity of urban vegetation [28]. Vegetation cover changes are also affected by population migration, which greatly changes the size and structure of the initial human population of a city [29]. However, previous studies have not systematically characterized the changes in vegetation cover in the urban core and peripheral areas at different distances from the urban core. Limited attention has been given to the variations in vegetation cover changes in different peripheral areas and the effects of urbanization on vegetation in different cities. Comprehensive analyses of the influence of urbanization on the surrounding vegetation remain limited.
As a typical rapid urbanization area, the hilly red soil region of southern China was chosen as the study area for this research. The population density in this area is relatively high, and the economic conditions have developed well since the establishment of the socialist market economy system in 1992. The urban areas in this region started to expand rapidly at that point, which had a significant influence on the vegetation coverage. Therefore, the vegetation cover change and the effects of urbanization on vegetation cover have attracted great interest from different governmental organizations and the scientific community. In this study, we developed two vegetation indices to analyse the process of vegetation cover change (including all types of vegetation cover, such as cropland, forest, grassland, and others) and the effects of urbanization on vegetation cover in urban cores and peripheral areas in the study region using multiple satellite datasets as sources. The objectives of this study were 1) to test and explore the variations in and regional characteristics of vegetation cover change by performing clustering analysis on the vegetation indices of different cities, 2) to explore the spatial-temporal patterns and processes of urban expansion, 3) to characterize the spatial-temporal dynamics of the vegetation in the urban core and the three different peripheral areas, and 4) to examine the relationships between urbanization and vegetation cover change.
2. Materials and Methods
2.1. Study Area
The hilly red soil region of southern China (107°50′–112°51′ E, 21°48′–31°06′ N) has a total area of approximately 796,000 km2, which is approximately 10.4% of the area of the entire country. The study area has undulating topography, with the Wu and Ba Mountains in the west and the Yunnan–Guizhou Plateau at the southwest boundary. Hills and low mountains are the main landscape forms [30], but there are also plains, such as the Dongting Lake Plain and the Poyang Lake Plain. The study area stretches from Dabie Mountain in the north to the ocean in the southeast. The study area includes eight provinces, including all of Jiangxi and Fujian and parts of Hubei, Hunan, Anhui, Guangxi, Guangdong and Zhejiang (Figure 1). The hilly red soil region of southern China is a rapid urbanization area that contains the full extents of 50 cities that are completely included in the study area. The most developed cities include Changsha, Quanzhou, and Hangzhou, which had gross domestic products (GDPs) of 639.6, 521.7, and 469.4 billion yuan, respectively, in 2013. The least developed city was Chizhou, which had a GDP of 19.8 billion yuan. The cities with the largest and smallest populations are Wenzhou and Xinyu, which have populations of 8073.2 and 330.0 thousand, respectively. The area experiences a subtropical humid monsoon climate due to its complex topography and specific location. The average annual precipitation is above 800 mm, and the average annual temperature is 11–23 °C. The study area is rich in water resources and includes many rivers and lakes, such as the middle and lower reaches of the Yangtze River, the Zhujiang River and its tributaries, Poyang Lake, and Dongting Lake. These water bodies play vital roles in water conservation, water level regulation and providing water for vegetation. The soils are heavily weathered, and severe erosion can occur in some parts of the study area because the soil layer is so thin [31].
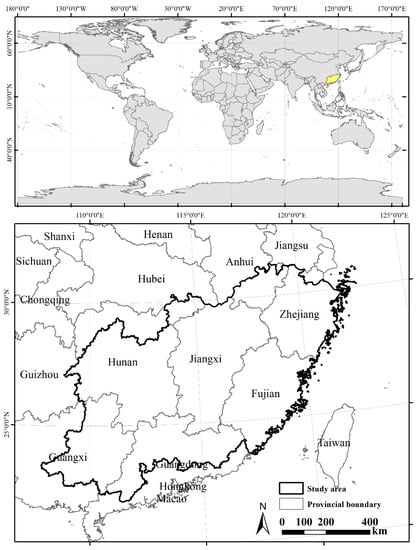
Figure 1.
Location of the study area.
2.2. Data and Pre-processing
The data used in this study included the NDVI dataset, land use and land cover data, nighttime light (NTL) data from the Defense Meteorological Satellite Program (DMSP)/Operational Linescan System (OLS), and socio-economic statistical data (Table 1). Two types of NDVI data were used: the third-generation Global Inventory Modeling and Mapping Studies NDVI (GIMMS NDVI 3 g) and Aqua/MODIS (MYD) 13 Q1. The GIMMS NDVI used in this study provided the data from 1992 to 2006, which have a spatial resolution of 8 km and a temporal resolution of 15 days. The vegetation data from 2000 to 2013 were based on the MODIS MYD 13 Q1 dataset, which contains 16-day composites with a spatial resolution of 250 m. The maximum-value composite (MVC) method was used to obtain the maximum NDVI in each year. As the two types of NDVI were obtained from different sensors, a consistency check was necessary. Random sample points were extracted from the overlapping years (2000 to 2006) of the two NDVI datasets, and a correlation analysis was performed. The inversion model that showed significant consistency was selected as the best model for transforming the GIMMS NDVI data.

Table 1.
Description of the datasets used in this study.
The DMSP-OLS NTL data, version 4, from 1992 to 2013 were obtained from the National Geophysical Data Center (NGDC) at the National Oceanic and Atmospheric Administration; these data show strong relationships to urban expansion [32], GDP status [33], and population change [34]. In this study, a stable light composite was used for further processing. The pixel value had a range of 1 to 63, which was the average of the visible-band digital number (DN) values indicating the average NTL intensity from cities, towns, and other persistent lighting sources observed in each year [35].
The land use/cover data were acquired from the Resources and Environment Data Center of the Chinese Academy of Science. The dataset was produced using Landsat TM images by the visual interpretation method and had a spatial resolution of 30 m. This dataset was utilized as ancillary information in extracting the urban areas of each city from the DMSP-OLS NTL data. All the data were projected to the Lambert azimuthal equal-area projection and resampled to the same pixel size (250 m).
2.3. Research Methods
2.3.1. Linear Regression Analysis
Linear regression analysis was used in this study to identify the spatial and temporal variation trends of the annual vegetation cover change. The slope coefficients of the trend lines were calculated based on the pixel values of the NDVI dataset. The equation for the slope coefficient [22] is as follows:
where slope is the slope coefficient of the trend line, n is the total number of years in the study period, i is the number of the individual study years, and NDVIi is the maximum NDVI value in year i. The vegetation cover exhibits an increasing trend when the slope > 0, whereas it indicates a decreasing trend when the slope < 0.
2.3.2. Extracting Urban Core and Peripheral Areas
Some methods were developed to extract urban areas, such as the support vector machine (SVM) method [36,37], the empirical thresholding technique [38], and the thresholding technique based on mutation detection [39]. The thresholding technique with ancillary data from urban areas was proven to be an efficient method and has been widely applied due to its simplicity and accuracy [40]. In this study, this thresholding technique was used, and the ancillary data were the land use/land cover data.
The areas of the urban core of each city were acquired from the land use/land cover data for 1990, 1995, 2000, 2005, 2010, and 2015. In this study, the increasing rate of each city was assumed to be stable during these periods, so the urban areas for years that had no land use/land cover data were interpolated by using the data for the two closest years. For example, the increasing rate of the urban core areas were considered stable during 1995 and 2000, and the urban core areas in 1996, 1997, 1998, and 1999 were interpolated based on the urban core areas in 1995 and 2000. In this way, the urban statistical areas of the cities in each year from 1992 to 2013 were obtained. Extracting the urban areas based on a single threshold would not have been an appropriate approach due to the variations in physical environments and economic development levels among the cities in the study area [36]. Therefore, all the urban core areas of different cities and different years were extracted using different thresholds, which were achieved based on the NTL data and the urban statistical areas. Before extracting the urban core areas, the NTL data of each city were derived according to the administrative boundaries. The cumulative pixel areas from the largest value to each of the remaining values were calculated for each city. The value was selected as the threshold when the absolute values of the cumulative pixel areas and the urban statistical areas were the lowest. All the regions that had NTL values above the threshold were identified as the urban core areas. A safeguard ensuring that the area extracted in the previous year would remain urban in subsequent years was implemented when extracting the urban areas [41]. In this way, the urban areas remained spatially and temporally continuous. Finally, the spatial distributions of the urban core areas in each year were extracted respectively by using these thresholds in the ArcGIS software. To detect the effects of urbanization on the vegetation around the urban core areas, three buffers of 5, 10, and 15 km from the boundary of each urban core area were created (Figure 2). The peripheral areas in this study did not include the urban core areas, and the three buffers were located outside the urban matrix. Any urban core buffer that stretched to the boundary of a nearby city was removed.
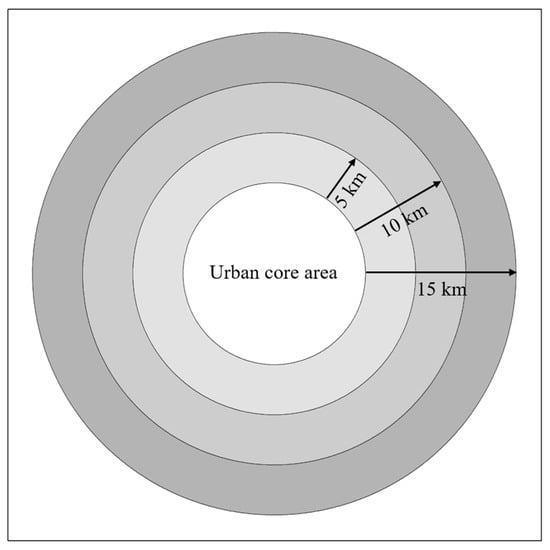
Figure 2.
Schematic diagram of the urban core area and the buffers of 5, 10 and 15 km.
2.3.3. Indicators of Urbanization and Vegetation
To assess the influence of urbanization on vegetation cover change, two indices were constructed and calculated based on the results of the linear regression analysis of the vegetation in the urban core and the buffers. The vegetation influence strength index (VISI) was constructed to reflect the vegetation cover change between two specific years. The VISI equation is as follows:
where VISIc is the VISI in the urban core, slopec is the mean value of the calculated slopes of all the pixels in the urban core, i is the distance of the buffer from the urban core, VISIBi is the VISI in buffer i, slopei is the mean value of the calculated slope of all the pixels within buffer i, and Bi represents the 5, 10, and 15 km buffers used in this study.
VISIc = slopec
VISIBi = slopeei
The vegetation restoration index (VRI) characterizes the vegetation restoration conditions and reflects the rate of vegetation cover increase. VRI is calculated as follows:
where VRIc is the VRI of the urban core, S is the total area of pixels with an increasing trend of vegetation cover (slope > 0) within the urban core, Sc is the area of the urban core, VRIBi is the VRI in the different peripheral areas, Bi represents the buffers of the urban core, Si is the total area with slope pixel values below 0, and SBi is the total area of Bi.
VRIc = S/Sc
VRIBi = Si/SBi
All the indicators described above were calculated for the complete area of each city during each time interval in the study area. To analyse the characteristics of the indices for the cities, K-means cluster analysis was used to classify the cities into several types based on the values of the indices. The cluster analysis numerically divided the cities into an appropriate number of clusters based on their quantitative traits (the values of the indices) and it put similar entities into the same cluster [42].
VISI and VRI reflect vegetation cover changes in two different ways. A higher VISI or VRI value indicates that the vegetation cover improved between two specific years, which indicates improvements in ecosystem services and biodiversity. Different strategies for green space planning can be developed based on the characteristics of these vegetation indices.
3. Results
3.1. Classification of Vegetation Cover Change in Cities and Its Attributes
The total extents of 50 cities were completely included in the study area. All intact cities were classified into groups based on their VISI and VRI values from 2000 to 2013 using the K-means cluster method. To make the classification reflect the variations in the vegetation cover change and to avoid producing small clusters of only a few cities, four types were determined to be the optimal classification choice. The results of the cluster analysis are provided in Table 2, and the spatial distribution of the cities in the four types is shown in Figure 3.
Table 2.
Classification of vegetation variation dynamics from 1992 to 2013.
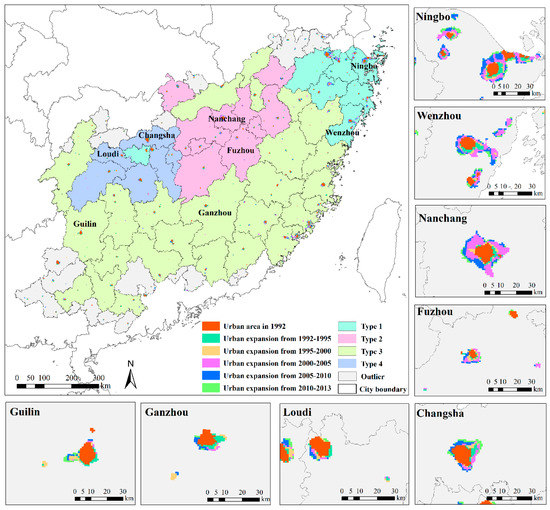
Figure 3.
Urban expansion of major cities from 1992 to 2013 and the spatial distribution for the four vegetation types based on the cluster analysis. The urban expansion of two typical cities was selected to display each type.
Type 1 included 8 cities with a total area of 64,640 km2 that covered 8.1% of the entire study area. Although the number of Type 1 cities was not the lowest, the total area of the Type 1 cities was the smallest among the four types. Nine cities were classified as Type 2 cities, covering an area of 108,260 km2. The average area of the Type 2 cities was much larger than that of the Type 1 cities. There were 27 Type 3 cities; their total area was 407,383 km2, which was the largest total size among all the types.
The spatial pattern and the distribution of the four types had obvious zonal characteristics. Almost all the cities of the same type were spatially clustered together, except for a few cities (Figure 3). The Type 1 cities were mainly located in the northeastern part of the study area. This region is next to the East China Sea and has a subtropical monsoon climate. Its unique and advantageous geographical location has made this region an area of rapid economic development. Type 2 and Type 4 cities were distributed in the northern and northwestern parts of the study area, respectively. Both these types had relatively flat terrain conditions. Type 2 cities were mostly located in and around the Poyang Lake Plain, and Type 4 cities were located to the south of the Dongting Lake Plain. The average elevations of Type 2 and Type 4 cities were the lowest among the city types. The cities from the southeast to the southwest of the study area and several cities in the northern part of Poyang Lake Plain were grouped into Type 3. Most of this area is dominated by rolling hills, and this region is characterized by relatively steep slopes and fragmented landscapes.
The trend of the spatial vegetation dynamics for typical cities from 1992 to 2013 (Figure 4) illustrates that vegetation in areas exhibiting decreasing trends were mostly concentrated in and around the urban core areas, and the vegetation far away from the urban core areas remained relatively stable or exhibited an increasing trend during this period. Big differences also existed for the extent of the vegetation which were affected in and around the urban core areas.
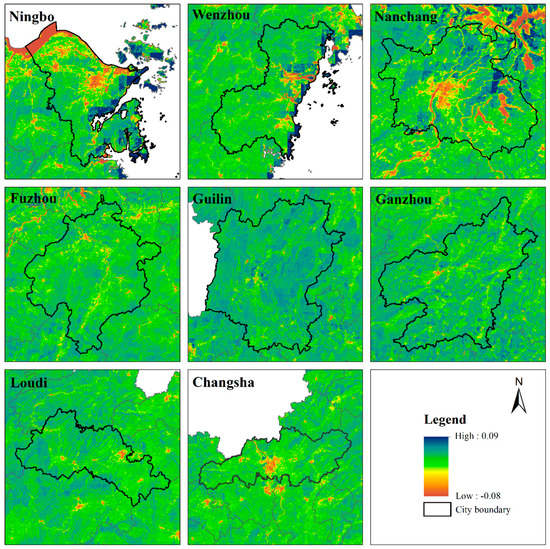
Figure 4.
The trend of the spatial vegetation dynamics for typical cities from 1992 to 2013.
3.2. Characteristics of Urban Expansion
Based on the statistical data from the land use dataset and the DMSP-OLS NTL data, the overall urban core areas were extracted for the years from 1992 to 2013 (Figure 3). The urban expansion in each period is depicted in different colours. The expansion in the spatial extents of the urban core areas is largely dependent on the increase in the population and activities of each urban area. Therefore, the spatial expansion of urban areas represents an increase in urban activities, population and changes in urban landscapes [37]. Generally, the urban growth in the study area occurred radially during the study period. The provincial capital cities, including Changsha, Nanchang, Hangzhou, and Fuzhou, expanded rapidly. Most of the Type 1 cities, such as Ningbo, Wenzhou, Shaoxing, Jinhua, and Zhoushan, are located next to the sea. Urban expansion in these cities showed an elongating growth pattern and extended in the direction of the sea. Another typical expansion pattern showed disaggregated growth in the urban core areas, and the cities with this growth pattern, including Ganzhou, Huaihua, Longyan, and Yongzhou, were located in several areas of the study region.
The statistical analyses of the urbanization rates of the four city types is illustrated in Figure 5. The study area experienced rapid urban expansion, with an average increasing rate of 0.98 per year from 1992 to 2013. However, the statistical results indicated uneven spatial urbanization levels for the different cities. Type 1 cities had the average highest urbanization rate, with a median of 1.77, which differed significantly from the medians of Type 3 and Type 4 cities. The highest and lowest urbanization rates in Type 1 cities were 3.28 and 0.38, respectively. In contrast, Type 4 cities had the slowest urban development of the four city types, with a median urbanization rate of 0.42. Type 2 and Type 3 cities exhibited intermediate levels of urbanization. Both of these types had relatively high urbanization rates, 2.49 and 2.55, and their medians were 0.81 and 0.61, respectively.

Figure 5.
Urbanization rate of the four vegetation types from 1992–2013.
3.3. Variations in Vegetation Indicators in the Urban Core and Peripheral Areas
The cities were classified into four types with the K-means method based on the trends of all the vegetation indicators in the urban core areas and peripheral areas. The trajectories of the VISI and VRI are illustrated in Figure 6 and Figure 7.
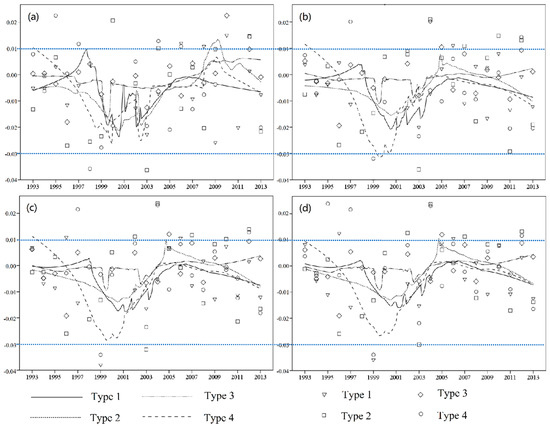
Figure 6.
Temporal distribution of the vegetation influence strength index (VISI) for the urban core (a) and the buffers of 5 km (b), 10 km (c), and 15 km (d) during 1992–2013.
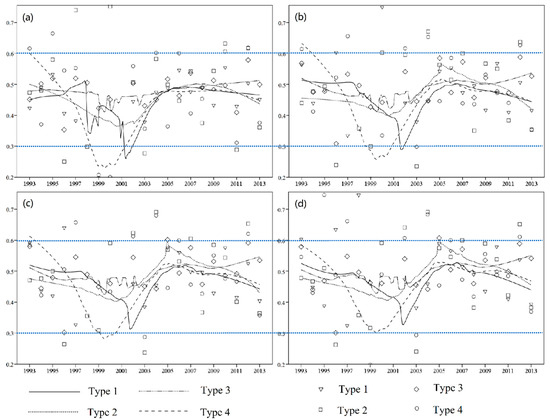
Figure 7.
Temporal distribution of the vegetation restoration index (VRI) for the urban core (a) and the buffers of 5 km (b), 10 km (c), and 15 km (d) during 1992-2013.
The overall trends for the two indices decreased from 1992 to 2000, increased from 2000 to 2005, and then remained steady until 2013. However, the change trends for the different city types during each period varied considerably. The range of the fluctuations (the range of the highest and the lowest values on the curve) for the VISI in the buffers was larger than that in the urban core areas (Figure 6). However, for VRI, the fluctuation range in the urban core was larger than that in the buffers (Figure 7). The differences in the fluctuation ranges of the VISI and VRI in the different buffers were notable. The fluctuation ranges of both VISI and VRI decreased with increasing buffer distance. For example, the range of VISI for Type 4 cities in the 5 km buffer is larger than that in the 15 km buffer (the fluctuation range of VISI for Type 4 cities exceeds the two blue dashed horizontal lines in the 5 km buffer in the figure, while in the 15 km buffer, the fluctuation range is within the two blue dashed horizontal lines). The results indicate that the vegetation near the urban core areas is more likely to be disturbed, including by restoration and degradation, and that the vegetation cover is more stable in areas far from the urban core areas than in areas close to the urban core areas.
The differences in the change trends between the indices for the urban core areas and the buffers varied greatly; however, these indices exhibited similar change trends for the three buffers. The VISI and VRI exhibited more drastic fluctuations in the urban core areas than in the buffers, especially from 1997 to 2005. The VISI was higher in the urban core areas than in the buffers from 2005 to 2013, and the VISIc values were above zero except in Type 1 cities during the same period. These results indicate that the overall quality of the vegetation recovered during this period in the urban core areas. In contrast, the VRIc was relatively more stable than the VISIc from 2005 to 2013. The VRI values in the buffers showed slight decreasing trends, except the values in Type 3 cities, which exhibited increasing trends from 2009 to 2013.
The VISIc in Type 1 cities showed more fluctuation than the VISI in the buffers, and these fluctuations mainly occurred from 2000 to 2005. The change trend of VRI for Type 1 cities also showed drastic fluctuations from 1998 to 2005; in the buffers, the VRI decreased slightly from 1998 to 2000, decreased dramatically in 2002, and then showed increasing trends in the following years until 2005. The indices for Type 4 cities exhibited the largest fluctuations among the four city types. For Type 3 cities, the vegetation conditions were the most stable; the indices were almost stationary and exhibited only slight increases and decreases from 1999 to 2005.
4. Discussion
4.1. The Effect of Urban Expansion on Vegetation
The main forces driving the rapid urbanization of China are generally considered to be population and economic growth [43]. The immigration of people from rural to urban areas, investments in fixed assets, and GDP growth can directly result in urban expansion [44]. In addition, globalization has also been regarded as another driving factor of urban expansion since the 21st century, especially in the coastal zone of China [45]. Generally, urbanization shows significant positive correlations with increases in built-up land and decreases in vegetative cover [46]. On the other hand, as an increasing number of people migrate into urban areas and make their homes there, urban vegetation, which affects the majority of the world’s population by providing ecosystem services [47], has drawn much more attention. Vegetation is not protected in the process of urbanization, but the inevitably destroyed vegetation may recover within a short period. In addition, as urbanization rates and environmental protection awareness levels differ among cities, the vegetation cover change in the study area varied greatly in different regions as well as in different time periods.
The economy has exhibited an upward trajectory since the establishment of the socialist market economy system in 1992, and urban areas started to expand rapidly at that time. Almost all the cities in the study area experienced vegetation degradation from 1992 to 2000. Environmental protection was ignored, and vegetation was largely destroyed by urbanization at this stage, especially in Type 4 cities (Figure 6 and Figure 7). In addition, other potential factors influenced vegetation degradation. The construction or enlargement of infrastructure, such as streets, and the increase in industry and residential buildings reduced the total area of urban vegetation. The vegetation loss in the urban core areas was mostly caused by insufficient urban green space management efforts. In the peripheral areas, vegetation loss was mainly attributed to the needs of urban expansion at the cost of natural and semi-natural vegetation [12]. The environment has been damaged in many parts of China, which has resulted in serious natural disasters such as floods, droughts, and air pollution. A series of policies to address these issues has been implemented since 1999, including the Grain for Green Project and the natural forest protection project. In addition, construction projects, which can also cause serious soil erosion, have drawn the attention of managers and policy makers. Rules and technical standards for construction projects to eliminate vegetation deterioration and accelerate vegetation restoration started to be promulgated in 1998. Due to these measures, the overall condition of vegetation in China was restored. The vegetation in the urban cores and peripheral areas of the cities in the study area recovered gradually starting in 1999 (Figure 6 and Figure 7) and then remained relatively stable from 2005 to 2013. During this period, the disturbed or eliminated vegetation was recovered by intensive vegetation restoration strategies such as replanting efforts and carefully implemented management measures.
Vegetation cover change varied regionally in the study area, and its driving factors were also different. For the individual city types, the maximum VISI values in the urban core areas were higher than those in the three peripheral areas. For example, the peak values of VISIc for Type 1 and Type 2 cities, which were above zero, were higher than the VISI values of the three corresponding peripheral areas from 1992 to 2000 and 2000 to 2013, respectively. VISI values above zero indicated vegetation restoration. Therefore, the phenomena described above may stem from the positive human influence on urban vegetation, such as urban planning that includes more green space and regular irrigation of street trees, grassland, and parks [15]. On the other hand, the vegetation in the urban core areas was less likely to be removed than the vegetation in the peripheral areas, which was often destroyed due to urbanization. The fluctuation ranges of the VISI and VRI decreased with increasing buffer distance. This was mainly the result of the disturbance to vegetation caused by urban expansion. The decrease in vegetation in the peripheral areas near urban core areas was mainly caused by the elimination of vegetation to develop housing projects that included little vegetation [12]. The overall GDPs of cities of all four types increased from 1992 to 2013, which indicated that the upward trends in the economy did not necessarily result in regional vegetation degradation. Wealthier neighbourhoods may have more vegetation than poorer neighbourhoods [48]. The GDPs of the Type 2 cities were the lowest of the four types (Figure 8a), which could explain the relatively high levels of the VISI for Type 2 cities from 2000 to 2013. However, the vegetation cover change varied by region. The Type 1 cities had the highest GDPs, while their VISI and VRI values were relatively low, especially in 2000 and 2013.
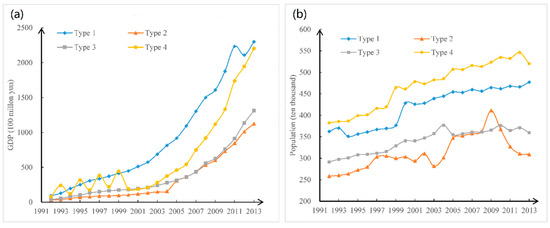
Figure 8.
The average gross domestic product (GDP) (a) and population (b) of cities for the four types from 1992 to 2013.
The influence of urbanization on vegetation cover change may vary not only in different regions but also in different stages. Vegetation change during urban expansion can be separated into an early stage and an advanced stage. In the early stage of urban expansion, natural lands on the outskirts of cities are developed to accommodate the increasing population of people migrating from rural areas, which has a negative effect on vegetation. In the advanced stages, more emphasis is paid to the urban ecosystem, and more protection measures are implemented to meet the need for additional green space [49]. The urbanization rates and development stages varied greatly among the four types of cities; therefore, the strength and duration of the effects of urban expansion on vegetation also differed in different regions of the study area.
4.2. Effective Strategies for Sustainability in Urban Development
Urban peripheral areas frequently experience urban expansion or green space planning initially; however, restored forests or grasslands may become occupied and become an obstruction to the process of urbanization [50]. Increases in low-density land use and even vacant lands occur in the newly expanded regions, which emphasizes the urgent need for smart growth strategies to improve land use efficiency [44]. At a high pace of urban expansion, the periphery of a newly urbanized area will be used for urbanization, and the existing and restored vegetation will subsequently be disturbed or disappear. The vegetation loss in the peripheral areas also weakens the provision of ecosystem services. As a result, peripheral areas as well as urban core areas, which are crucial for the sustainability of urban development, should be considered in future urban planning and its implementation [50].
Urban sustainability is about supplying enough spaces that increase the quality of life of both current and future inhabitants [12]. The negative impacts of the lack of vegetation urgently need to be mitigated. The indices constructed in this study have the ability to reflect the vegetation cover change in urban cores and peripheral areas from different perspectives. The results indicated obvious regional variations in vegetation cover change. Therefore, vegetation management strategies should be developed according to the characteristics of the development and socio-economic conditions of different regions. In these strategies, more attention would be paid to the cities with high urbanization rates and low VISI and VRI values. Land use management policies should also be carried out strictly in regions with underdeveloped cities to prevent environmental protection from being neglected in pursuit of economic development.
The landscape patterns in urban core areas are quite different from those in peripheral areas. Therefore, vegetation conservation strategies should be developed independently for these areas. Urban core areas have highly aggregated built-up areas, so large parks and well-distributed and appropriately connected green spaces can be effective in improving the supply of ecosystem services. Reasonable planning should be done for peripheral areas that will be used for urban expansion. The destruction of natural and semi-natural vegetation in these regions should be avoided to the greatest extent possible, and the vegetation around the newly built-up areas should be recovered under effective management plans.
Policies about ecological protection have achieved remarkable success and should be enforced in the future [51]. These policies may result in different efficiencies in cities of different types. For example, the Grain for Green project mainly focuses on sloped lands; this project would achieve better results in Type 3 cities than in Type 4 cities because Type 3 cities have more hills and mountains, while the terrain in Type 4 cities is flatter. As the VISI and VRI reflect vegetation conditions and historical dynamics, policies could be made according to the characteristics of different regions as well as these vegetation indices. However, it is not enough to alleviate environmental change by implementing conservation strategies alone; controlling the acceleration of urbanization is also an efficient strategy. Buildings that remain unfinished due to lack of investment exist in the peripheral regions of cities, which could result in insufficient use of the land and decreases in vegetation. The intensive and effective use of urban land rather than rapid urban expansion should be emphasized in the future.
5. Conclusions
Rapid urbanization promotes economic prosperity and has significant effects on vegetation. The results of this study showed that vegetation cover change in the study area had obvious regional characteristics. Almost all the cities classified as the same type were located close together geographically. The patterns of urban expansion and the urbanization rates were different among the four types. Several vegetation indices were proposed, including VISI and VRI, to reflect the vegetation conditions in the urban core and peripheral areas. The indices generally decreased from 1992 to 2000, exhibited an increase from 2000 to 2005 and stayed relatively stable until 2013. The range of the fluctuations in the VISI in the peripheral areas was larger than that in the urban core areas. However, the VRI showed the opposite trend. The fluctuation ranges of both VISI and VRI decreased with increasing buffer distance, indicating that the vegetation was less likely to be disturbed in places far from the urban core areas than in regions close to the urban core areas. However, the strength of the effects of urbanization on vegetation and the duration of its influence varied significantly among cities of different types. The effect of urbanization on vegetation change varied not only in different regions but also in different stages of urban expansion. Immigration to urban areas for employment as well as GDP growth directly resulted in urban expansion; however, continuous economic and population growth did not necessarily result in regional vegetation degradation. In the early stage of urban expansion, natural lands in peripheral areas are developed to build new urban areas; in the advanced stage, vegetation is restored to meet the need for more green spaces.
The vegetation in peripheral areas together with that in urban core areas plays an important role in the provision of ecosystem services; therefore, peripheral areas should be included in future urban planning. The vegetation conservation strategies for these areas should be developed independently due to the different characteristics of their vegetation cover changes. The conclusions of this study provide valuable support for regional sustainable development. The methods and indicators from this study could also be used in other rapid urbanization areas. The quantitative relationships between urbanization and vegetation cover change will be analysed in further detail in the future.
Author Contributions
Conceptualization, Z.L.; methology, T.W.; formal analysis, Y.Z. and M.T.; software, J.L.; investigaton, J.L.; resources, T.W.; writing—original draft, Y.Z.; writing—review and editing, Z.L. and P.W.; validation, Y.G. All authors have read and agreed to the published version of the manuscript.
Funding
Financial support for this research was provided by the National Key Research and Development Program of China (no. 2017YFC0505302), the National Natural Science Foundation of China (no. 41877071; no. 41807064), and the Fundamental Research Funds for the Central Universities (no. 2662017QD002).
Acknowledgments
We would like to acknowledge Zhaogui Yan for his carefully revising of this manuscript and his valuable suggestions.
Conflicts of Interest
The authors declare no conflict of interest.
References
- Wen, Q.; Zhang, Z.; Shi, L.; Zhao, X.; Fang, L.; Xu, J. Extraction of basic trends of urban expansion in China over past 40 years from satellite images. Chin. Geogr. Sci. 2016, 26, 129–142. [Google Scholar] [CrossRef]
- Buyantuyev, A.; Wu, J.G.; Gries, C. Multiscale analysis of the urbanization pattern of the Phoenix metropolitan landscape of USA: Time, space and thematic resolution. Landsc. Urban Plan. 2010, 94, 206–217. [Google Scholar] [CrossRef]
- Li, C.L.; Filho, W.L.; Yin, J.; Hu, R.; Wang, J.; Yang, C.S.; Yin, S.; Bao, Y.H.; Ayal, D.Y. Assessing vegetation response to multi-time scale drought across inner Mongolia plateau. J. Clean. Prod. 2018, 179, 210–216. [Google Scholar] [CrossRef]
- Wu, S.; Zhou, S.; Chen, D.; Wei, Z.; Dai, L.; Li, X. Determining the contributions of urbanization and climate change to NPP variations over the last decade in the Yangtze River Delta China. Sci. Total Environ. 2014, 472, 397. [Google Scholar] [CrossRef]
- Jim, C.Y.; Chen, W.Y. Ecosystem services and valuation of urban forests in China. Cities 2009, 26, 187–194. [Google Scholar] [CrossRef]
- Pathak, V.; Tripathi, B.D.; Mishra, V.K. Evaluation of anticipated performance INDEX of some tree species for green belt development to mitigate traffic generated noise. Urban For. Urban Gree. 2011, 10, 61–66. [Google Scholar] [CrossRef]
- Qiu, T.; Song, C.H.; Li, J.X. Impacts of urbanization on vegetation phenology over the past three decades in Shanghai, China. Remote Sens. 2007, 9, 970. [Google Scholar] [CrossRef]
- Nowak, D.J.; Crane, D.E.; Stevens, J.C. Air pollution removal by urban trees and shrubs in the United States. Urban For. Urban Gree. 2006, 4, 115–123. [Google Scholar] [CrossRef]
- Escobedo, F.J.; Kroeger, T.; Wagner, J.E. Urban forests and pollution mitigation: Analyzing ecosystem services and disservices. Environ. Pollut. 2011, 159, 2078–2087. [Google Scholar] [CrossRef]
- Donovan, G.H.; Butry, D.T. The value of shade: Estimating the effect of urban trees on summertime electricity use. Energ. Buildings 2009, 41, 662–668. [Google Scholar] [CrossRef]
- Hahs, A.; McDonnell, M.; McCarthy, M.; Vesk, P.; Corlett, R.; Norton, B.; Clemants, S.E.; Duncan, R.P.; Thompson, K.; Schwartz, M.W.; et al. A global synthesis of plant extinction rates in urban areas. Ecol. Lett. 2009, 12, 1165–1173. [Google Scholar] [CrossRef] [PubMed]
- Barrera, F.D.L.; Henríquez, C. Vegetation cover change in growing urban agglomerations in Chile. Ecol. Indic. 2017, 81, 265–273. [Google Scholar] [CrossRef]
- Xie, W.X.; Huang, Q.X.; He, C.Y.; Zhao, X. Projecting the impacts of urban expansion on simultaneous losses of ecosystem services: A case study in Beijing, China. Ecol. Indic. 2018, 84, 183–193. [Google Scholar] [CrossRef]
- Delphin, S.; Escobedo, F.J.; Abd-Elrahman, A.; Cropper, W.P. Urbanization as a land use change driver of forest ecosystem services. Land Use Policy 2016, 54, 188–199. [Google Scholar] [CrossRef]
- Liu, Y.X.; Wang, Y.L.; Peng, J.; Du, Y.Y.; Liu, X.F.; Li, S.S.; Zhang, D.H. Correlations between Urbanization and Vegetation Degradation across the World’s Metropolises Using DMSP/OLS Nighttime Light Data. Remote Sens. 2015, 7, 2067–2088. [Google Scholar] [CrossRef]
- Merlín-Uribe, Y.; Contreras-Hernández, A.; Astier-Calderón, M.; Jensen, O.P.; Zaragoza, R.; Zambrano, L. Urban expansion into a protected natural area in Mexico City: Alternative management scenarios. J. Environ. Plann. Manag. 2013, 56, 398–441. [Google Scholar] [CrossRef]
- Radford, K.G.; James, P. Changes in the value of ecosystem services along a rural urban gradient: A case study of Greater Manchester, UK. Landsc. Urban Plann. 2013, 109, 117–127. [Google Scholar] [CrossRef]
- Wen, Z.F.; Wu, S.J.; Chen, J.L.; Lü, M.Q. NDVI indicated long-term interannual changes in vegetation activities and their responses to climatic and anthropogenic factors in the Three Gorges Reservoir Region, China. Sci. Total Environ. 2017, 574, 947–959. [Google Scholar] [CrossRef]
- Chi, D.K.; Wang, H.; Li, X.B.; Liu, H.H.; Li, X.H. Assessing the effects of grazing on variations of vegetation NPP in the Xilingol Grassland, China, using a grazing pressure index. Ecol. Indic. 2018, 88, 372–383. [Google Scholar] [CrossRef]
- Qu, S.; Wang, L.C.; Lin, A.W.; Zhu, H.J.; Yuan, M.X. What drives the vegetation restoration in Yangtze River basin, China: Climate change or anthropogenic factors? Ecol. Indic. 2018, 90, 438–450. [Google Scholar] [CrossRef]
- Yan, Y.C.; Liu, X.P.; Wang, F.Y.; Li, X.; Qu, J.P.; Wen, Y.Y.; Liang, X. Assessing the impacts of urban sprawl on net primary productivity using fusion of Landsat and MODIS data. Sci. Total Environ. 2018, 613–614, 1417–1429. [Google Scholar] [CrossRef] [PubMed]
- Jiapaer, G.L.; Liang, S.L.; Yi, Q.X.; Liu, J.P. Vegetation dynamics and responses to recent climate change in Xinjiang using leaf area index as an indicator. Ecol. Indic. 2015, 58, 64–76. [Google Scholar]
- Xu, H.J.; Wang, X.P.; Zhang, X.X. Decreased vegetation growth in response to summer drought in Central Asia from 2000 to 2012. Int. J. App. Earth Obs. Geoinf. 2016, 52, 390–402. [Google Scholar] [CrossRef]
- Giri, C.; Long, J.; Abbas, S.; Murali, R.M.; Qamer, F.M.; Pengra, B.; Thau, D. Distribution and dynamics of mangrove forests of South Asia. J. Environ. Manag. 2015, 148, 101–111. [Google Scholar] [CrossRef]
- Nemani, R.R.; Keeling, C.D.; Hashimoto, H.; William, M.J.; Stephen, C.P.; Compton, J.T.; Ranga, M.B.; Running, S.W. Climate-driven increases in global terrestrial net primary production from 1982 to 1999. Science 2003, 300, 1560–1563. [Google Scholar] [CrossRef]
- Peng, D.L.; Zhang, B.; Wu, C.Y.; Huete, A.R.; Gonsamo, A.; Lei, L.P.; Ponce-Campos, G.E.; Liu, X.J.; Wu, Y.H. Country-level net primary production distribution and response to drought and land cover change. Sci. Total Environ. 2017, 574, 65–77. [Google Scholar] [CrossRef]
- Imhoff, M.L.; Bounoua, L.; DeFries, R.; Lawrence, W.T.; Stutzer, D.; Tucker, C.J.; Ricketts, T. The consequences of urban land transformation on net primary productivity in the United States. Remote Sens. Environ. 2004, 89, 434–443. [Google Scholar] [CrossRef]
- Yu, D.Y.; Shao, H.B.; Shi, P.J.; Zhu, W.Q.; Pan, Y.Z. How does the conversion of land cover to urban use affect net primary productivity? A case study in Shenzhen city, China. Agr. Forest Meteorol. 2009, 149, 2054–2060. [Google Scholar]
- Gesest, K.V.D.; Vrieling, A.; Dietz, T. Migration and environment in Ghana: A cross district analysis of human mobility and vegetation dynamics. Environ. Urban. 2010, 22, 107. [Google Scholar] [CrossRef]
- Liang, Y.; Zhang, B.; Pan, X.Z.; Shi, D.M. Current status and comprehensive control strategies of soil erosion for hilly region in the Southern China. Sci. Soil Water Conserv. 2008, 6, 22–27. [Google Scholar]
- Zhang, X.; Li, Z.W.; Tang, Z.H.; Zeng, G.M.; Huang, J.Q.; Guo, W.; Chen, X.L.; Hirsh, A. Effects of water erosion on the redistribution of soil organic carbon in the hilly red soil region of southern China. Geomorphology 2013, 197, 137–144. [Google Scholar] [CrossRef]
- Liu, Z.F.; He, C.Y.; Zhang, Q.F.; Huang, Q.X.; Yang, Y. Extracting the dynamics of urban expansion in China using DMSP-OLS nighttime light data from 1992 to 2008. Landsc. Urban Plan. 2012, 106, 62–72. [Google Scholar] [CrossRef]
- Chu, L.; Sun, T.C.; Wang, T.W.; Li, Z.X.; Cai, C.F. Evolution and Prediction of Landscape Pattern and Habitat Quality Based on CA-Markov and InVEST Model in Hubei Section of Three Gorges Reservoir Area (TGRA). Sustainability 2018, 10, 3854. [Google Scholar] [CrossRef]
- Bennett, M.M.; Smith, L.C. Advances in using multitemporal night-time lights satellite imagery to detect, estimate, and monitor socioeconomic dynamics. Remote Sens. Environ. 2017, 192, 176–197. [Google Scholar] [CrossRef]
- Zhang, Q.L.; Seto, K.C. Mapping urbanization dynamics at regional and global scales using multi-temporal DMSP/OLS nighttime light data. Remote Sens. Environ. 2011, 115, 2320–2329. [Google Scholar] [CrossRef]
- Cao, X.; Chen, J.; Imura, H.; Higashi, O. A SVM-based method to extract urban areas from DMSP-OLS and SPOT VGT data. Remote Sens. Environ. 2009, 113, 2205–2209. [Google Scholar] [CrossRef]
- Pandey, B.; Joshi, P.K.; Seto, K.C. Monitoring urbanization dynamics in India using DMSP/OLS night time lights and SPOT-VGT data. Int. J. Appl. Earth Obs. Geoinf. 2013, 23, 49–61. [Google Scholar] [CrossRef]
- Henderson, V. The urbanization process and economic growth: The so-what question. J. Econ. Growth 2003, 8, 47–71. [Google Scholar] [CrossRef]
- Imhoff, M.L.; Lawrence, W.T.; Stutzer, D.C.; Elvidge, C.D. A technique for using composite DMSP/OLS ‘City Lights’ satellite data to accurately map urban areas. Remote Sens. Environ. 1997, 61, 361–370. [Google Scholar] [CrossRef]
- Fu, H.Y.; Shao, Z.F.; Fu, F.; Cheng, Q.M. The Dynamic Analysis between Urban Nighttime Economy and Urbanization Using the DMSP/OLS Nighttime Light Data in China from 1992 to 2012. Remote Sens. 2017, 9, 416. [Google Scholar] [CrossRef]
- Wei, Y.; Liu, H.X.; Song, W.; Yu, B.L.; Xiu, C.L. Normalization of time series DMSP-OLS nighttime light images for urban growth analysis with Pseudo Invariant Features. Landsc. Urban Plan. 2014, 128, 1–13. [Google Scholar] [CrossRef]
- Reger, B.; Otte, A.; Waldhardt, R. Identifying patterns of land-cover change and their physical attributes in a marginal European landscape. Landsc. Urban Plan 2007, 81, 104–113. [Google Scholar] [CrossRef]
- Deng, X.Z.; Huang, J.K.; Han, J.Z.; Rozelle, S.; Zhang, J.P.; Li, Z.H. Impact of urbanization on cultivated land changes in China. Land Use Policy 2015, 45, 1–7. [Google Scholar] [CrossRef]
- Kuang, W.H.; Liu, J.Y.; Dong, J.W.; Chi, W.F.; Zhang, C. The rapid and massive urban and industrial land expansions in China between 1990 and A CLUD-based analysis of their trajectories, patterns, and drivers. Landsc. Urban Plan. 2010, 145, 21–33. [Google Scholar] [CrossRef]
- Huang, Z.J.; Wei, Y.D.; He, C.F.; Li, H. Urban land expansion under economic transition in China: A multi-level modeling analysis. Habitat Int. 2015, 47, 69–82. [Google Scholar] [CrossRef]
- Hutyra, L.R.; Yoon, B.; Hepinstall-Cymerman, J.; Alberti, M. Carbon consequences of land cover change and expansion of urban lands: A case study in the Seattle metropolitan region. Landsc. Urban Plan. 2011, 10, 83–93. [Google Scholar] [CrossRef]
- Nesbitt, L.; Meitner, M.J.; Girling, C.; Sheppard, S.R.J.; Lu, Y.H. Who has access to urban vegetation? A spatial analysis of distributional green equity in 10 US cities. Landsc. Urban Plan. 2019, 181, 51–79. [Google Scholar] [CrossRef]
- De la Barrera, F.; Rubio, P.; Banzhaf, E. The value of vegetation cover for ecosystem services in the suburban context. Urban For. Urban Gree. 2016, 16, 110–122. [Google Scholar] [CrossRef]
- Liu, Q.; Yang, Y.; Tian, H.; Zhang, B.; Gu, L. Assessment of human impacts on vegetation in built-up areas in China based on AVHRR, MODIS and DMSP-OLS nighttime light data, 1992–2010. Chin. Geogr. Sci. 2014, 24, 231–244. [Google Scholar] [CrossRef]
- Fu, W.; Lu, Y.H.; Harris, P.; Comber, A.; Wu, L.H. Peri-urbanization may vary with vegetation restoration: A large scale regional analysis. Urban For. Urban Gree. 2018, 29, 77–87. [Google Scholar] [CrossRef]
- Shi, Z.H.; Li, L.; Yin, W.; Ai, L.; Fang, N.F.; Song, Y.T. Use of multi-temporal Landsat images for analyzing forest transition in relation to socioeconomic factors and the environment. Int. J. App. Earth Obs. Geoinf. 2011, 13, 468–476. [Google Scholar] [CrossRef]
Publisher’s Note: MDPI stays neutral with regard to jurisdictional claims in published maps and institutional affiliations. |
© 2020 by the authors. Licensee MDPI, Basel, Switzerland. This article is an open access article distributed under the terms and conditions of the Creative Commons Attribution (CC BY) license (http://creativecommons.org/licenses/by/4.0/).