Autogenous Shrinkage, Strength, and Hydration Heat of Ultra-High-Strength Paste Incorporating Nano-Zirconium Dioxide


Abstract
1. Introduction
2. Materials and Methods
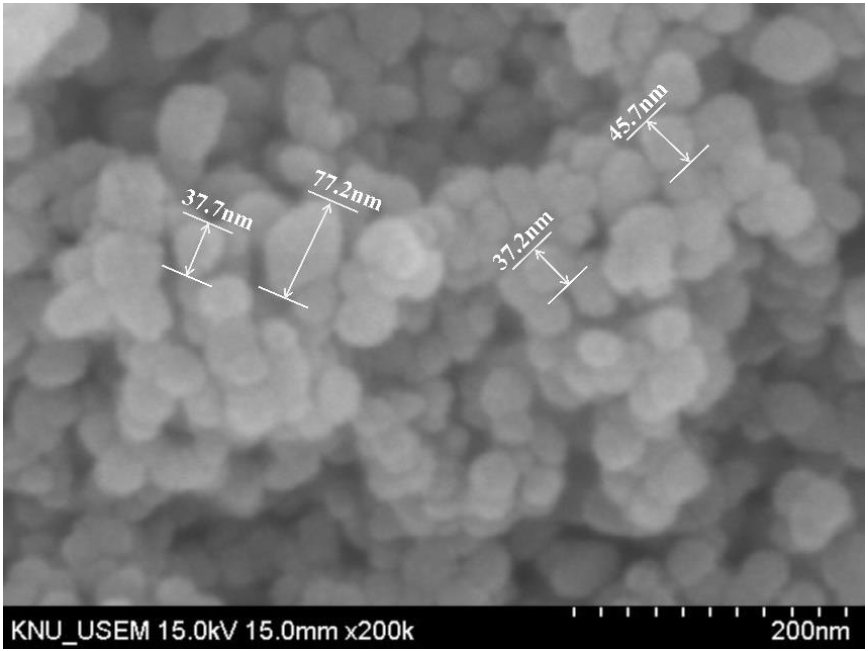
2.1. Materials and Specimen Preparation
2.2. Experimental Program
2.2.1. Workability
2.2.2. Isothermal Calorimetry
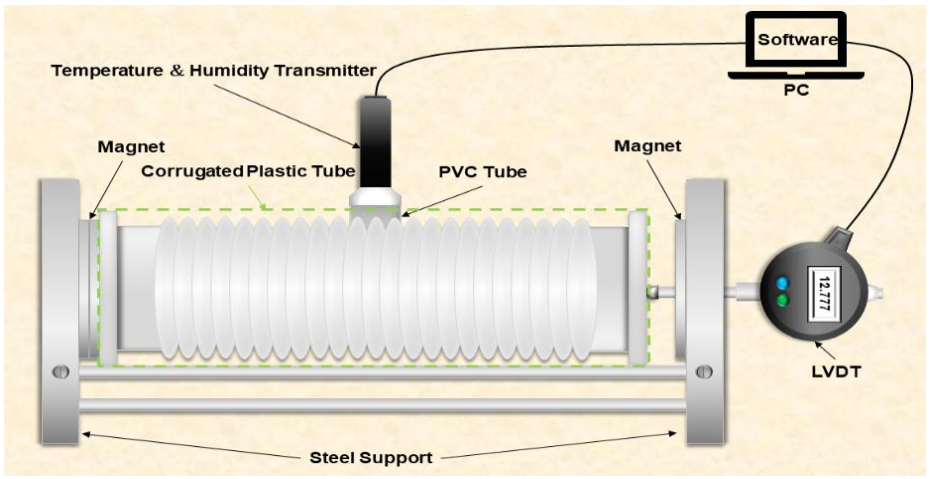
2.2.3. Autogenous Shrinkage, Internal Temperature, and Relative Humidity
2.2.4. X-ray Diffraction
2.2.5. Compressive Strength Test
2.2.6. Differential Thermal and Thermogravimetric Analysis (DTA-TG)
3. Results
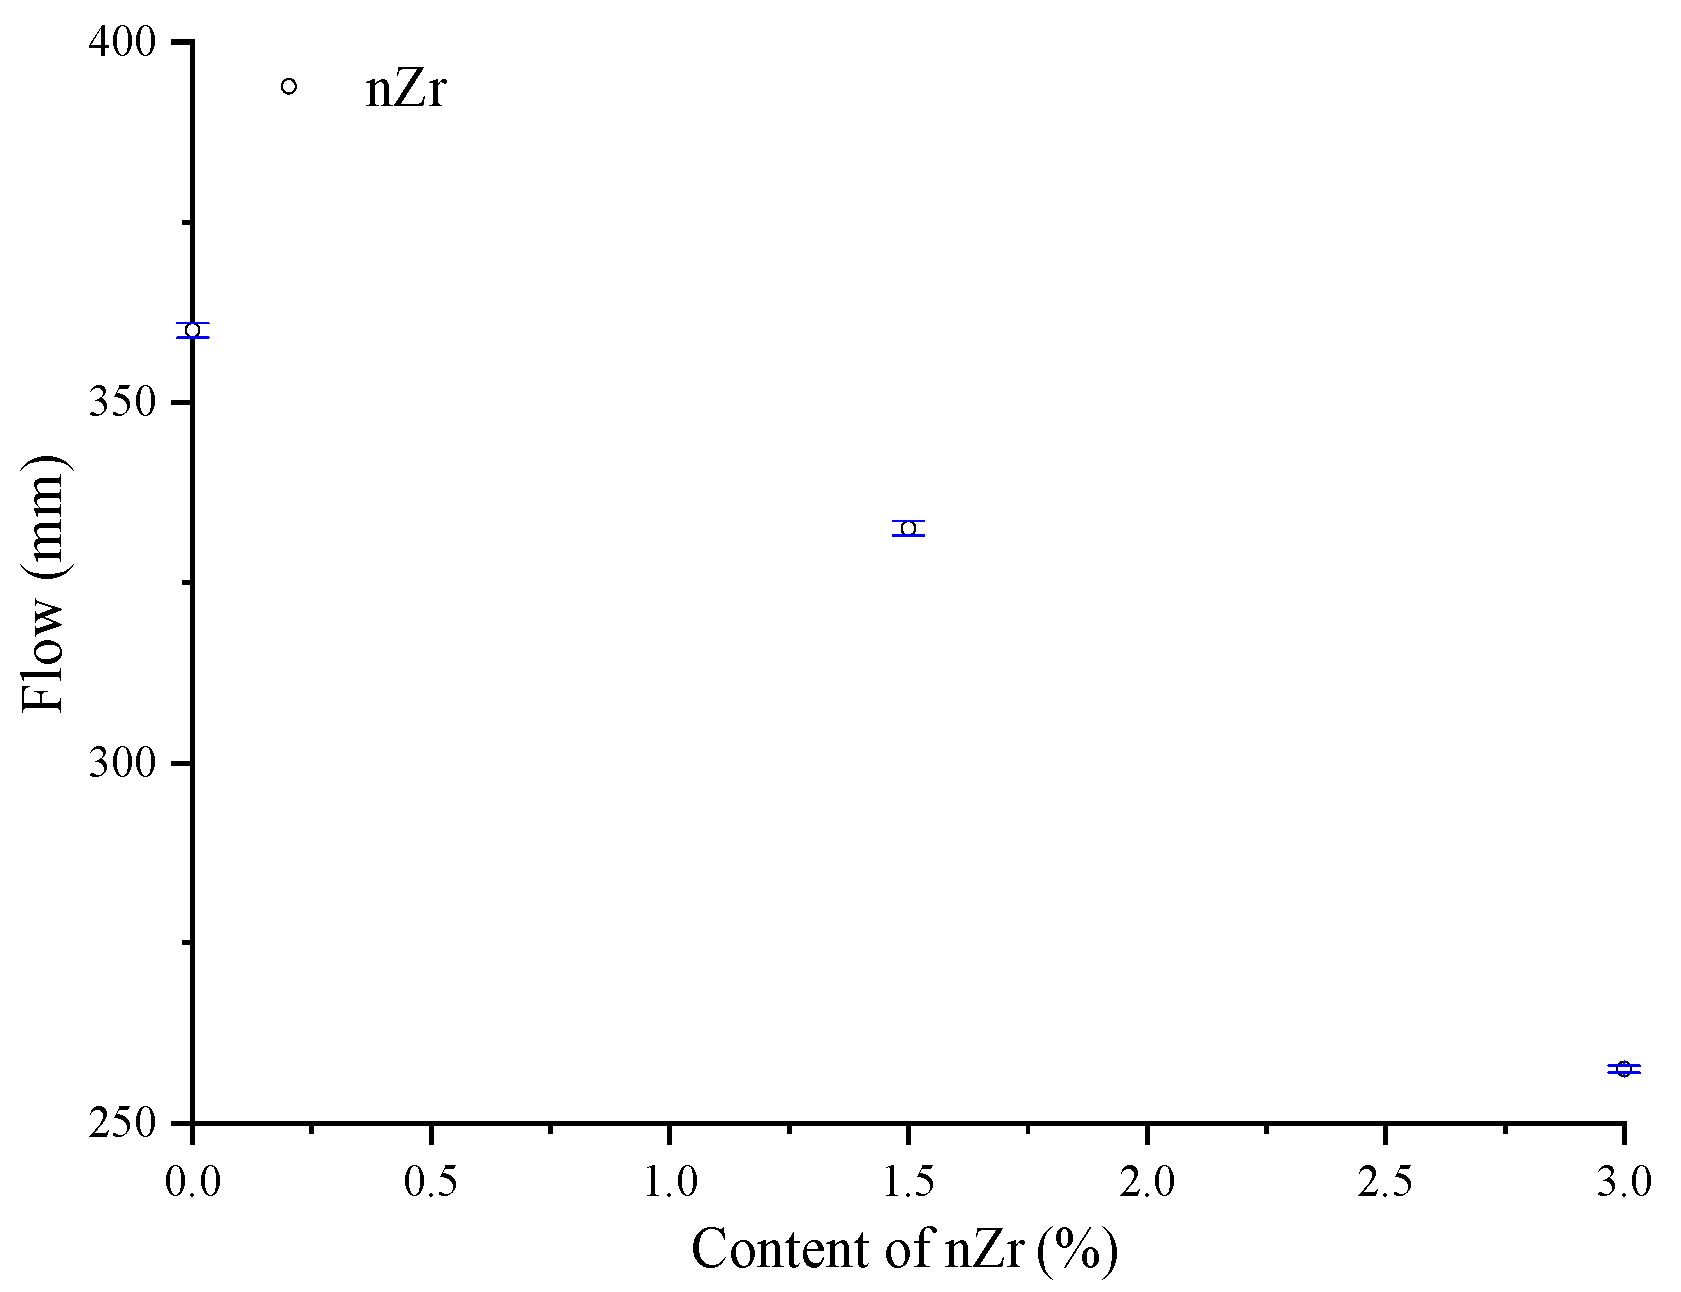
3.1. Slump Flow
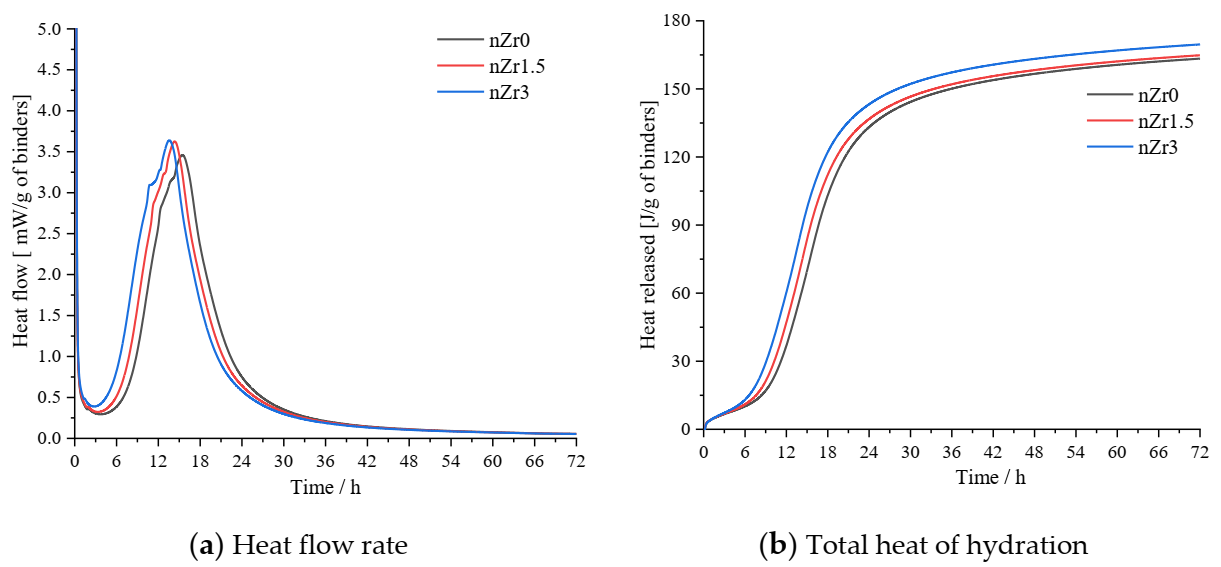
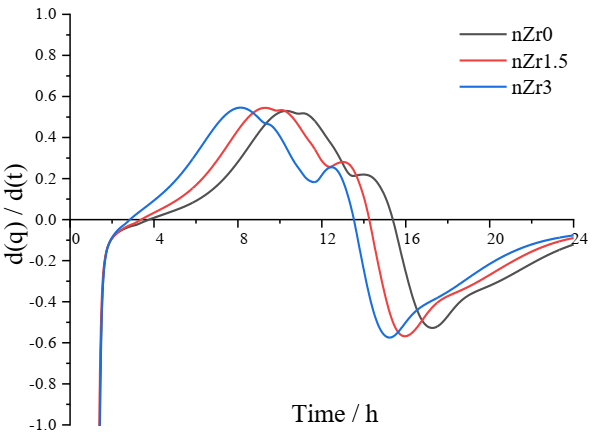
3.2. Isothermal Calorimetry
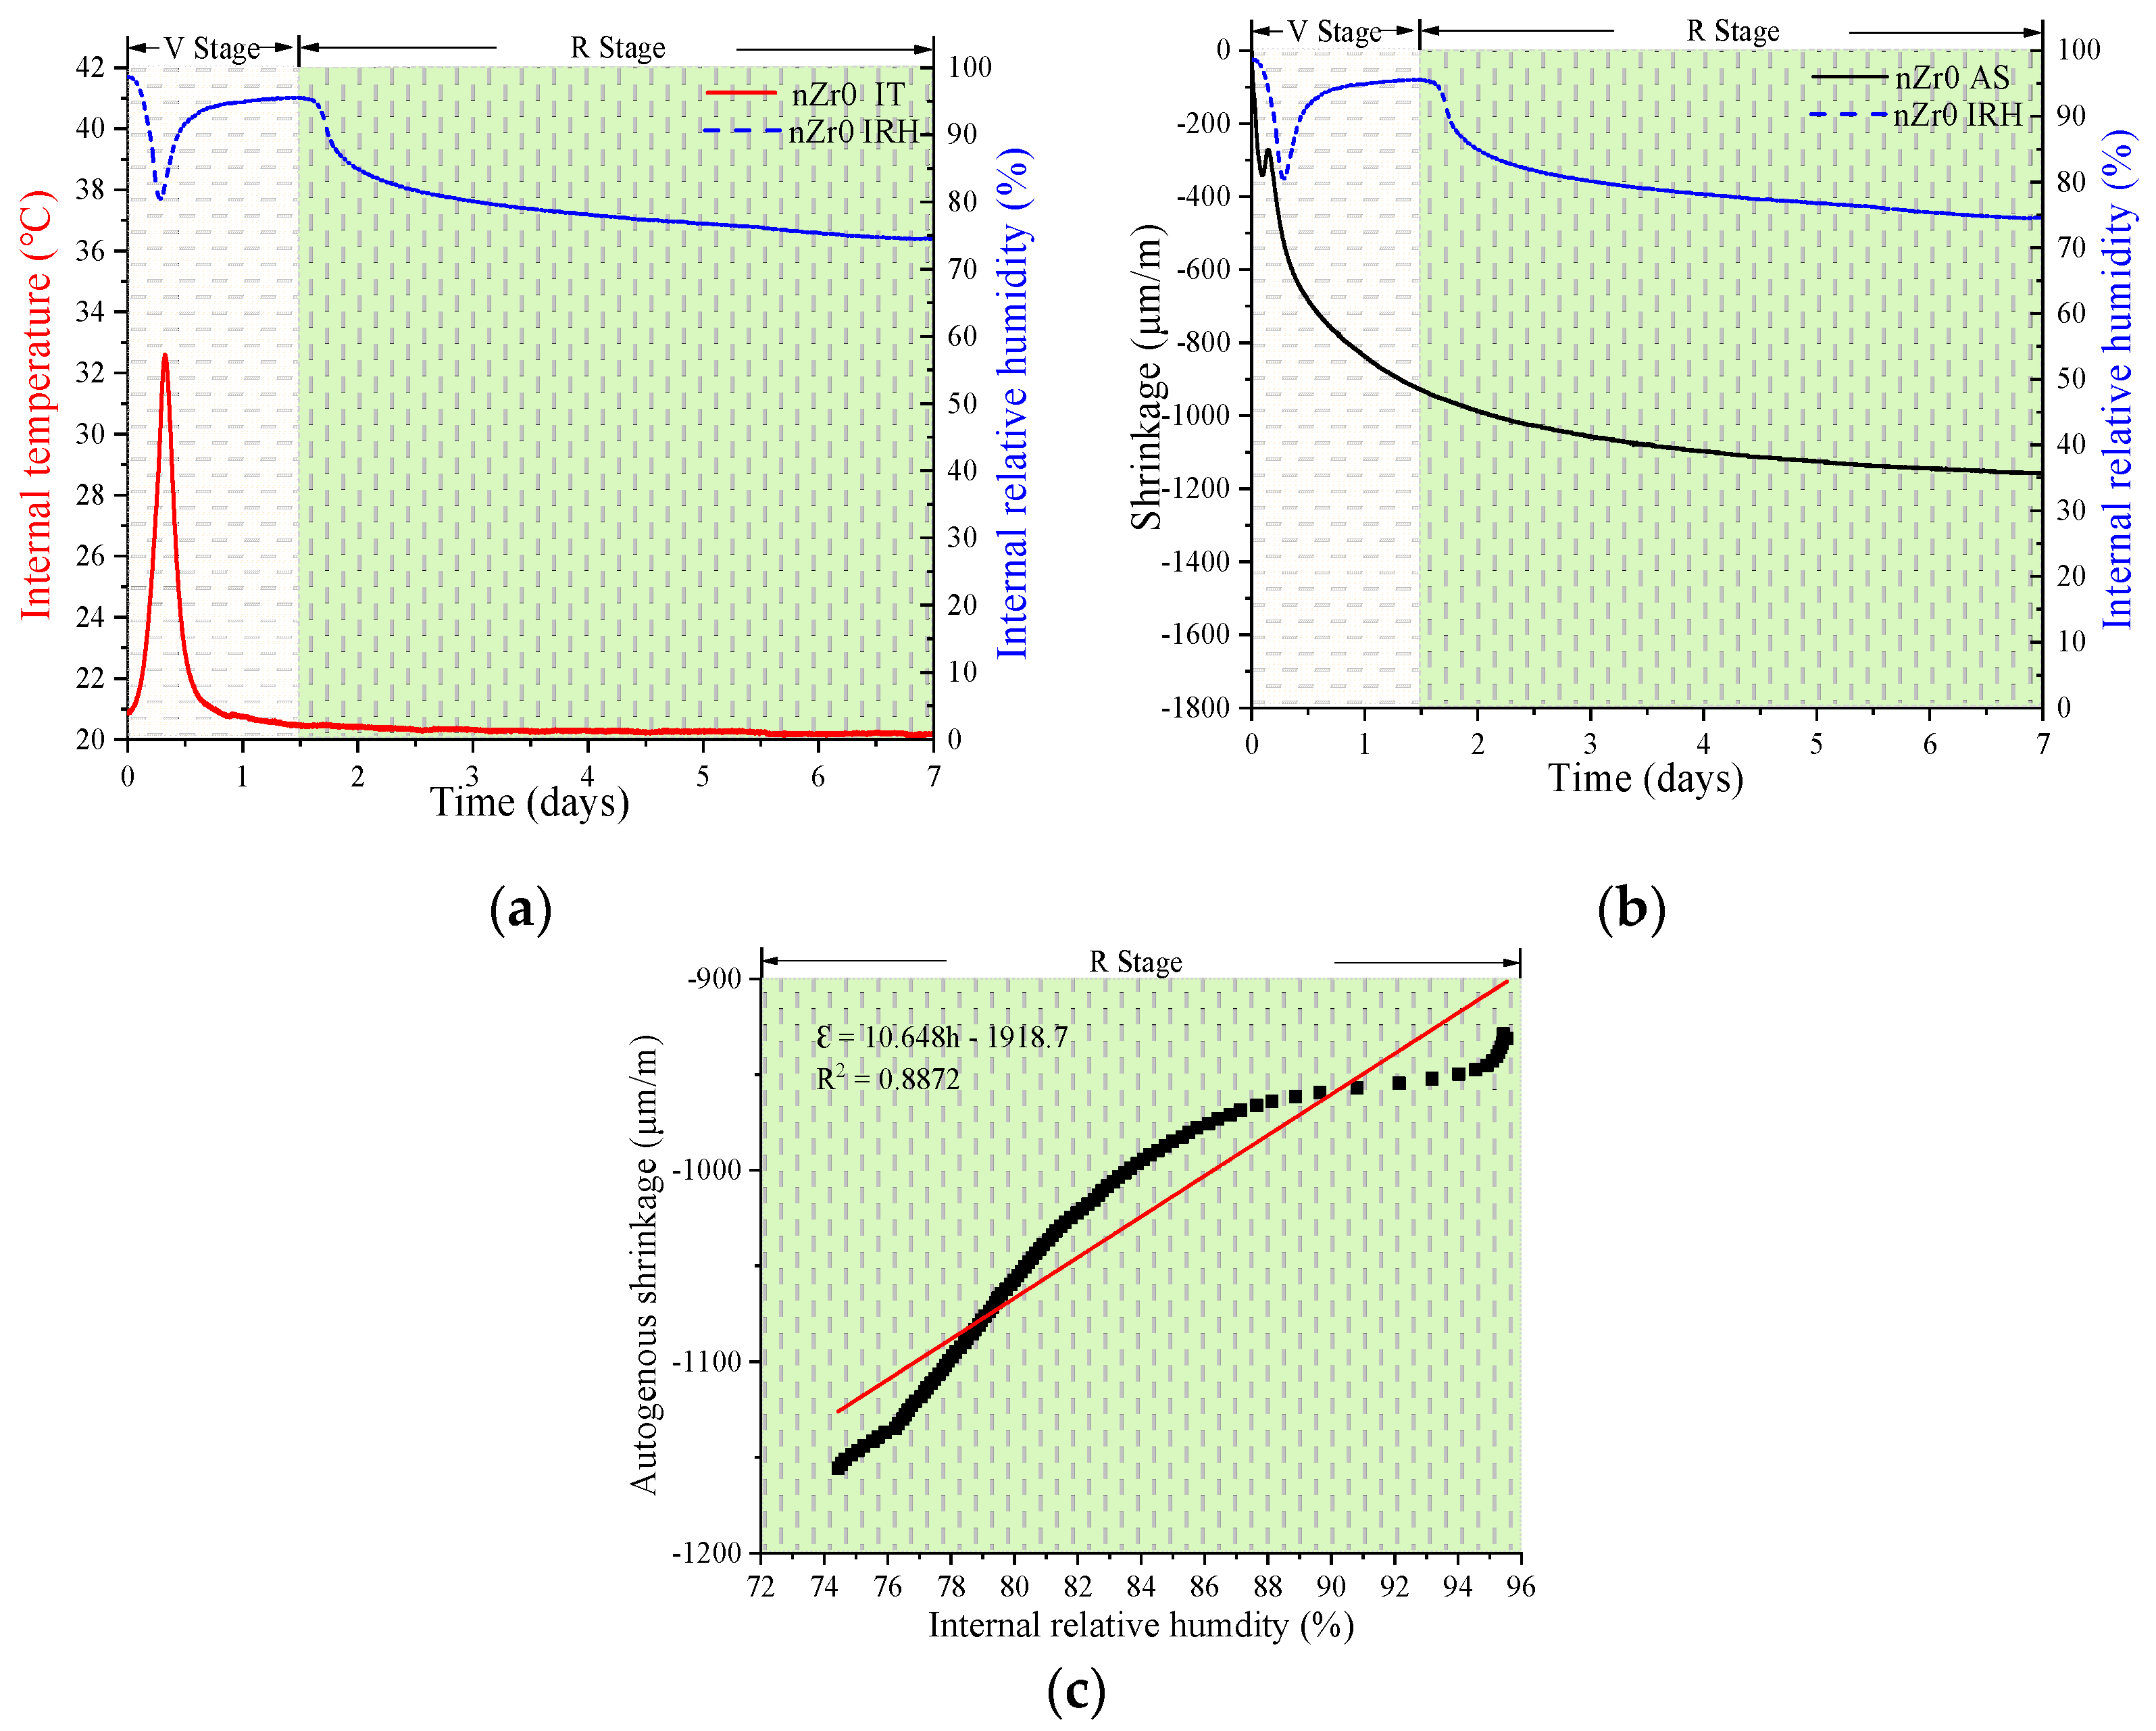
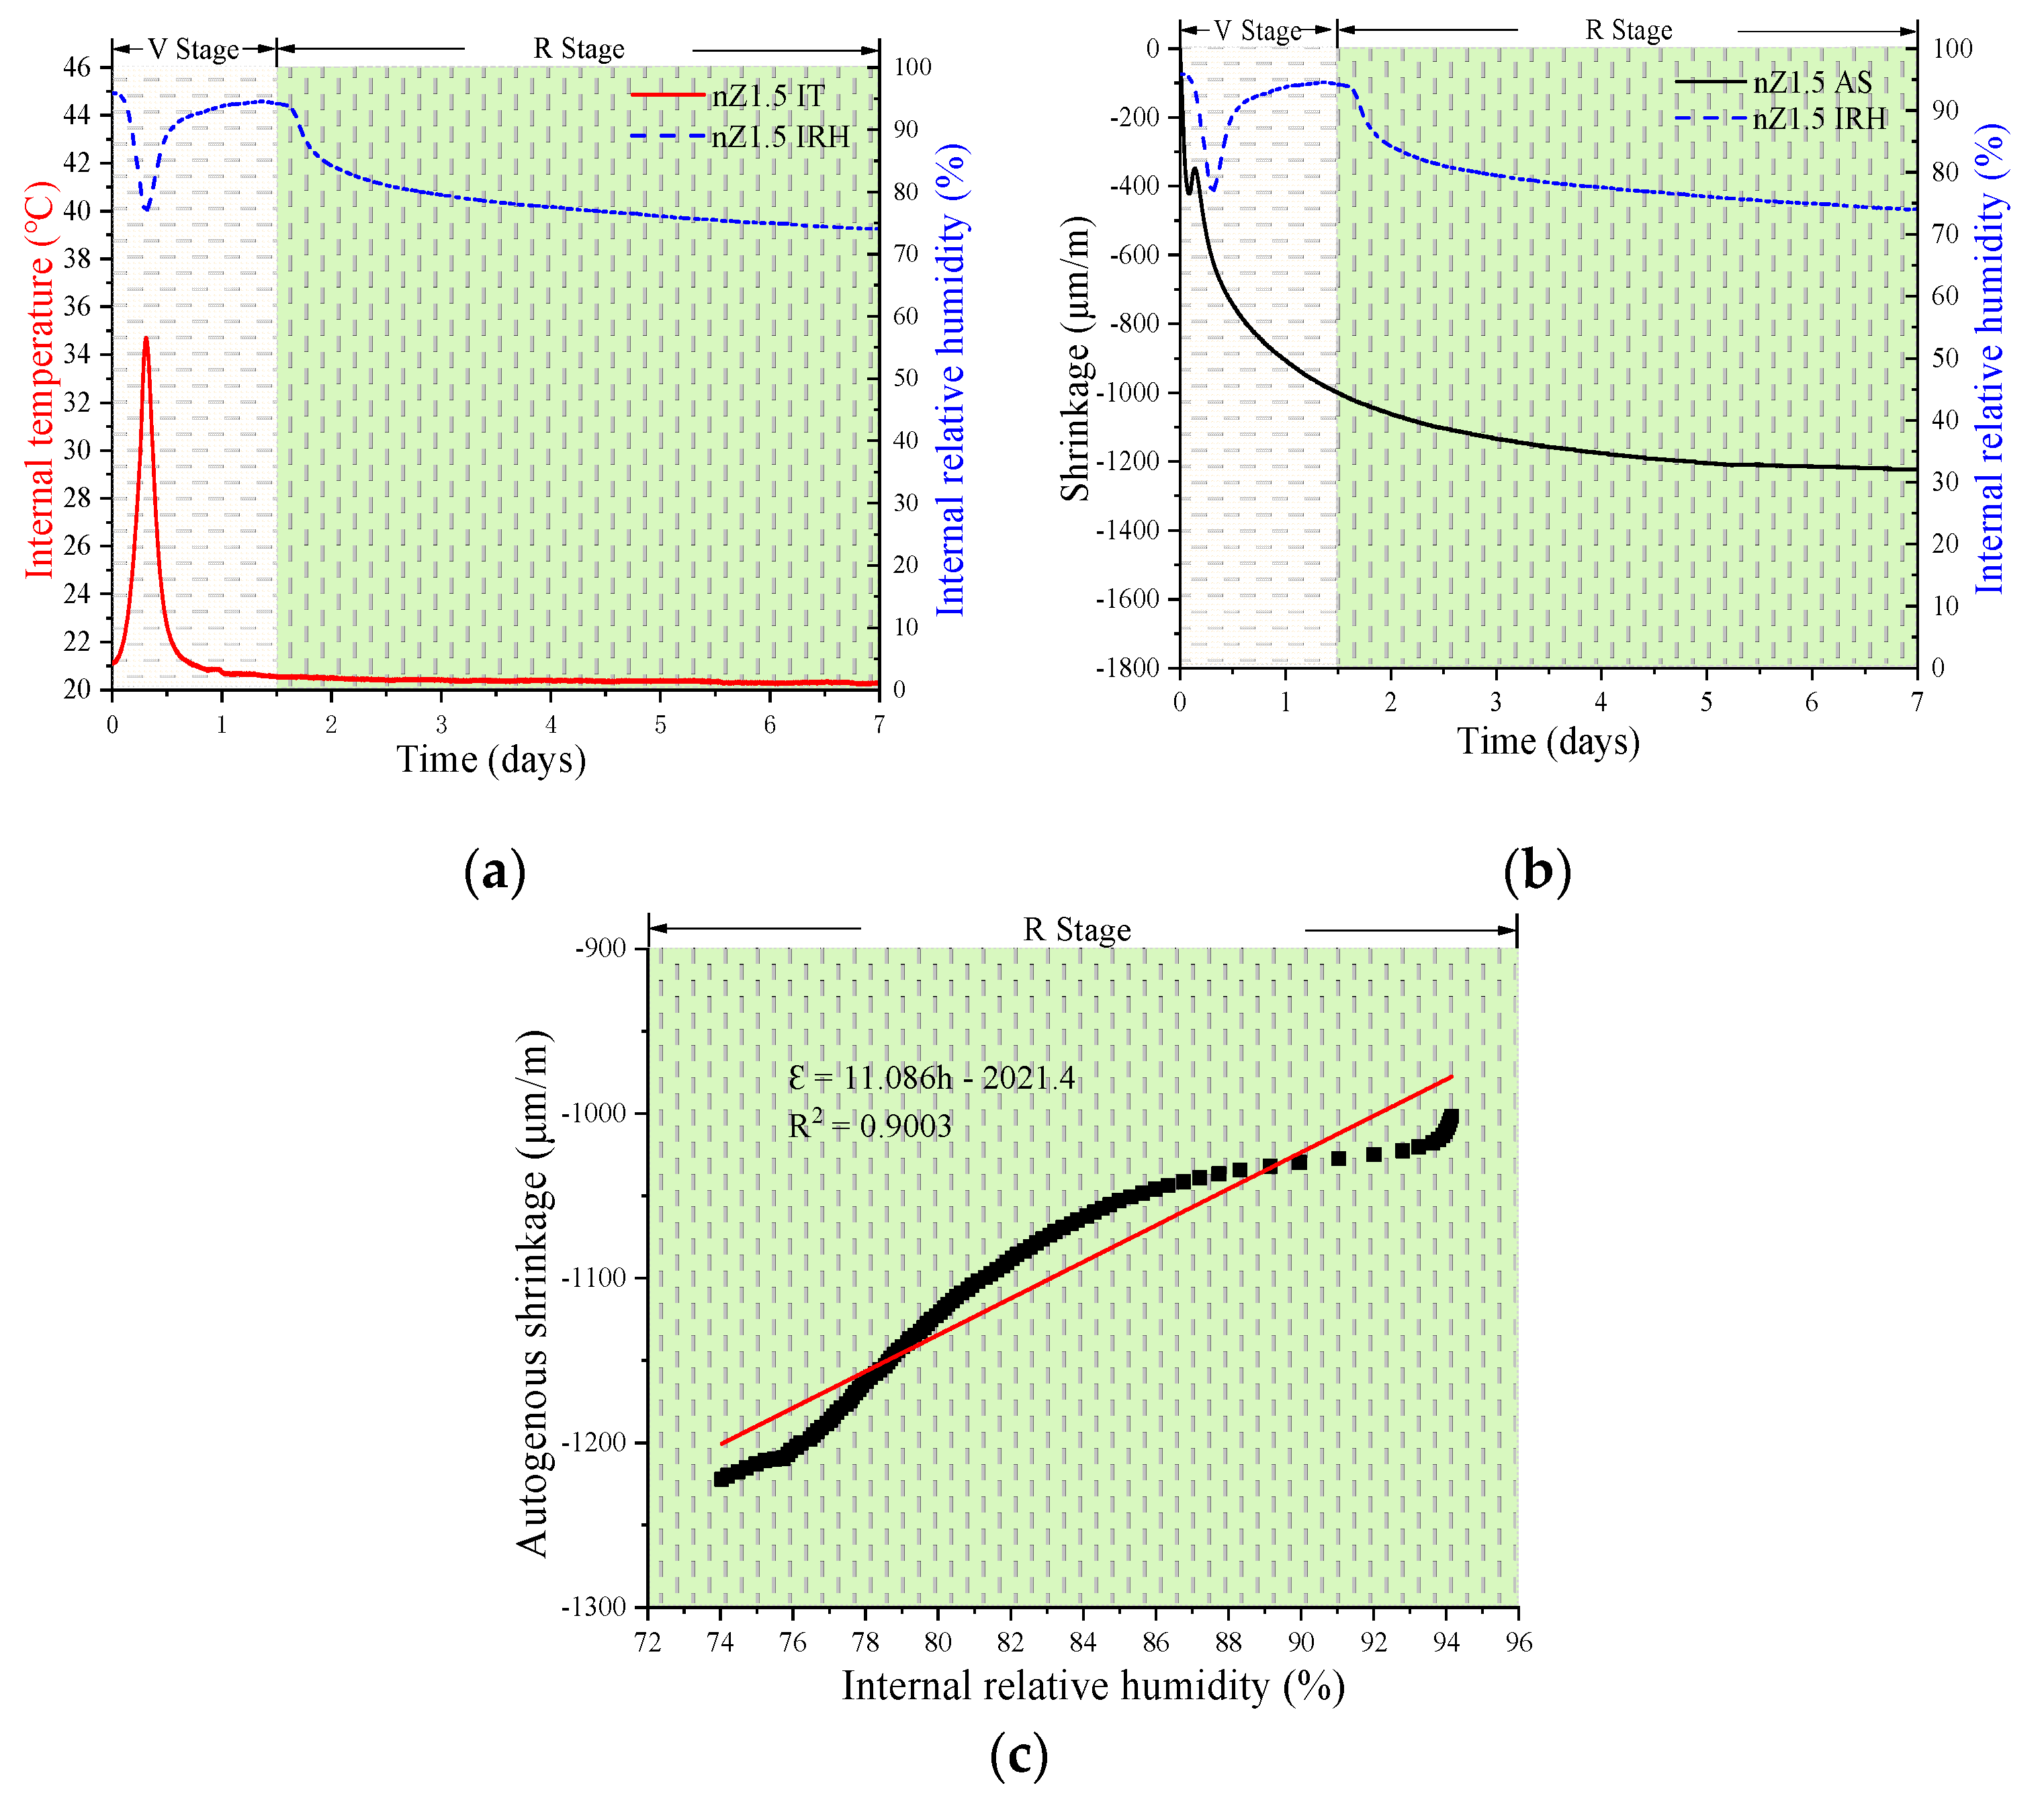
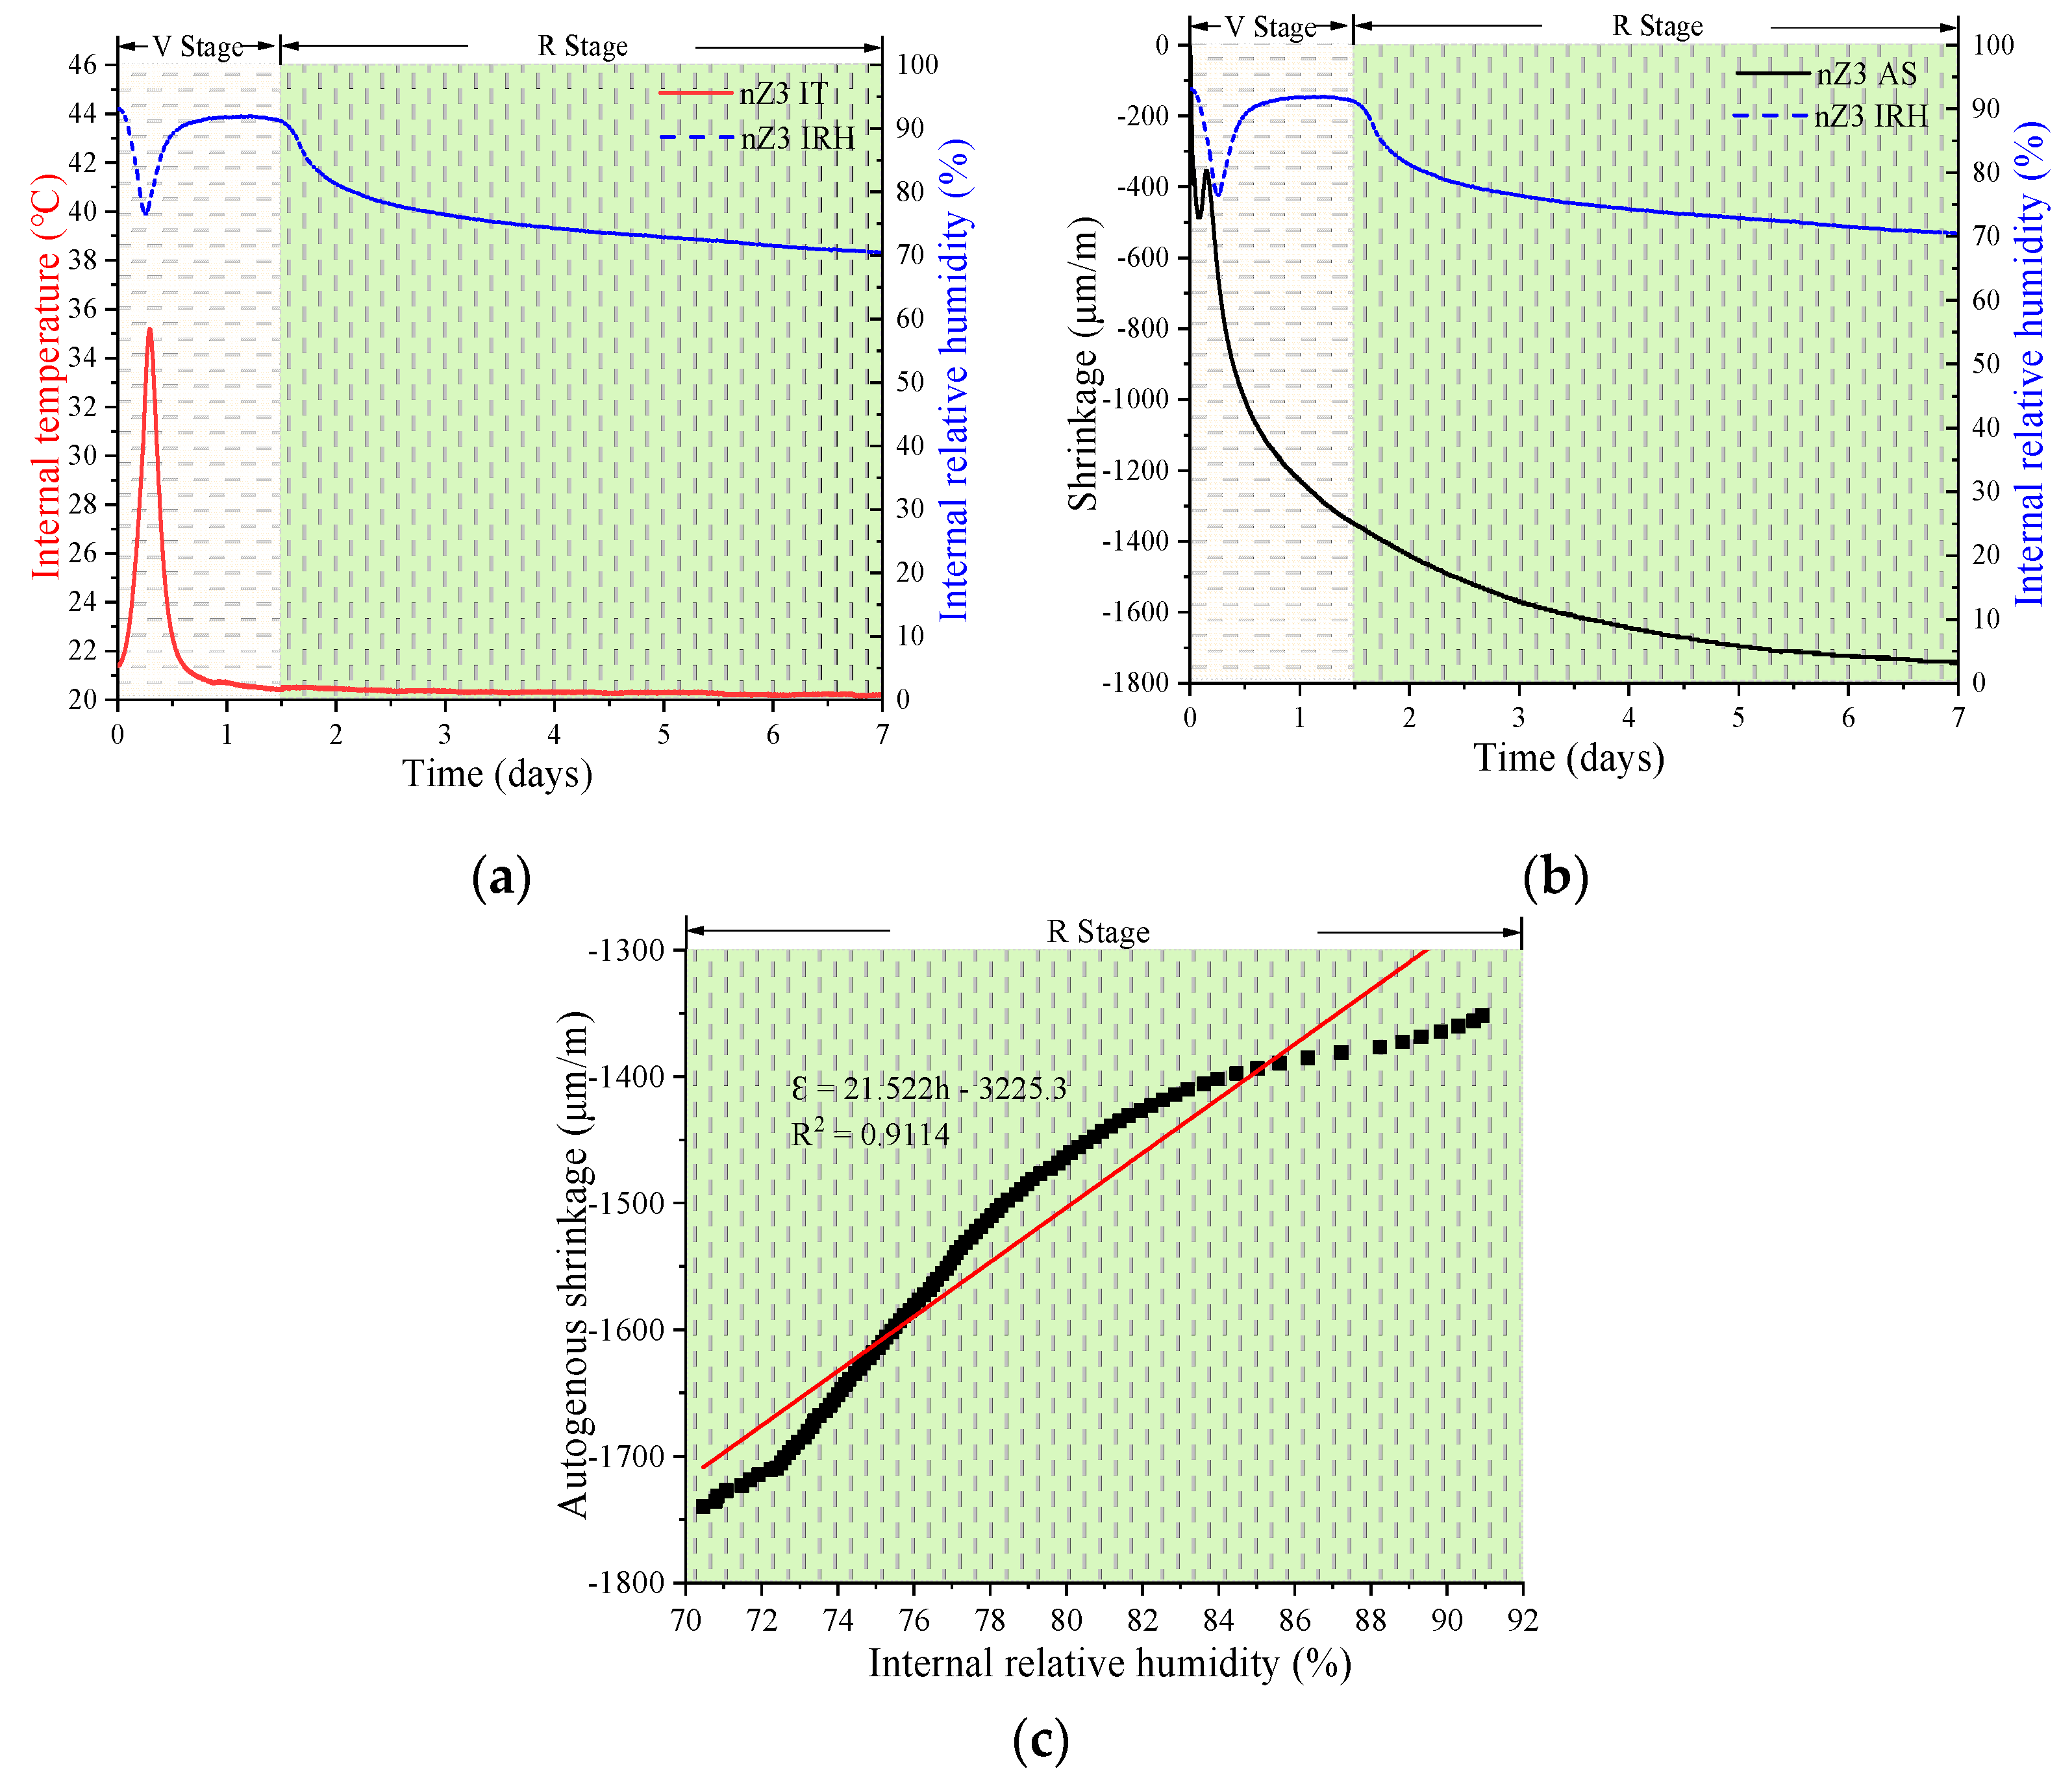
3.3. Development of Autogenous Shrinkage, Internal Temperature, and Internal Relative Humidity
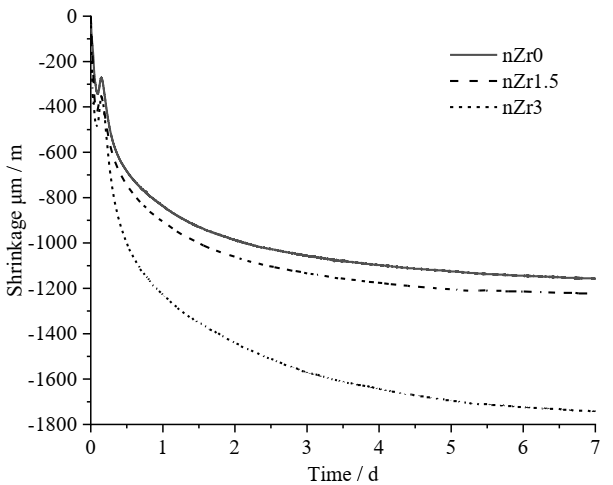
3.3.1. Autogenous Shrinkage
3.3.2. Development of Properties
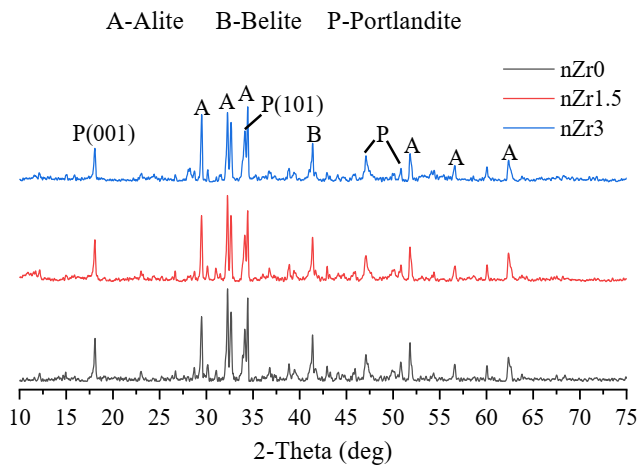
3.4. X-ray Diffraction
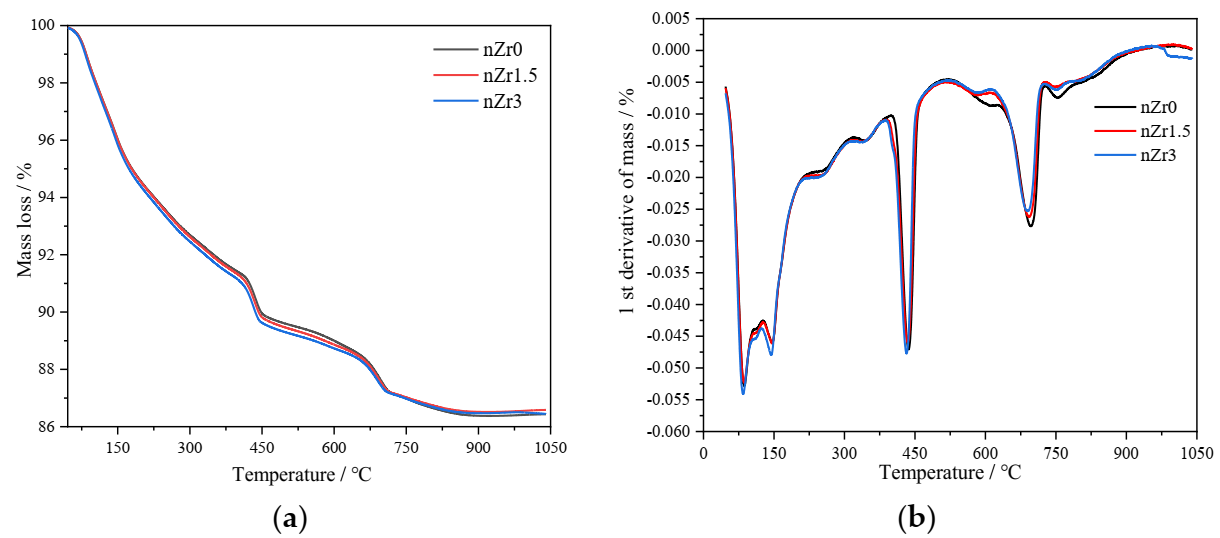
3.5. Thermogravimetry
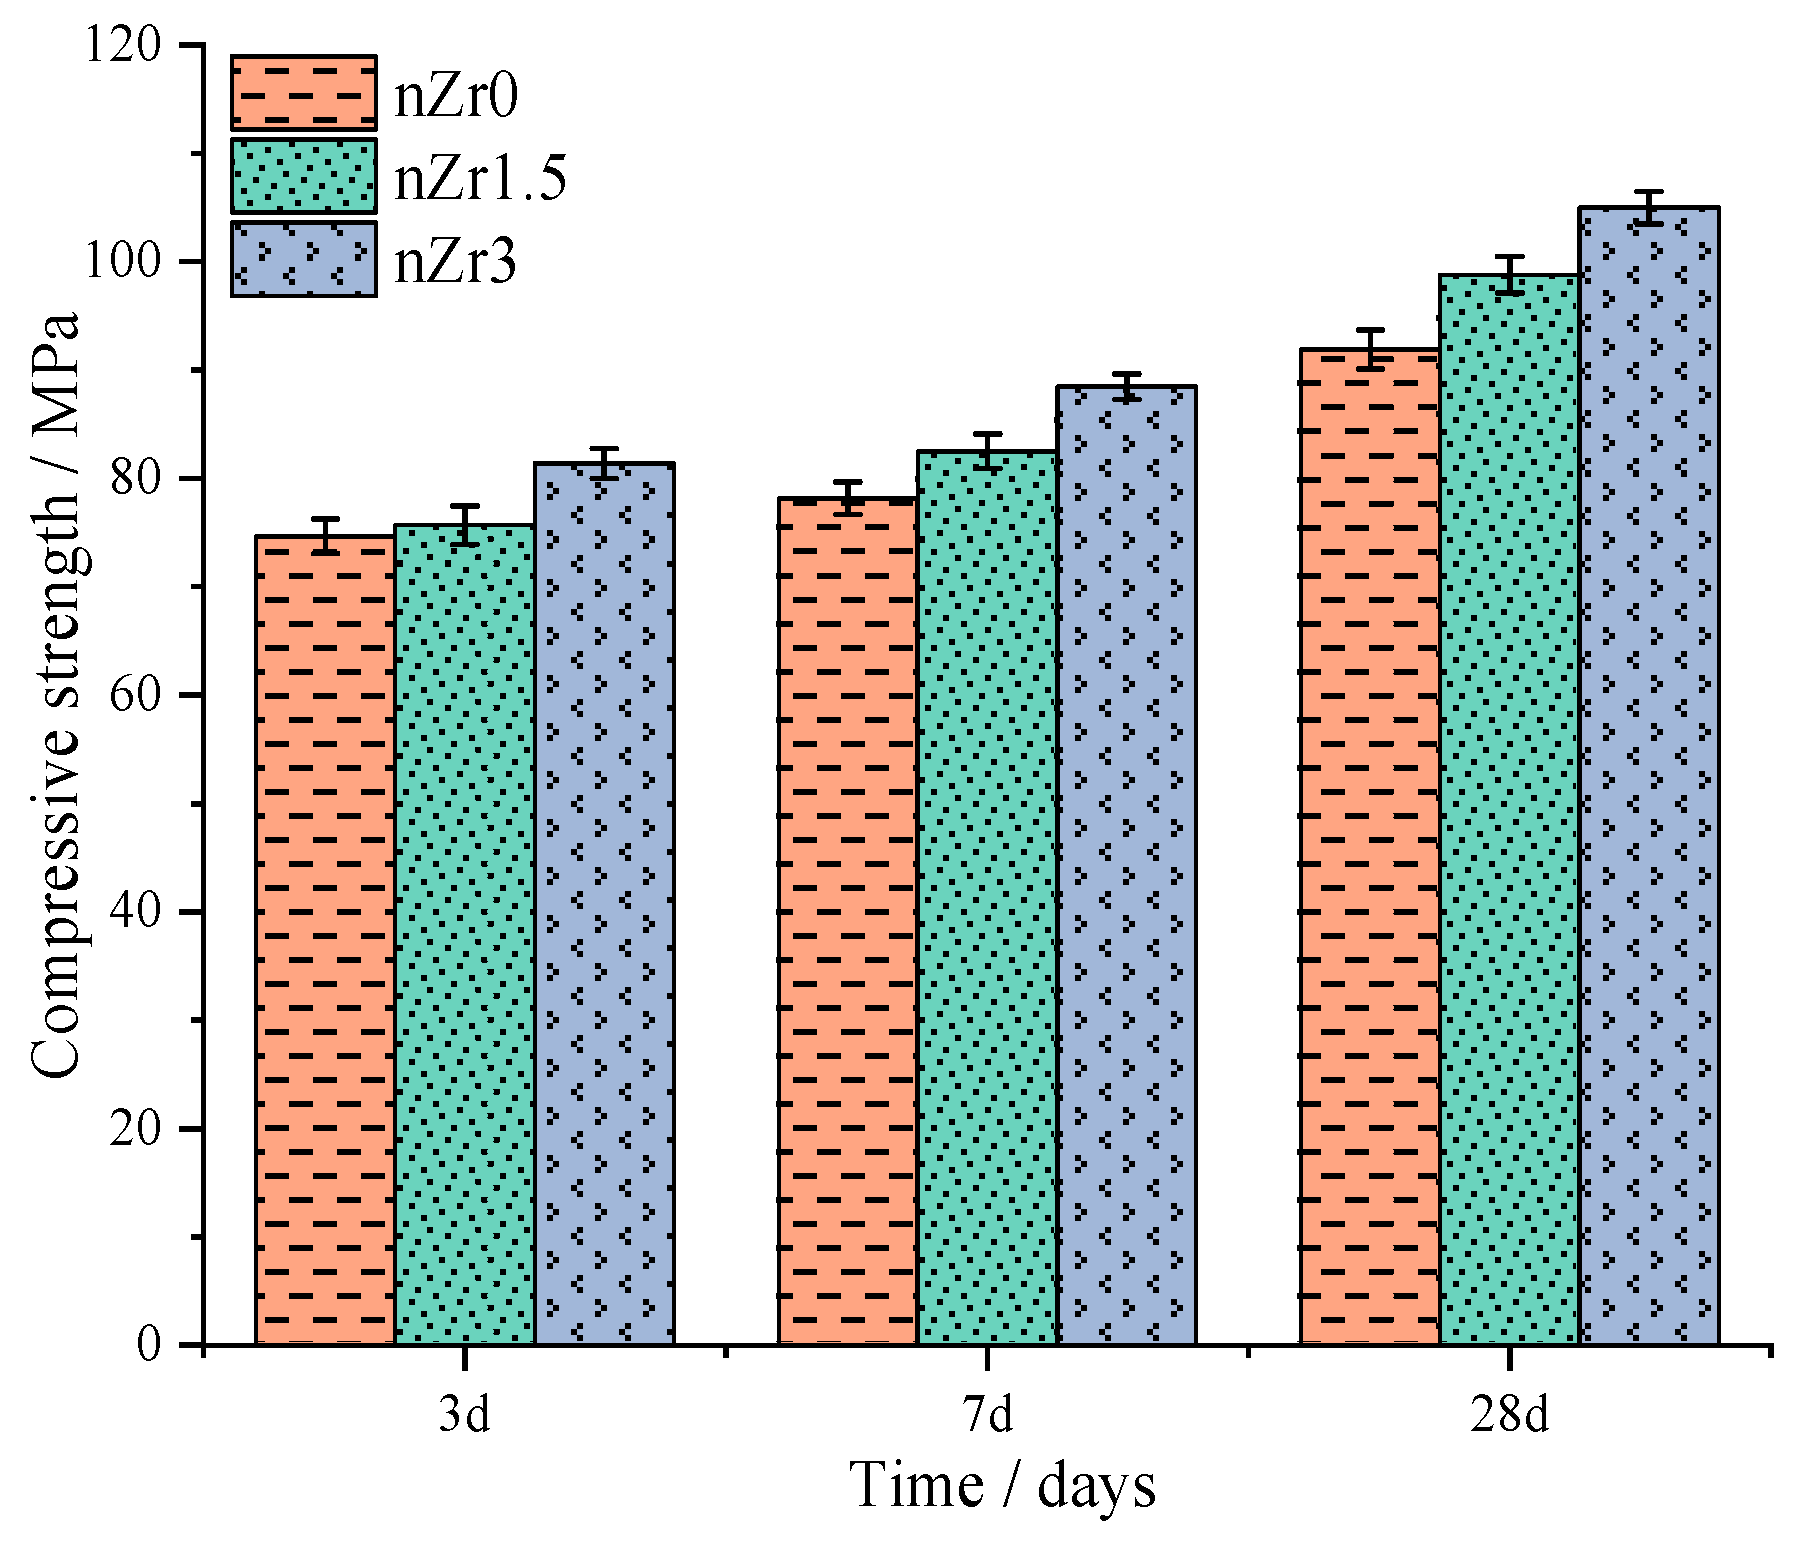
3.6. Compressive Strength
4. Discussion: Comparison of Nano-ZrO2 and Other Common Nanomaterials
5. Conclusions
- 1.
- The flow of UHSPs reduced as the nZr amount increased. The flow values of nZr0, nZr1.5, and nZr3 were 360, 332.5, and 257.5 mm, respectively. With the nZr content increasing, the flow decreased;
- 2.
- The nZr increased the heat release of UHSPs. The final heat release values of nZr3, nZr1.5, and nZr0 were 169.58, 164.81, and 163.08 J/g, respectively. Compared with the heat flow of nZr0, the nZr addition increased the height of the main heat flow peak and shortened its appearance time. Therefore, nZr has a physical nucleation effect. The setting time was determined using the isothermal calorimetry method. The setting time was shortened with the addition of nZr to UHSP. This behavior occurs because the addition of nZr provides more nucleation sites for the formation of hydration productions;
- 3.
- The nZr increased the total shrinkage of the UHSPs. At 7 days of age, the autogenous shrinkage strain of nZr0, nZr1.5, and nZr3 reached −1158, −1222, and −1739 μm/m, respectively. The entire AS strain was elevated because the nZr amount was elevated. The AS trends of the UHSPs were split into two stages: a stage of variable-temperature and a stage of room-temperature. The split time between the two stages occurred in approximately 1.5 days. In the V stage, the IRH curve peaks of all specimens firstly decreased and then increased. Moreover, in the R stage, the IRH continued to decline. The IRH final values of the UHSPs decreased as the nZr content increased;
- 4.
- Regarding the XRD data, new production peaks were not observed, and the peaks of CH did not change significantly. In addition, it was found that the addition of nZr caused a decrease in the degree of internal CH orientation. Regarding the DTA-TG curves, it was found, from the calculation results, that the amount of CH was almost the same as the nZr addition. Therefore, it can be proved that the nZr in this study was chemically inert and did not take part in the cement hydration reaction;
- 5.
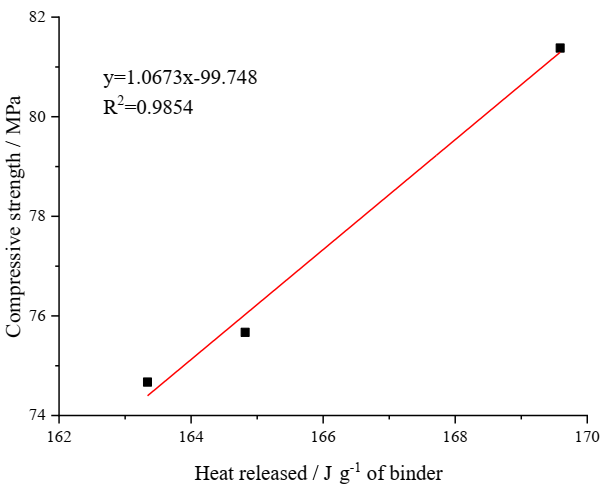
- There is a linear relationship between the 3-day hydration heat and compressive strength. With the nZr amount increasing, the strength of UHSP at 3 days, 7 days, and 4 weeks all increased. Compared with the 28-day compressive strength of nZr0 (91.9 MPa), the 28-day compressive strength of nZr1.5 (98.8 MPa) and nZr3 (105.0 MPa) increased by 7.5% and 14.27%, respectively.
Author Contributions
Funding
Conflicts of Interest
References
- Shi, C.; Wu, Z.; Xiao, J.; Wang, D.; Huang, Z.; Fang, Z. A review on ultra high performance concrete: Part I. Raw materials and mixture design. Constr. Build. Mater. 2015, 101, 741–751. [Google Scholar] [CrossRef]
- Wang, D.; Shi, C.; Wu, Z.; Xiao, J.; Huang, Z.; Fang, Z. A review on ultra high performance concrete: Part II. Hydration, microstructure and properties. Constr. Build. Mater. 2015, 96, 368–377. [Google Scholar] [CrossRef]
- Liu, K.Z.; Yu, R.; Shui, Z.H.; Li, X.S.; Guo, C.; Yu, B.L.; Wu, S. Optimization of autogenous shrinkage and microstructure for Ultra-High Performance Concrete (UHPC) based on appropriate application of porous pumice. Constr. Build. Mater. 2019, 214, 369–381. [Google Scholar] [CrossRef]
- Kodur, V.K.R.; Bhatt, P.P.; Soroushian, P.; Arablouei, A. Temperature and stress development in ultra-high performance concrete during curing. Constr. Build. Mater. 2016, 122, 63–71. [Google Scholar] [CrossRef]
- Ghafari, E.; Costa, H.; Júlio, E.; Portugal, A.; Durães, L. The effect of nanosilica addition on flowability, strength and transport properties of ultra high performance concrete. Mater. Des. 2014, 59, 1–9. [Google Scholar] [CrossRef]
- Chunping, G.; Qiannan, W.; Jintao, L. The effect of nano-TiO2 on the durability of Ultra-High performance concrete with and without a flexural load. Ceram. Silik. 2018, 62, 374–381. [Google Scholar]
- Gad, M.M.; Rahoma, A.; Al-Thobity, A.M.; ArRejaie, A.S. Influence of incorporation of ZrO2 nanoparticles on the repair strength of polymethyl methacrylate denture bases. Int. J. Nanomed. 2016, 11, 5633–5643. [Google Scholar] [CrossRef]
- Lu, X.; Xia, Y.; Liu, M.; Qian, Y.; Zhou, X.; Gu, N.; Zhang, F. Improved performance of diatomite-based dental nanocomposite ceramics using layer-by-layer assembly. Int. J. Nanomed. 2012, 7, 2153–2164. [Google Scholar]
- Han, B.; Wang, Z.; Zeng, S.; Zhou, D.; Yu, X.; Cui, X.; Ou, J. Properties and modification mechanisms of nano-zirconia filled reactive powder concrete. Constr. Build. Mater. 2017, 141, 426–434. [Google Scholar] [CrossRef]
- Ruan, Y.; Han, B.; Yu, X.; Li, Z.; Wang, J.; Dong, S.; Ou, J. Mechanical behaviors of nano-zirconia reinforced reactive powder concrete under compression and flexure. Constr. Build. Mater. 2018, 162, 663–673. [Google Scholar] [CrossRef]
- Trejo-Arroyo, D.; Acosta, K.; Cruz, J.; Valenzuela-Muñiz, A.; Vega-Azamar, R.; Jiménez, L. Influence of ZrO2 Nanoparticles on the Microstructural Development of Cement Mortars with Limestone Aggregates. Appl. Sci. 2019, 9, 598. [Google Scholar] [CrossRef]
- Yuan, H.; Shi, Y.; Xu, Z.; Lu, C.; Ni, Y.; Lan, X. Influence of nano-ZrO2 on the mechanical and thermal properties of high temperature cementitious thermal energy storage materials. Constr. Build. Mater. 2013, 48, 6–10. [Google Scholar] [CrossRef]
- Cao, M.; Ming, X.; He, K.; Li, L.; Shen, S. Effect of Macro-, Micro- and Nano-Calcium Carbonate on Properties of Cementitious Composites—A Review. Materials 2019, 12, 781. [Google Scholar] [CrossRef] [PubMed]
- ASTM International. Standard Test Method for Flow of Hydraulic Cement Mortar; American Society for Testing and Materials: West Conshohocken, PA, USA, 2015; p. 3. [Google Scholar]
- Hu, J.; Ge, Z.; Wang, K. Influence of cement fineness and water-to-cement ratio on mortar early-age heat of hydration and set times. Constr. Build. Mater. 2014, 50, 657–663. [Google Scholar] [CrossRef]
- Jensen, O.M.; Lura, P.; Goodwin, F.; Bentz, D.; Hooton, D.; Kovler, K.; Weiss, J. Standard Test Method for Autogenous Strain of Cement Paste and Mortar; ASTM International: West Conshohocken, PA, USA, 2016. [Google Scholar]
- Active Standard ASTM C349. Standard Test Method for Compressive Strength of HydraulicCement Mortars (Using Portions of Prisms Broken in Flexure); ASTM International: West Conshohocken, PA, USA, 2018. [Google Scholar]
- Senff, L.; Hotza, D.; Lucas, S.; Ferreira, V.M.; Labrincha, J.A. Effect of nano-SiO2 and nano-TiO2 addition on the rheological behavior and the hardened properties of cement mortars. Mater. Sci. Eng. A 2012, 532, 354–361. [Google Scholar] [CrossRef]
- Sakir, S.; Raman, S.N.; Safiuddin, M.; Kaish, A.B.M.A.; Rahman, K.T.; Mutalib, A.A. Effects of Nano-Materials on Key Properties of Cementitious Composites: A Review. Electron. J. Struct. Eng. 2018, 17, 1–12. [Google Scholar]
- Korayem, A.H.; Tourani, N.; Zakertabrizi, M.; Sabziparvar, A.M.; Duan, W.H. A review of dispersion of nanoparticles in cementitious matrices: Nanoparticle geometry perspective. Constr. Build. Mater. 2017, 153, 346–357. [Google Scholar] [CrossRef]
- Daimon, M.; Roy, D.M. Rheological properties of cement mixes: II. Zeta potential and preliminary viscosity studies. Cem. Concr. Res. 1979, 9, 103–110. [Google Scholar] [CrossRef]
- Cristiano, E.; Hu, Y.-J.; Siegfried, M.; Kaplan, D.; Nitsche, H. A Comparison of Point of Zero Charge Measurement Methodology. Clays Clay Miner. 2011, 59, 107–115. [Google Scholar] [CrossRef]
- Li, L.; Sagüés, A.A.; Poor, N. In situ leaching investigation of pH and nitrite concentration in concrete pore solution. Cem. Concr. Res. 1999, 29, 315–321. [Google Scholar] [CrossRef]
- Ersoy, B.; Dikmen, S.; Uygunoğlu, T.; İçduygu, M.G.; Kavas, T.; Olgun, A. Effect of mixing water types on the time-dependent zeta potential of Portland cement paste. Sci. Eng. Compos. Mater. 2013, 20, 285–292. [Google Scholar] [CrossRef]
- Rong, Z.; Sun, W.; Xiao, H.; Jiang, G. Effects of nano-SiO2 particles on the mechanical and microstructural properties of ultra-high performance cementitious composites. Cem. Concr. Compos. 2015, 56, 25–31. [Google Scholar] [CrossRef]
- Meng, W.; Khayat, K.H. Effect of graphite nanoplatelets and carbon nanofibers on rheology, hydration, shrinkage, mechanical properties, and microstructure of UHPC. Cem. Concr. Res. 2018, 105, 64–71. [Google Scholar] [CrossRef]
- Mohseni, E.; Naseri, F.; Amjadi, R.; Khotbehsara, M.M.; Ranjbar, M.M. Microstructure and durability properties of cement mortars containing nano-TiO2 and rice husk ash. Constr. Build. Mater. 2016, 114, 656–664. [Google Scholar] [CrossRef]
- Polat, R.; Demirboğa, R.; Karagöl, F. The effect of nano-MgO on the setting time, autogenous shrinkage, microstructure and mechanical properties of high performance cement paste and mortar. Constr. Build. Mater. 2017, 156, 208–218. [Google Scholar] [CrossRef]
- Yoo, D.-Y.; Park, J.-J.; Kim, S.-W.; Yoon, Y.-S. Early age setting, shrinkage and tensile characteristics of ultra high performance fiber reinforced concrete. Constr. Build. Mater. 2013, 41, 427–438. [Google Scholar] [CrossRef]
- Zhang, M.-H.; Sisomphon, K.; Ng, T.S.; Sun, D.J. Effect of superplasticizers on workability retention and initial setting time of cement pastes. Constr. Build. Mater. 2010, 24, 1700–1707. [Google Scholar] [CrossRef]
- Jansen, D.; Neubauer, J.; Goetz-Neunhoeffer, F.; Haerzschel, R.; Hergeth, W.-D. Change in reaction kinetics of a Portland cement caused by asuperplasticizer—Calculation of heatflow curves from XRD data. Cem. Concr. Res. 2012, 42, 327–332. [Google Scholar] [CrossRef]
- Chen, Y.; Deng, Y.-F.; Li, M.-Q. Influence of Nano-SiO2 on the Consistency, Setting Time, Early-Age Strength, and Shrinkage of Composite Cement Pastes. Adv. Mater. Sci. Eng. 2016, 2016, 5283706. [Google Scholar] [CrossRef]
- Tafesse, M.; Kim, H.-K. The role of carbon nanotube on hydration kinetics and shrinkage of cement composite. Compos. Part B Eng. 2019, 169, 55–64. [Google Scholar] [CrossRef]
- Bentz, D.P.; Geiker, M.R.; Hansen, K.K. Shrinkage-reducing admixtures and early-age desiccation in cement pastes and mortars. Cem. Concr. Res. 2001, 31, 11. [Google Scholar] [CrossRef]
- Qing, Y.; Zenan, Z.; Deyu, K.; Rongshen, C. Influence of nano-SiO2 addition on properties of hardened cement paste as compared with silica fume. Constr. Build. Mater. 2007, 21, 7. [Google Scholar] [CrossRef]
- Han, B.; Li, Z.; Zhang, L.; Zeng, S.; Yu, X.; Han, B.; Ou, J. Reactive powder concrete reinforced with nano SiO2-coated TiO2. Constr. Build. Mater. 2017, 148, 104–112. [Google Scholar] [CrossRef]
- Zhang, Z.; Zhang, B.; Yan, P. Comparative study of effect of raw and densified silica fume in the paste, mortar and concrete. Constr. Build. Mater. 2016, 105, 82–93. [Google Scholar] [CrossRef]
- Meng, T.; Yu, Y.; Qian, X.; Zhan, S.; Qian, K. Effect of nano-TiO2 on the mechanical properties of cement mortar. Constr. Build. Mater. 2012, 29, 241–245. [Google Scholar] [CrossRef]
- Scrivener, K.; Snellings, R.; Lothenbach, B. A Practical Guide to Microstructural Analysis of Cementitious Materials; CRC Press: Boca Raton, FL, USA, 2016. [Google Scholar]
- Dweck, J.; Buchler, P.M.; Coelho, A.C.V.; Cartledge, F.K. Hydration of a Portland cement blendedwith calcium carbonat. Thermochim. Acta 2000, 346, 105–113. [Google Scholar] [CrossRef]
- Kim, T.; Olek, J. Effects of Sample Preparation and Interpretation of Thermogravimetric Curves on Calcium Hydroxide in Hydrated Pastes and Mortars. Transp. Res. Rec. J. Transp. Res. Board 2012, 2290, 10–18. [Google Scholar] [CrossRef]
- Monteagudo, S.M.; Moragues, A.; Gálvez, J.C.; Casati, M.J.; Reyes, E. The degree of hydration assessment of blended cement pastes by differential thermal and thermogravimetric analysis. Morphological evolution of the solid phases. Thermochim. Acta 2014, 592, 37–51. [Google Scholar] [CrossRef]
- Chithra, S.; Senthil Kumar, S.R.R.; Chinnaraju, K. The effect of Colloidal Nano-silica on workability, mechanical and durability properties of High Performance Concrete with Copper slag as partial fine aggregate. Constr. Build. Mater. 2016, 113, 794–804. [Google Scholar] [CrossRef]
- Ghafari, E.; Arezoumandi, M.; Costa, H.; Júlio, E. Influence of nano-silica addition on durability of UHPC. Constr. Build. Mater. 2015, 94, 181–188. [Google Scholar] [CrossRef]
- Aïtcin, P.-C.; Flatt, R. Science and Technology of Concrete Admixtures; Woodhead Publishing: Cambridge, UK, 2016; p. 666. [Google Scholar]
- Loukili, A.; Khelidj, A.; Richard, P. Hydration kinetics, change of relative humidity, and autogenous shrinkage of ultra-high-strength concrete. Cem. Concr. Res. 1999, 29, 577–584. [Google Scholar] [CrossRef]
- Yu, R.; Spiesz, P.; Brouwers, H.J.H. Effect of nano-silica on the hydration and microstructure development of Ultra-High Performance Concrete (UHPC) with a low binder amount. Constr. Build. Mater. 2014, 65, 140–150. [Google Scholar] [CrossRef]
- Moro, C.; El Fil, H.; Francioso, V.; Velay-Lizancos, M. Influence of water-to-binder ratio on the optimum percentage of nano-TiO2 addition in terms of compressive strength of mortars: A laboratory and virtual experimental study based on ANN model. Constr. Build. Mater. 2020. [Google Scholar] [CrossRef]
- Li, W.; Huang, Z.; Zu, T.; Shi, C.; Duan, W.; Shah, S.P. Influence of Nanolimestone on the Hydration, Mechanical Strength, and Autogenous Shrinkage of Ultrahigh-Performance Concrete. J. Mater. Civ. Eng. 2016, 28. [Google Scholar] [CrossRef]
- Zhang, J.; Wang, Q.; Zhang, J. Shrinkage of internal cured high strength engineered cementitious composite with pre-wetted sand-like zeolite. Constr. Build. Mater. 2017, 134, 664–672. [Google Scholar] [CrossRef]
- Yoo, D.Y.; Kim, S.; Lee, J.Y.; You, I.; Lee, S.J. Implication of calcium sulfoaluminate-based expansive agent on tensile behavior of ultra-high-performance fiber-reinforced concrete. Constr. Build. Mater. 2019, 217, 679–693. [Google Scholar] [CrossRef]
- Yoo, D.-Y.; Banthia, N.; Yoon, Y.-S. Effectiveness of shrinkage-reducing admixture in reducing autogenous shrinkage stress of ultra-high-performance fiber-reinforced concrete. Cem. Concr. Compos. 2015, 64, 27–36. [Google Scholar] [CrossRef]


| SiO2 | ZrO2 | CaO | Fe2O3 | SO3 | MgO | ZnO | Al2O3 | K2O | Loss | |
|---|---|---|---|---|---|---|---|---|---|---|
| Cement | 21.95 | - | 61.28 | 2.43 | 2.84 | 2.87 | 0.11 | 6.19 | 1.78 | 0.54 |
| Nano-ZrO2 | - | 99.90 | - | - | - | - | - |
| Density (kg/cm3) | Specific Surface Area (m2/kg) | Setting Time (Min) | Compressive Strength (MPa) | ||
|---|---|---|---|---|---|
| Initial | Final | 3 d | 28 d | ||
| 3.14 | 345 | 205 | 295 | 29.5 | 58.9 |
| Number | Binders | Water | Superplasticizer | ||||
|---|---|---|---|---|---|---|---|
| Cement | nano-ZrO2 | ||||||
| % | kg/m3 | % | kg/m3 | kg/m3 | % | kg/m3 | |
| nZr0 | 100 | 1906 | 0 | 0 | 381 | 0.8 | 15 |
| nZr1.5 | 98.5 | 1876 | 1.5 | 29 | 381 | 0.8 | 15 |
| nZr3 | 97 | 1845 | 3 | 58 | 381 | 0.8 | 15 |
| Test | Numbers of Specimen for Each Group | Experiment Precision |
|---|---|---|
| Mini-slump flow | 2 | 1 mm |
| Isothermal calorimetry | 1 | ±20 µW |
| Autogenous shrinkage | 1 | 0.001 µm/m |
| Internal temperature | 1 | ±0.1 °C |
| Internal relative humidity | 1 | ±0.5% RH |
| X-ray diffraction | 1 | λ = 1.5406 Å 2 θ = 0.013° |
| Compressive strength | 6 | Within ±0.05% of the indicated load |
| Differential thermal and thermogravimetric analysis | 1 | 0.1 µg |
| Samples | (001)CH | (101)CH | CH Orientation |
|---|---|---|---|
| nZr0 | 286 | 340 | 1.13 |
| nZr1.5 | 281 | 366 | 1.04 |
| nZr3 | 240 | 338 | 0.96 |
| Sample Codes | nZr0 | nZr1.5 | nZr3 |
|---|---|---|---|
| (g) | 0.0862 | 0.0882 | 0.0876 |
| (g) | 0.0365 | 0.0336 | 0.0319 |
| (g) | 0.1227 | 0.1218 | 0.1195 |
Publisher’s Note: MDPI stays neutral with regard to jurisdictional claims in published maps and institutional affiliations. |
© 2020 by the authors. Licensee MDPI, Basel, Switzerland. This article is an open access article distributed under the terms and conditions of the Creative Commons Attribution (CC BY) license (http://creativecommons.org/licenses/by/4.0/).
Share and Cite
Zhang, G.-Z.; Lee, H.-S.; Wang, X.-Y. Autogenous Shrinkage, Strength, and Hydration Heat of Ultra-High-Strength Paste Incorporating Nano-Zirconium Dioxide. Sustainability 2020, 12, 9372. https://doi.org/10.3390/su12229372
Zhang G-Z, Lee H-S, Wang X-Y. Autogenous Shrinkage, Strength, and Hydration Heat of Ultra-High-Strength Paste Incorporating Nano-Zirconium Dioxide. Sustainability. 2020; 12(22):9372. https://doi.org/10.3390/su12229372
Chicago/Turabian StyleZhang, Guang-Zhu, Han-Seung Lee, and Xiao-Yong Wang. 2020. "Autogenous Shrinkage, Strength, and Hydration Heat of Ultra-High-Strength Paste Incorporating Nano-Zirconium Dioxide" Sustainability 12, no. 22: 9372. https://doi.org/10.3390/su12229372
APA StyleZhang, G.-Z., Lee, H.-S., & Wang, X.-Y. (2020). Autogenous Shrinkage, Strength, and Hydration Heat of Ultra-High-Strength Paste Incorporating Nano-Zirconium Dioxide. Sustainability, 12(22), 9372. https://doi.org/10.3390/su12229372