Article

Resilience–Vulnerability Analysis: A Decision-Making Framework for Systems Assessment

by
Nikolaos A. Skondras
,
Demetrios E. Tsesmelis
*,
Constantina G. Vasilakou
and
Christos A. Karavitis
Department of Natural Resources Development & Agricultural Engineering, Agricultural University of Athens, 75 Iera Odos, 11855 Athens, Greece
*
Author to whom correspondence should be addressed.
Sustainability 2020, 12(22), 9306; https://doi.org/10.3390/su12229306
Submission received: 27 September 2020 / Revised: 5 November 2020 / Accepted: 5 November 2020 / Published: 10 November 2020
(This article belongs to the Special Issue Sustainable Geography)

Abstract

:
The terms ‘resilience’ and ‘vulnerability’ have been widely used, with multiple interpretations in a plethora of disciplines. Such a variety may easily become confusing, and could create misconceptions among the different users. Policy makers who are bound to make decisions in key spatial and temporal points may especially suffer from these misconceptions. The need for decisions may become even more pressing in times of crisis, where the weaknesses of a system are exposed, and immediate actions to enhance the systemic strengths should be made. The analysis framework proposed in the current effort, and demonstrated in hypothetical forest fire cases, tries to focus on the combined use of simplified versions of the resilience and vulnerability concepts. Their relations and outcomes are also explored, in an effort to provide decision makers with an initial assessment of the information required to deal with complex systems. It is believed that the framework may offer some service towards the development of a more integrated and applicable tool, in order to further expand the concepts of resilience and vulnerability. Additionally, the results of the framework can be used as inputs in other decision making techniques and approaches. This increases the added value of the framework as a tool.

1. Introduction

Decision making may be generally defined as the art and science of identifying, from a large number of feasible alternatives, the set of actions which best accomplish the overall objectives [1,2,3]. This process may seem simple enough to apply; however, arising problems have usually proved hard to deal with [4,5]. Furthermore, decision making may become even more challenging and pressing in times of crises, such as environmental and climatic uncertainties, or economic instabilities. Events such as these may force the systems to reveal their weaknesses abruptly, and may press decision makers to rapidly enhance the systemic strengths. Additionally, the lack of information on the various systemic properties, interfering relations, and interconnecting phases may prevent decision makers from developing timely, efficient and implementable corresponding actions.
Thus, in order to cope with and adapt to such characteristics, decision and policy makers need to be provided with sufficient information regarding both the system and the problem at hand [6,7]. Specifically, decision makers need to obtain information about the system’s state, organization, functioning, key attributes and properties, as well as the potential of the system to react to threats. In this regard, the descriptive capacity of resilience and vulnerability, as well as their conceptualization through time, may provide the desired information [8,9,10]. Resilience and vulnerability are two dynamic system assessment concepts which are of growing interest among researchers [11]. Furthermore, Miller et al. (2010) [12] state that the combination of resilience and vulnerability in a common analysis framework may promote systems knowledge and understanding.
Nevertheless, both resilience and vulnerability terms have proved difficult to apply, mostly due to the fact that they have a variety of different meanings to a plethora of different researchers [13,14]. Hence, their conceptualization and treatment are usually based on the objectives that they are called to serve upon, as well as the research needs that they are called to fulfill. For example, SOPAC’s resilience embraces the properties of resistance and recovery [15,16], while others use reorganization and change as the major components [17,18]. Furthermore, the relationship of resilience and vulnerability exhibits, most of the time, a certain degree of complexity and ambiguity [15,18,19,20,21,22,23,24,25,26].
Such difficulties may exacerbate the confusion and disorder in the interaction among a wide range of users, and—most of all—among decision makers who are not necessarily experts on every issue involved [26]. In the present approach, within the context of avoiding such sources of confusion, and in an effort to enhance the benefits that the combined concepts of resilience and vulnerability may provide, a decision-making oriented analysis framework has been developed. In relation to other, more comprehensive and/or general, attempts to combine the vulnerability and resilience concepts, the present framework tries to incorporate simplified versions of the combined concepts, focusing mainly on their technical/engineering elements. On the one hand, such a simplification may downscale the concepts’ perspectives by adopting a specialized version of their essence and terminology compared with other similar efforts that do not necessarily simplify the two concepts [24,27]. On the other hand, it may offer an initial, possibly more focused, interpretation of a system’s performance and functioning. All in all, it is believed that it may form a step, along with other efforts, in the quest towards an integrated framework that could ideally include most of the properties of the combined approaches. The components of the current framework and their conceptual relationships are presented in the following sections. In order to display the various functions of the framework, a case study application is also demonstrated. In this regard, two forested areas with hypothetical properties, facing the potential threat of forest fires, have been used as examples.

2. Resilience-Vulnerability (RV) Analysis Framework

2.1. Definitions

For the scope of the current effort, the terms ‘resilience’ and ‘vulnerability’—as the ‘core’ of the methodological framework—need to be further illustrated. As stated, their definitions are more simplified versions than others provided in the general literature. Hence, an additional objective of the present approach should be to mitigate the complexity enclosed within the various existing definitions and concepts. Such an effort would also be more suitable for technical/engineering and decision-making oriented tactics. Overall, resilience and vulnerability are related to a system and the incurred disturbances [26]. In this regard, the following premises for the pertinent concepts may be delineated:
A Disturbance (D) is an instantaneous or continuous natural or man-made event that causes a system to react, to change its functions, or even to collapse. In this regard, forest fires are considered instantaneous disturbances, desertification constitutes a continuous disturbance, and management actions belong to the man-made disturbances. A disturbance can be either a positive or a negative event interchangeably, if the resulting state of a system is desirable or not. The identification of a disturbance per se may be conceived as the most important step of the framework’s processes, since the factors that affect the occurrence and intensity of a disturbance can be used for the determination of a system’s resilience and vulnerability.
Resilience (R) may be considered as the measurement of a system’s existing ability to absorb the effects of a disturbance while maintaining some of its key functions without collapsing to a previous evolutionary state. Such a definition also uses some elements from the term ‘ecological resilience’ [28]. However, it should be pointed out that—in a more holistic fashion—a resilient system may make use of a disturbance, adapt and innovate on the same route of development. Corresponding definitions treat resilience as persistence, as adaptability, and as transformability [9]. Although the current effort shares the same overall concerns and rationale, the definition used refers primarily on a system’s capacity to buffer or change a disturbance. All in all, resilience may also be considered to be a dynamic concept, which is constantly affected by a plethora of internal characteristics (e.g., species diversity and distribution) and external factors (e.g., management actions, policy measures, forces). Such characteristics and factors make the system capable of withstanding or absorb the impacts of a disturbance [18,22]. It has to be noted that the familiarity with a hazard can be considered as part of the system’s resilience [29]. This interpretation agrees with Holling (1973; 1984; and 1986) [28,30,31] and Gallopin (2006) [26], who state that occasional events of exposure can be considered to be one of the factors that affect resilience, since the system is gradually adapted to such conditions. Thus, in an attempt to quantify resilience, an index that refers to the specific system and disturbance per case is going to be presented.
Vulnerability (V): may be defined as the potential of a system to be damaged or changed by a predetermined disturbance. Similarly to resilience, it is a dynamic concept [8,10,12,32,33]. Vulnerability also depends on factors that do not only set the system as a ‘target’ (e.g., climatic conditions or economic interests); they may additionally act in favor of a disturbance’s impacts and effects (e.g., forest fuel density in forest fires). Such a definition presents similarities with the ‘potential for change’ term described in Gunderson and Holling, (2001) [18]. It should be also underlined that vulnerability may also relate in having too much resilience. A typical state is when a system is in a poverty trap, and then it is too vulnerable to be able to get out of the trap and shift directions [34].
However, in the current effort, vulnerability and resilience are treated as interchangeably positive or negative parameters and properties depending on the specific problem. Hence, the systems, as in the poverty trap example, may be very resilient to a persisting disturbance (a negative property) or exhibit low potential (vulnerability) in changing path (a positive property). Similarly to the resilience index mentioned above, a second index that would refer to vulnerability has to be developed. That index needs to be converted to a common scale of measurement in accordance with the resilience index. In essence, vulnerability can be classified into two distinct sets of values according to the element of exposure:
Actual Vulnerability (VA): when a system is exposed to a disturbance
Potential Vulnerability (VP): when a system is not actually exposed to a disturbance, but a future exposure may occur (e.g., climatic anomalies). According to the presented description of vulnerability and resilience, it should be pointed out that they are both connected to disturbance impacts. Vulnerability may lead to impacts, while resilience is called to absorb them and sustain the system’s functionality. Therefore, those two properties can be described and shaped in terms of the pertinent impact’s magnitude and occurrence. Specifically, it may be underlined that:
  • High vulnerability generally leads to greater impacts once a disturbance occurs.
  • High Resilience usually provides a higher absorbance capacity, ensuring the system’s survival.
  • The system’s elements that are directly related to the impact’s size are the ones that shape resilience and vulnerability.
In this context, and within the function of the proposed framework:
  • A system may be vulnerable (or have the potential to be harmed by a disturbance) and resilient (or able to withstand the impacts) at the same time.
  • When a system loses resilience, it does not become more vulnerable. It becomes less resilient.
Regarding the highest and lowest values or attributes that resilience (RMAX–RMIN) and vulnerability (VMAX–VMIN) may reach, it can be stated that these represent the distance from the best and worst conditions in each case at a given time. The pertinent values could only be used in management tasks such as status comparisons and cost estimations for a system to reach a more resilient or less vulnerable state. At the same time, they do not interfere with the original resilience and vulnerability concepts.
The Critical Point (CP): is the crossroads where resilience and vulnerability converge. Namely, it is the point where, when measured on a common scale, they are equal to each other (the CP signifies that R − V = 0 ⟶ R = V). In other words, CP determines the greatest magnitude of the impacts that a system may suffer and absorb without collapsing. The term ‘critical point’ has been chosen and adopted by the theory of Criticality [35]. It may also substitute for the term ‘threshold’, as described in the literature [36,37]. In general, both terms signify the point where a system crosses into a new regime. We believe that the term ‘critical point’ may better suit the objectives of the current effort, since it conveys, even by its etymology, the state of criticality. Thus, when a critical point is reached, a crisis would be imminent through the transformation of the system, and decision making should unquestionably take place.
The visualization of the pertinent terms is presented Figure 1, which represents the monitoring of the variables in the proposed Resilience–Vulnerability (RV) framework.
Moreover, it may be stated that:
  • Both resilience and vulnerability can be interchangeably positive or negative properties in a system, depending on its state [13,26]. If a certain state is desirable, then resilience can have a positive attribute, while vulnerability can have a negative one, and vice versa. This is a characteristic that may help decision makers and managers to determine where to focus their efforts, particularly when they need to maintain or improve a system’s existing conditions, or sometimes change them in favor of more desirable ones.
  • Within the current framework, resilience and vulnerability are treated as two temporally different systemic attributes which, when combined together, may provide useful information. Resilience is composed of factors that may help a system endure, resist and survive during and after the disturbance, whereas vulnerability includes factors that may act before and during the disturbance. This temporal differentiation is useful for the distinction of the factors on which resilience and vulnerability depend. This is more pronounced in cases where a factor—internal or external—is enclosed within both resilience and vulnerability. An example of such an element, borrowed from forest fire case sites, may be the density of the forest road network. Roads can serve as obstacles to fire crossings (a resilience factor), while they also provide greater access to arsonists or other individuals that could start a forest fire (a vulnerability factor).
  • Apart from the temporal distinction, and according to the ‘Panarchy’ theory, there may be a spatial distribution between the various scales of the factors that affect resilience and vulnerability [18,38]. Thus, the RV framework requires and promotes integrated and multi-scalar system analysis in order to provide the necessary information.

2.2. Central Hypotheses of the RV Framework

The following premises may connect resilience and vulnerability, and determine the main functions of the RV framework:
  • The estimations or measurements of resilience and vulnerability are of some value only when compared to each other and not used autonomously.
  • If R − V > 0, then the system can survive the disturbance with significant losses that are related to the results. High positive results mean lower damage afflicted to the system in respect to its absorption ability (resilience), and vice versa. It also means that the system will recuperate faster and with lesser internal or external efforts.
  • If R − V < 0, the system collapses. Its current state changes to an alternative one according to the ‘regime shift’ concept, as is also described in the pertinent literature [18]. The negative value determines the magnitude of the overall efforts required for the system to be restored to its previous state, assuming that it can actually be restored to it [18].
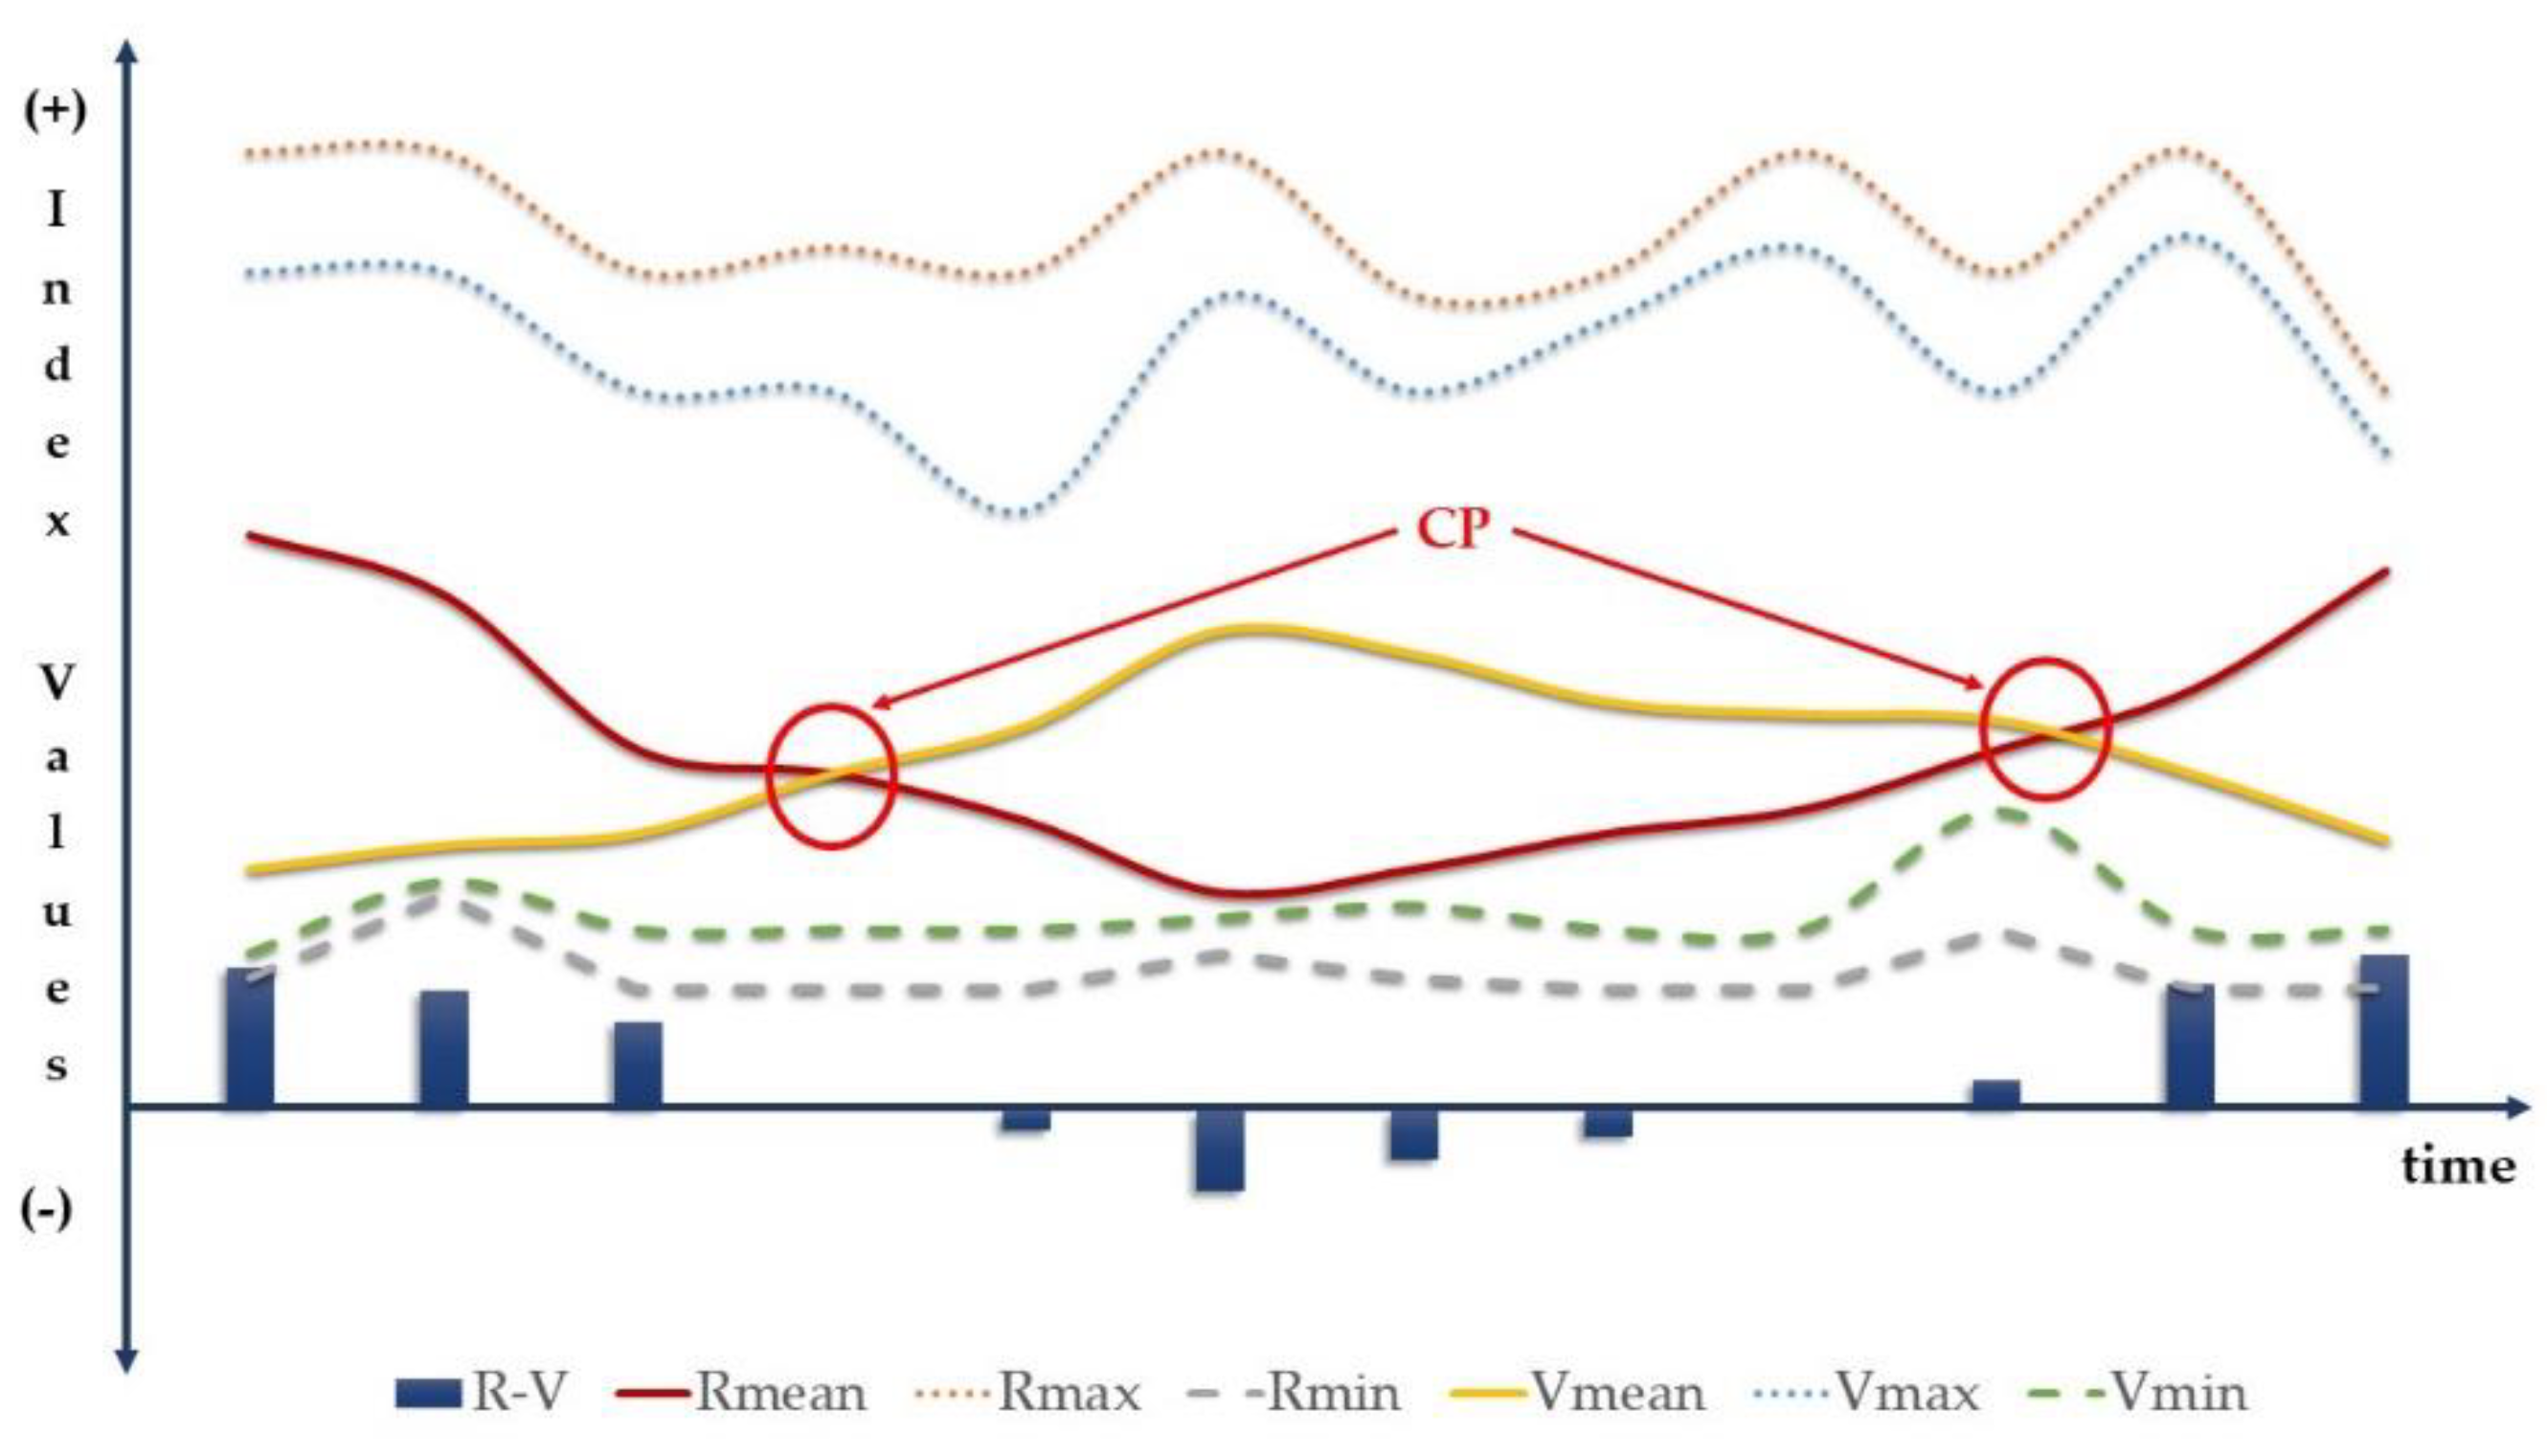
2.3. Non-Linearity

The interconnections and bonds, as well as the systemic complexity and convolution, usually rend apart any efforts for the precise forecasting of the outcome of an intervention. Thus, changes in any part or component may produce multiple results in the systemic components. In this context, nonlinearity and heterarchical relationships are usually present in every complex adaptive system. Such non-linear relations may also interconnect resilience and vulnerability. More specifically, they may impact:
  • Vulnerability and impact size;
  • The R − V results and the time of recovery of a system, especially when CP > 0;
  • The R − V results and the external restoration efforts and costs, especially when CP < 0.
Therefore, if the vulnerability (V) of a system (e.g., forest 1) is two times higher than the vulnerability of another system (e.g., forest 2) then non linearity dictates that the impacts (Ii) which would occur in these two systems do not necessarily follow an analogous relationship (if V1 = 2V2, then I1 ≠ 2I2). The function that assesses these relationships depends on the type of the system, as well as on the type of results. Nevertheless, the present framework would not directly address the non-linearity issues; it would, however, make the user cautious about them.

2.4. Applied Methodology

The methodology of the proposed framework is visualized in Figure 1. First of all, the current state of a system has to be identified (Step 1). This first step also includes the identification of the alternative states that might occur after a disturbance. Hence, decision makers can determine what will be changed or lost, and then define whether a state is desirable compared to the alternative ones. Consequently, the selected state leads to the classification of resilience and vulnerability as a positive or negative property. Such a classification illustrates the role of management options towards or against a potential change. Nevertheless, in many cases, the identification of the alternative states may be a challenging task, given the inherent spatial and temporal complexity. Thus, the identification may also be based on the advantages and services each of these alternative states may provide. For example, the current state of a forest provides a certain amount of goods and services (e.g., wood, wild fruits, recreational opportunities etc.). On the other hand, a burned forest, as an alternative state after the occurrence of fire, cannot provide any of these economic and/or environmental services. In this context, the identification of the alternative states of a system can help the decision makers and managers to identify, on their own terms, the disturbances that can make the system change.
The second step in Figure 1 refers to the identification of the disturbance. The appropriate definition of the disturbance and its roots may help and guide the decision makers to determine the key factors of the resilience and vulnerability indices. Furthermore, the potential exposure of a system to a disturbance has to be identified (Step 3). This step will clarify whether the system’s vulnerability refers to a real or potential threat. Indicative historical records may facilitate this task.
The fourth step is the most important step of the whole process, and it refers to the development of the resilience and vulnerability indices. Such indices have to be simple-structured, and depend on the specific system and disturbance [39,40,41,42,43]. First of all, the key factors that affect resilience and vulnerability need to be identified in different spatial and temporal scales. These factors can be classified based primarily on the examined system, and regardless of being internal or external in the following groups: a. Environmental, b. Social, c. Economic, and d. Organizational. Consecutively, it has to be determined whether such factors affect resilience and vulnerability in a proportional (positive) or inversely proportional (negative) way. In some cases, factor thresholds have to be specified. Nevertheless, these thresholds may be considered frequently and used unconsciously, reflecting the user’s expertise and experience.
Then, the magnitude or performance of the factors has to be determined in a numerical scale e.g., 1–5, where the lowest value represents the poorest performance. Simultaneously, the factors’ weights, reflecting their relative importance within the indices’ structures, should also be set. All such determinations are usually made using qualitative and quantitative variables. Hence, according to such premises, the relationships connecting resilience or vulnerability to magnitude values may be portrayed in the following pairs, for a 1 to 5 scale (factor magnitude, resilience or vulnerability value):
If a proportional (positive) relationship is followed, then it occurs: (1, 1), (2, 2) … (5, 5).
If an inversely proportional (negative) relationship is followed, then it becomes: (1, 5), (2, 4) … (5, 1).
From the variety of Multi-Criteria Decision Analysis (MCDA) methods, the Weighted Average Method (WAM) was chosen to be applied (Mendoza and Martins, 2006). Other methods, such as the Composite Programming described by UNESCO [44,45] may also be applied. However, by using WAM, the proposed framework can minimize the required mathematical complexity. On the other hand, by applying WAM, the need for valid expert knowledge and dependable data may be maximized. All in all, WAM satisfies the requirements, and it may be applied in many natural resources management cases. The application of the Weighted Average Method (WAM) calculates the final scores for both indices through Equation 1 and according to Table 1.
The overall presentation of the numeric (quantitative) values of the framework’s components are presented in Figure 2. It is an indicative presentation that includes all of the the components and the comparison between the main factors (resilience and vulnerability).
Equation 1. Final score calculation, where i is the factor notation.
In order to further clarify the overall application process, the following example of a factor included in the case study presented in Section 3 is given. The Percentage of the area covered by water bodies (%) factor affects both resilience and vulnerability, since it: a. serves as an obstacle to fire crossing, b. affects the vegetation, and c. affects the microclimatic conditions of the area. Thus, resilience is affected positively (higher percentage—higher resilience, Sustainability 12 09306 i001 Sustainability 12 09306 i001) and vulnerability is affected negatively (higher percentage—lower vulnerability, Sustainability 12 09306 i001 Sustainability 12 09306 i002). Therefore, if that factor receives a scaled value of ‘4—high percentage’, then resilience and vulnerability will receive the values of ‘4—high resilience’ and ‘2—low vulnerability’.
Starting the fifth step, the difference between the values of resilience and vulnerability (R − V equation) has to be calculated. According to the result, the management actions will be determined. The factors that affect resilience and vulnerability are called to play a key role in such an estimation. Decision makers and managers have to focus their efforts on regulating the key factors appropriately in each case, and in accordance with the principles of sustainable development. This last step may also provide some extra functions. By monitoring the key variables, as portrayed in Figure 1, and creating valid time-series, future projections of the system’s resilience and vulnerability trends, as well as various possible relevant scenarios may be developed and assessed. Furthermore, by calculating the system’s restoration cost in relation to the results of the ‘R − V’ equation, a more appropriate allocation of the available resources may be achieved.

3. Applied Example

The presented methodological framework is applied to two fictional forest ecosystems using only the qualitative variables and a numerical scale for the quantification of the variables, ranging from 1 to 5. The pertinent objectives are:
to demonstrate the framework’s function;
to present the various approaches for the estimation of the R − V equation. An additional reason for a more complete demonstration is the usage of two forests instead of one.
The forests’ resilience and vulnerability are evaluated under the threat or disturbance of forest fires. Since the disturbance is the same for both systems, common basic or key factors or indicators will be used. Finally, it has to be noted that the forests are assumed to be of the same type regarding vegetation cover and plant species, etc. The various premises involved for the example application are illuminated in the following:
  • The forests’ existing state is desirable.
  • The forests are the sole recipients of the disturbance’s impacts. No social consequences are examined. As a note, the framework may cover social issues in a wider and more complex systems assessment.
  • The factors that affect resilience and vulnerability are both internal and external, and they are represented by the systems’ existing conditions as these have been shaped through time.
  • External support may be provided to the systems in terms of management and policy actions, when required.
  • No thresholds are examined. Thresholds are considered to be included in the initial qualitative evaluation.
  • The applied factors are not enclosed in wider groups or categories.
  • All of the factors are of equal importance.

3.1. Key Factors

The key factors that will be used for the evaluation and quantification of the systems’ resilience and vulnerability are:
(1)
Forest fuel density: this indicates the potential magnitude of a fire event, and serves as a starting point for fires.
(2)
Forest roads density: roads serve as obstacles to fire crossings, and affect the area’s accessibility for both ground fire fighting forces and arsonists.
(3)
Percentage covered by water bodies: water serves as an obstacle to fire crossing, affects the vegetation, and affects the microclimatic conditions of the area.
(4)
Percentage of bare land (natural clearings only): this also serves as an obstacle to fire crossing, and affects the area’s microclimatic conditions.
(5)
Forest’s health: infected and dead trees can serve as more flammable forest fuel and affect the rate of regeneration.
(6)
Percentage of trees that are not of reproductive age: this affects the forests’ regeneration speed after a fire event.
(7)
Slopes: these affect accessibility and fire transference (mobility).
(8)
Human activities and infrastructure magnitude: these serve as potential fire starting points, and indicate a part of the area’s expressed economic interests.
(9)
Economic and political interests: these affect (increase) the likelihood of a fire’s occurrence, assuming that the proper conditions are at hand.
(10)
Law enforcement: this affects the likelihood of a fire’s occurrence, assuming that the area is exposed to various factors and interests.
(11)
Fire fighting forces’ performance: this affects the speed of reaction, as well as the final losses.
(12)
Aerial/ground patrols (or remote observations): these affect the likelihood of a fire’s occurrence, and the speed of the reaction.
(13)
Climatic conditions (temperature, humidity, wind speed): these affect the likelihood of a fire’s occurrence, and the fire’s mobility and destructive capacity. The three component factors can be evaluated separately, each being assigned a different weight, and then their average scaled value can be used. In the present application, they have been treated as a unified factor by using equal weights.
In an application using real data, statistical analyses (principal component, correlation, regression, or other relevant processes) may reduce the number of the required factors or indicators for the main indices to be formed. The numerical scale values for the resilience and vulnerability assessment, as well as the relationship that connects such factors to resilience and vulnerability per se, are presented in the following Table 2.

3.2. Systems’ Current Conditions

The forest ecosystem’s existing conditions, as well as their highest and lowest values for a given time period according to the presented key factors, are delineated in Table 3.

3.3. Resilience—Vulnerability Evaluation

By combining the factors that describe the fictional forests’ scaled existing conditions—as presented in Table 3—the relationships that connect the applied factors to resilience and vulnerability—as portrayed in Table 2—and the coupled factor-resilience and vulnerability values—as explained in the fourth step of the framework’s methodology—Table 4 and Table 5 are produced, presenting the WAM application.

3.4. Results and Conclusions

The displayed results represent just a snapshot of the systems’ resilience and vulnerability fluctuation. Therefore, only an instantaneous image may be provided for each system. The monitoring procedure, as it is presented in Figure 2, may provide more useful information to scientists and decision makers.
According to the results, the first ecosystem, with an R−V > 0, will probably be able to absorb the applied damage of a potential fire event. In this case, there are no elements that would allow the fire event to reach a higher magnitude or to last long enough to produce considerable impacts. The forest’s internal characteristics—like roads, natural clearings, water bodies, etc. —can play a crucial role towards having less undesirable impacts. Such a fact may permit the natural recovery and reorganization of the system with no or limited external support.
On the other hand, the results indicate that the second forest ecosystem, where R−V < 0, would probably not be able to absorb the effects of a potential fire event, due to its internal conditions. Such an incident, either by being of great magnitude or by lasting for a long period, might force the system to collapse to a totally undesirable state where none of the former internal functions and external services could be provided. Additionally, it would not be able to recover without external interference, assuming that it can actually recover, and the damage is not permanent. Such a recovery may be manmade, consisting of restoration management efforts or through natural regeneration. The first option includes an economic cost, while the second usually requires a long time period. Time is a crucial element of the whole restoration process, since significant secondary impacts may further degrade the system (e.g., soil erosion) and affect the final outcomes.
Furthermore, the identification, categorization and classification of the factors affecting resilience and vulnerability can guide managers, and thus lead towards the focusing of resource implementation and efforts in a timely, orderly and spatially-appropriate fashion. It has to be noted that some parameters or factors cannot be affected by management actions, such as climatic conditions. Hence, decision makers will need to estimate and/or determine and decide on the degree of interference according to the various factors’ weight of importance, and then appropriately adjust the estimation of the remaining key factors.

4. Discussion

The presented framework offers an approach in the series of attempts concerning the combined use of the resilience and vulnerability concepts. In this effort, Turner et al. (2003) developed a vulnerability analysis framework (VF) that defines resilience as a vulnerability component, which encloses the system’s response, coping and adaptive capacities. In the current approach, an analysis framework of vulnerability and resilience (RV) that tries to incorporate a specialized version, focusing on technical and engineering elements, was delineated. However, apart from such a nascent difference, the two frameworks may be further distinguished. VF can provide a more broad analysis template that may focus on multiple stresses and on the different vulnerability levels of the system’s internal components. Additionally, it may enclose a more integrated approach towards the original concepts of resilience and vulnerability. In this context, their main difference remains that VF may constitute a general conceptual framework that focuses on the description of the various elements and their interfering relationships within a coupled system. In relation to this, the RV approach can provide a way of estimating the resilience and vulnerability properties of a system by using a simplified version focusing predominately on the technical components. In another approach, Chapin et al. (2009) integrate both concepts into the development of sustainable strategies within ecosystem stewardship. Similarly to the RV framework, the resilience concept is used as an independent element, and not as a vulnerability component. Nevertheless, resilience is used to regulate new stresses and deal with uncertainty, and vulnerability is linked to known perturbations. In the RV framework, both concepts refer to known stresses. Furthermore, Chapin et al. (2010) [27] introduce a transformation from undesirable trajectories. This approach is also incorporated in the RV framework; however, it is masked under the classification of the system’s state as desirable or undesirable. In this regard, RV offers an identification of the stresses that can lead to undesirable states, and an estimation of the system’s potential to diverge from such a course. Additionally, both concepts relate to adaptability, while in the present framework, adaptability is considered to be a part of resilience. Moreover, both Turner et al. (2003) [24] and Chapin et al. (2010) [27] treat resilience as a positive or desirable property, and vulnerability as a negative or undesirable one, while—in the current framework—such classifications may be interchangeable depending on the issue under examination. Nevertheless, all three frameworks recognize the nonlinearity among the various interlinked elements of a system, as well as the need for multi-scalar analysis. Finally, the proposed RV framework may display similarities with the ‘specified resilience’ concept regarding the aspect of the identified hazard [46]. However, such a concept is scale-oriented, since it examines the resilience of the particular components of a system, and not the resilience of the system as a whole to a specified hazard, as is attempted in the current framework.
Miller et al. (2010) [12] state that the complex concepts of resilience and vulnerability need to be transformed into simple, implementable and operational options which are accessible to practitioners and decision makers. They also provide a series of suggestions towards future plausible directions. In this regard, the presented approach attempted to simplify the resilience and vulnerability concepts, in an effort to reduce their properties into quantifiable or measurable values. Such a transformation is achieved through the development of pertinent factors or indices, estimated in a common numerical scale per system and disturbance. These indices may be differentiated temporally, prior to and after a disturbance, and they can include variables from multiple scales both within and outside a system. Hence, the current framework may provide a simple and useful tool for decision makers to deal with known disturbances, and to adjust the described properties of a system. It is believed that this effort may lead towards preserving valuable goods and services, which—in their turn—might affect other dependent systems to produce undesirable outcomes. Nevertheless, the proposed RV framework requires further developmental efforts, so as to be able to embrace the complex nature of vulnerability and resilience in a more holistic fashion. All in all, it is believed that the present effort may offer some service in the quest towards the development of the synthesis of a more integrated, comprehensive and applicable framework, in order to further expand the intriguing and—at the same time—expedient concepts of resilience and vulnerability. Additionally, the results of the framework can be used as inputs in other Decision Making techniques and approaches, e.g., Analytic Hierarchy Process / Analytic Network Process, Promethee, and SWOT analysis, etc. Those can also be as sub-indices of indices that describe the conditions of ecosystems and other systems in more detail. This increases the value of the framework as a tool.

Author Contributions

The respective authors contributed to the present effort as follows: Conceptualization, N.A.S., D.E.T. and C.A.K.; Methodology, N.A.S. and C.A.K.; Investigation, N.A.S.; Data curation, C.G.V.; Writing—original draft preparation/review and editing, N.A.S. and D.E.T.; Visualization, D.E.T. and C.G.V.; Supervision, C.A.K. All authors have read and agreed to the published version of the manuscript.

Funding

This research received no external funding.

Acknowledgments

The authors would like to thank all who contributed with constructive comments and reviews in all of the stages of the development of the present effort.

Conflicts of Interest

The authors declare no conflict of interest.

References

  1. Adair, J. Decision Making and Problem Solving Strategies; Kogan Page: The Sunday Times: London, UK, 2010; ISBN 978-0-7494-6027-3. [Google Scholar]
  2. Bianco, D. Decision Making, in Encyclopedia of Management Edited by Marilyn M. Helms, 5th ed.; Thomson Gale Editions: Detroit, MI, USA, 2006. [Google Scholar]
  3. Corvalán, C.F.; Briggs, D.J.; Zielhuis, G.; Organization, W.H. Decision-Making in Environmental Health: From Evidence to Action; E. & F.N. Spon: London, UK, 2000; ISBN 978-0-419-25940-4. [Google Scholar]
  4. Daellenbach, H.G. Systems and Decision Making: A Management Science Approach; John Wiley & Sons: Chichester, UK, 1994; ISBN 978-0-471-95094-3. [Google Scholar]
  5. Qudrat-Ullah, H.; Spector, M.; Davidsen, P. (Eds.) Complex Decision Making: Theory and Practice; Understanding Complex Systems; Springer: Berlin/Heidelberg, Germany, 2008; ISBN 978-3-540-73664-6. [Google Scholar]
  6. Adam, F. Encyclopedia of Decision Making and Decision Support Technologies; Humphreys, P., Ed.; Information Science Reference: Hershey, PA, USA, 2008; ISBN 978-1-59904-843-7. [Google Scholar]
  7. Morcol, G. Handbook of Decision Making, 1st ed.; Routledge: Boca Raton, FL, USA, 2006; ISBN 978-1-57444-548-0. [Google Scholar]
  8. Adger, W.N.; Kelly, P.M. Social vulnerability to climate change and the architecture of entitlements. Mitig. Adapt. Strateg. Glob. Chang. 1999, 4, 253–266. [Google Scholar] [CrossRef]
  9. Folke, C.; Carpenter, S.; Walker, B.; Scheffer, M.; Chapin, T.; Rockström, J. Resilience Thinking: Integrating Resilience, Adaptability and Transformability. Ecol. Soc. 2010, 15, 20. [Google Scholar] [CrossRef]
  10. Leichenko, R.M.; O’Brien, K.L. The Dynamics of Rural Vulnerability to Global Change: The Case of southern Africa. Mitig. Adapt. Strateg. Glob. Chang. 2002, 7, 1–18. [Google Scholar] [CrossRef]
  11. Janssen, M.A.; Schoon, M.L.; Ke, W.; Börner, K. Scholarly networks on resilience, vulnerability and adaptation within the human dimensions of global environmental change. Glob. Environ. Chang. 2006, 16, 240–252. [Google Scholar] [CrossRef] [Green Version]
  12. Miller, F.; Osbahr, H.; Boyd, E.; Thomalla, F.; Bharwani, S.; Ziervogel, G.; Walker, B.; Birkmann, J.; van der Leeuw, S.; Rockström, J.; et al. Resilience and Vulnerability: Complementary or Conflicting Concepts? Ecol. Soc. 2010, 15, 1–25. [Google Scholar] [CrossRef]
  13. Walker, B.; Holling, C.S.; Carpenter, S.; Kinzig, A. Resilience, Adaptability and Transformability in Social–ecological Systems. Ecol. Soc. 2004, 9, 5. [Google Scholar] [CrossRef]
  14. Füssel, H.-M. Vulnerability: A generally applicable conceptual framework for climate change research. Glob. Environ. Chang. 2007, 17, 155–167. [Google Scholar] [CrossRef]
  15. Pratt, C.; Kaly, U.; Mitchell, J. How to Use the Environmental Vulnerability Index; South Pacific Applied Geoscience Commission: Suva, Fiji, 2004. [Google Scholar]
  16. Kaly, U.; Pratt, C.; Mitchell, J. The Environmental Vulnerability Index 2004. SOPAC; South Pacific Applied Geoscience Commission: Suva, Fiji, 2004. [Google Scholar]
  17. Carpenter, S.; Walker, B.; Anderies, J.M.; Abel, N. From Metaphor to Measurement: Resilience of What to What? Ecosystems 2001, 4, 765–781. [Google Scholar] [CrossRef]
  18. Gunderson, L.H.; Holling, C.S. (Eds.) Panarchy: Understanding Transformations in Human and Natural Systems, 1st ed.; Island Press: Washington, DC, USA, 2001; ISBN 978-1-55963-857-9. [Google Scholar]
  19. Gunderson, L.; Holling, C.S.; Light, S. (Eds.) Barriers and Bridges to the Renewal of Ecosystems and Institutions; Columbia University Press: New York, NY, USA, 1995; ISBN 978-0-231-10102-8. [Google Scholar]
  20. Adger, W.N. Social and ecological resilience: Are they related? Prog. Hum. Geogr. 2000, 24, 347–364. [Google Scholar] [CrossRef]
  21. Kasperson, J.X.; Kasperson, R.E. Global Environmental Risk; Routledge: London, UK, 2013; ISBN 978-1-136-53382-2. [Google Scholar]
  22. Folke, C.; Carpenter, S.; Elmqvist, T.; Gunderson, L.; Holling, C.S.; Walker, B. Resilience and Sustainable Development: Building Adaptive Capacity in a World of Transformations. AMBIO 2002, 31, 437–440. [Google Scholar] [CrossRef] [PubMed]
  23. Berkes, F.; Folke, C.; Colding, J. Linking Social and Ecological Systems: Management Practices and Social Mechanisms for Building Resilience; Cambridge University Press: Cambridge, UK, 2000; ISBN 978-0-521-78562-4. [Google Scholar]
  24. Turner, B.L.; Kasperson, R.E.; Matson, P.A.; McCarthy, J.J.; Corell, R.W.; Christensen, L.; Eckley, N.; Kasperson, J.X.; Luers, A.; Martello, M.L.; et al. A framework for vulnerability analysis in sustainability science. Proc. Natl. Acad. Sci. USA 2003, 100, 8074–8079. [Google Scholar] [CrossRef] [Green Version]
  25. Folke, C. Resilience: The emergence of a perspective for social–ecological systems analyses. Glob. Environ. Chang. 2006, 16, 253–267. [Google Scholar] [CrossRef]
  26. Gallopín, G.C. Linkages between vulnerability, resilience, and adaptive capacity. Glob. Environ. Chang. 2006, 16, 293–303. [Google Scholar] [CrossRef]
  27. Chapin, F.S.; Carpenter, S.R.; Kofinas, G.P.; Folke, C.; Abel, N.; Clark, W.C.; Olsson, P.; Smith, D.M.S.; Walker, B.; Young, O.R.; et al. Ecosystem stewardship: Sustainability strategies for a rapidly changing planet. Trends Ecol. Evol. 2010, 25, 241–249. [Google Scholar] [CrossRef] [PubMed] [Green Version]
  28. Holling, C.S. Resilience and Stability of Ecological Systems. Annu. Rev. Ecol. Syst. 1973, 4, 1–23. [Google Scholar] [CrossRef] [Green Version]
  29. Wears, R.L. Resilience Engineering: Concepts and Precepts. Qual. Saf. Health Care 2006, 15, 447–448. [Google Scholar] [CrossRef] [Green Version]
  30. Holling, C.S. Perceiving and Managing the Complexity of Ecological Systems; GLDB-2/UNUP-560; United Nations University Press: Tokyo, Japan, 1984. [Google Scholar]
  31. Holling, C.S. The Resilience of Terrestrial Ecosystems; Local Surprise and Global Change; Cambridge University Press: Cambridge, UK, 1986; pp. 292–317. [Google Scholar]
  32. Dalziell, E.P.; McManus, S.T. Resilience, Vulnerability, and Adaptive Capacity: Implications for System Performance; IFED: Stoos, Switzerland, 2004. [Google Scholar]
  33. Luers, A.L. The surface of vulnerability: An analytical framework for examining environmental change. Glob. Environ. Chang. 2005, 15, 214–223. [Google Scholar] [CrossRef]
  34. Karavitis, C.A.; Tsesmelis, D.E.; Skondras, N.A.; Stamatakos, D.; Alexandris, S.; Fassouli, V.; Vasilakou, C.G.; Oikonomou, P.D.; Gregorič, G.; Grigg, N.S.; et al. Linking drought characteristics to impacts on a spatial and temporal scale. Water Policy 2014, 16, 1172–1197. [Google Scholar] [CrossRef]
  35. Buchanan, M. Ubiquity: The Science of History… or Why the World is Simpler than We Think; Crown Publishers: New York, NY, USA, 2001; ISBN 978-0-609-60810-4. [Google Scholar]
  36. Sprinz, D.; Churkina, G. The Analysis of Environmental Thresholds. Paper prepared for the Advanced Research Workshop “Caspian Sea: A Quest for Environmental Security”; Venice International University: Venice, Italy, 1999. [Google Scholar]
  37. Allen, C.D.; Birkeland, C.; Chapin, F.S. Thresholds of Climate Change in Ecosystems: Final Report, Synthesis and Assessment Product 4.2; University of Nebraska: Lincoln, NE, USA, 2009. [Google Scholar]
  38. Holling, C.S. Understanding the Complexity of Economic, Ecological, and Social Systems. Ecosystems 2001, 4, 390–405. [Google Scholar] [CrossRef]
  39. Skondras, N.A.; Karavitis, C.A.; Gkotsis, I.I.; Scott, P.J.B.; Kaly, U.L.; Alexandris, S.G. Application and assessment of the Environmental Vulnerability Index in Greece. Ecol. Indic. 2011, 11, 1699–1706. [Google Scholar] [CrossRef]
  40. Tsesmelis, D.E.; Oikonomou, P.D.; Vasilakou, C.G.; Skondras, N.A.; Fassouli, V.; Alexandris, S.G.; Grigg, N.S.; Karavitis, C.A. Assessing structural uncertainty caused by different weighting methods on the Standardized Drought Vulnerability Index (SDVI). Stoch. Environ. Res. Risk Assess. 2019, 33, 515–533. [Google Scholar] [CrossRef]
  41. Tsesmelis, D.E.; Skondras, N.A.; Khan, S.Y.A.; Kolokytha, E.; Karavitis, C.A. Water, Sanitation and Hygiene (WASH) Index: Development and Application to Measure WASH Service Levels in European Humanitarian Camps. Water Resour. Manag. 2020, 34, 2449–2470. [Google Scholar] [CrossRef]
  42. Skondras, N. Decision Making in Water Resources Management: Development of a Composite Indicator for the Assessment of the Social-Environmental Systems in Terms Resilience and Vulnerability to Water Scarcity and Water Stress. Ph.D. Dissertation, Agricultural University of Athens, Athens, Greece, 2015. [Google Scholar]
  43. Oikonomou, P.D.; Tsesmelis, D.E.; Waskom, R.M.; Grigg, N.S.; Karavitis, C.A. Enhancing the Standardized Drought Vulnerability Index by Integrating Spatiotemporal Information from Satellite and In Situ Data. J. Hydrol. 2019, 569, 265–277. [Google Scholar] [CrossRef]
  44. UNESCO. Integrated Environmental Evaluation of Water Resources Development; The Scientific Group of UNEP/UNESCO Project: Paris, France, 1987. [Google Scholar]
  45. UNESCO. Training Guidance for the Integrated Evaluation of Water Resources Development Projects; The Scientific Group of UNEP/UNESCO Project: Paris, France, 1988. [Google Scholar]
  46. Walker, B.; Abel, N.; Anderies, J.; Ryan, P. Resilience, Adaptability, and Transformability in the Goulburn-Broken Catchment, Australia. Ecol. Soc. 2009, 14, 12. [Google Scholar] [CrossRef]
Figure 1. Monitoring the variables of the framework.
Sustainability 12 09306 g001
Figure 2. Methodology of the RV framework.
Sustainability 12 09306 g002
Table 1. Basic WAM options for the calculation of the final scores for resilience and vulnerability.
FactorsWeightsNormalized WeightsFactor MagnitudeVulnerability/Resilience Magnitude
F.1.W1N.W.1m.1.M.1.
F.2.W2N.W.2m.2.M.2.
F.3.W3N.W.3m.3.M.3.
F.4.W4N.W.4m.4.M.4.
F.n.WnN.W.nm.n.M.n.
TotalW TotalN.W Total = 1 Final Score
Table 2. Factors and relationships.
Value1234567
1Too LowToo LowToo LowToo LowVery PoorToo LowToo Low
2LowLowLowLowPoorLowLow
3MediumMediumMediumMediumMediumMediumMedium
4HighHighHighHighGoodHighHigh
5Too HighToo HighToo HighToo HighVery GoodToo HighToo High
R Sustainability 12 09306 i001 Sustainability 12 09306 i002 Sustainability 12 09306 i001 Sustainability 12 09306 i001 Sustainability 12 09306 i001 Sustainability 12 09306 i001 Sustainability 12 09306 i001 Sustainability 12 09306 i001 Sustainability 12 09306 i001 Sustainability 12 09306 i001 Sustainability 12 09306 i001 Sustainability 12 09306 i001 Sustainability 12 09306 i001 Sustainability 12 09306 i002
V Sustainability 12 09306 i001 Sustainability 12 09306 i001 Sustainability 12 09306 i001 Sustainability 12 09306 i002 Sustainability 12 09306 i001 Sustainability 12 09306 i002 Sustainability 12 09306 i001 Sustainability 12 09306 i002 Sustainability 12 09306 i001 Sustainability 12 09306 i002- Sustainability 12 09306 i001 Sustainability 12 09306 i001
Value8910111213
1Too LowToo LowToo LowVery PoorToo LowHigh, Dry High
2LowLowLowPoorLowHigh, Dry, Medium
3MediumMediumMediumMediumMediumMed., Med., Med.
4HighHighHighGoodHighMed., Wet, Med.
5Too HighToo HighToo HighVery GoodToo HighLow, Wet, Low
R--- Sustainability 12 09306 i001 Sustainability 12 09306 i001 Sustainability 12 09306 i001 Sustainability 12 09306 i001-
V Sustainability 12 09306 i001 Sustainability 12 09306 i001 Sustainability 12 09306 i001 Sustainability 12 09306 i001 Sustainability 12 09306 i001 Sustainability 12 09306 i001-- Sustainability 12 09306 i001 Sustainability 12 09306 i002
Table 3. Current conditions in the forests.
FactorsForest 1Current ValueBest ValueWorse ValueForest 2Current ValueBest ValueWorse Value
1Low214High414
2High451Low251
3Medium351Low251
4High441Medium341
5Good451Poor251
6Medium341Low241
7Low215High415
8Low214High414
9Low215Medium315
10Medium341High441
11Good451Poor251
12High451Low251
13Med., Med., Med452High, Dry, Med252
Table 4. Forest 1 analysis.
FactorsWeightN.WeightResilienceRMAXRMINWeightN.WeightVulnerabilityVMINVMAX
110.11145210.10225
210.11145110.10215
310.11135110.10315
410.11144110.10225
510.11145110.10215
610.111341
710.11145110.10215
8 10.10225
9 10.10215
10 10.10315
1110.111451
1210.111451
13 10,10214
Total913.784.771.111012.201.304.90
R − V = 1.58 > 0
Table 5. Forest 2 analysis.
FactorsWeightN.WeightResilienceRMAXRMINWeightN.WeightVulnerabilityVMINVMAX
110.11125210.10425
210.11145110.10415
310.11145110.10415
410.11134110.10325
510.11125110.10415
610.111241
710.11125110.10415
8 10.10425
9 10.10315
10 10.10415
1110.111251
1210.111251
13 10,10414
Total912.304.771.111013.801.304.90
R − V = −1.50 < 0
Publisher’s Note: MDPI stays neutral with regard to jurisdictional claims in published maps and institutional affiliations.

