Article

Drought Identification and Trend Analysis Using Long-Term CHIRPS Satellite Precipitation Product in Bundelkhand, India

by
Varsha Pandey
1,
Prashant K Srivastava
1,2,*,
Sudhir K Singh
3,
George P. Petropoulos
4 and
Rajesh Kumar Mall
2
1
Remote Sensing Laboratory, Institute of Environment and Sustainable Development, Banaras Hindu University, Varanasi 221005, India
2
DST-Mahamana Center of Excellence in Climate Change Research, Banaras Hindu University, Varanasi 221005, India
3
K. Banerjee Centre of Atmospheric and Ocean Studies, Nehru Science Centre, IIDS, University of Allahabad, Allahabad 211002, India
4
Department of Geography, Harokopio University of Athens, El. Venizelou 70, Kallithea, 17671 Athens, Greece
*
Author to whom correspondence should be addressed.
Sustainability 2021, 13(3), 1042; https://doi.org/10.3390/su13031042
Submission received: 19 November 2020 / Revised: 13 January 2021 / Accepted: 14 January 2021 / Published: 20 January 2021
(This article belongs to the Special Issue Sustainable Geography)

Abstract

:
Drought hazard mapping and its trend analysis has become indispensable due to the aggravated impact of drought in the era of climate change. Sparse observational networks with minimal maintenance limit the spatio-temporal coverage of precipitation data, which has been a major constraint in the effective drought monitoring. In this study, high-resolution satellite-derived Climate Hazards Group Infrared Precipitation with Station (CHIRPS) data has been used for computation of Standardized Precipitation Index (SPI). The study was carried out in Bundelkhand region of Uttar Pradesh, India, known for its substantial drought occurrences with poor drought management plans and lack of effective preparedness. Very limited studies have been carried out in assessing the spatio-temporal drought in this region. This study aims to identify district-wide drought and its trend characterization from 1981 to 2018. The run theory was applied for quantitative drought assessment; whereas, the Mann-Kendall (MK) test was performed for trend analysis at seasonal and annual time steps. Results indicated an average of nine severe drought events in all the districts in the last 38 years, and the most intense drought was recorded for the Jalaun district (1983–1985). A significant decreasing trend is observed for the SPI1 (at 95% confidence level) during the post-monsoon season, with the magnitude varying from −0.16 to −0.33 mm/month. This indicates the increasing severity of meteorological drought in the area. Moreover, a non-significant falling trend for short-term drought (SPI1 and SPI3) annually and short- and medium-term drought (SPI1, SPI3, and SPI6) in winter months have been also observed for all the districts. The output of the current study would be utilized in better understanding of the drought condition through elaborate trend analysis of the SPI pattern and thus helps the policy makers to devise a drought management plan to handle the water crisis, food security, and in turn the betterment of the inhabitants.

1. Introduction

Climate change imposes severe threats on water regimes by altering the seasonal and inter-annual precipitation patterns. The trend analysis of the precipitation performed by several studies has highlighted that climate change may transform the arid regions to more arid and wet regions to wetter [1,2]. Climate change is anticipated to increase the intensity, duration, and severity of droughts and other hydrological extremes that have become a heuristic area for the process research and water resource management practices [3,4]. Droughts have a distinct impact on the wellbeing of society and the environment by reducing gross primary productivity and estimated to affects about 55 million people globally [5]. Unlike other natural hazards, drought is a slow phenomenon that has long-lasting impacts on food security and welfare. It is characterized as a stochastic process, initiated by below-average precipitation that reduces soil moisture, groundwater, streamflow, and other water storage, which has become more threatening and persistent in association with global warming [6].
The prevalent and recurrent droughts are widespread in arid and semi-arid regions due to an insufficient amount of precipitation that refers to meteorological drought. Meteorological drought is defined as a deficit in precipitation over a region for an extended period [7,8]. Generally, it is defined in terms of the magnitude of precipitation deficiency and its duration. India is amongst the most vulnerable drought-prone countries in the world. Almost 28% of the total geographical area in India inhabited with 12% of the total population, is facing prolonged and extreme droughts [9]. The major concern is its increasing frequency, where at least one drought is reported every three years since the last five decades [10]. Liu and Chen [11] highlighted that India is one of the ten countries which is at high socioeconomic risk due to increasing drought in the climate change scenarios. Studies reported that the regions with recurrent drought episodes are at high risk of projected droughts, indicating the increased spatial extent due to climate change [12,13]. Repeated drought is the characteristic of the Uttar Pradesh (UP) state located in the Indo-Gangetic plain that has fertile cropland with huge potential. The Bundelkhand is one of the worst affected regions of UP that experiences recurring drought episodes which led to huge economic losses and thus results in massive migration [14,15]. Singh, et al. [16] reported that this region experienced increased drought frequency (threefold) during the period 1968–1992. Previous studies have identified that this region suffered from recurrent drought during the year 2002–2014, which significantly impacted the agricultural practices and livelihoods [17,18,19]. The rational mitigation of drought is possible by its cause identification and monitoring, characterization, and trend behaviors for attaining water security through different suitable drought-proofing systems.
The meteorological drought is characterized by its duration, distribution, severity, and intensity. The conventional drought monitoring includes analysis of the rain gauge network-based observations; which is reliable with long-term records. However, this method has several limitations such as spatial contiguity, data unavailability for remote areas, high-cost maintenance, and near real-time data inaccessibility to the common users, etc. Alternatively, the spatially contiguous precipitation data allows a better assessment of the drought events. In India, the precipitation data facilitated by the Indian Meteorological Department (IMD) data at 0.25 degree resolution is commonly used in various studies. Additionally, the high-resolution satellite data are widely used in recent times for spatio-temporal characterization of the drought events [20,21,22]. The Climate Hazards Group Infrared Precipitation with Station (CHIRPS) data is a newly developed satellite data derived high-resolution precipitation product merged with the rain-gauge observations, and has proven its great potential in various hydrological studies including drought monitoring for more than 35 years [23,24]. Many parts of Asia are conforming to the applicability of CHIRPS datasets for real-time retrospective analysis of drought. Prakash [25] evaluated various satellite-data derived precipitation products for the Indian subcontinent and reported better performance of CHIRPS dataset over other datasets for long-term hydrological studies. Shrestha, et al. [22] employed the CHIRPS precipitation data for drought monitoring over the Koshi River basin, Nepal and recommended the utility of CHIRPS data for such studies. CHIRPS data also has shown its reasonably better performance for capturing drought events over various parts of China [20,26,27]. Pandey, et al. [28] evaluated the performance of high-resolution satellite precipitation datasets, i.e., TRMM, PERSIANN-CDR, and CHIRPS to verify the drought monitoring utility of these products and observed the highest accuracy for CHIRPS data when compared with the gridded gauge dataset over the Bundelkhand region.
Several indices have been developed to estimate and monitor meteorological drought intensity at different temporal and spatial scales. The SPI is one of the commonly used indexes because of its versatile nature, suitability for various climatic conditions, flexibility in time scale, and dependency on precipitation data alone [29,30]. SPI has the potential to identify the beginning and end of a drought event and evaluate the drought impact at various temporal scales (monthly to annual). SPI has been employed in numerous studies as it uses only precipitation to identify the different dimensions of drought, such as duration, intensity, severity, and frequency [31,32]. Very limited studies have been carried out in assessing the spatio-temporal drought characteristics in the adversely drought-affected region as Bundelkhand. Thomas, et al. [33] evaluated spatio-temporal characteristics of meteorological drought and estimated the trend using SPI at multiple time scales (3, 6, and 12-month) in the Bundelkhand region. However, they primarily relied on the point-based gauge station precipitation data, which had limitations of spatio-temporal contiguity and data accessibility. Out of several techniques, the Mann-Kendall (MK) test is widely used for the significance test in trend analysis in various studies due to its monotonic (either increasing or decreasing trend) characteristics [34]. The drought trends and its spatio-temporal variability analysis in changing climate have become indispensable to investigate the climate-induced changes and recommend policymakers to implement adequate intervention strategies for water resource management, agriculture, and pastoral plans. The main objectives of the study include: the quantitative evaluation of spatio-temporal characteristics of meteorological drought with the high-resolution CHIRPS data derived SPI using the run theory, and investigation of monotonic change signals using trend analysis of SPI by the MK test at annual, seasonal, and monthly time scale.

2. Materials and Methods

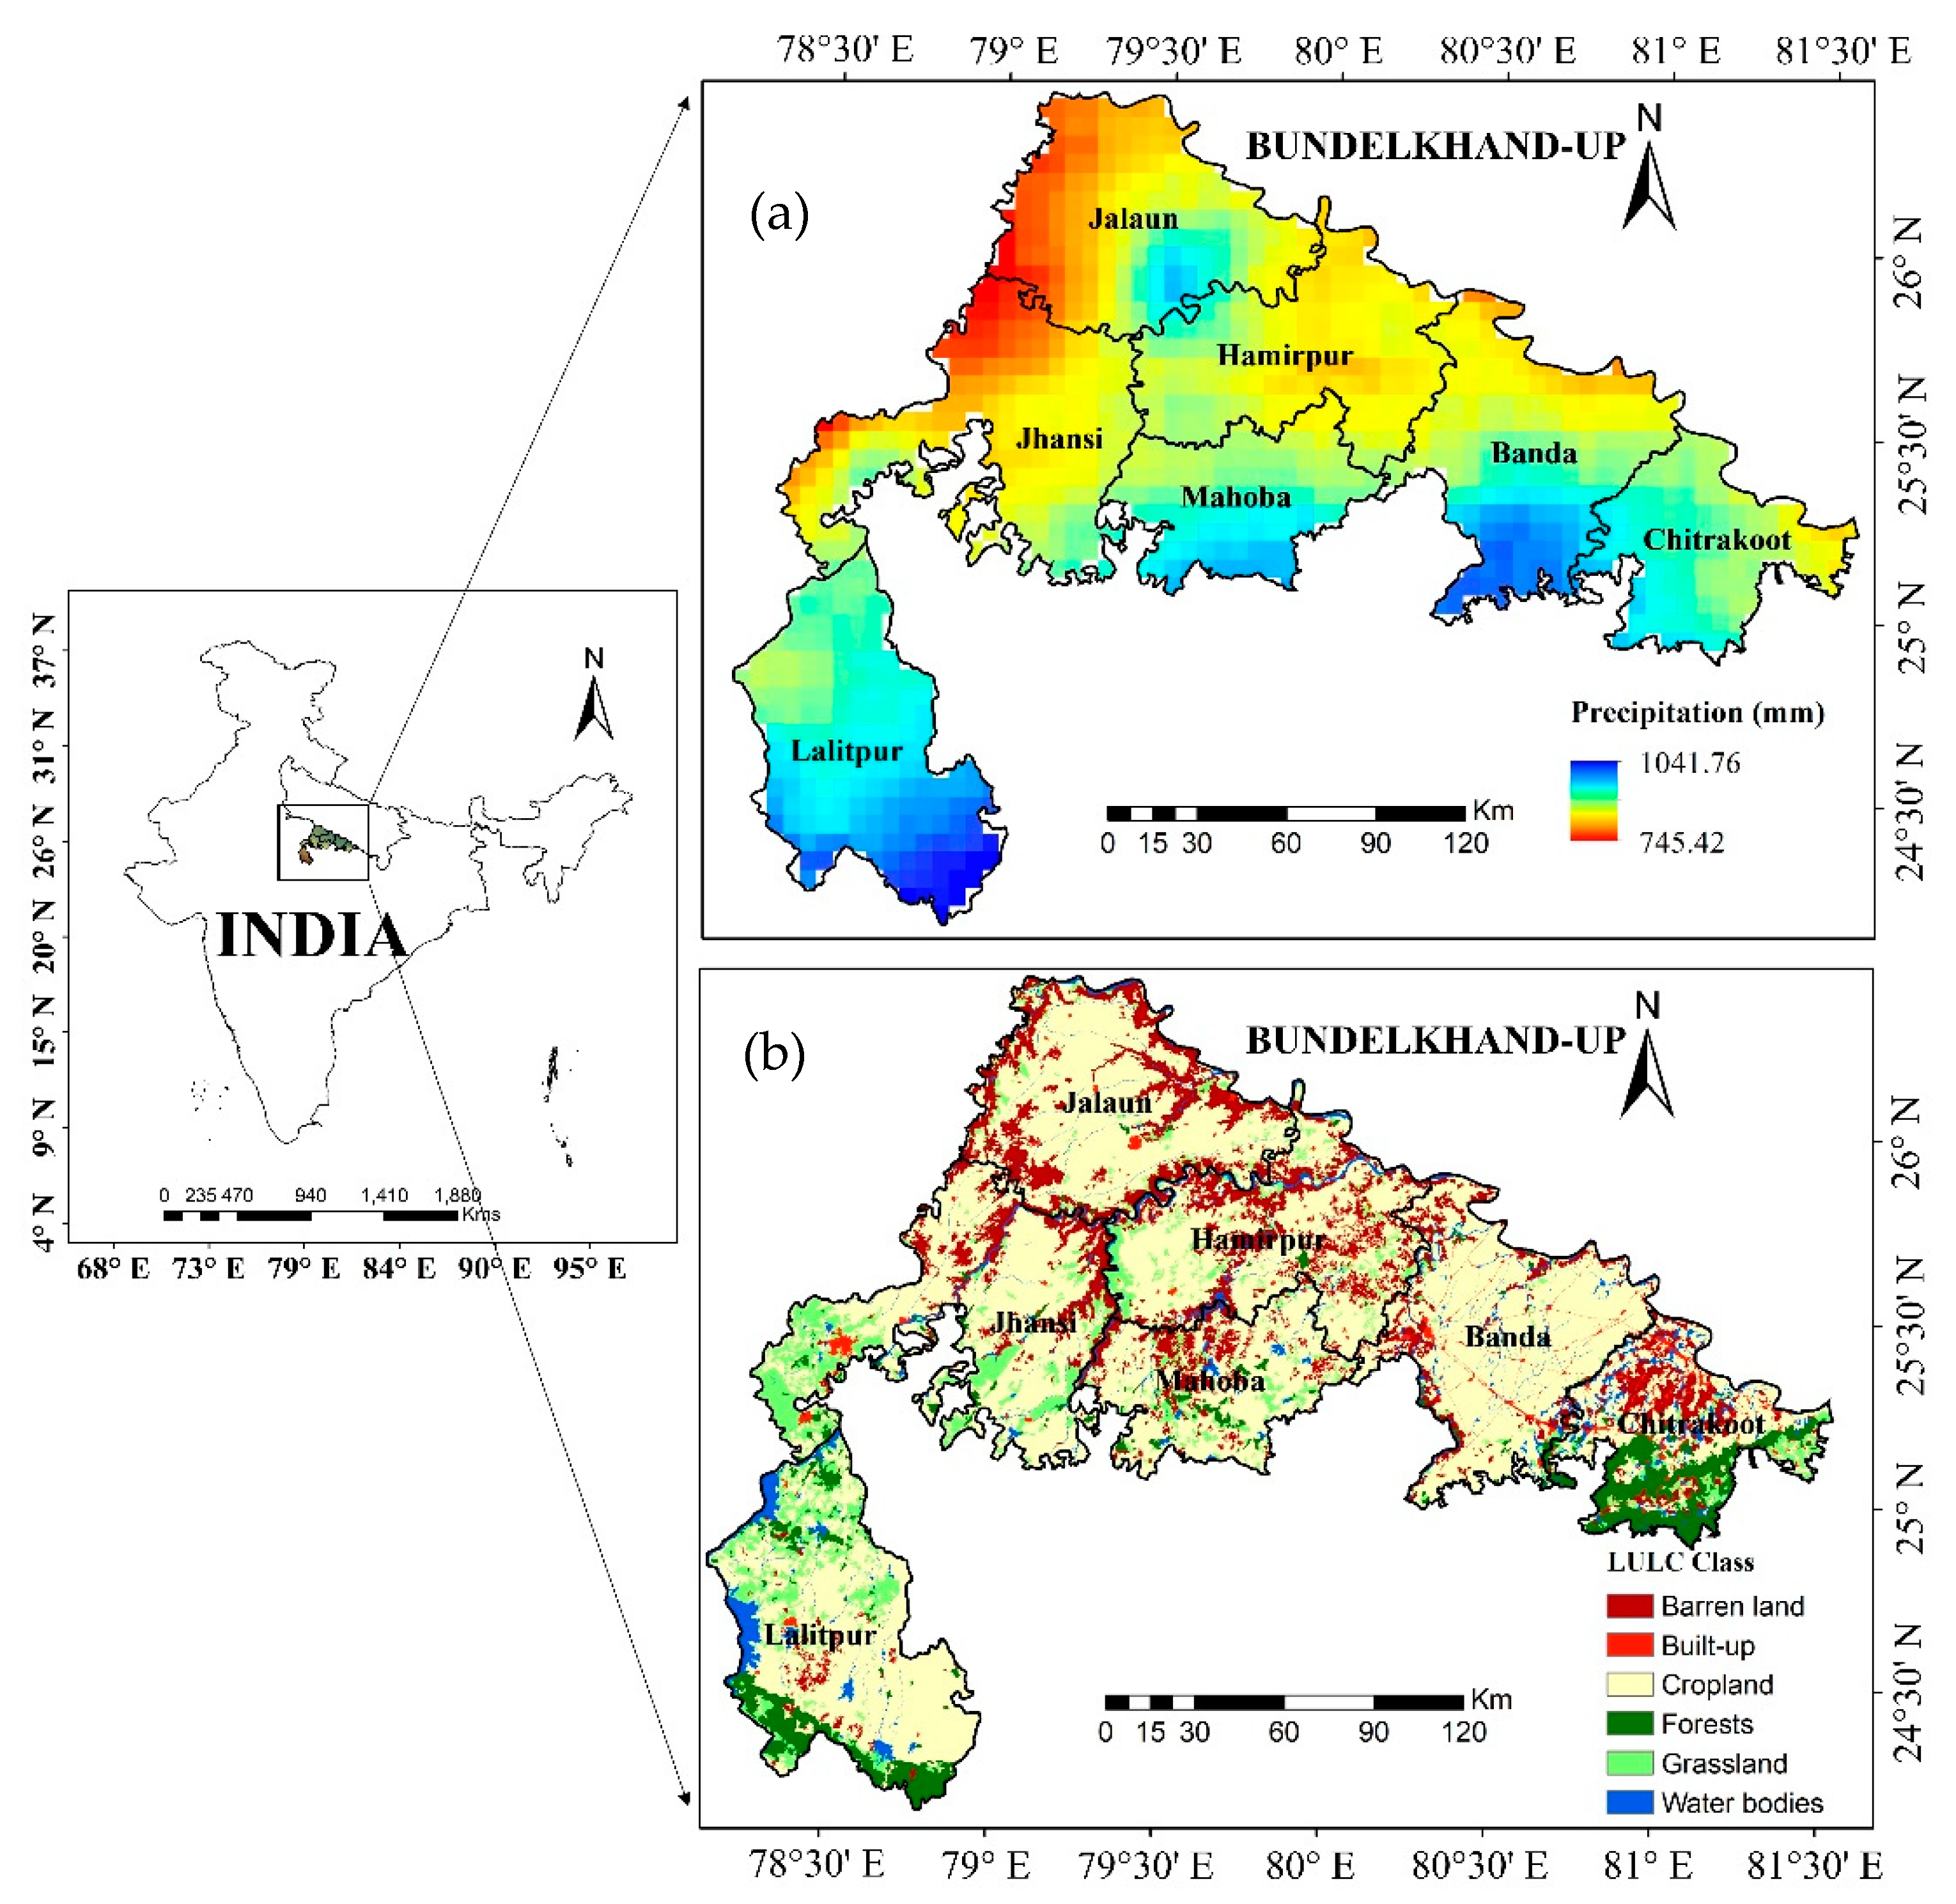
2.1. Study Area and Datasets

The study was carried out in the Bundelkhand-UP region, which is located in the central part of India. It extends between 24°18′ N and 26°45′ N and 78°16′ E and 81°56′ E, covering 29,485.34 km2 area distributed in seven districts (Figure 1). The elevation of the area ranges from 619 m above mean sea level (AMSL) in the southern part to 58 m AMSL in the northeastern region. The region comprises gently sloping uplands with the highly undulating landscape which includes rocky outcrops and plateaus as well as fertile plains, rivers, and ravines [35]. The climatic condition of the region is semi-arid to sub-tropical with four distinctive seasons i.e., winter (January-February: JF), pre-monsoon (March-May: MAM), monsoon (June-September: JJAS), and post-monsoon (October-December; OND). The minimum and maximum temperature ranges between 5–10 °C and 35–48 °C respectively. This region encounters a repetitive uncertain and erratic precipitation pattern. The average annual precipitation ranges between approximately 665 and 1035 mm; where about 90% of the total precipitation occurs during the monsoon season [36]. Due to the inadequacy of groundwater resources in the region, agriculture is mostly rainfed. Commonly, the monsoonal rainfall variation is unpredictable and sporadic that affects the crop productivity in this region. In Bundelkhand, unlike other agricultural growing area, Rabi crops (69%) is predominant in comparison to Kharif (31%) crops. The main Rabi season (October–February) crops are Wheat and Gram and October rainfall is crucial for their sowing. The recurrent and continuous drought in Bundelkhand disrupts agricultural livelihood and escalating food crisis, surface and groundwater depletion, and poverty [37]. Understanding the nature of the trend in precipitation patterns and drought conditions in the area is extremely important to devise a drought management plan for securing food and water crisis and thereby improve the wellbeing of the inhabitants.
The CHIRPS satellite precipitation data is developed by the U.S. Geological Survey (USGS) and the Climate Hazards Group of University of California with the prime focus on improving land modeling activities, especially drought monitoring and forecasting. It is IR-based blended climatic precipitation product of global climatology, gauge observation, and satellite estimation. It has long-term records (1981-present) at very high spatial resolution (0.05° × 0.05°), and three different temporal resolutions, pentadal, decadal, and monthly scale. In the present study, the monthly CHIRPS version 2.0 from 1981 to 2018 is used for drought characterization and trend analysis. The validation of this product for the study site has been previously carried out in detail by Pandey, et al. [28].

2.2. Methodology

2.2.1. Standardized Precipitation Index (SPI) Calculation

In this study, we have calculated SPI at 1-, 3-, 6-, and 12-months scale for evaluation of meteorological drought using R package “precintcon” [39]. In agreement with previous studies, gamma distribution was found to be fitted well to long-term precipitation records [30,40,41,42]. It is defined in terms of frequency or probability density function, as follows:
g ( x ) = 1 β α Γ ( α ) x α 1 e x / β ,   f o r   X > 0
where Γ ( α ) is the gamma function; x is the precipitation; and α and β are the shape and scale parameters respectively. The maximum probability for a multiyear dataset, α, and β vary according to the following equation:
α = 1 4 A 1 + 1 + 4 A 3 , β = x ¯ α ,   where   A = ln ( x ¯ ) ln ( x ) n
where x ¯ represents the precipitation mean and n number of observations. Since the gamma function is undefined for X = 0 and a precipitation distribution may contain zeros, the cumulative probability becomes:
H ( x ) = q + ( 1 q ) G ( x )
The probability of no precipitation (q) is calculated by the division of m and n, as q = m n . Here m is the number of the zero-precipitation amount in a temporal sequence of data. The H (x) is then transformed into z score value with mean zero and unit variance, which denotes the value of the SPI [20,43]. The SPI drought ranges are presented in Table 1.

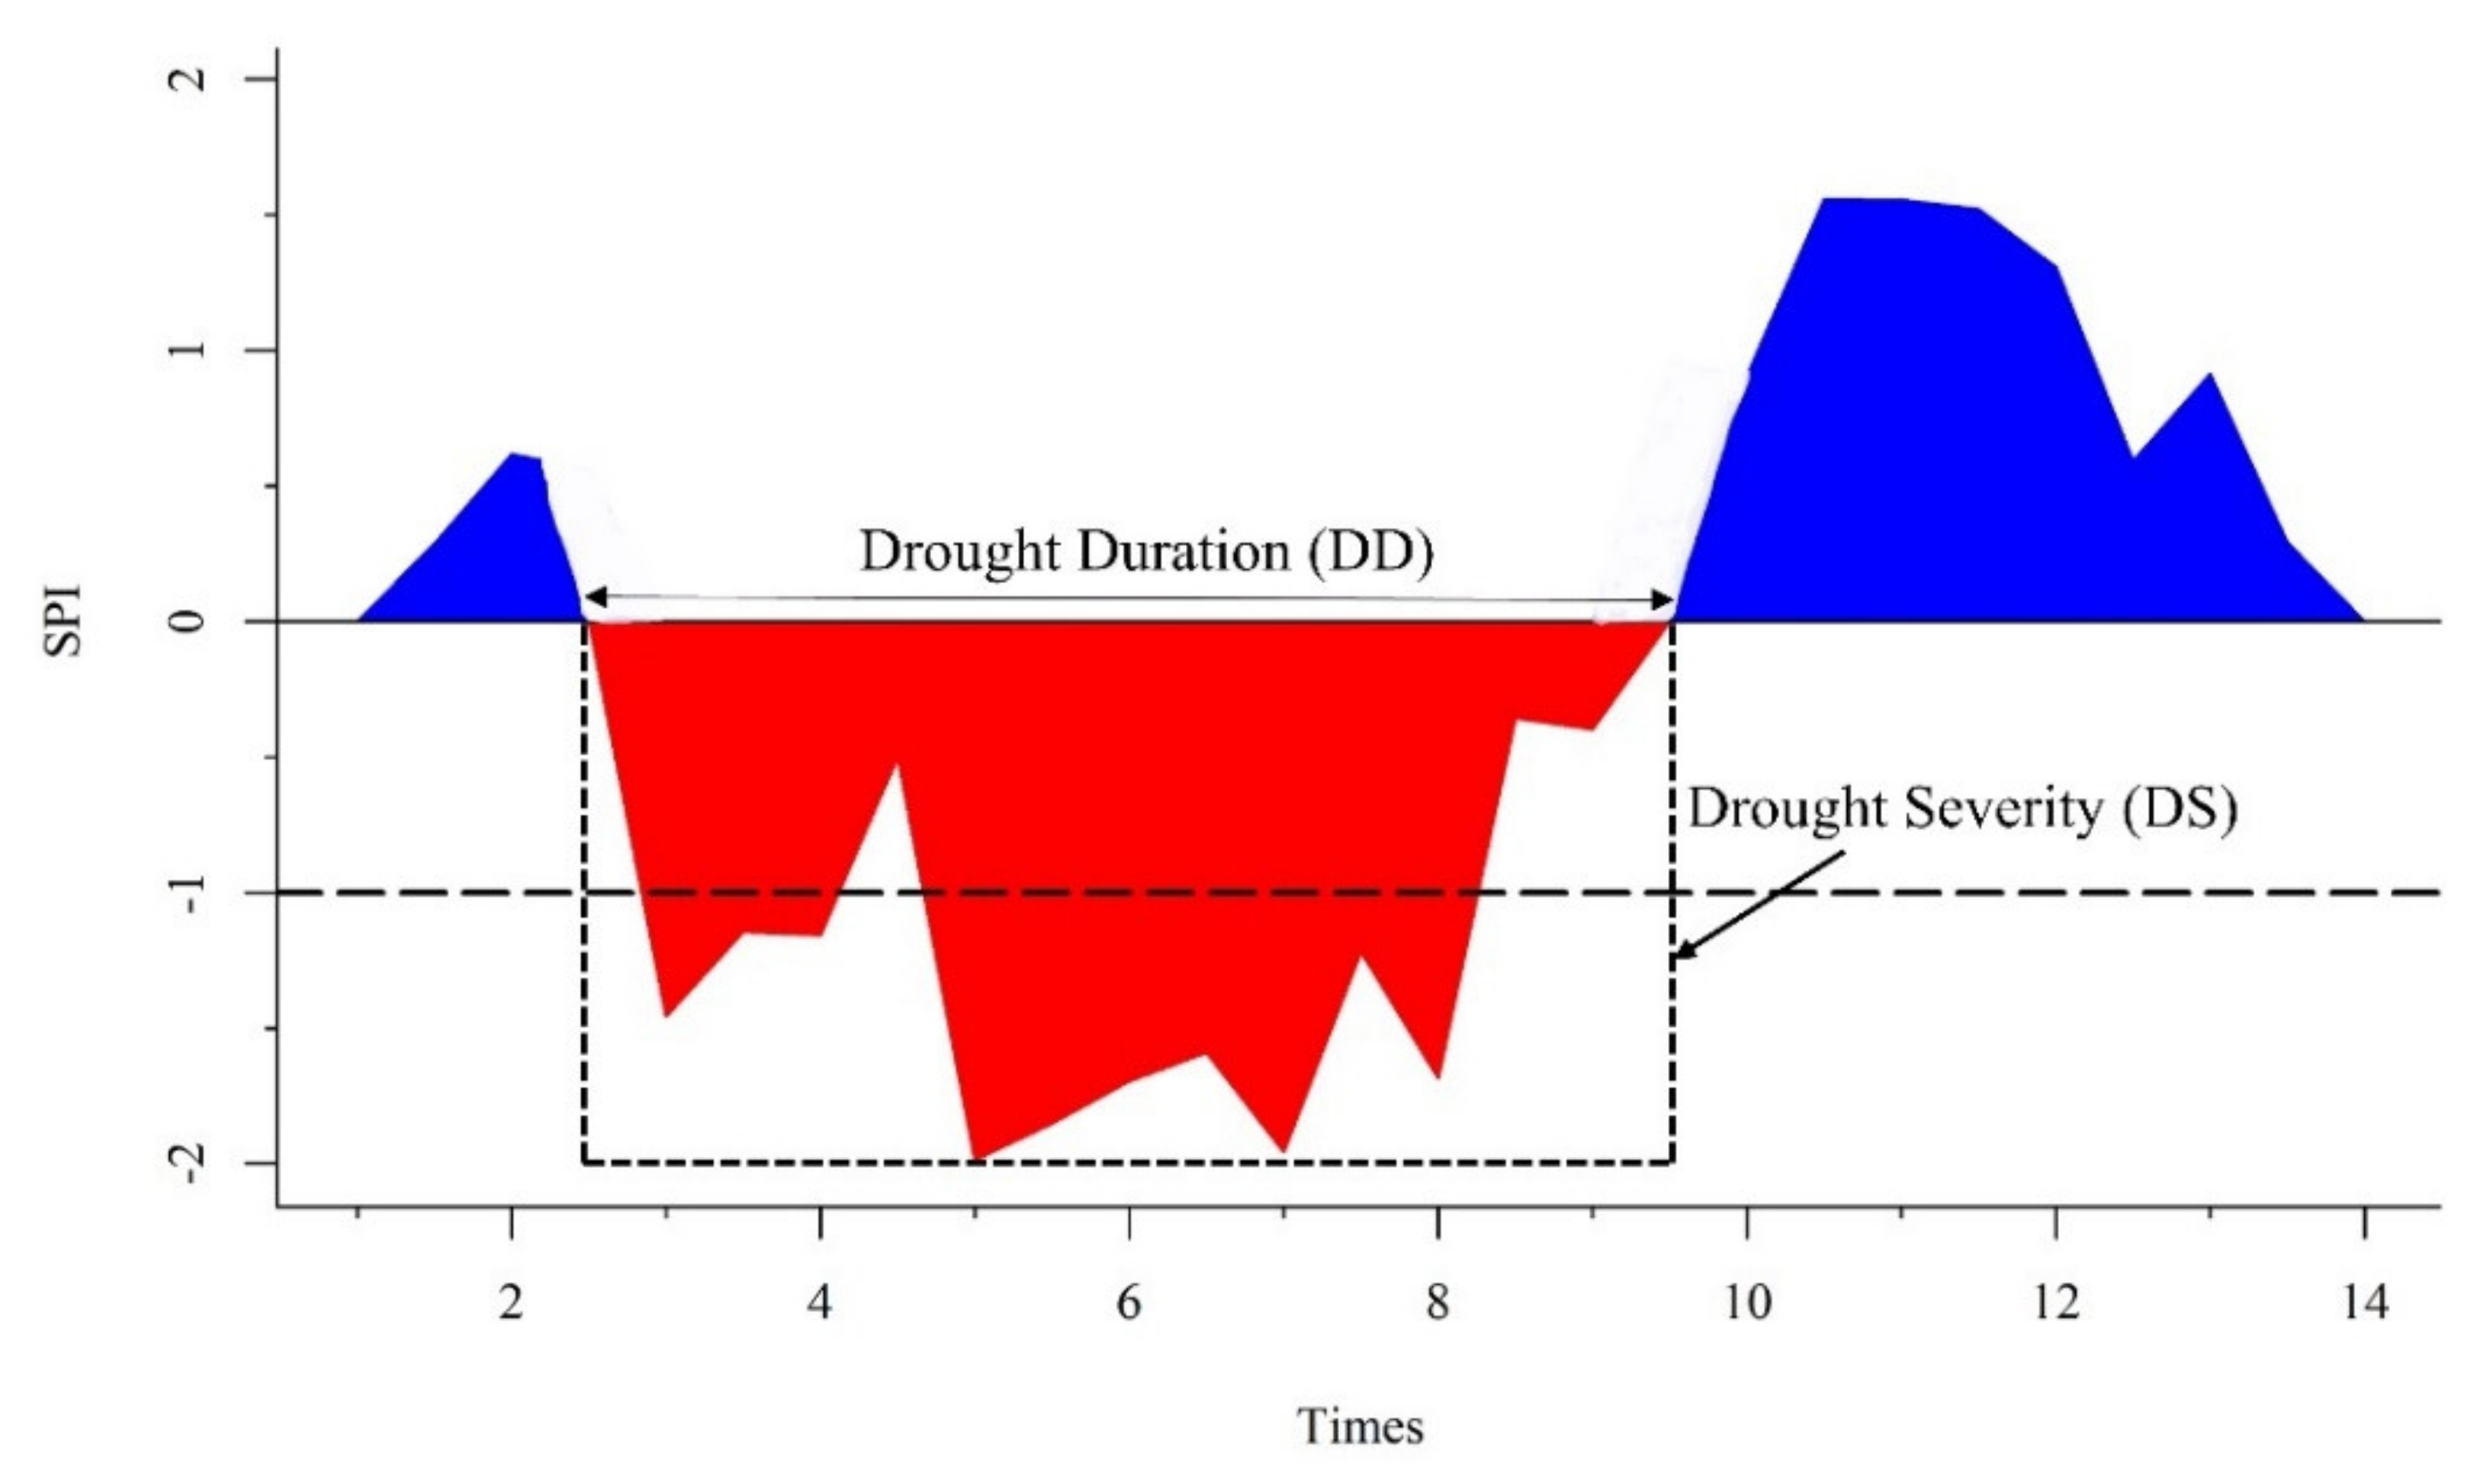
2.2.2. Drought Identification and Characterization Using Run Theory

The run theory is proposed by Yevjevich [45] for drought parameter identification and investigation of their statistical properties in terms of run-length (drought duration), sun-sum (drought severity), and intensity. The primary element for parameter derivation is the threshold level, which may be constant and/or time-dependent. In this study, the value of −1.0 was selected as the threshold level and the filled blue and red areas represent the positive and negative average monthly SPI values, respectively. The drought event is considered when SPI is continuously below zero and reaches a value of −1.0 or less and persisted at least two months continuously. Drought events start when the SPI follows the above said condition and ends when the SPI value becomes positive (SPI > 0) [42]. Once the drought events are recognized, the quantification of their four important characteristics as duration, intensity, severity, and frequency are measured using the run theory (Figure 2) [45]. The drought duration (DD) is the period (number of months) between the initiation and termination of a drought event. The absolute sum of all drought index values during a drought event is measured as drought severity (DS), and the ratio of severity and the drought duration is termed as drought intensity (DI) [46,47,48]. The formulas are given below in which, e denotes a drought event, j is a month, Indexj is the SPI value in a month j.
D S = j = 1 D D I n d e x j e
D I = D S D D

2.2.3. Trend Analysis

In this study, trend analysis has been performed using SPI values for 38 years (1981–2018). The rank-based nonparametric test or trend analysis by MK test was used to detect the significant trends in SPI, the intensity of dry and wet periods, and drought characteristics. The MK test statistics S is computed as:
S = i = 1 n 1 j = i + 1 n s g n ( x j x i )   w h e r e ,   sgn ( x j x i ) = + 1 x j > x i 0 x j = x i 1 x j < x i   a n d   n   i s   t h e   s a m p l e   s i z e .
when n ≥ 8, S is approximately normally distributed with the mean and the variance as:
E ( S ) = 0
V ( S ) = n ( n 1 ) ( 2 n + 5 ) i = 1 n t i i ( i 1 ) ( 2 i + 5 ) 18
where ti represents the number of ties up to sample i. The standardized test statistics (Z) is computed as:
Z = S 1 V a r ( S ) S > 0 0 S = 0 S + 1 V a r ( S ) S < 0
Here, the Z statistics follow the normal distribution. The positive and negative value of Z values shows an upward and downward trend, respectively. The absolute Z value as |Z| > 1.96 and |Z| > 2.57 indicates a significant and extremely significant trend, respectively (at a significant level of α = 0.05 and α = 0.01, respectively).
The magnitude of the trend in time is estimated by the non-parametric sen’s slope estimator test [49]. The slope is calculated as;
S i = x j x k j k i = 1 , 2 . . . . . N
where xj and xk is the time series value at time j and k (j > k), respectively. The median of these N values of Si represents the sen’s slope estimator. The positive value of this slope indicates an upward trend and negative values downward trends with magnitude.

3. Results and Discussion

The long-term annual average precipitation of the Bundelkhand-UP region ranged from 840.97 mm to 940.01 mm. The maximum annual precipitation (1507.24 mm) was measured in Lalitpur in the year 2013. Annual rainfall patterns were nearly similar across all the seven districts except Lalitpur. The difference in the means among the districts varies from about 1 mm to 100 mm. Banda, Mahoba, and Chitrakoot were showing similar patterns with the mean rainfall difference measured between 3 mm to 11 mm, alike Jalaun, Hamirpur, and Jhansi showed a similar pattern with the mean difference ranged from 1mm to 15mm. The annual precipitation variability (>18) and deviation (>165) were high (Table 2).
The precipitation data for the period of 1981 to 2018 was used for the spatio-temporal evaluation of SPI at four different monthly scales (1, 3, 6, and 12) for all the seven districts of the Bundelkhand region. The time series of SPI for the Bundelkhand-UP region at 1, 3, 6, and 12 monthly scales are shown in Figure 3, and the filled positive blue and negative red areas represent the average monthly SPI for wet and dry periods, respectively. The SPI1 very well illustrates the monthly fluctuation of precipitation deficit. A similar pattern in seasonal scale with smoother curves was also observed for the average time series of SPI3 and SPI6. Mainly, the shorter time scales of SPI values (1, 3, and 6) accurately describe the early warning of meteorological drought along with interim soil moisture and crop yield deficit (agricultural drought) [29,44,50]. In SPI12, due to cumulative duration, the identification of wet and dry periods becomes much evident and reflects long-term drought pattern (hydrological drought). Though drought was severe before the year 2000, the frequency increased after the year 2000. According to the SPI12, nine distinct drought events were clearly identified in the whole region in the year 1981–1982, 1983–1985, 1986–1988, 1991–1994, 2001–2003, 2004–2006, 2007–2008, 2009–2011, and 2014–2016 with intermittently normal and wet periods. The previous studies [18,51] have widely reported the widespread drought of 2002–2003 and 2007–2008 that is well captured in the present study. For example, Padhee, et al. [52], reported a significant deficiency in soil moisture (23% to 84%) and thereby yield during the Rabi cropping season for 2007–2008 drought event. The drought events were observed almost similar in the pattern based on the SPI12 time series in all the seven districts, indicated spatial autocorrelation (Figure A1, Figure A2 and Figure A3) [53].

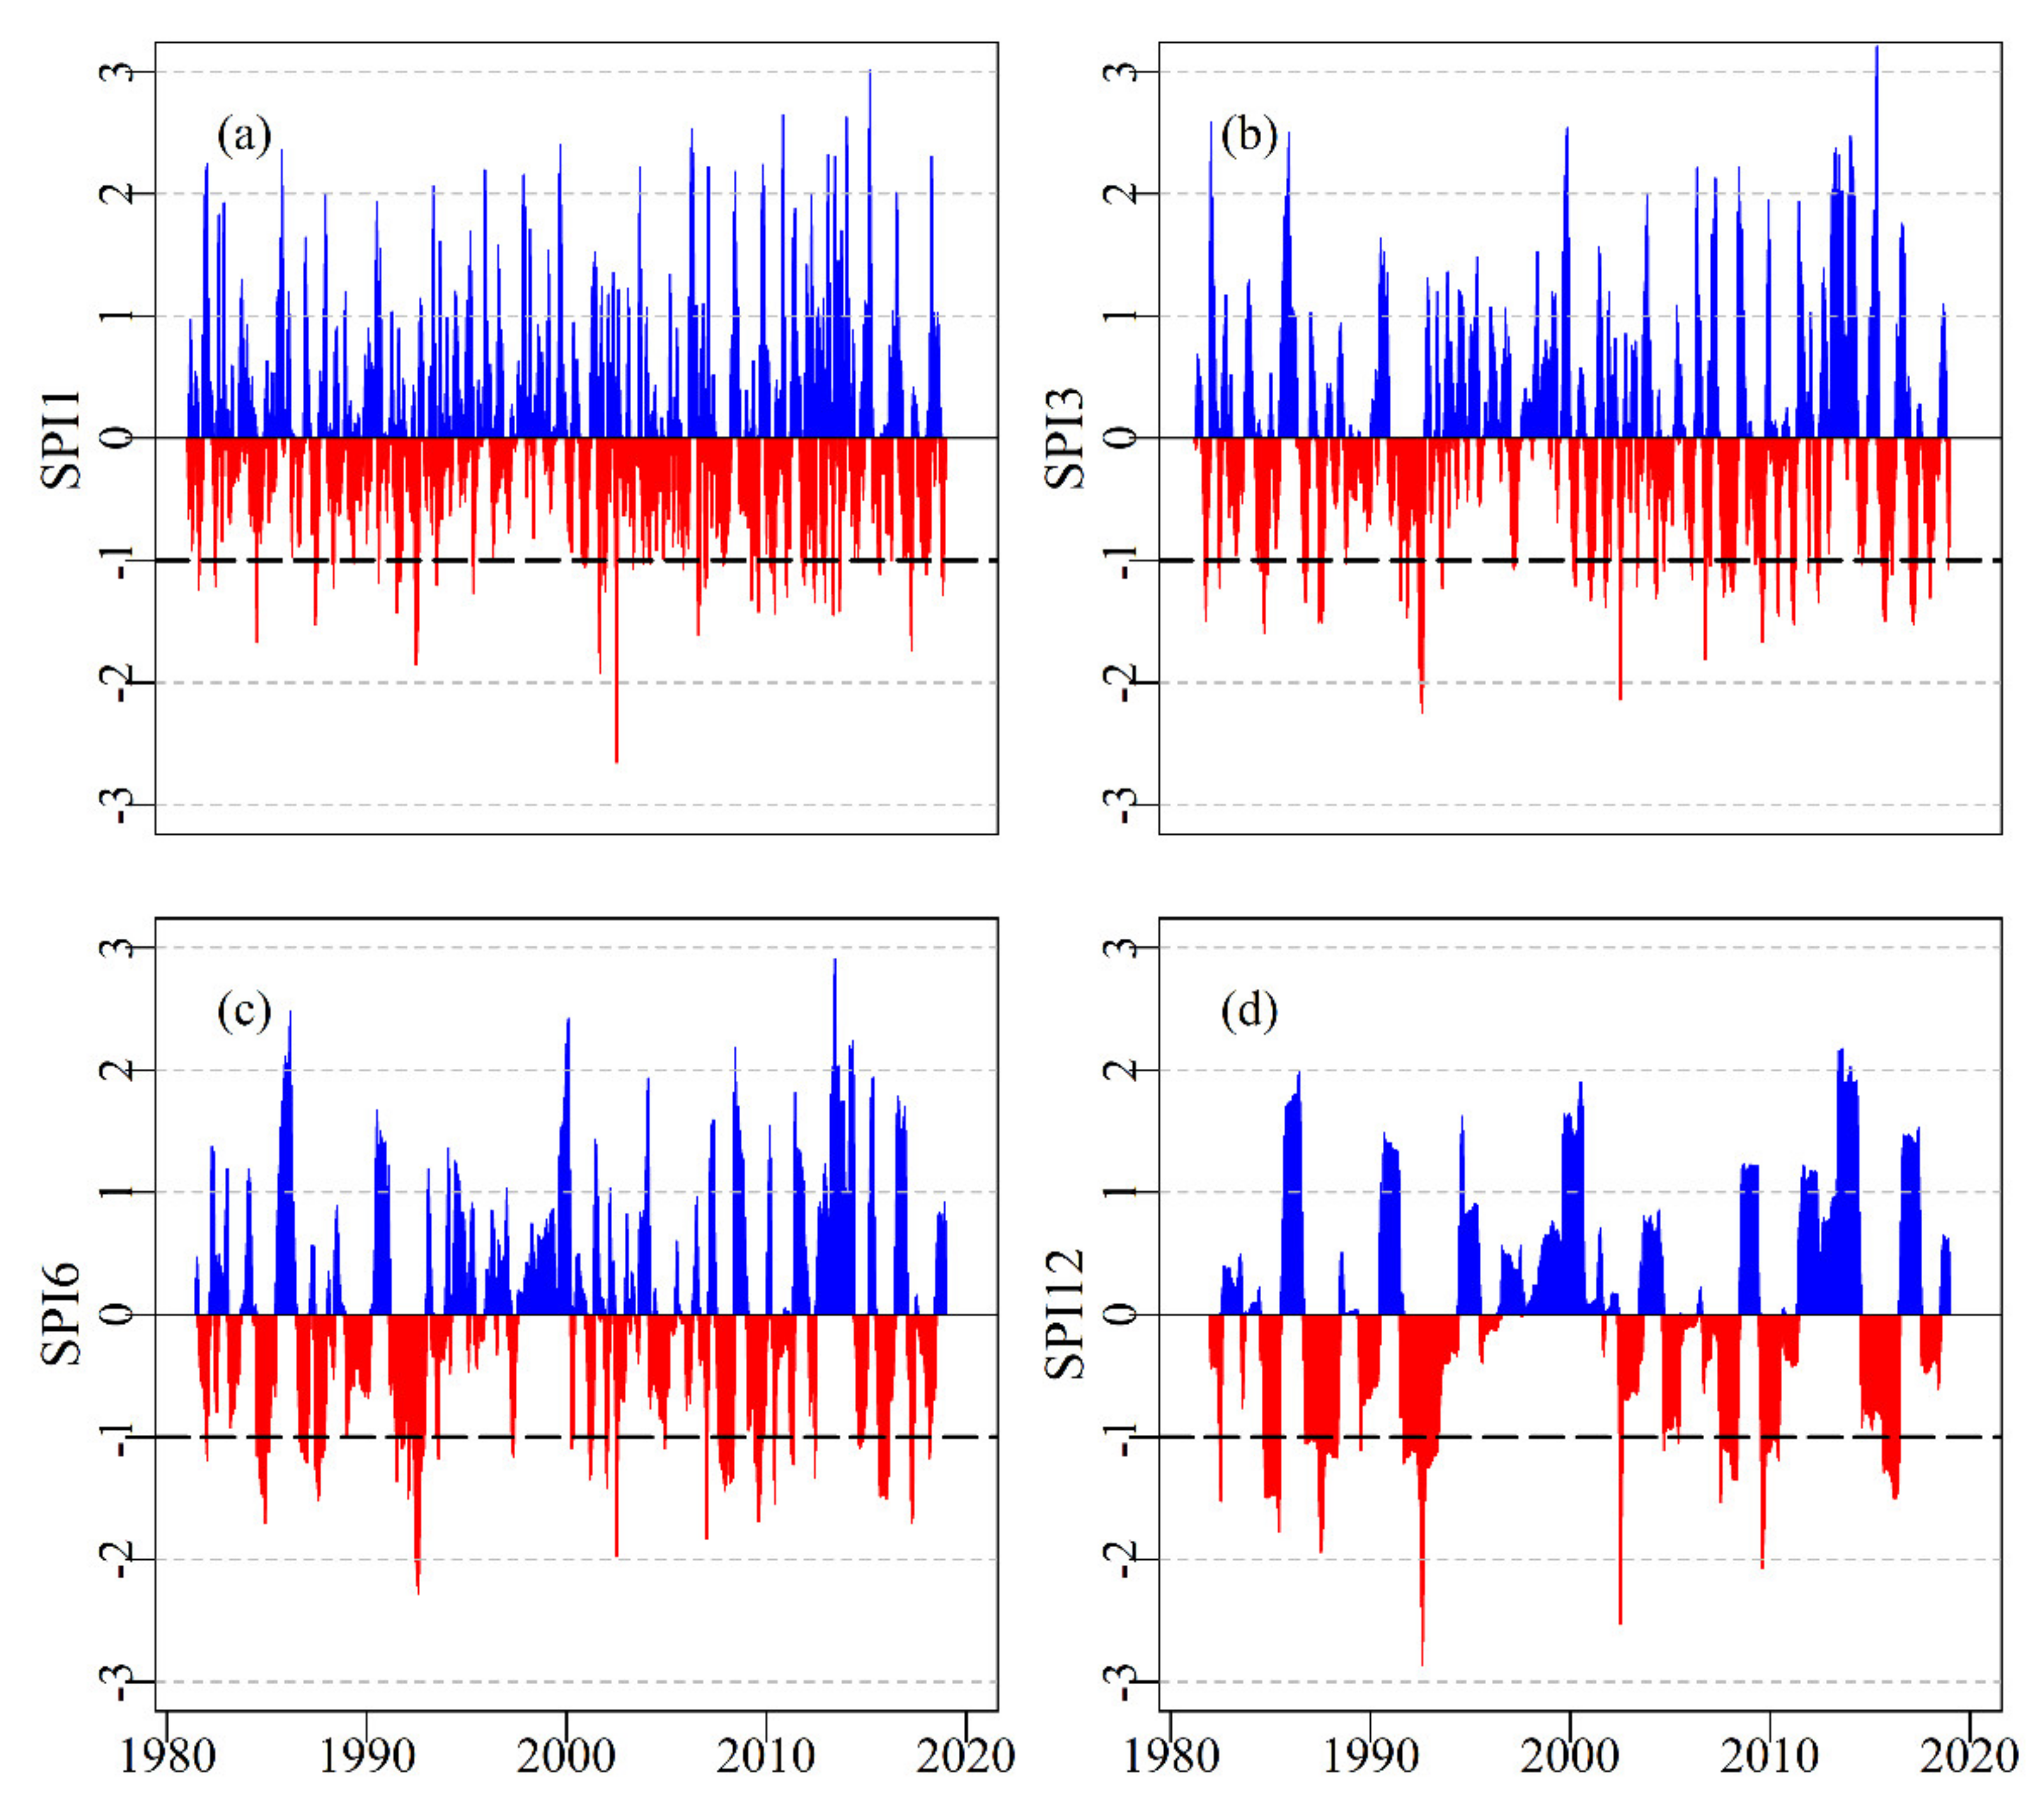
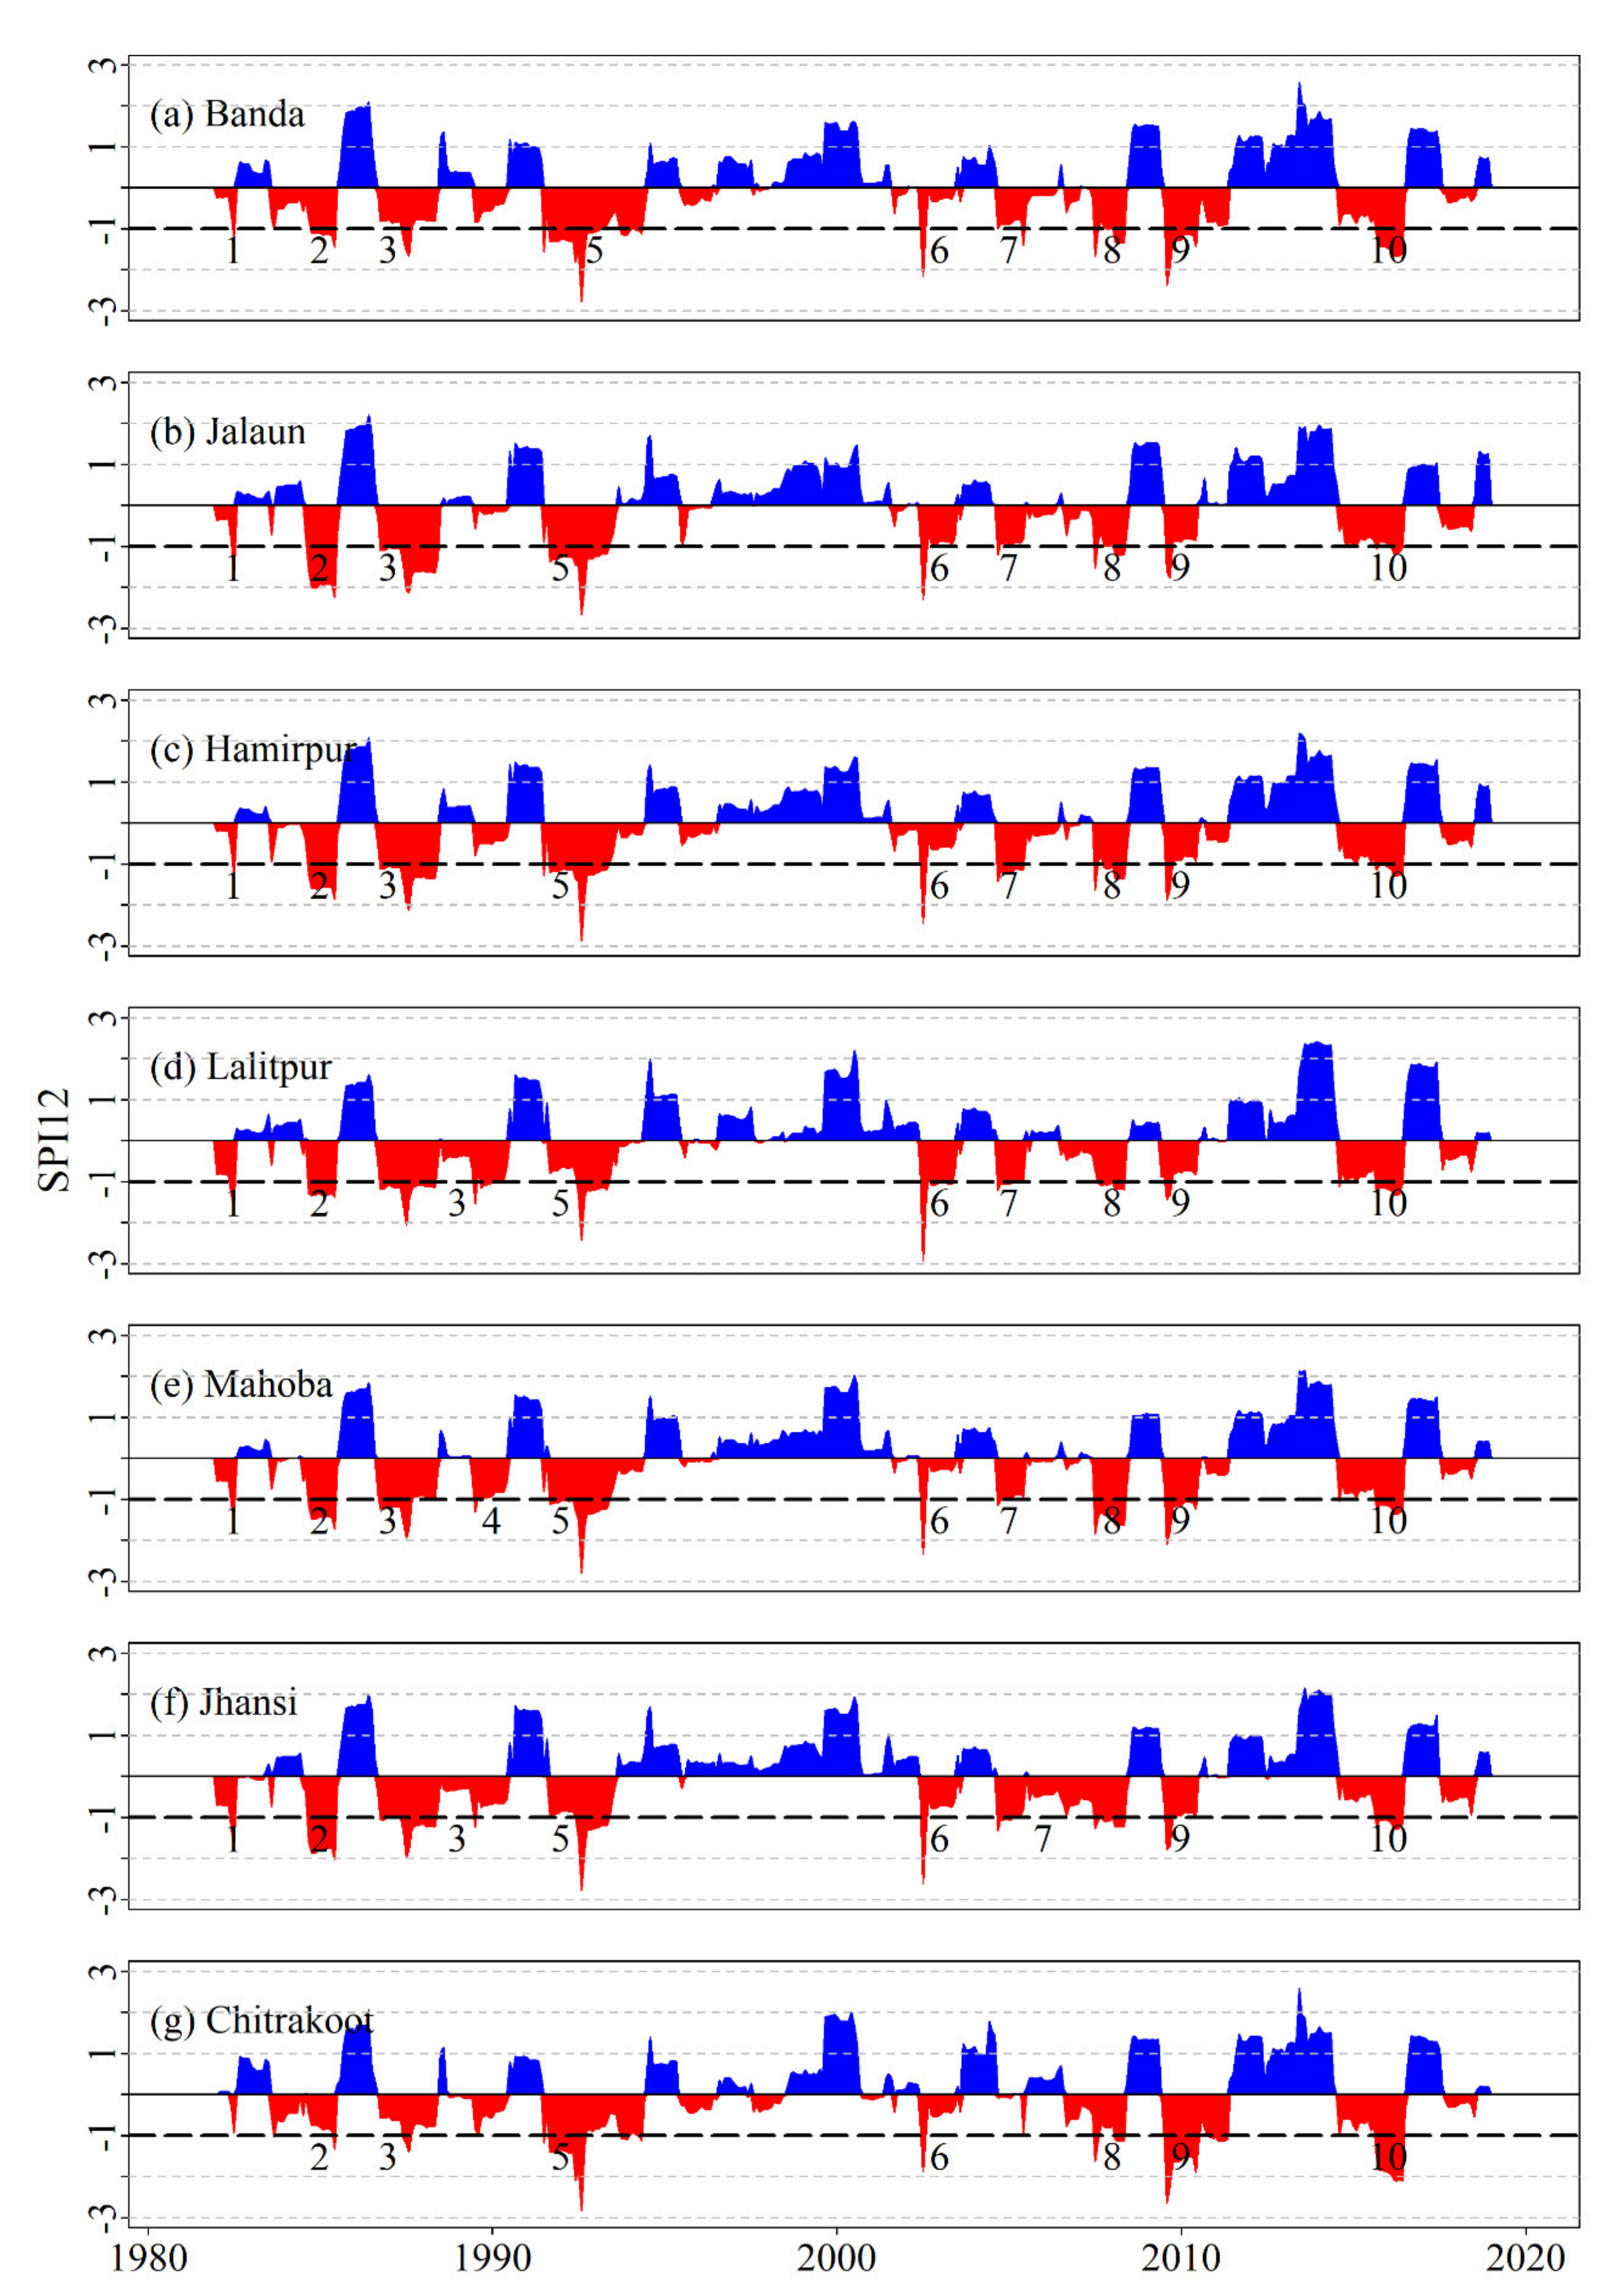
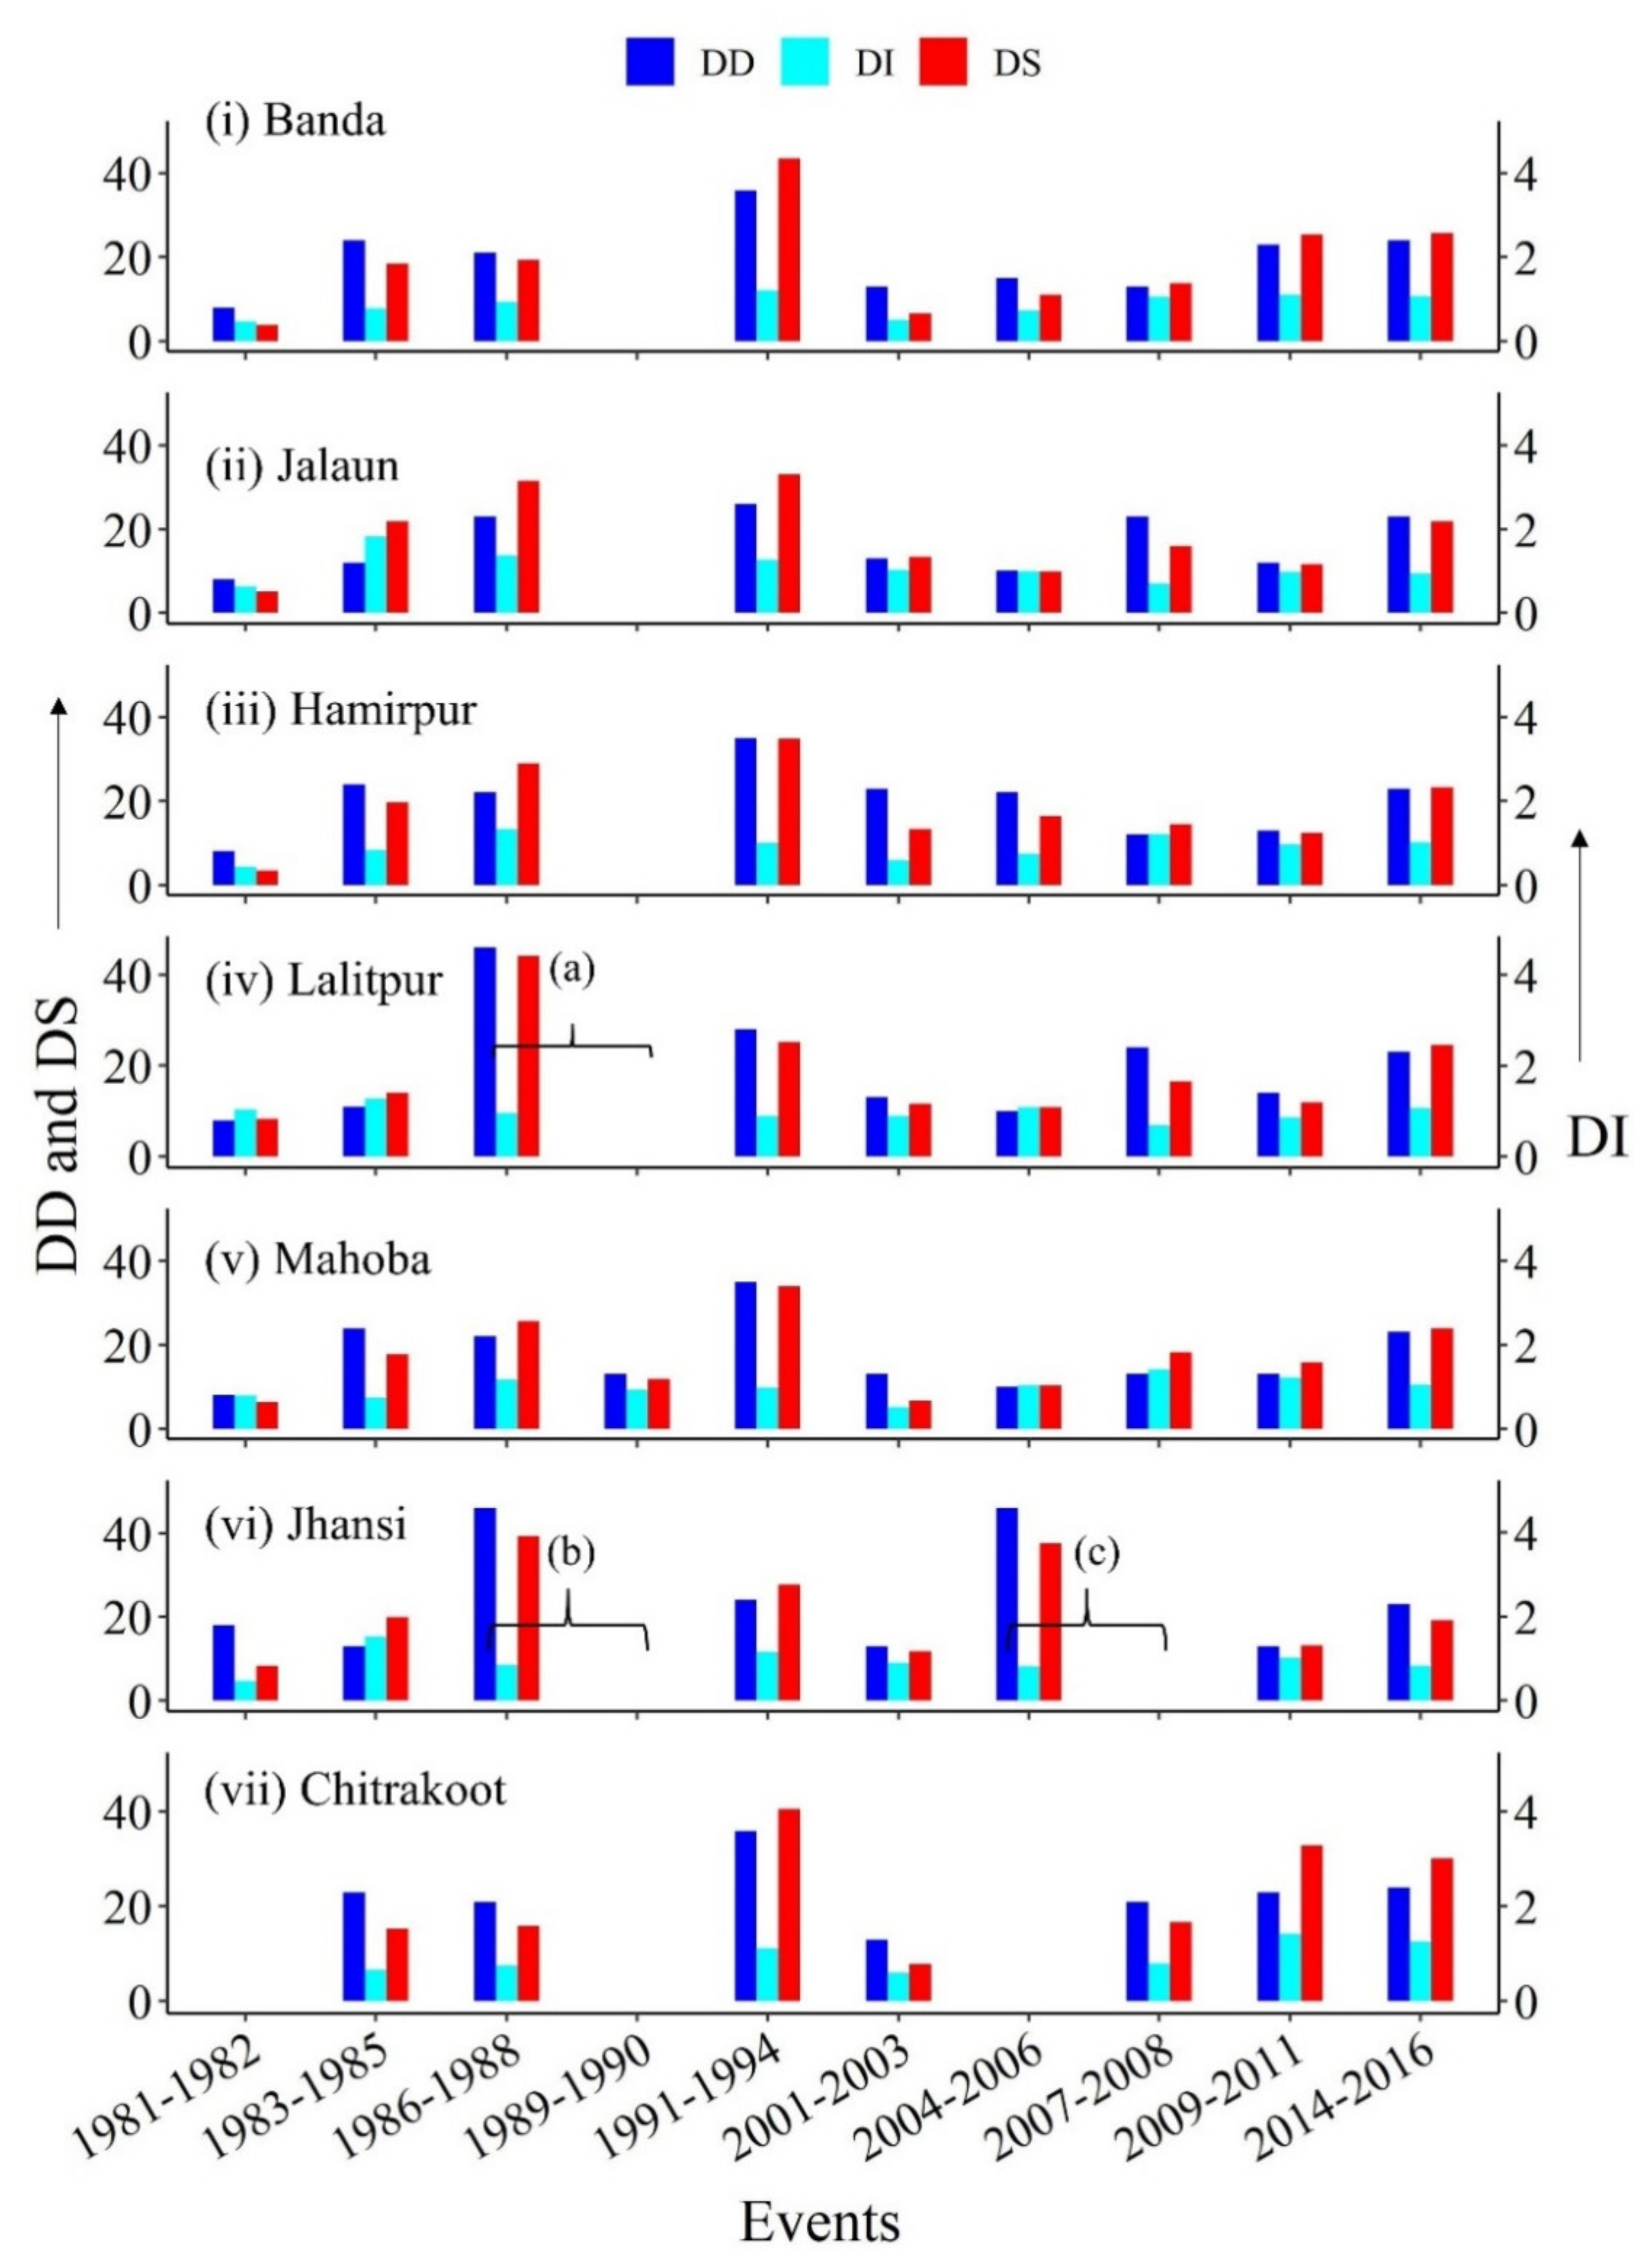
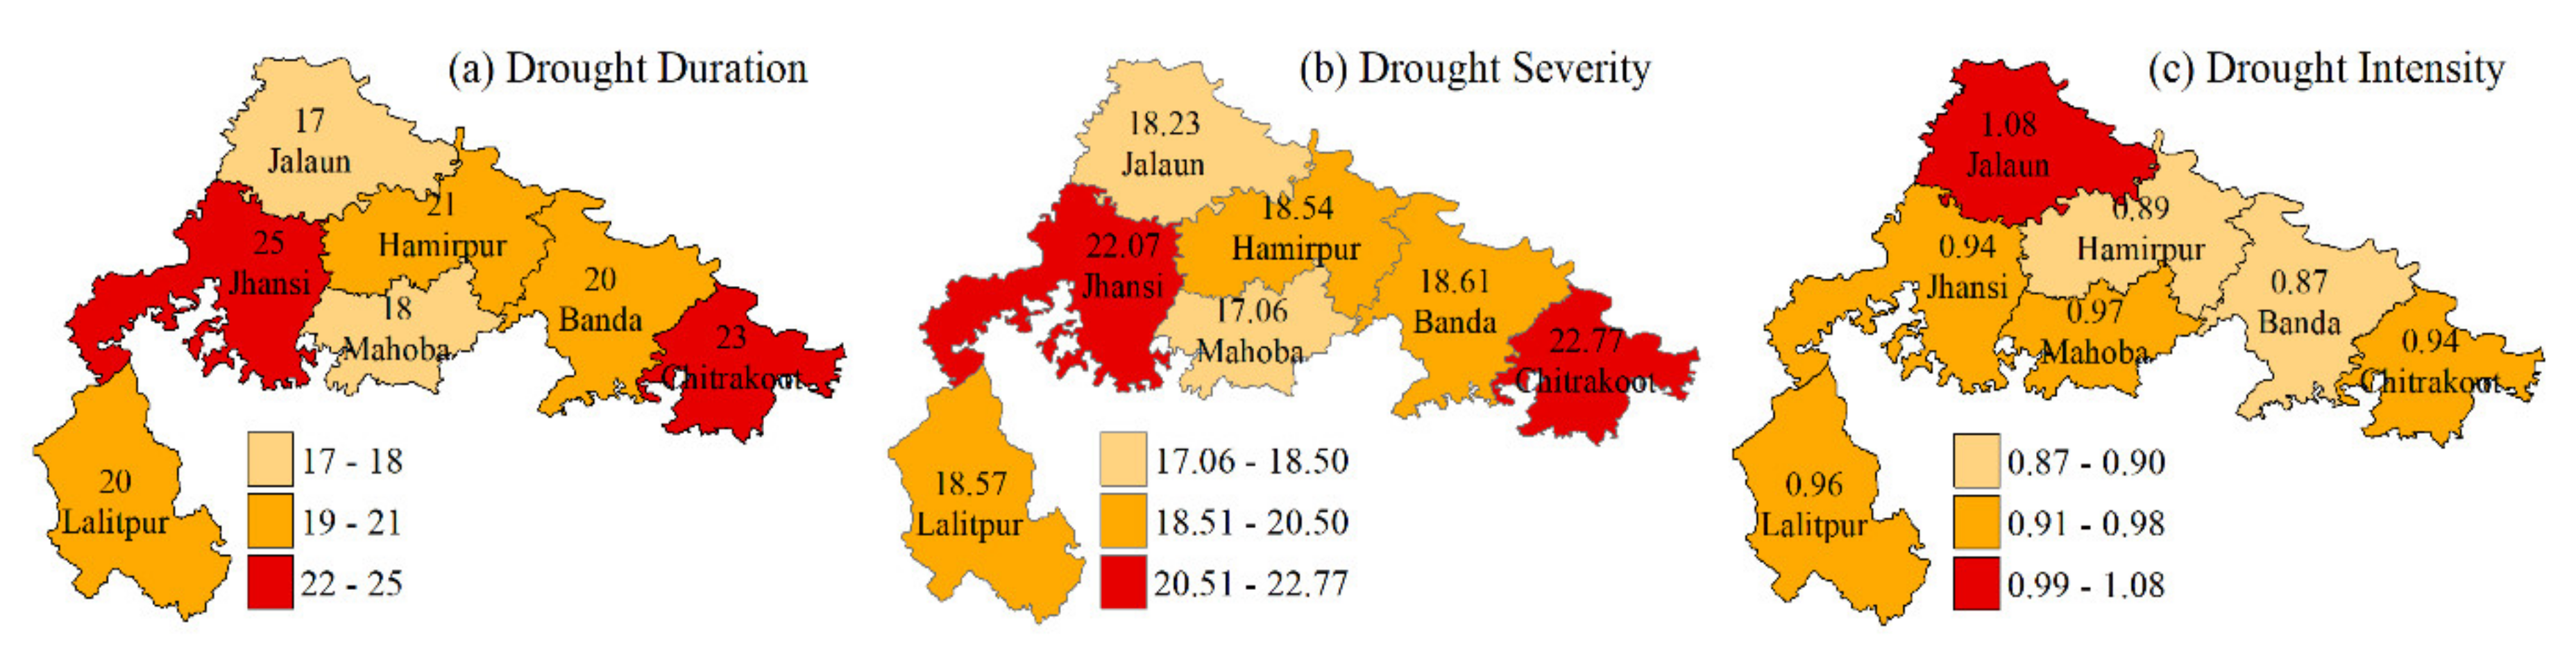
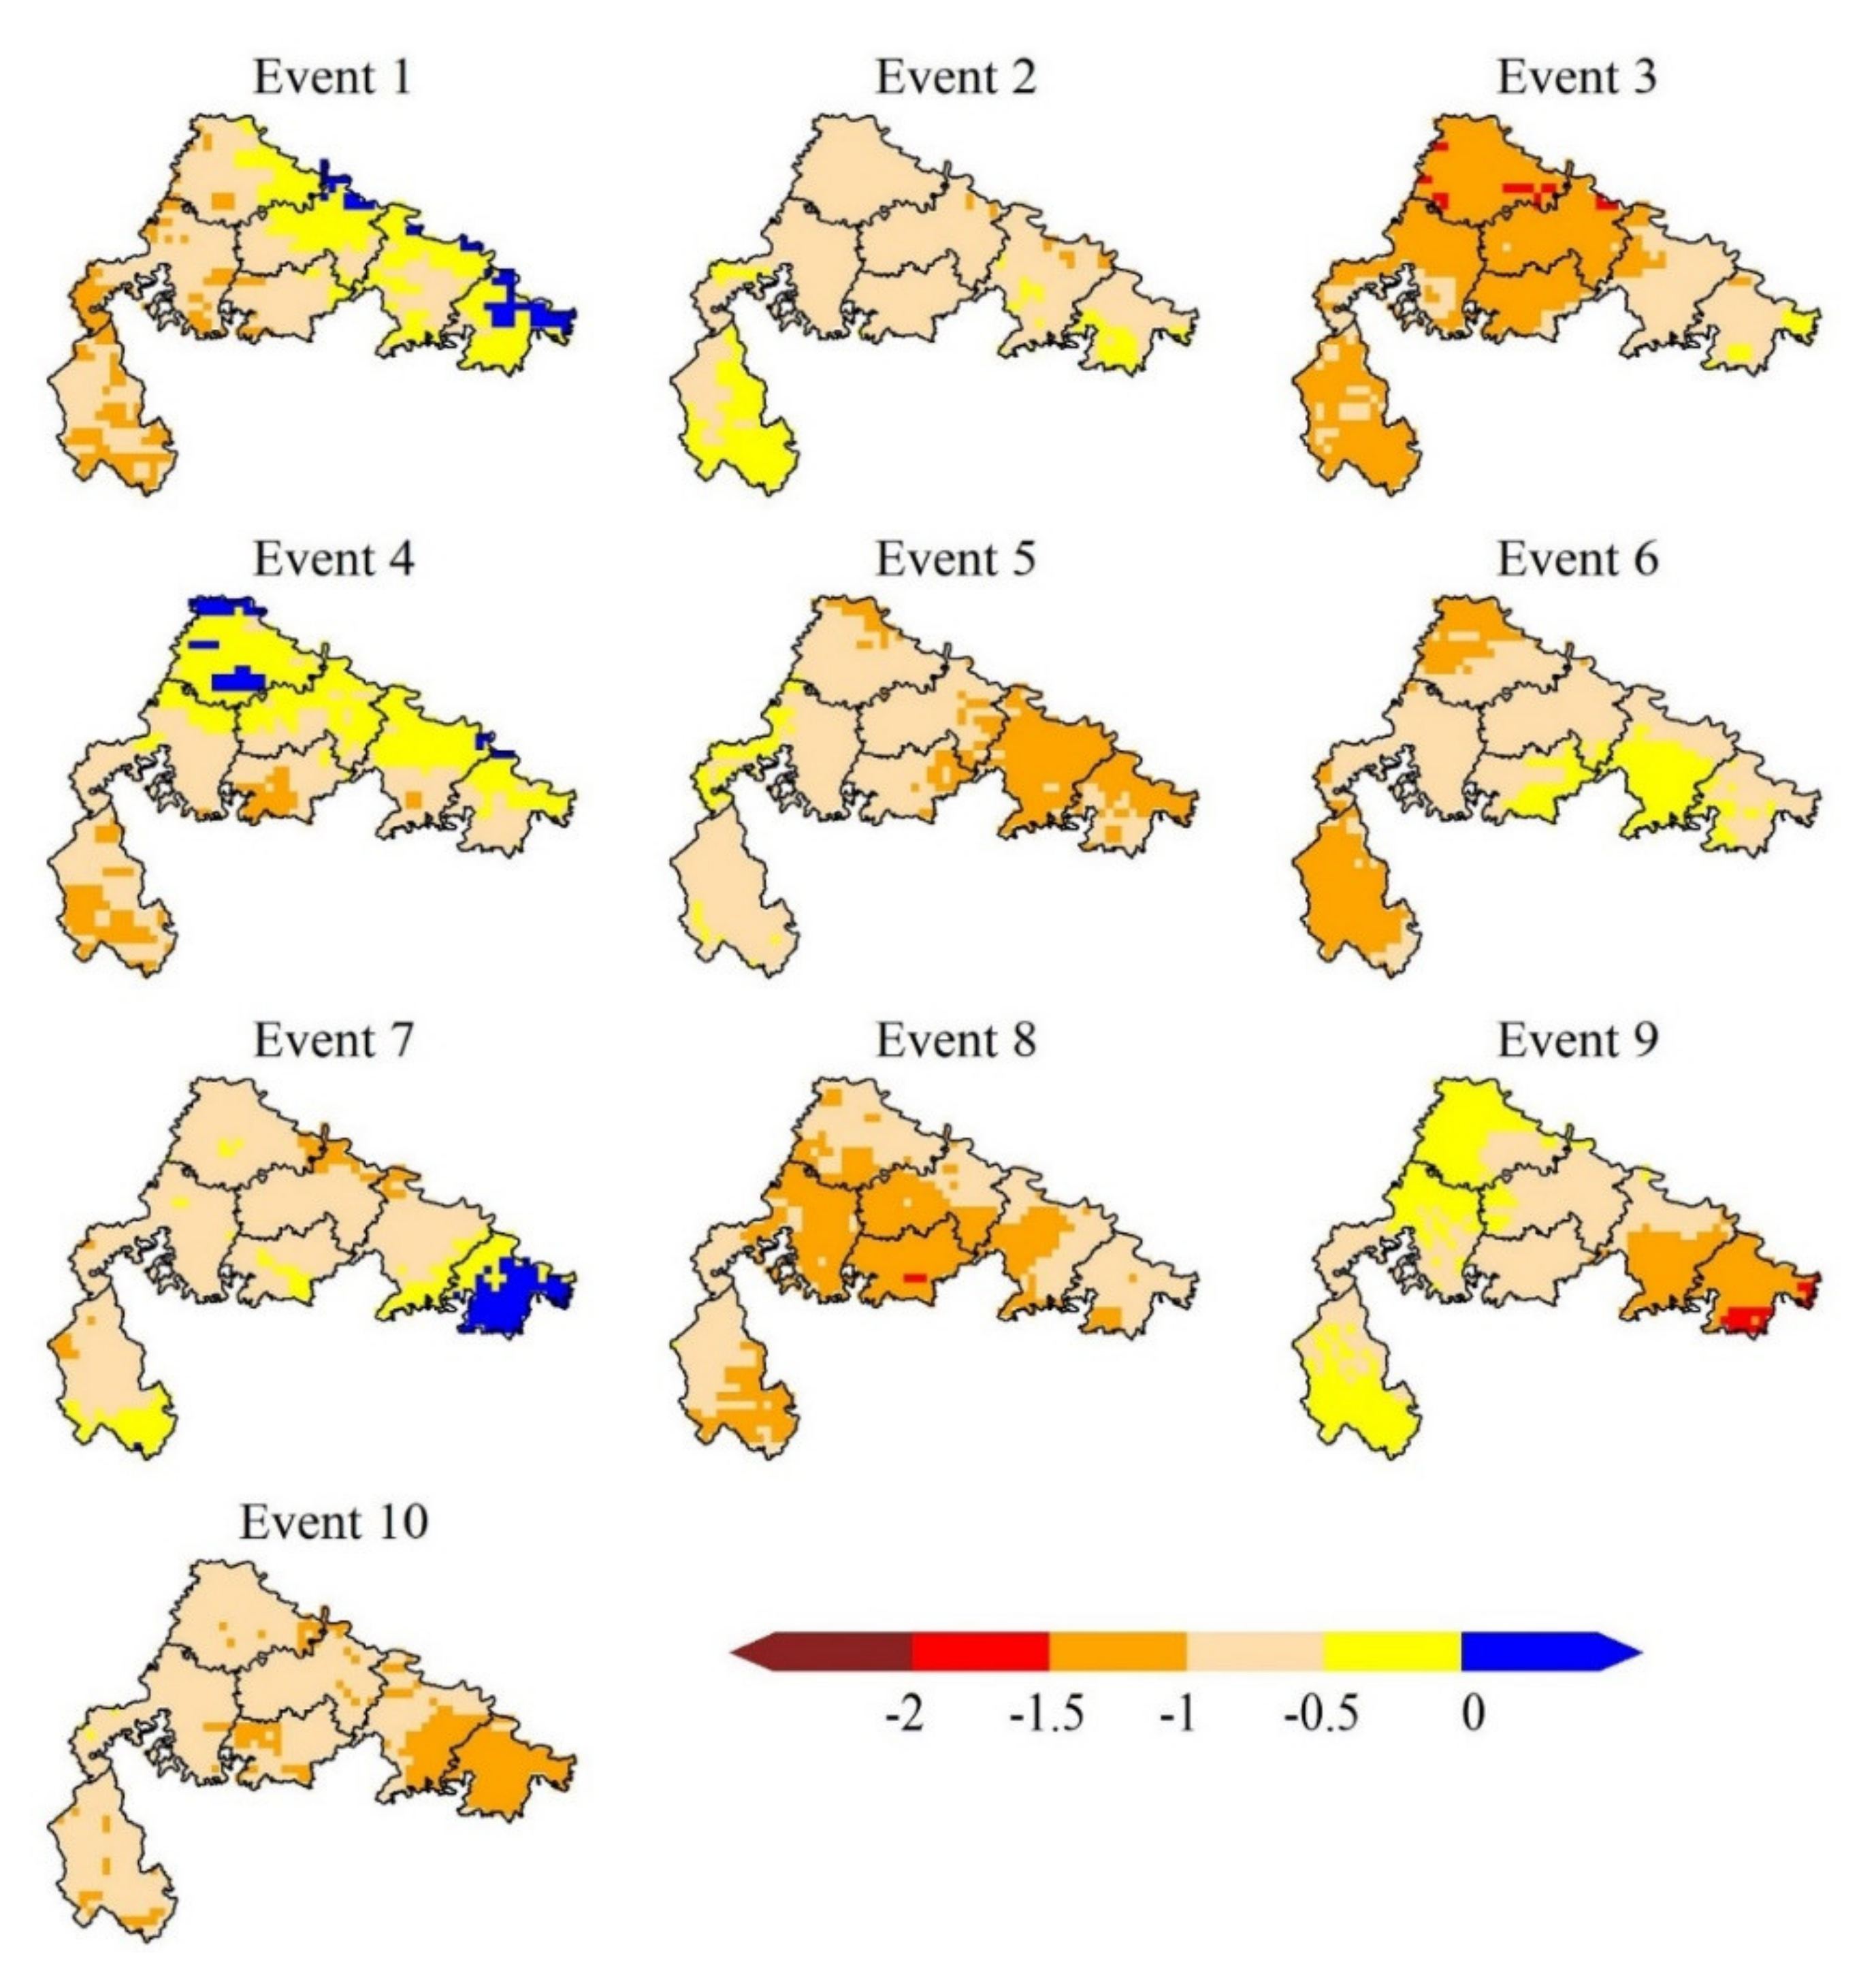
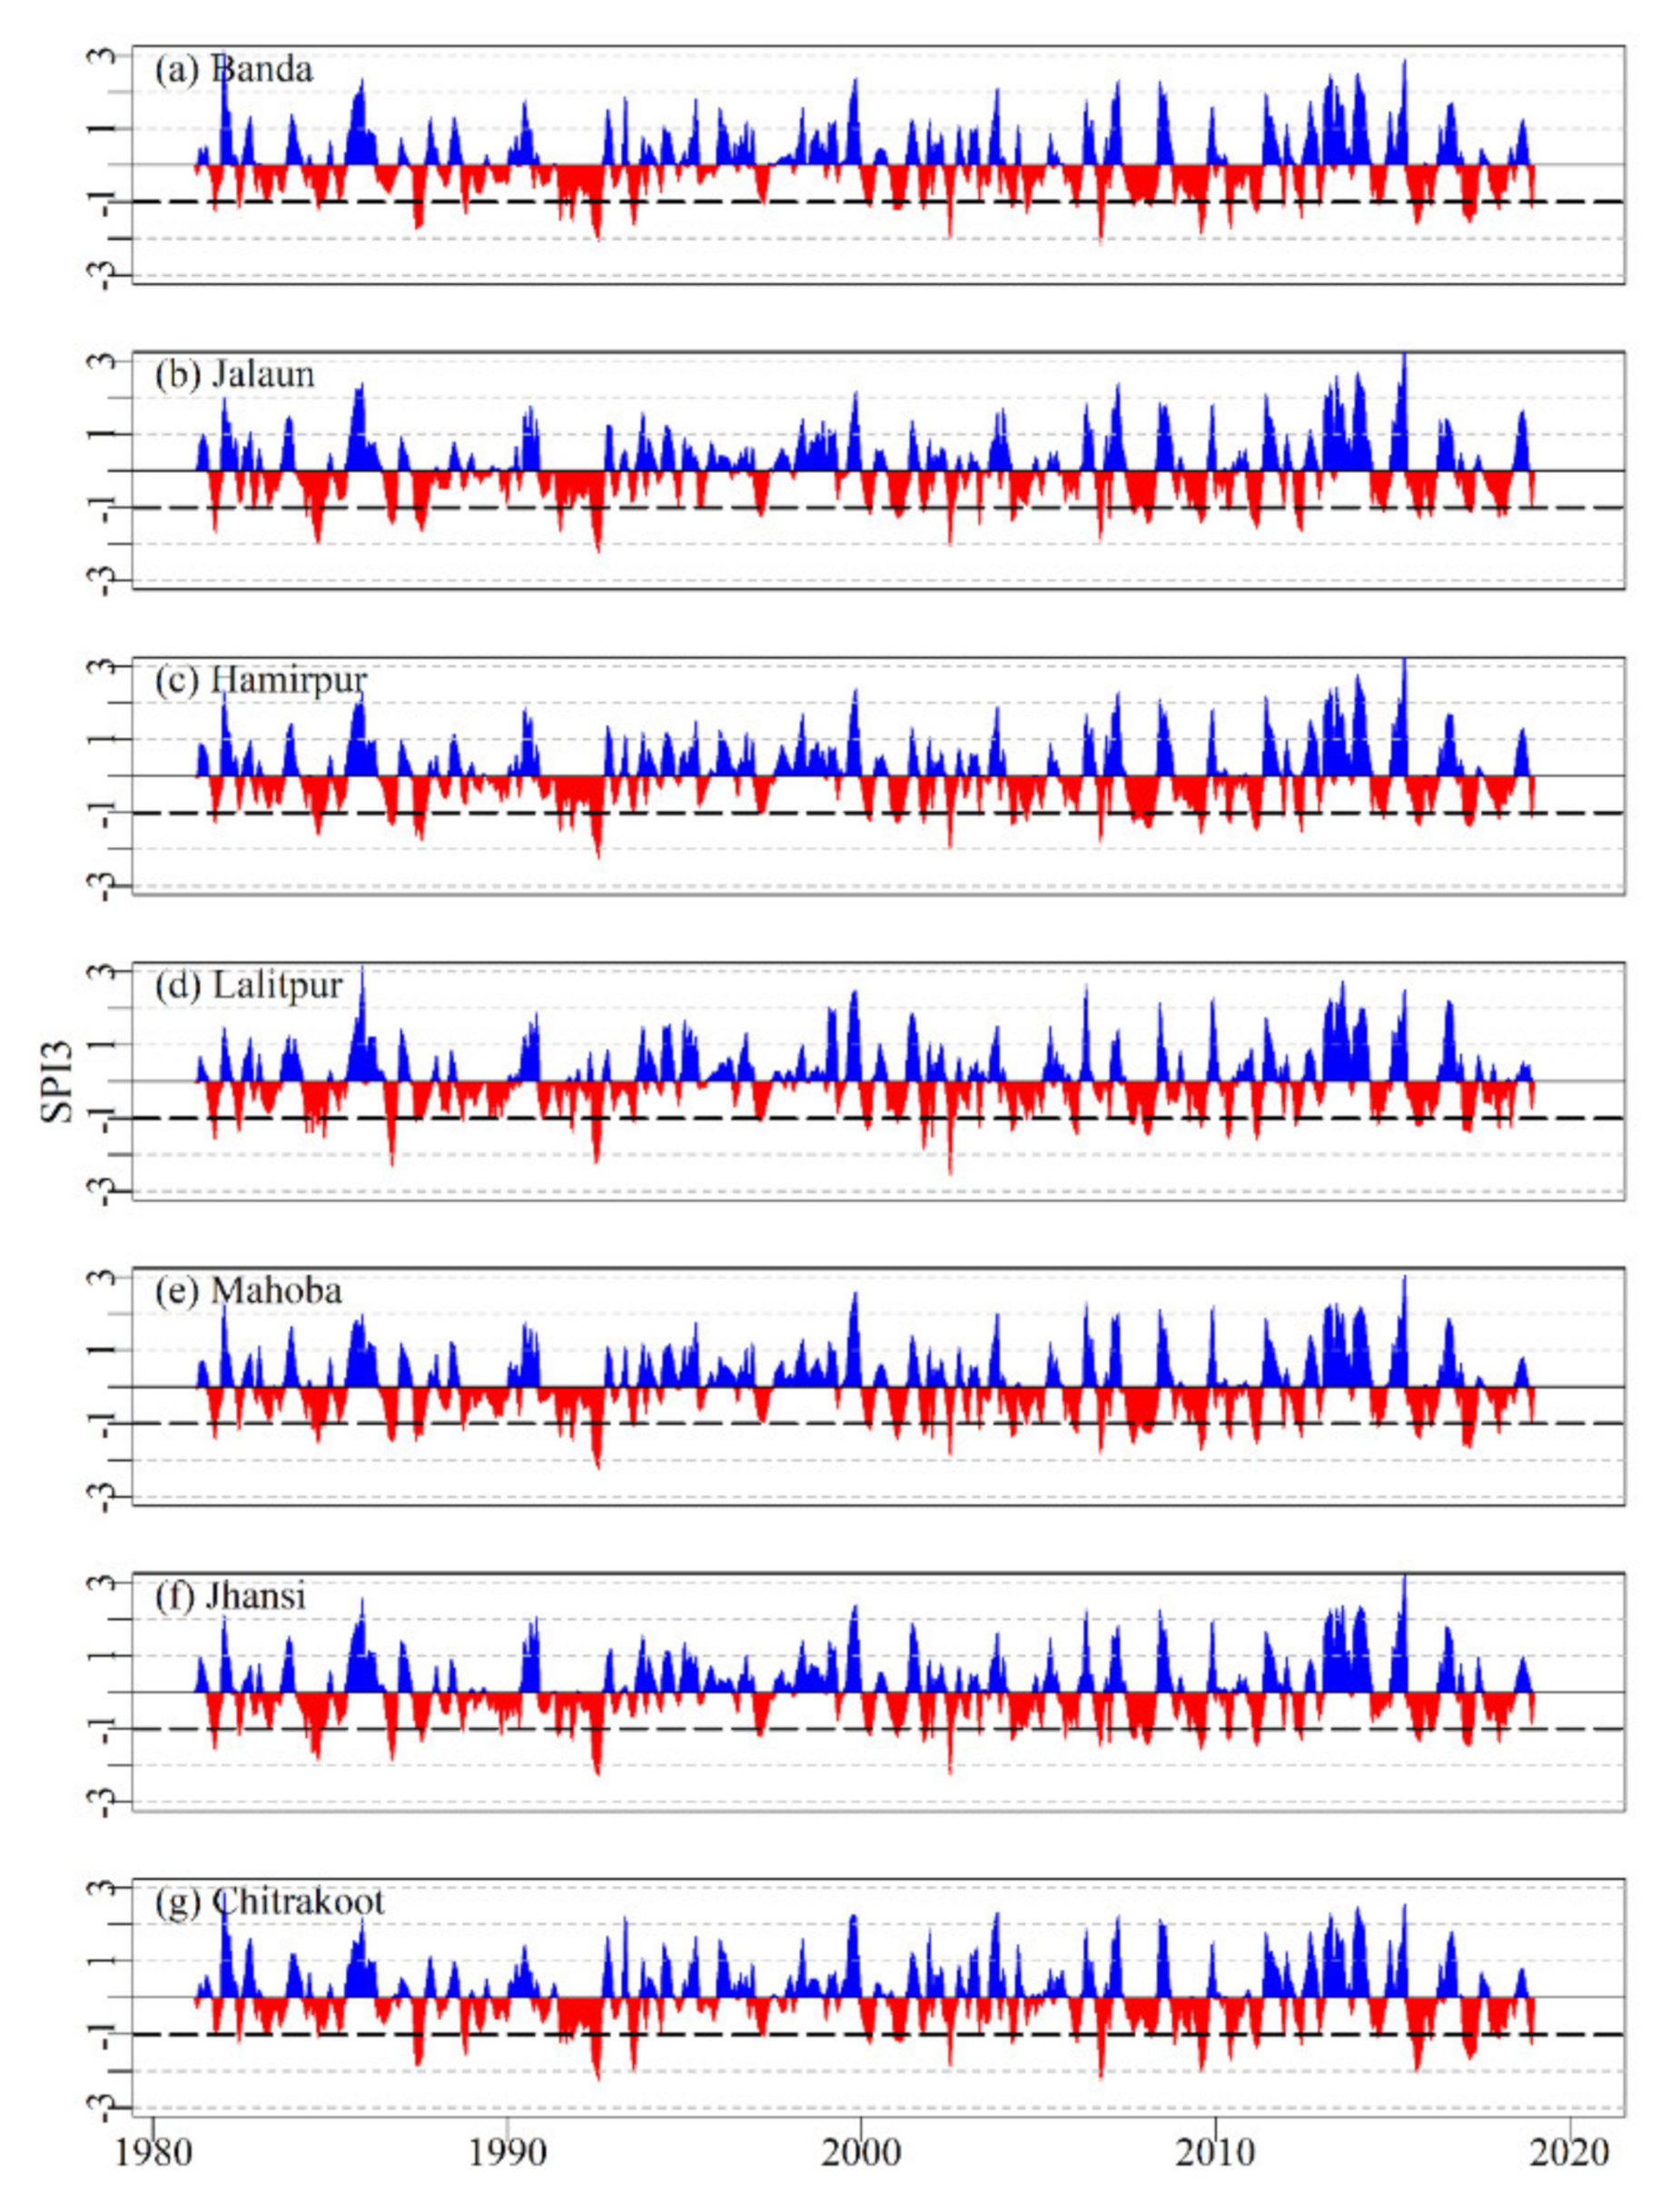
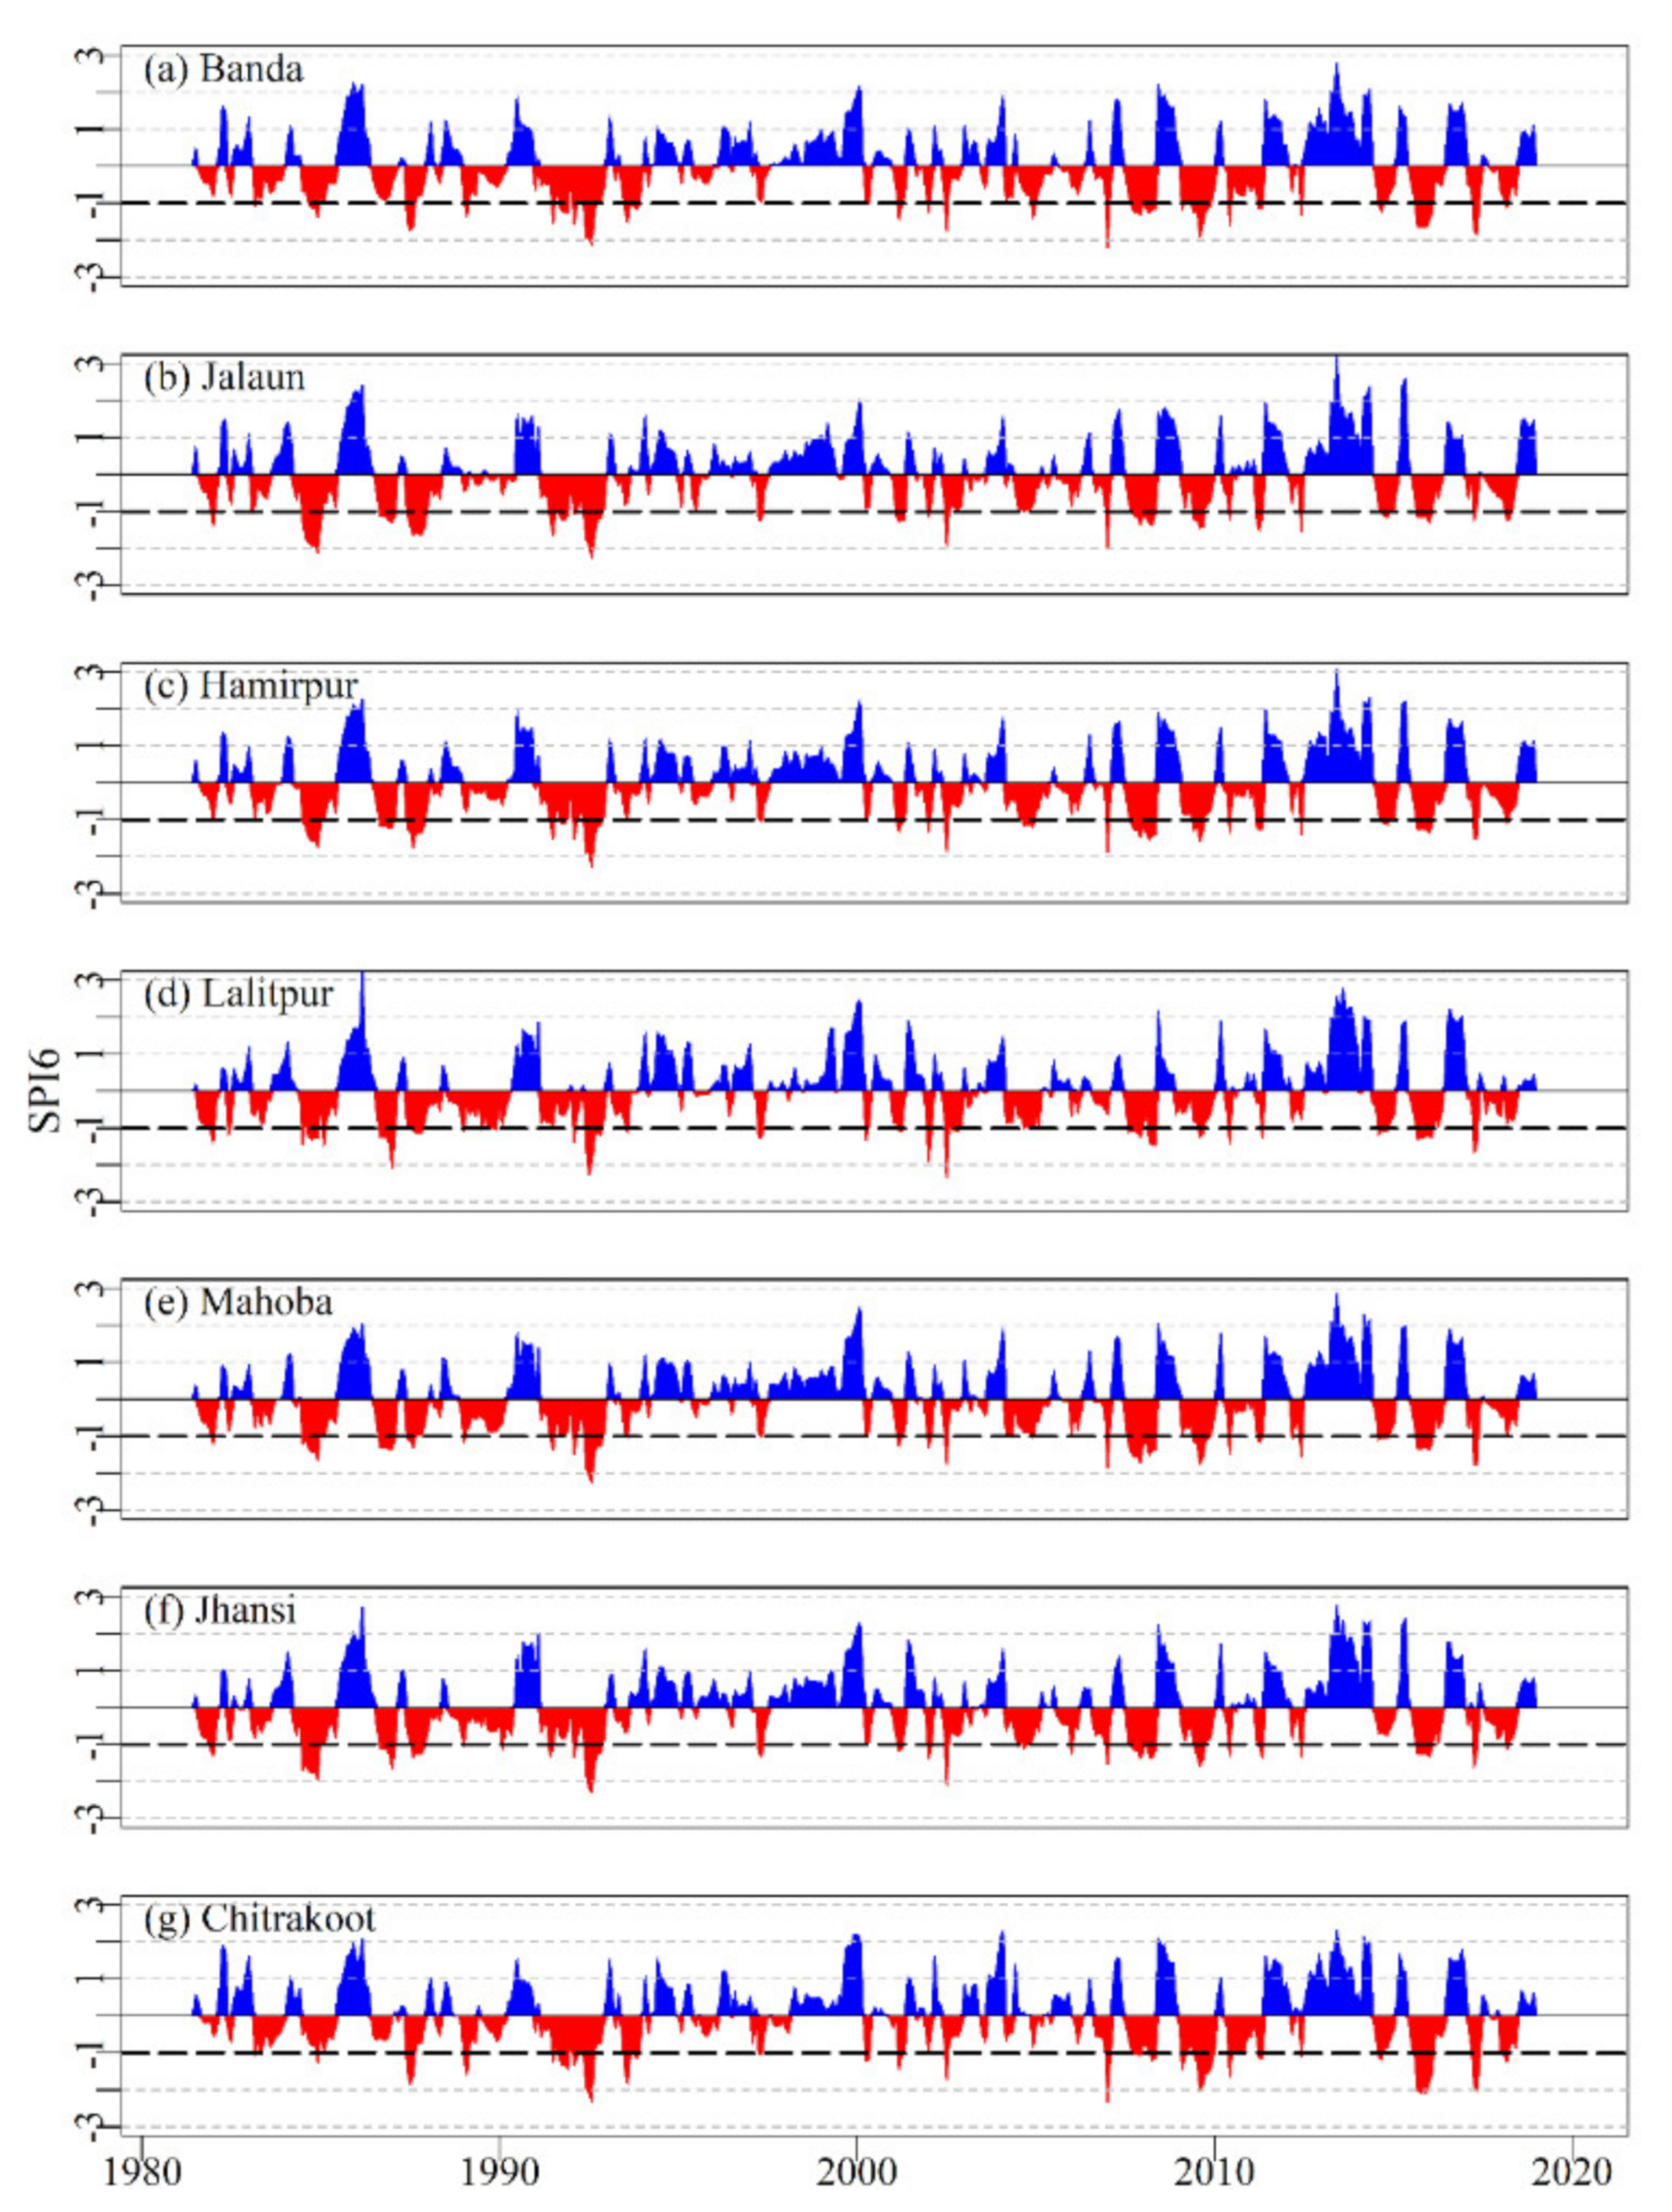
3.1. Drought Identification and Characterization

The SPI12 values were used to define drought event characteristics and performing run theory for identification of drought duration, severity, and intensity in all the seven districts of the area during the study period. The results indicated that all the districts experienced nearly similar drought events in almost common drought years (Figure 4). The majority of the districts encountered 9 drought events; while, Mahoba district experienced the highest number of droughts events as 10, and Chitrakoot district experienced the lowest drought events 7 times during the entire study period. Although, Jhansi and Lalitpur districts experienced 8- and 9-times drought events respectively, remarkably two long-term continuous drought events with two consequent drought event spans were observed for these two districts (shown in Figure 5a–c).
Figure 5 illustrated the occurrence of 10 drought events in the study regions. According to drought duration (DD), drought intensity (DI), and drought severity (DS), the 1991–1994 (5th) drought event was the longest and the most severe one with a high average DD of 31, DI (1.09), and DS (34.15). Moreover, the drought duration in Jhansi (1986–1990: 3rd and 4th and 2004–2008: 7th and 8th) and Lalitpur (1986–1990; 3rd and 4th) that were interestingly merges two drought events, have the highest DD (46 for both the districts) and DS (39.19 and 37.56 for Jhansi, and 44.02 for Lalitpur); however, intensity (DI) varies between 0.82 and 0.95. The fourth drought event that occurred in 1989–1990 is not seen in the majority of the districts, while in Lalitpur and Jhansi it coincided with the third event. It was evident only in Mahoba district with medium severity and intensity. Thomas, et al. [33] reported the most severe drought occurrence in 2007 over the whole Bundelkhand is well depicted in this study as the 8th drought event in Figure 5. The 8th drought event is observed in all the districts while in Jhansi it is found associated with the 7th (2004–07) drought event.
Table 3 summarizes the district-wide descriptive statistics of the drought events in the study region. Overall, 9 major drought events were recorded in most of the districts. Exceptionally Jhansi (drought events 3 & 4 and 7 & 8) and Lalitpur (drought events 3 & 4) merge two drought events as a single event, while Mahoba district experienced 10 distinct drought events. Comparatively less but severe drought events are observed for Chitrakoot. The longest drought duration was observed as 46 consequent months observed for both Lalitpur and Jhansi districts with the severity of 44.02 and 39.19 and intensity of 1.27 and 1.52, respectively. Overall, the drought duration varied between 8 and 46 months, the severity varied between 3.43 and 44.02, and the intensity ranged between 0.40 and 1.81. These drought characteristics indicate an erratic meteorological drought condition in this region.
Figure 6 shows the average duration, severity, and intensity for all the seven districts in the Bundelkhand region during the years 1981–2018. The average DD identified by SPI12 was 20 months, where, the maximum DD was identified for Jhansi and Chitrakoot as 25 and 23 months, respectively. The average DI of drought events for all the districts was greater than 0.8, and the regional average DI value was estimated as 0.96. Severe drought was observed in all the districts with DS >17 and the regional average DS for the entire Bundelkhand region was estimated as 19.41.
The spatial representation of SPI for different drought events that occurred from 1981 to 2018 over the Bundelkhand region is shown in Figure 7. The spatial pattern of SPI12 for different drought events show consistency with the temporal pattern. Events 3 and 8 recorded the severe to extreme drought in most of the districts except Chitrakoot in both the events and Banda in event 3 shows moderate drought. Event 5, 6, 9, and 10 show the moderate to severe drought. In these events, Banda and Chitrakoot in event 5 and 10 and Lalitpur in event 6 were severely affected. Chitrakoot shows some strange patterns in events 7 and 9 with the normal and extreme conditions while other districts show moderate to severe and mild drought conditions respectively. Event 2 shows a completely moderate drought in the whole Bundelkhand while events 1 and 4 exhibit assorted drought patterns varying from normal to severe drought. The increased rate of deforestation and groundwater exploration in the area greatly affected the water availability scenario in most of the water bodies and land use patterns [54]. The existing water structures used to be perennial and now recurs during the monsoon season [55,56]. This supports the increasing frequency of drought episodes and patterns over the last few decades [33]. Drought characteristics depend on the geographic location and existing climatic condition of an area, since the regional topography and the moisture availability play important roles in the zonal precipitation. The topography of South Asia (especially the Tibetan Plateau) provides the thermal and mechanical topographic forcing and regulates the South Asian Summer Monsoon (SASM). Whereas, the moisture supply through local recycling and the tropospheric diabatic warming through atmospheric latent heating induces positive feedbacks by the precipitation [57].

3.2. Drought Trend Analysis: Mann–Kendall Test

The district-wide MK test of trends for the Bundelkhand region at annual and seasonal scales during 1981–2018 are shown in Table 4. The negative trends were observed for the winter season at 1, 3, and 6 SPI time scale except for SPI12, and post-monsoon exhibits a negative trend for SPI1 and SPI3 for all the districts. The decreasing trend in SPI for post-monsoon and winter seasons is attributed to the precipitation deficit over the Bundelkhand region leading to the increased irrigation in the past few decades. Moreover, irrigation has been identified as one of the major factors controlling the meteorological variables (Precipitation, temperature, evapotranspiration, etc.) in the Indian subcontinent (Central/Western regions) at the local scale [58]. Almazroui, et al. [59] studied the climate projections under the Coupled Model Intercomparison Project Phase 6 (CMIP6) and reported increased warming in the winter season, which indicates repercussions for Rabi cropping over South Asia.
While in monsoon and pre-monsoon season, a positive trend is observed for all time scales of SPI except SPI 6 for pre-monsoon in all the 7 districts. A similar result was also found by Jana, et al. [60], in which they reported a positive trend of rainfall over the northern part of Bundelkhand (i.e., Bundelkhand-UP) though the time period was different. Overall, no significant trend was found at annual, and other inter-seasonal scales (pre-monsoon, monsoon, and winter). However, the post-monsoon SPI at a one-month scale (SPI1) showed significant decreasing trends at a 95% confidence level in all the seven districts. This falling trend indicates the increase of dry spells and thus the severity of meteorological drought in this region during the post-monsoon season, in which the rainfall deficit has its crucial impact on the maturity of Kharif crops and sowing of Rabi crops. Whereas, for the Jhansi district, a significant increasing trend is observed in the pre-monsoon season with a magnitude of 0.017 mm. This indicates an increase in pre-monsoon precipitation and a decrease in SPI value; however, the amount of precipitation received may not be sufficient to meet agricultural water demand.
Result of the trend pattern revealed that the magnitude of negative SPI trends is high in the short-term SPI scale (SPI1, and SPI3), which indicates the increasing trend of meteorological drought that could lead to the soil moisture deficit and crop yield failure. For instance, Pandey, et al. [61] investigated the overall maximum percentage deviation from the average crop productivity is negative or below average since the last decade, indicates the decrease in crop productivity in the Bundelkhand-UP region. Therefore, efforts are required towards minimizing the loss of soil moisture during the post-monsoon season when lands are fallow for sowing the dominant rabi crops. The selection of an effective irrigation system may also help to diminish the risk of crop failure in the drought-affected area and season. Garg, et al. [62], established a mesoscale watershed monitoring scheme to intensified rainfed agriculture in the Jhansi district of the Bundelkhand-UP region. They renovate the traditional water harvesting structures such as haveli, building check dams, field bunding, and farmers’ involvements in crop demonstration and recharge the shallow groundwater aquifer that can build resilience in two subsequent dry years. The different deficit irrigation levels at different crop stages over two growing stages on maize crop was evaluated by Zou, et al. [63]. They find that regulated deficit irrigation reduces the effective water demand and made possible to cope with the decline in water availability amid drought periods. Thomas, et al. [64], carried out supplemental irrigation requirement analysis for a dry spell, which underlines the selection of crop calendar and crop varieties during imminent drought scenarios. Moreover, early warning with the use of real-time, high-resolution satellite rainfall products gives a better option for early information of drought onset for the different growing seasons [28]. To minimize economic loss, fewer crops should be grown with proper irrigation scheduling during the early warning of short rainfall or drought conditions.

4. Conclusions

The point-based observation data limits spatio-temporal analysis of precipitation, and therefore constraints the effective drought monitoring. Alternatively, the high-resolution satellite precipitation (integrated with the in-situ measurements) data products have been proven as an effective alternative data source for spatio-temporal drought analysis. The open source CHIRPS data products are available at various temporal scales offering high potential for near real-time drought identification and assessment. Using the CHIRPS data derived SPI, this study has analyzed the district-wide meteorological drought characteristics for the Bundelkhand-UP region during the period of 1981–2018 (38 years). The study concludes that all the seven districts of the Bundelkhand region experience recurrent drought events. All 7 districts have experienced an average of nine severe drought events during the study period except Chitrakoot that exhibits the lowest 7 drought events. The highest intensity was observed for Jalaun (1.81) and severity for Lalitpur (44.02) district. Overall, Jhansi and Chitrakoot exhibit long and severe drought, whereas intense drought was found in Jalaun. The maximum duration was observed for Jhansi and Lalitpur (46). Moreover, the remarkable longest and severe drought spell was observed with two consequent drought events during 1986–1990 in Lalitpur and Jhansi district, and again during drought years 2004–2008 in Jhansi district only. A significant decreasing trend is observed for the SPI1 (at 95% confidence level) during the post-monsoon season in all the seven districts. Moreover, a non-significant falling trend for short-term drought (SPI1 and SPI3) at annual and short- and medium-term drought (SPI1, SPI3, and SPI6) in winter months have been also observed for all the districts. The falling trend indicates the increasing severity of meteorological drought in the region. In the face of climate change, it could be possible that drought severity hit stronger, which requires effective and contingency planning. The current study will be helpful in prescribing the irrigation facilities during the crop growing periods, identifying the appropriate regions for water harvesting structure construction, suitable crop selection, etc. The outcomes of the present study have immense scope for improved water resource management and policy development in the Bundelkhand region and the adopted approach could be used as a reference to develop an economical drought-proofing system in alike regions. The Regional Climate Models (RCMs) projected climate data can be employed to assess the SPI-based drought conditions under the various Representative Concentration Pathway (RCP) climate change scenarios. This will help in the drought contingency planning, projecting the upcoming scenarios, climate adaptive mitigation planning, and policy development.

Author Contributions

Conceptualization, P.K.S.; Data curation, V.P.; Formal analysis, V.P.; Funding acquisition, G.P.P. and R.K.M.; Investigation, P.K.S.; Methodology, P.K.S. and R.K.M.; Resources, P.K.S.; Software, G.P.P.; Visualization, S.K.S.; Writing—original draft, V.P.; Writing—review & editing, P.K.S., S.K.S. and G.P.P. All authors have read and agreed to the published version of the manuscript.

Funding

This research received no external funding.

Institutional Review Board Statement

Not applicable.

Informed Consent Statement

Not applicable.

Data Availability Statement

The CHIRPS data presented in this study is publicly available.

Acknowledgments

The authors are highly thankful to the University Grant Commission for providing the research fellowship for this study.

Conflicts of Interest

The authors declare no conflict of interest.

Appendix A

This section provides the temporal evaluation map of SPI (−1, −3, and −6) averaged over the seven different districts of the Bundelkhand-UP region.
Figure A1. The temporal evaluation of SPI1 averaged over the different districts (ag) of Bundelkhand.
Sustainability 13 01042 g0a1
Figure A2. The temporal evaluation of SPI3 averaged over the different districts (ag) of Bundelkhand.
Sustainability 13 01042 g0a2
Figure A3. The temporal evaluation of SPI6 averaged over the different districts (ag) of Bundelkhand.
Sustainability 13 01042 g0a3

References

  1. Mahajan, D.; Dodamani, B. Trend Analysis of Drought Events Over Upper Krishna Basin in Maharashtra. Aquat. Procedia 2015, 4, 1250–1257. [Google Scholar] [CrossRef]
  2. Sharma, A.; Goyal, M.K. Assessment of drought trend and variability in India using wavelet transform. Hydrol. Sci. J. 2020, 65, 1539–1554. [Google Scholar] [CrossRef]
  3. Xu, C.-Y.; Widén, E.; Halldin, S. Modelling hydrological consequences of climate change—Progress and challenges. Adv. Atmos. Sci. 2005, 22, 789–797. [Google Scholar] [CrossRef]
  4. Field, C.B.; Barros, V.; Stocker, T.F.; Dahe, Q. Managing the Risks of Extreme Events and Disasters to Advance Climate Change Adaptation: Special Report of the Intergovernmental Panel on Climate Change; Cambridge University Press: Cambridge, UK, 2012. [Google Scholar]
  5. Drought. Available online: https://www.who.int/health-topics/drought#tab=tab_1 (accessed on 20 August 2020).
  6. Dai, A.; Lamb, P.J.; Trenberth, K.E.; Hulme, M.; Jones, P.D.; Xie, P. The recent Sahel drought is real. Int. J. Clim. 2004, 24, 1323–1331. [Google Scholar] [CrossRef]
  7. Mishra, A.K.; Singh, V.P. A review of drought concepts. J. Hydrol. 2010, 391, 202–216. [Google Scholar] [CrossRef]
  8. Meze-Hausken, E. Contrasting climate variability and meteorological drought with perceived drought and climate change in northern Ethiopia. Clim. Res. 2004, 27, 19–31. [Google Scholar] [CrossRef] [Green Version]
  9. Hydrology and Water Resources Information System for India. Available online: http://117.252.14.242/rbis/India_Information/draught.htm (accessed on 20 December 2020).
  10. Samra, J. Review and Analysis of Drought Monitoring, Declaration and Management in India; IWMI: Colombo, Sri Lanka, 2004; Volume 84. [Google Scholar]
  11. Liu, Y.; Chen, J. Future global socioeconomic risk to droughts based on estimates of hazard, exposure, and vulnerability in a changing climate. Sci. Total Environ. 2020, 751, 142159. [Google Scholar] [CrossRef]
  12. Kundzewicz, Z.W.; Mata, L.J.; Arnell, N.; Döll, P.; Jiménez, B.; Miller, K.; Oki, T.; Şen, Z.; Shiklomanov, I. The implications of projected climate change for freshwater resources and their management. Hydrol. Sci. J. 2008, 53, 3–10. [Google Scholar] [CrossRef]
  13. Alamgir, M.; Khan, N.; Shahid, S.; Yaseen, Z.M.; Dewan, A.; Hassan, Q.K.; Rasheed, B. Evaluating severity–area–frequency (SAF) of seasonal droughts in Bangladesh under climate change scenarios. Stoch. Environ. Res. Risk Assess. 2020, 34, 447–464. [Google Scholar] [CrossRef]
  14. Singh, S. Explaining the Pight of Bundelkhand: Drought, Suicide and Governance. Bundelkhand 2012, 15, 2013. [Google Scholar]
  15. Thomas, T.; Jaiswal, R.; Galkate, R.; Nayak, T. Reconnaissance Drought Index Based Evaluation of Meteorological Drought Characteristics in Bundelkhand. Procedia Technol. 2016, 24, 23–30. [Google Scholar] [CrossRef] [Green Version]
  16. Singh, R.P.; Roy, S.; Kogan, F. Vegetation and temperature condition indices from NOAA AVHRR data for drought monitoring over India. Int. J. Remote Sens. 2003, 24, 4393–4402. [Google Scholar] [CrossRef]
  17. Patel, N.; Yadav, K. Monitoring spatio-temporal pattern of drought stress using integrated drought index over Bundelkhand region, India. Nat. Hazards 2015, 77, 663–677. [Google Scholar] [CrossRef]
  18. Thomas, T.; Jaiswal, R.K.; Nayak, P.C.; Ghosh, N.C. Comprehensive evaluation of the changing drought characteristics in Bundelkhand region of Central India. Theor. Appl. Clim. 2015, 127, 163–182. [Google Scholar] [CrossRef]
  19. Pandey, V.; Srivastava, P. Integration of satellite, global reanalysis data and macroscale hydrological model for drought assessment in sub-tropical region of india. Int. Arch. Photogramm. Remote Sens. Spat. Inf. Sci. 2018, 42. [Google Scholar] [CrossRef] [Green Version]
  20. Gao, F.; Zhang, Y.; Ren, X.; Yao, Y.; Hao, Z.; Cai, W. Evaluation of CHIRPS and its application for drought monitoring over the Haihe River Basin, China. Nat. Hazards 2018, 92, 155–172. [Google Scholar] [CrossRef]
  21. Tao, H.; Fischer, T.; Zeng, Y.; Fraedrich, K. Evaluation of TRMM 3B43 Precipitation Data for Drought Monitoring in Jiangsu Province, China. Water 2016, 8, 221. [Google Scholar] [CrossRef] [Green Version]
  22. Shrestha, N.K.; Qamer, F.M.; Pedreros, D.; Murthy, M.S.R.; Wahid, S.M.; Shrestha, M. Evaluating the accuracy of Climate Hazard Group (CHG) satellite rainfall estimates for precipitation based drought monitoring in Koshi basin, Nepal. J. Hydrol. Reg. Stud. 2017, 13, 138–151. [Google Scholar] [CrossRef]
  23. Funk, C.C.; Peterson, P.J.; Landsfeld, M.F.; Pedreros, D.H.; Verdin, J.; Rowland, J.; Romero, B.E.; Husak, G.J.; Michaelsen, J.C.; Verdin, A.P. A quasi-global precipitation time series for drought monitoring. Data Ser. 2014, 832, 1–12. [Google Scholar] [CrossRef]
  24. Funk, C.; Peterson, P.; Landsfeld, M.; Pedreros, D.; Verdin, J.; Shukla, S.; Husak, G.; Rowland, J.; Harrison, L.; Hoell, A.; et al. The climate hazards infrared precipitation with stations—A new environmental record for monitoring extremes. Sci. Data 2015, 2, 1–21. [Google Scholar] [CrossRef] [Green Version]
  25. Prakash, S. Performance assessment of CHIRPS, MSWEP, SM2RAIN-CCI, and TMPA precipitation products across India. J. Hydrol. 2019, 571, 50–59. [Google Scholar] [CrossRef]
  26. Zhong, R.; Chen, X.; Lai, C.; Wang, Z.; Lian, Y.; Yu, H.; Wu, X. Drought monitoring utility of satellite-based precipitation products across mainland China. J. Hydrol. 2019, 568, 343–359. [Google Scholar] [CrossRef]
  27. Wu, W.; Li, Y.; Luo, X.; Zhang, Y.; Ji, X.; Li, X. Performance evaluation of the CHIRPS precipitation dataset and its utility in drought monitoring over Yunnan Province, China. Geomat. Nat. Hazards Risk 2019, 10, 2145–2162. [Google Scholar] [CrossRef] [Green Version]
  28. Pandey, V.; Srivastava, P.K.; Mall, R.; Munoz-Arriola, F.; Han, D. Multi-satellite precipitation products for meteorological drought assessment and forecasting in Central India. Geocarto Int. 2020, 1–20. [Google Scholar] [CrossRef]
  29. Ajaz, A.; Taghvaeian, S.; Khand, K.; Gowda, P.; Moorhead, J.E. Development and Evaluation of an Agricultural Drought Index by Harnessing Soil Moisture and Weather Data. Water 2019, 11, 1375. [Google Scholar] [CrossRef] [Green Version]
  30. Livada, I.; Assimakopoulos, V.D. Spatial and temporal analysis of drought in greece using the Standardized Precipitation Index (SPI). Theor. Appl. Clim. 2007, 89, 143–153. [Google Scholar] [CrossRef]
  31. Saravi, M.M.; Safdari, A.A.; Malekian, A. Intensity-Duration-Frequency and spatial analysis of droughts using the Standardized Precipitation Index. Hydrol. Earth Syst. Sci. Discuss. 2009, 6, 1347–1383. [Google Scholar] [CrossRef] [Green Version]
  32. Shiau, J.T.; Modarres, R. Copula-based drought severity-duration-frequency analysis in Iran. Meteorol. Appl. 2009, 16, 481–489. [Google Scholar] [CrossRef]
  33. Thomas, T.; Nayak, P.C.; Ghosh, N.C. Spatiotemporal Analysis of Drought Characteristics in the Bundelkhand Region of Central India using the Standardized Precipitation Index. J. Hydrol. Eng. 2015, 20, 05015004. [Google Scholar] [CrossRef]
  34. Yue, S.; Wang, C. The Mann-Kendall Test Modified by Effective Sample Size to Detect Trend in Serially Correlated Hydrological Series. Water Resour. Manag. 2004, 18, 201–218. [Google Scholar] [CrossRef]
  35. Pandey, V.; Srivastava, P.K. Integration of Microwave and Optical/Infrared Derived Datasets for a Drought Hazard Inventory in a Sub-Tropical Region of India. Remote Sens. 2019, 11, 439. [Google Scholar] [CrossRef] [Green Version]
  36. Palsaniya, D.; Singh, R.; Yadav, R.; Tewari, R.; Dhyani, S. Now it is water all the way in Garhkundar-Dabar watershed of drought-prone semi-arid Bundelkhand, India. Curr. Sci. 2011, 100, 1287–1288. [Google Scholar]
  37. Singh, R.; Garg, K.K.; Wani, S.P.; Tewari, R.; Dhyani, S. Impact of water management interventions on hydrology and ecosystem services in Garhkundar-Dabar watershed of Bundelkhand region, Central India. J. Hydrol. 2014, 509, 132–149. [Google Scholar] [CrossRef] [Green Version]
  38. Roy, P.S.; Roy, A.; Joshi, P.K.; Kale, M.P.; Srivastava, V.K.; Srivastav, S.K.; Dwivedi, R.S.; Joshi, C.; Behera, M.D.; Meiyappan, P.; et al. Development of Decadal (1985–1995–2005) Land Use and Land Cover Database for India. Remote Sens. 2015, 7, 2401–2430. [Google Scholar] [CrossRef] [Green Version]
  39. Povoa, L.V.; Nery, J.T. Precintcon: Precipitation Intensity, Concentration and Anomaly Analysis; R Package Version. Available online: https://cran.r-project.org/web/packages/precintcon/index.html (accessed on 17 February 2020).
  40. Thom, H.C. A note on the gamma distribution. Mon. Weather Rev. 1958, 86, 117–122. [Google Scholar] [CrossRef]
  41. McKee, T.B.; Doesken, N.J.; Kleist, J. The relationship of drought frequency and duration to time scales. In Proceedings of the 8th Conference on Applied Climatology, Boston, MA, USA, 17–22 January 1993; Volume 17, pp. 179–183. [Google Scholar]
  42. Stagge, J.H.; Tallaksen, L.M.; Gudmundsson, L.; Van Loon, A.F.; Stahl, K. Candidate Distributions for Climatological Drought Indices (SPI and SPEI). Int. J. Clim. 2015, 35, 4027–4040. [Google Scholar] [CrossRef]
  43. Kumar, M.N.; Murthy, C.S.; Sai, M.V.R.S.; Roy, P.S. On the use of Standardized Precipitation Index (SPI) for drought intensity assessment. Meteorol. Appl. 2009, 16, 381–389. [Google Scholar] [CrossRef] [Green Version]
  44. Svoboda, M.; Hayes, M.; Wood, D. Standardized Precipitation Index User Guide; World Meteorological Organization: Geneva, Switzerland, 2012. [Google Scholar]
  45. Yevjevich, V.M. Objective approach to definitions and investigations of continental hydrologic droughts, An. In Hydrology Papers; Colorado State University: Fort Collins, CO, USA, 1967. [Google Scholar]
  46. Tan, C.; Yang, J.; Li, M. Temporal-Spatial Variation of Drought Indicated by SPI and SPEI in Ningxia Hui Autonomous Region, China. Atmosphere 2015, 6, 1399–1421. [Google Scholar] [CrossRef] [Green Version]
  47. Nam, W.-H.; Hayes, M.J.; Svoboda, M.D.; Tadesse, T.; Wilhite, D.A. Drought hazard assessment in the context of climate change for South Korea. Agric. Water Manag. 2015, 160, 106–117. [Google Scholar] [CrossRef]
  48. Spinoni, J.; Naumann, G.; Carrao, H.; Barbosa, P.; Vogt, J. World drought frequency, duration, and severity for 1951–2010. Int. J. Clim. 2014, 34, 2792–2804. [Google Scholar] [CrossRef] [Green Version]
  49. Sen, P.K. Estimates of the regression coefficient based on Kendall’s tau. J. Am. Stat. Assoc. 1968, 63, 1379–1389. [Google Scholar] [CrossRef]
  50. Guo, H.; Bao, A.; Liu, T.; Ndayisaba, F.; He, D.; Kurban, A.; De Maeyer, P. Meteorological Drought Analysis in the Lower Mekong Basin Using Satellite-Based Long-Term CHIRPS Product. Sustainability 2017, 9, 901. [Google Scholar] [CrossRef] [Green Version]
  51. Kundu, A.; Patel, N.R.; Denis, D.M.; Dutta, D. An Estimation of Hydrometeorological Drought Stress over the Central Part of India using Geo-information Technology. J. Indian Soc. Remote Sens. 2020, 48, 1–9. [Google Scholar] [CrossRef]
  52. Padhee, S.K.; Nikam, B.R.; Dutta, S.; Aggarwal, S.P. Using satellite-based soil moisture to detect and monitor spatiotemporal traces of agricultural drought over Bundelkhand region of India. GIScience Remote Sens. 2017, 54, 144–166. [Google Scholar] [CrossRef]
  53. Pandey, V.; Srivastava, P.K. Evaluation of Satellite Precipitation Data for Drought Monitoring in Bundelkhand Region, India. In Proceedings of the IGARSS 2019 IEEE International Geoscience and Remote Sensing Symposium, Yokohama, Japan, 28 July–2 August 2019; pp. 9910–9913. [Google Scholar]
  54. Sahoo, S.; Sil, I.; Dhar, A.; Debsarkar, A.; Das, P.; Kar, A. Future scenarios of land-use suitability modeling for agricultural sustainability in a river basin. J. Clean. Prod. 2018, 205, 313–328. [Google Scholar] [CrossRef]
  55. Avtar, R.; Kumar, P.; Singh, C.K.; Sahu, N.; Verma, R.L.; Thakur, J.K.; Mukherjee, S. Hydrogeochemical Assessment of Groundwater Quality of Bundelkhand, India Using Statistical Approach. Water Qual. Expo. Health 2013, 5, 105–115. [Google Scholar] [CrossRef]
  56. Chourasia, L.; Jhariya, D. Water Crisis in the Bundelkhand Region: An Observation. In IOP Conference Series: Earth and Environmental Science; IOP Publishing: Raipur, India, 2020; p. 012024. [Google Scholar] [CrossRef]
  57. Ashfaq, M. Topographic Controls on the Distribution of Summer Monsoon Precipitation over South Asia. Earth Syst. Environ. 2020, 4, 667–683. [Google Scholar] [CrossRef]
  58. Saeed, F.; Hagemann, S.; Jacob, D.J. Impact of irrigation on the South Asian summer monsoon. Geophys. Res. Lett. 2009, 36, 36. [Google Scholar] [CrossRef]
  59. Almazroui, M.; Saeed, S.; Saeed, F.; Islam, M.N.; Ismail, M. Projections of Precipitation and Temperature over the South Asian Countries in CMIP6. Earth Syst. Environ. 2020, 4, 297–320. [Google Scholar] [CrossRef]
  60. Jana, C.; Alam, N.M.; Mandal, D.; Shamim, M.; Kaushal, R. Spatio-temporal rainfall trends in the twentieth century for Bundelkhand region, India. J. Water Clim. Chang. 2017, 8, 441–455. [Google Scholar] [CrossRef]
  61. Pandey, V.; Srivastava, P.K.; Das, P.; Behera, M.D. Irrigation water demand estimation in Bundelkhand region using the variable infiltration capacity model. In Agricultural Water Management; Elsevier: London, UK; pp. 331–347.
  62. Garg, K.K.; Singh, R.; Anantha, K.; Singh, A.K.; Akuraju, V.R.; Barron, J.; Dev, I.; Tewari, R.; Wani, S.P.; Dhyani, S.; et al. Building climate resilience in degraded agricultural landscapes through water management: A case study of Bundelkhand region, Central India. J. Hydrol. 2020, 591, 125592. [Google Scholar] [CrossRef]
  63. Zou, Y.; Saddique, Q.; Ali, A.; Xu, J.; Khan, M.I.; Qing, M.; Azmat, M.; Cai, H.; Siddique, K.H. Deficit irrigation improves maize yield and water use efficiency in a semi-arid environment. Agric. Water Manag. 2021, 243, 106483. [Google Scholar] [CrossRef]
  64. Thomas, T.; Nayak, P.C.; Ghosh, N.C. Irrigation planning for sustainable rain-fed agriculture in the drought-prone Bundelkhand region of Madhya Pradesh, India. J. Water Clim. Chang. 2014, 5, 408–426. [Google Scholar] [CrossRef]
Figure 1. The Study area map showing (a) long-term CHIRPS data derived annual average precipitation map, and (b) the land use land cover [38].
Sustainability 13 01042 g001
Figure 2. A conceptual run theory map for the drought characterization.
Sustainability 13 01042 g002
Figure 3. The temporal evaluation of SPI averaged over the Bundelkhand-UP region at different time scales: (a) SPI1; (b); SPI3; (c) SPI6; and (d) SPI12.
Sustainability 13 01042 g003
Figure 4. The temporal evaluation of SPI12 averaged over the different districts (ag) of Bundelkhand for drought events identification.
Sustainability 13 01042 g004
Figure 5. District-wide duration, intensity, and severity of drought events by SPI12. (ac) represents the drought event span.
Sustainability 13 01042 g005
Figure 6. Average drought duration (a), severity (b), and intensity (c) calculated from SPI12 for 7 districts during the years 1981–2018 in Bundelkhand.
Sustainability 13 01042 g006
Figure 7. Spatial representation of SPI for different drought events occurred for the study period (1981–2018) over Bundelkhand region of Uttar Pradesh.
Sustainability 13 01042 g007
Table 1. Drought classification based on SPI range [44].
LevelDrought CategorySPI Range
1Mild drought0 to −1.0
2Moderate drought−1.1 to −1.5
3Severe drought−1.6 to −2
4Extreme drought<−2
Table 2. The annual rainfall characteristics of different districts of Bundelkhand between the years 1981 and 2018.
Districts Rainfall (mm)
MinMaxMeanSDCV
Banda657.251246.14894.24170.2719.04
Jalaun531.121189.97841.46168.3420.01
Hamirpur590.501202.67856.33173.1520.22
Lalitpur682.111507.24940.01208.1722.15
Mahoba649.911273.33905.84180.5419.93
Jhansi548.481237.24840.97172.2120.48
Chitrakoot604.331261.21897.49168.3518.76
Table 3. District-wide descriptive statistics of drought characteristics obtained from SPI at a 12-month time scale for the study period.
SPI 12BandaJalaunHamirpurLalitpurMahobaJhansiChitrakoot
Number of drought events99991087
Maximum drought severity43.5333.0834.9244.0234.0339.1940.59
Maximum drought duration36263546354636
Maximum drought intensity1.211.811.321.271.401.521.43
Average drought severity18.6118.2318.5418.5717.0622.0722.77
Average drought duration20172120182523
Average drought intensity0.871.080.890.960.970.940.94
Minimum drought severity3.705.073.438.346.288.307.90
Minimum drought duration888881313
Minimum drought intensity0.460.600.400.700.500.500.60
Table 4. MK trend Z-statistics and Sen’s Slope of SPI at annual and seasonal scale (C.I. = 95%, p-value < 0.05).
Seasons
DistrictsSPIMKAnnualPre−MonsoonMonsoonPost−MonsoonWinter
Banda1Z−1.530.60.43−2.69−1.31
Slope−0.0170.0050.005−0.029−0.014
3Z−0.220.30.84−0.75−1.88
Slope−0.0020.0050.014−0.007−0.028
6Z−0.01−0.460.930.8−0.56
Slope0−0.0100.0150.013−0.009
12Z1.030.640.610.670.46
Slope0.0080.0110.0120.0110.01
Jalaun1Z−0.041.281.13−2.13−0.80
Slope−0.0020.0120.009−0.032−0.009
3Z0.040.221.24−0.38−0.40
Slope00.0020.02−0.007−0.020
6Z0.43−0.411.370.77−0.59
Slope0.003−0.0050.0210.016−0.006
12Z1.060.591.430.880.61
Slope0.0130.0120.0140.0150.012
Hamirpur1Z−0.511.080.78−2.42−0.80
Slope−0.0030.0140.008−0.033−0.012
3Z−0.3001.22−0.61−0.50
Slope−0.00200.018−0.009−0.027
6Z0.43−0.801.450.9−0.48
Slope0.003−0.0140.0220.016−0.008
12Z1.030.691.110.980.59
Slope0.0130.0130.0140.0150.01
Lalitpur1Z−0.280.751.23−2.04−0.48
Slope−0.0010.0040.009−0.016−0.006
3Z−0.090.331.22−0.17−0.61
Slope00.0050.018−0.003−0.021
6Z0.27−0.431.430.8−0.01
Slope0.003−0.0060.0180.0110
12Z0.0131.031.030.0121.01
Slope0.0140.0150.0120.0130.015
Mahoba1Z−0.720.720.72−2.34−1.48
Slope−0.0040.0080.007−0.026−0.022
3Z−0.410.331.11−0.35−0.99
Slope−0.0030.0040.018−0.007−0.036
6Z−0.50−0.85−1.140.69−0.35
Slope−0.004−0.012−0.0180.015−0.008
12Z1.010.90.980.640.75
Slope0.0110.0170.0130.0130.013
Jhansi1Z−0.302.240.83−2.37−0.88
Slope−0.0010.0170.009−0.027−0.012
3Z−0.200.671.35−0.56−0.64
Slope−0.0010.0090.017−0.010−0.022
6Z0.38−0.541.190.61−0.35
Slope0.004−0.0070.0170.01−0.007
12Z1.090.720.90.770.69
Slope0.0130.0140.0120.0130.012
Chitrakoot1Z−1.130.50.58−2.59−1.11
Slope−0.0040.0060.005−0.023−0.011
3Z−0.480.20.88−0.67−1.50
Slope−0.0030.0030.015−0.009−0.021
6Z−0.43−0.460.750.67−0.54
Slope−0.002−0.0080.0140.013−0.011
12Z0.540.640.640.750.46
Slope0.0060.0130.0080.0130.009
Bold values indicate a significant trend at 95% confidence level.
Publisher’s Note: MDPI stays neutral with regard to jurisdictional claims in published maps and institutional affiliations.

