Article

Efficiency Analysis of Public Library Services Based on Establishing Entity and Outsourcing

1
Department of Business Administration, Incheon National University, 199 Academy-ro, Incheon 22012, Korea
2
Division of Business and Commerce, Sunchon National University, 255 Jungang-ro, Suncheon 57922, Korea
3
Department of Business Administration, Hansung University, 116 Samseongyo-ro, Seoul 02864, Korea
*
Author to whom correspondence should be addressed.
Sustainability 2020, 12(21), 9205; https://doi.org/10.3390/su12219205
Submission received: 14 October 2020 / Revised: 31 October 2020 / Accepted: 2 November 2020 / Published: 5 November 2020
(This article belongs to the Special Issue Outsourcing Strategy and Sustainability)

Abstract

:
This study investigates the difference in service efficiency based on establishing entity and outsourcing in 847 public libraries in Korea. The public libraries were categorized into three types based on establishing entity and outsourcing, where Type 1 libraries are those established and directly managed by the Office of Education under the central government, Type 2 libraries are established and directly managed by local governments, and Type 3 libraries are established by local governments and their operations are outsourced. Each library type was analyzed and compared using data envelopment analysis (DEA), and results found that public libraries established by local governments are more efficient than those established by the central government, while outsourcing operations improved the efficiency of public libraries. Further analysis of the projection point and excess quantity of input showed that the main cause of inefficiency for Type 1 libraries is the library area, and for Types 2 and 3, the number of periodicals. This study provides guidelines for the sustainable performance of public library services based on the factors of foundation and operational patterns.

1. Introduction

The efficiency of public services has come under scrutiny since the late 1980s with the introduction of new public management that emphasized the need to apply market principles such as competition and operating performance to the public sector [1,2,3,4,5]. Public service refers to the distribution of social benefits by the government designed to address social issues and establish greater equity [6] and embodies the government’s efforts in reaching a goal or solving problems [7]. Public services are characterized by the absence of rivalry and excludability, that is, the utilization of the services by one individual does not reduce their consumption by others and the services are open to access without exclusion of non-paying individuals. The establishing entity of the public service affects the degree of non-rivalry and non-excludability in the public service [8,9], and typically, the central government provides pure public services that strongly exhibit non-rivalry and non-excludability, whereas local governments provide quasi-public services that weakly exhibit either non-rivalrous or non-excludable qualities [10]. In this sense, the malleability in which market principles can be applied to public services may depend on the degree to which the service needs to embody these two characteristics, which in turn, may depend on the type of entity establishing the service, i.e., the central or local government.
Meanwhile, as a way to enhance public service efficiency, governments have begun to outsource public services it previously provided directly by contracting with private institutions [11]. However, a few studies have so far been conducted on the relationship between outsourcing and efficiency. While outsourcing public services is criticized for producing inefficiencies or for resulting in higher expenditures incurred from the transaction with private entities that override intended cost savings [12], other studies have reported that the outsourcing of public services increase efficiency [13,14], by ways of optimizing the number of public servants to effectively reduce financial expenses [15,16] and improving service quality through the import of the expertise, resources, and technology of the private sector [17,18].
Therefore, the objectives of this study are to analyze the efficiency of public library services based on the establishing entity and outsourcing. Specifically, the purpose of this study is to examine whether the efficiency of public libraries will be higher if the government with more autonomy establishes them in terms of the establishing entity, and outsourcing is made more in terms of operation. For such a purpose, this study proposes the following three research questions. First, are public libraries established by local governments more efficient than those established by the central government in terms of the establishing entity (level of government)? Second, are public libraries outsourcing operations to private institutions more efficient than those directly managed by the government in terms of the method of operation (direct management or outsourcing)? Third, what are the drivers that improve the efficiency of public library services, and how can the efficiency be improved?
To shed light on the research questions posed above, 847 public libraries currently operating in Korea were categorized based on two factors: the organization or agency that established them in the first place, a factor that we call “establishing entity”, and based on outsourcing used by the library. This classification scheme yielded three groups of public libraries: (1) libraries established and directly managed by the Office of Education (Type 1), (2) libraries established and directly managed by the local government (Type 2), (3) libraries established by the local government and whose operations are outsourced to private institutions (Type 3).
An efficiency analysis was conducted using the data envelopment analysis (DEA) method, and the results presented three main implications. First, public libraries established by quasi-public institutions (Types 2 and 3) are more efficient than those by pure public institutions (Type 1). Second, public libraries whose operations were outsourced to private institutions (Type 3) are more efficient than those under direct management of the public institution (Types 1 and 2). Third, the main cause of inefficiency for Type 1 is the library area, whereas for Types 2 and 3, it is the number of periodicals.
This paper is organized as follows. Following the introduction in Section 1, Section 2 lays out the theoretical background on the categorization of public libraries and the analysis method used in this study. Section 3 provides the details of the methodology used, including the input and output variables used in conducting DEA. Section 4 presents the results of the analysis for each type as well as comparisons among the types for causes and degrees of inefficiency to suggest guidelines for improvement. Lastly, Section 5 summarizes and outlines the implications and limitations of this study.

2. Literature Review

2.1. Public Library Types Based on Establishing Entity and Outsourcing

Public services can be divided into pure public services typically provided by the central government and quasi-public services provided by the local government, where quasi-public services exhibit weaker non-rivalry and non-excludability, thus possibly better allowing the application of market principles compared to pure public services. In the case of Korea, public libraries performing pure public services are established by the Office of Education on the central government level, while those providing quasi-public services are established by local governments. The difference in establishing entity can influence the relative efficiency of public libraries due to the different nature of the central and local governments: pure public services are uniformly distributed across regions regardless of their needs, while quasi-public services are offered to meet specific local needs. The local focus of quasi-public services makes it easier to collect accurate information on the costs and benefits of supplying services, and thus, it has been suggested that local governments can provide public services more efficiently through more sound decisions [19].
In terms of method of operation, public libraries are operated either by direct management of the establishing entity or through outsourcing to private institutions. Outsourcing generally refers to the delegation of specific authorities to perform certain tasks to an external firm [20,21]. Private contracting not only gives the authority to perform selected tasks, but also the overall management of the organization to an external firm [22]. The decision to outsource daily operations at public libraries depends on how the establishing entity interprets the nature of library operations. For instance, in the case of Korea, the Office of Education sees library operations as requiring supervision by librarians, and thus has its public libraries directly managed by librarian staff who are employed as public servants under the Office of Education. On the other hand, local governments outsource tasks that do not require provision by librarians, such as public facilities and operations management and clerical work to private institutions. These private institutions can be cultural centers, corporate bodies, or private firms. Of the library types in Table 1, Type 3 is whose operations are outsourced to reduce operation costs and increase library service efficiency, by delegating tasks which do not need the regulation and supervision of the government, while the local government oversees the management of the overall organization.

2.2. Methods for Efficiency Analysis of Public Library Services

As public services often lack a priori information on appropriate production technology and price, most studies on analyzing public library services have used non-parametric frontier methods. As shown in Table 2 below, the main analysis methods used in existing literature are free disposal hull (FDH) and data envelopment analysis (DEA), both of which are nonparametric frontier methods [23]. Both methods have their strengths and weaknesses in efficiency analysis. FDH imposes the least amount of restrictions on the data, as it only assumes the free disposability of resources and the strong disposability of outputs, which, respectively, allows the decision making units (DMUs) to use more inputs than technically necessary to produce a certain level of output and to generate less output than technically possible with a certain amount of resources.
On the other hand, DEA holds the assumption that linear combinations of the observed input-output bundles are feasible. Hence, it assumes the existence of a convex production frontier that is not required in the FDH. This makes DEA stricter than FDH, meaning that fewer DMUs will be found fully efficient and the efficiency scores will be lower [24,25,26]. The advantages of utilizing DEA are that, first, it measures the relative efficiency among DMUs based on multiple input and output variables [27,28,29], and second, it can provide information not only on overall efficiency, but also on inefficient factors and the reference sets that can be used for benchmarking [30].
Previous research provides a clear guideline on which analysis method better meets the purposes of this study. Stroobants and Bouckaert [30] analyzed the efficiency of four local public library services in Flanders, using both FDH and DEA for implications on the benchmarking and performance objectives. They found that public libraries considered efficient using the DEA method were also efficient when using FDH but not vice versa. Thus, DEA can be considered the more appropriate method to investigate the relative efficiency of public library services.

3. Methodology

3.1. Analysis Method

As can be seen from Appendix A, DEA is a non-parametric approach based on linear programming first introduced by Charnes et al. [31] for assessing the relative efficiencies of a set of DMUs in operations research [32]. This methodology has been applied to various areas [33,34,35], including the public sector. DEA is divided by assumption of return to scale into the CCR (Charnes-Cooper-Rhodes) model assuming constant returns to scale (CRS) and the BCC (Banker-Charnes-Cooper) model assuming variable returns to scale (VRS). Therefore, the CCR model is appropriate for analyzing cases where all DMUs are operational in their optimum scale. However, the nature of public services dictates that it is very much unlikely for non-profit public libraries to accomplish its optimum scale in reality [36]. Moreover, since the BCC model focuses on finding the extent to which the scale of operations affects productivity [37], it is more suitable for this study than the CCR model. The standard BCC model assuming VRS formulated in Equation (1) standard BCC model [38] below.
Maximize   h 0 ( Efficiency   of   D M U 0 ) =   i = 1 m u i y i 0 + u 0 r = 1 s v r x r 0 s . t .   i = 1 m u i y i j + u 0 r = 1 s v r x r j 1   ,   j = 1 , 2 , 3 , , n u i ε > 0   ,   i = 1 , 2 , 3 , ,   s v r ε > 0   ,   r = 1 , 2 , 3 , ,   m
  • u 0 = scale indicator
  • u i = weight   assigned   to   the   i th   output ,     v r = weight   assigned   to   the   r th   input
  • y i j = amount   of   i th   output   of   D M U j ,     x r j = amount   of   r th   input   of   D M U j
  • ε = non Archimedean   number ,   n = number   of   DMU
  • m = number   of   input   variables ,   s = number   of   output   variables
The equation in Equation (1) is a non-linear objective function with non-convex constraints, and so it is possible to convert the equation into the linear programming problem in Equation (2) linear programming problem:
Maximize   h 0 =   i = 1 m u i y i 0 + u 0 s . t .   i = 1 s u i y i j r = 1 m v r x r j + u 0 0   ,   j = 1 , 2 , 3 , , n i = 1 s u i y i 0 = 1 u r ε > 0   ,   r = 1 , 2 , 3 , ,   m v i ε > 0   ,   i = 1 , 2 , 3 , ,   s
As the equation for constraints in Equation (2) includes , slack and surplus variables S + ,   S can be input in the equation to derive Equation (3) linear programming problem with slack and surplus variables below:
Maximize   h 0 =   θ s . t .   j = 1 n λ j x r j +   s r = θ   x r 0   ,   r = 1 , 2 , 3 , , m j = 1 n λ j y i j   s i + =   y i 0 ,   i = 1 , 2 , 3 , ,   s i = 1 m λ j = 1 . s i 0 ,   s r + 0 ,   λ j 0
The projection point in the BCC model can be found using the equation in Equation (4) linear projection point below. By calculating the projection point, it is possible to deduce the reasons for inefficiency in public libraries and the benchmarks for improving the efficiency of current public library services.
( x i 0 ^   ,   y r 0 ^ ) = P r o j e c t i o n   p o i n t   o f   ( x i 0   ,   y r 0 ) ( 1 )   E x c e s s   q u a n t i t y   o f   i n p u t = x i 0   x i 0 ^ ( 2 )   S h o r t a g e   o f   o u t p u t =   y r 0   y r 0 ^ * x i 0 ^ =   j = 1 n λ j * x i j =   θ * x i 0   s i * ,   i y r 0 ^ =   j = 1 n λ j * y r j =   y r 0   s r + * ,   i

3.2. Selecting Input and Output Variables

Input and output variables in previous literature on the efficiency of library services are tabulated in Table 2.
Each of the variables is defined in this study as follows. For the input variables, the number of employees is the number of full-time and part-time staff working at the library, and includes librarians, administrative staff, and computing staff who are employed as certified librarians. Material budget refers to the total expenditure for all resource materials, including books, magazines and periodicals, electronic materials, and media resources; and library area refers to the total area of the library, including the land the library occupies and the total floor area. The number of books is the total of all domestic and foreign publications; business hours are the daily hours of service from opening to closing; and the number of periodicals is the total of all domestic and foreign periodicals. For the output variables, the number of books borrowed is the total number of books taken out by library users regardless of topic or field; the number of users is the total number of visitors to the library and its archives; and the number of reference service users refers to the number of people who have made requests to the library for its information service. A correlation analysis was conducted for both the input and output variables to delete variables that are highly correlated for an economical use of variables without any loss of information, as suggested by Lewin et al. [45]. The results of the correlation analysis on the input and output variables are shown in Table 3 and Table 4.
As can be seen from Table 3 and Table 4, the coefficient between the input variable of X2 (MB) and X4 (NB) and the output variable of Y1 (NBB) and Y2 (NU) were 0.702 and 0.847 respectively, with a significance level of 0.01. In accordance with the criteria provided by Lewin et al. [45], among the variables that were close to 1, X2 (MB) and Y1 (NBB), namely, material budget and the number of books borrowed, were eliminated.
Based on the prior studies and correlation analysis, this study initially employed five input variables and two output variables in Table 5. These input and output variables were chosen to reflect how much the public library is utilized by the public.

3.3. Data Collection

The input and output data in Table 6 were collected from Korea’s National Library Statistics System, a statistical database managed by the Ministry of Culture, Sports and Tourism, for the year 2013. In the past, library statistics in Korea were difficult to ascertain due to various factors such as the diversification of library operating institutions and insufficient related policies. The National Library Statistics System, which was created to solve these difficulties, collects library data for all regions in Korea every year. It provides comprehensive statistical information to check the current status of domestic libraries, and has established a systematic collection, operation, and provision system of statistical information for each library type, in order to maintain the consistency of library statistics and improve the reliability of library data. It currently collects and publishes various areas such as basic library information, collection materials, facilities, human resources, budget status, usage and users, services for the disabled and children, and electronic services of libraries. It also categorizes them into national libraries, public libraries, school libraries, university libraries, and specialized libraries, and provides data by subdividing them into establishment entity. It provides reliable library statistics and stands up to scientific scrutiny by integrating individual statistical surveys. The descriptive statistics of the collected data is summarized in Table 7.

4. Results

4.1. DEA Results

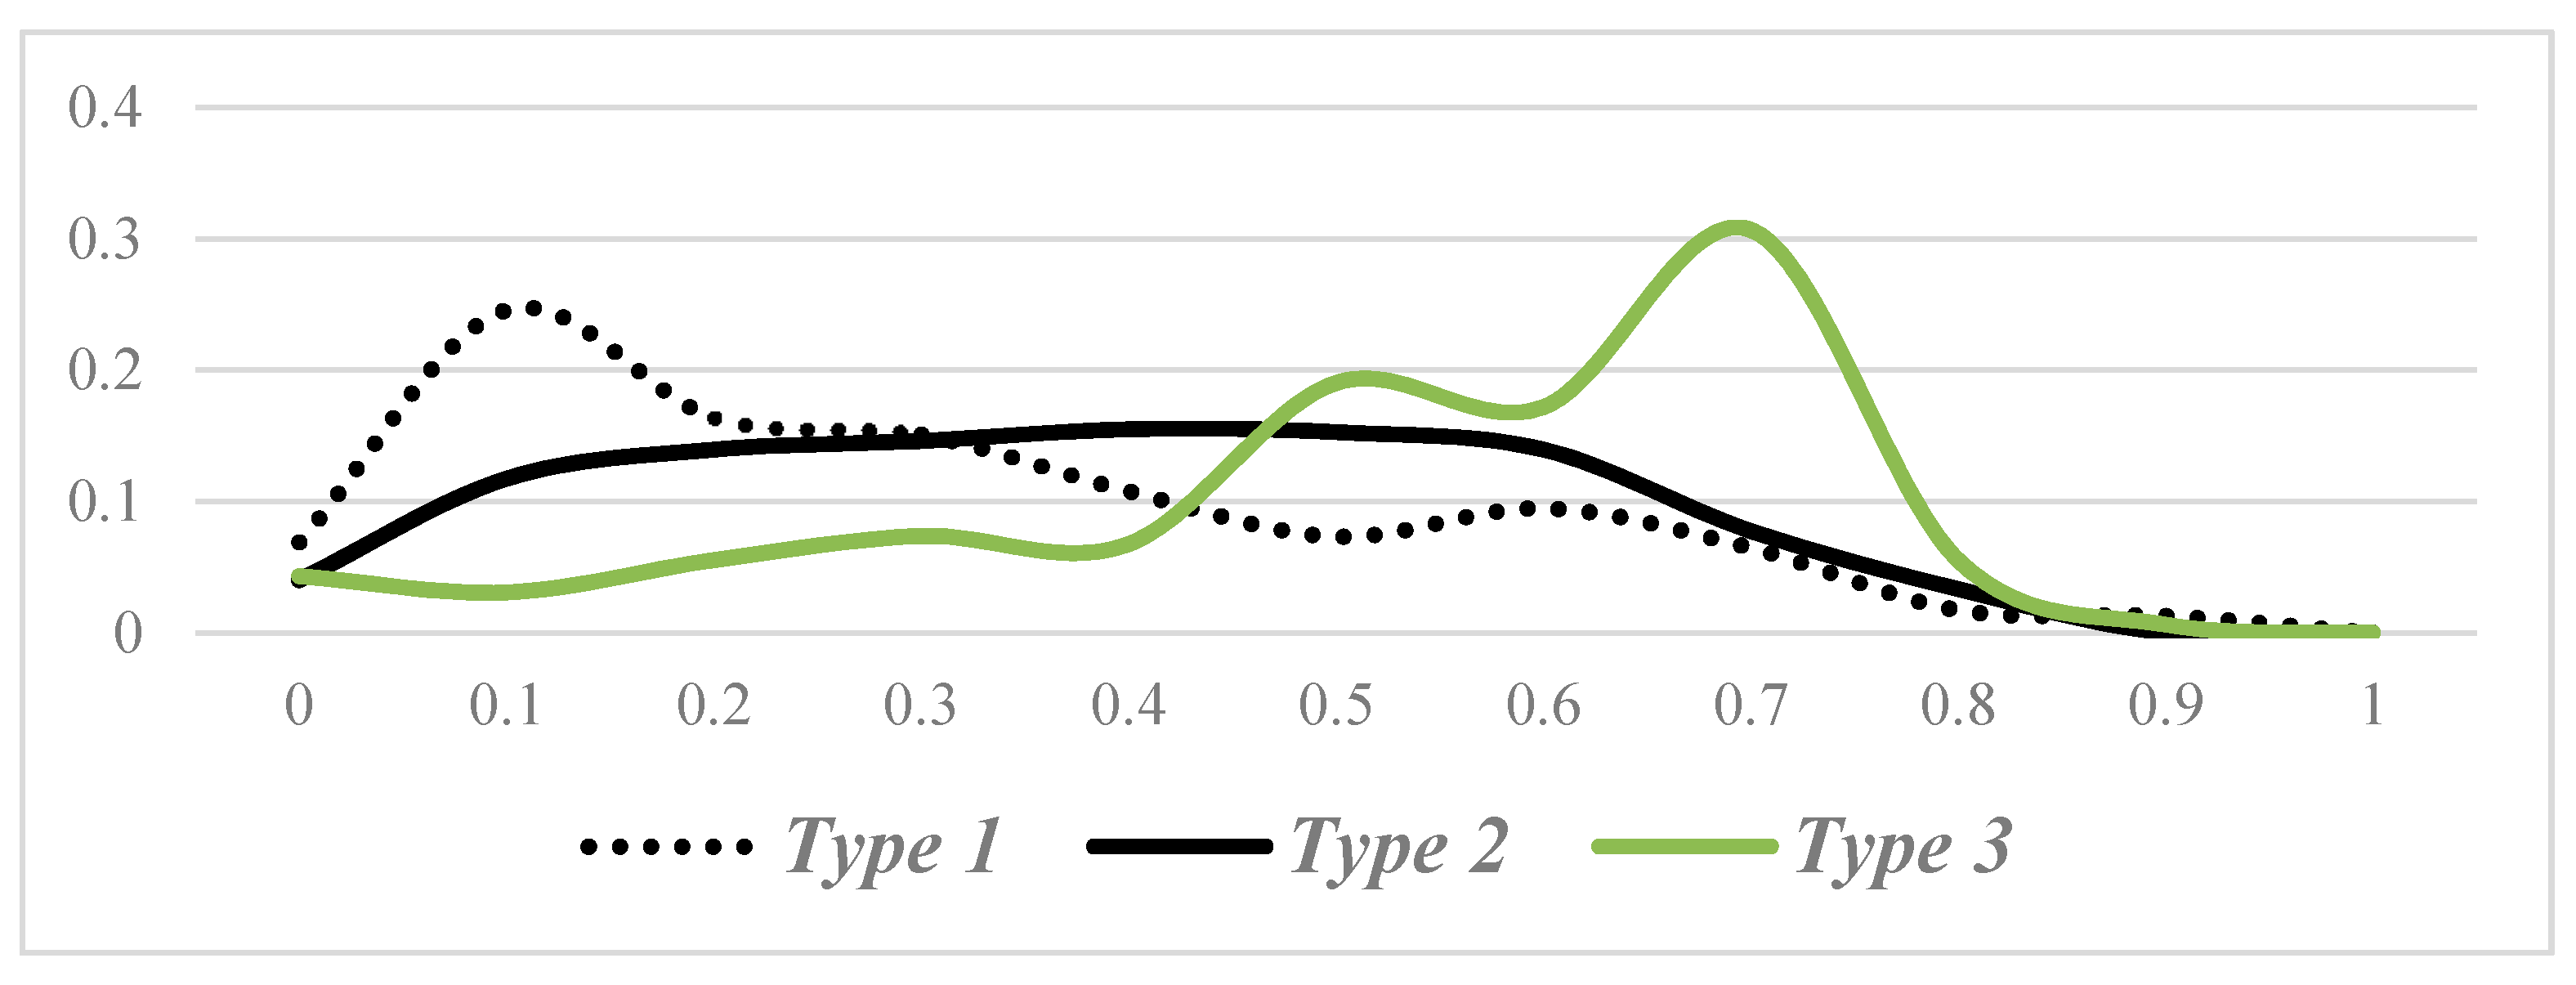
4.1.1. Efficiency Score

From the pure technical efficiency and scale efficiency results in Table 8, the percentage of efficient libraries were shown to be the lowest for Type 1 at 3.45%, with higher percentages found for Type 2 at 10.40% and Type 3 at 27.00%. When pure technical efficiency is higher than scale efficiency, inefficiency is mainly caused by economies of scale. Type 1 showed higher scale inefficiency (61.64%) to operational inefficiency (34.91%), while Types 2 and 3 both exhibited lower scale inefficiency to operational inefficiency, which were 41.59 to 48.01% and 28.83 to 44.17%, respectively. These results suggest that 61.64% of the libraries in Type 1 suffer from scale inefficiency, which can be improved by increasing the utilization of employees, library area, books, business hours, and periodicals. As public libraries established by the Office of Education (Type 1) have larger scale inefficiency compared to those established by local governments (Types 2 and 3), it is necessary for the Office of Education to put more consideration in the appropriate size and scale for its future library construction. On the other hand, lower pure technical efficiency to scale efficiency represents operational inefficiency. Therefore, Types 2 and 3 require a strategic approach to improve operational efficiency.

4.1.2. Bootstrap DEA

To measure the robustness of the data, bootstrap DEA was adopted following Simar and Wilson [46] to estimate the distribution of the efficiencies of the public libraries. The steps for bootstrap DEA listed below were performed 2000 times in this study [47].
(1)
Calculating the pure technical efficiency score ^ k on individual DMU by searching for the efficiency score of standard DEA model.
(2)
Random sample generating in the size M from { ^ k   ( k = 1 , 2 , 3 , , M ) } to utilize a kernel density estimation to calculate { 1 b * , 2 b * , 3 b * , , M b * } .
(3)
Calculate {( x k ,   y k b * ) ,   k = 1 , 2 , 3 , , M } as pseudo data set to generate reference bootstrapping.
(4)
Estimating bootstrap efficiency ^ k b *   ( k = 1 , 2 , 3 , , M ) of pure technical efficiency score of each DMU, ^ k   ( k = 1 , 2 , 3 , , M ) , by searching the values of a bootstrap model.
(5)
In order to gain the bootstrap efficiency estimation { ^ k b *   ( b = 1 , 2 , 3 , , A ) } , it is repeatedly calculated A times (A is a larger number). Hall [48] suggests A = 1000 to ensure the proper level of the confidence interval, and Simar and Wilson [46] suggest A = 2000.
As can be seen in Figure 1, the majority of Type 3 libraries (green line) are located in the high efficiency area, compared to Type 2 libraries (black line), which show a level pattern and Type 1 libraries (dotted line) that are in the low efficiency area. Therefore, the efficiency of Type 3 is highest, followed by Type 2 and Type 1 in order.

4.2. Efficiency Differences

To compare the mean difference among library types based on establishing entity and outsourcing, this study conducted the Mann–Whitney U Test, one of the most representative nonparametric verification methods. In addition, the study calculated the mean rank of W for the Wilcoxon signed rank test to verify which type has higher mean efficiency.
First, the Mann–Whitney U test results on efficiency distribution based on establishing entity showed that a statistically significant difference at the 0.05 level existed between Type 1 and Types 2, 3 (Mann–Whitney U = 88,411, Wilcoxon W value = 277,831). Moreover, the results of the Wilcoxon W Test showed that the mean rank for Type 1 was 350.42, which was lower than the mean rank value of Types 2 and 3 (451.76). These results imply that the efficiency of public library services can be improved by having the central government provide budget to the local government rather than establishing public library services directly, so that local governments can take the lead in providing public library services within their districts.
Second, the Mann–Whitney U test on whether different methods of operation affect the efficiency distribution revealed a statistically significant difference at the 0.05 level between Types 1, 2 and Type 3 (Mann–Whitney U = 76,376, Wilcoxon W value = 89,742). The Wilcoxon W Test showed a mean rank of 393.84 for directly managed libraries (Types 1, 2) and a mean rank of 550.56 for outsourced libraries (Type 3), indicating that outsourcing improves the efficiency of public library services.

4.3. Cause of Inefficiency and Improvement Plan

Generally, the measurement of efficiency involves distance measurement between the observed value and the target value which references an ideal point. Therefore, to calculate the excess quantity of input, this study utilized the projection point, which is calculated using the equation shown in Equation (4). The averages listed in Table 5 are the actual average values of the raw data, the values given as ‘projection’ are the values for the projection points, and the values in ‘plan’ are the amount of input that needs to be reduced for the public library services of each type to be efficient.
The results in Table 9 show that in the case of X1 (number of employees), which is related to library operation, all types need to reduce by about 40% to achieve more efficient service provision, while for X3 (library area), which is related to library establishment, Type 1 needs to make a reduction of 60% from the current state. This result shows that most of the inefficiency in Type 1 is caused by the fact that these libraries are generally of a larger area and scale than those of Type 2 and Type 3. The inefficiency caused by the excess in X4 (number of books) was highest in Type 1 followed by Type 2 and Type 3, which shows that Type 1 is also inefficient in terms of the number of domestic and foreign books, and the same results were found for X5 (business hours) as well. The inefficiency caused by the excess of X6 (number of periodicals) was found to be high in all types, but, for Types 2 and 3 in particular, the inefficiency due to the excess of this input was especially high, so these types need to be improved.
To give a clear understanding of the degree of inefficiency, the excessive quantity of input that needs to be reduced to reach an efficient DMU was examined. For example, the most inefficient DMU in Type 1 was DMU 112 and needs to reduce by 490 employees (60.66%); it also should have been built about 2610 m2 (72.93%) smaller, should buy 91,000 less books (63.61%), needs to reduce 70 business hours per week (60.66%) and cut 400 periodicals (60.66%), in order to be efficient. The most inefficient DMU in Type 2 is DMU 436. It needs to let go 189 employees (62.32%), should have been 10,600 m2 (77.91%) smaller, and should have bought 187,000 less books (73.89%), needs to reduce 85 h of operation per week (62.32%) and unsubscribe from 81 periodicals (62.32%). Lastly, for Type 3, its most inefficient DMU 738 needs to reduce by 179 employees (59.65%), and should have been built 4814 m2 (76.35%) smaller, bought 21,000 less books (59.65%), reduce 70 business hours per week (59.65%), as well as cut 45 periodicals (59.65%).

5. Discussion

This study aimed to analyze whether the efficiency of public library services demonstrates any difference depending on its establishing entity and outsourcing. Overall, 847 public libraries were categorized into three types, and DEA was employed using 5 input variables and 2 output variables which were chosen through careful literature review and correlation analysis.
The results of this study have several implications. First, this study contributes to the literature on efficiency of public services by looking into the difference in efficiency at public libraries caused by establishing entity. The analysis results showed that public libraries of Types 2 and 3 were overall more efficient than those of Type 1. In particular, Type 1 established by the central government exhibited high scale inefficiency and thus, needed to decrease the usage of input variables for improvement [19]. On the others, Types 2 and 3 established by local governments showed high pure technical inefficiency, so they should devise strategic ways to improve operational efficiency. The results of this study can be interpreted based on those of previous studies that classified public services into pure public services and quasi-public services based on the establishing entity, and revealed that the degree of non-rivalry and non-excludability differed depending on the type of public services [8,9,10]. While pure public services provided by the central government have strong non-rivalry and non-excludability, quasi-public services provided by local governments have weak non-rivalry or non-excludability. Meanwhile, the nature of public services, such as non-rivalry and non-excludability, impedes the efficiency that produces maximum outputs out of minimum inputs [49,50]. Thus, the results of this study are in line with those of previous studies, suggesting that Type 1 providing pure public services is more inefficient than Types 2 and 3 providing quasi-public services.
Second, the analysis results revealed that public libraries of Types 3 were the most efficient among three types. Type 3 is operated by private institutions through outsourcing. As in the results of this study, it is common that the outsourcing of public services has a positive effect on efficiency [17,51], but consensus on this has not yet been reached [13,52]. Pollitt and Bouckaert [53] pointed out that outsourcing of public services is not consistently significant, and Krugman [54] noted that outsourcing of public services is difficult to provide continuously with high quality and low cost. In addition, Hart et al. [55] mentioned that outsourcing deteriorates the quality of service provision, and Quiggin [56] insisted that outsourcing negatively affects the employment conditions of public service workers. However, similar to the results of this study, there are various examples of the success of outsourcing of public services [13,14,15,16,17,18,57]. Jensen and Stonecash [58] conducted a literature study on these various cases and pointed out that contract and efficiency are related. In this study, three types of contracts for the operation of public libraries in Korea were presented, and the effectiveness of these was analyzed. It is significant that through this, we discussed what type of contract is the most efficient alternative to public library services in Korea.
Third, further analysis was conducted for nonparametric verification, where the differences in efficiency by establishing entity and outsourcing were tested using the Mann–Whitney U test and Wilcoxon W test, and to derive the projection point of input variables. The results of the Mann–Whitney U test and Wilcoxon W test showed that outsourcing, as opposed to direct management, enables more efficient operations at public libraries. Meanwhile, the calculation of the projection points for each input variable provided information on the excess quantity of inputs that need to be reduced to achieve operational efficiency; and it was found that libraries established by pure public institutions are generally of larger area and size than those by quasi-public institutions, leading to inefficiency. Through these findings, a guideline on the optimum size for future public libraries to achieve the sustainable performance was suggested. An analysis of the most inefficient DMUs in each type additionally provided guidelines for the achieving efficiency in public library services.
The limitations of this study are as follows. First, this paper primarily deals with public libraries operating within Korea. Therefore, these findings may not be applicable to all countries. Previous studies have pointed out that major causes for inefficiency at public libraries can differ by country [29,44], which suggests that future research will benefit from expanding DMUs to include public libraries in multiple countries. It is possible to find an appropriate contract type by examining the contract types of libraries in each country, analyzing the efficiency, and comparing them.
Second, in the analysis using DEA, it is necessary to have homogeneity between DMUs. Thus, public libraries examined in this study were limited to those established by the government and providing public services to adults. For this reason, privately established libraries for the public or children’s libraries with specific target users were excluded from the analysis. We hope to further expand this research in the future by incorporating more diverse types of public libraries as DMUs.
Lastly, although the findings of this study show that public libraries providing pure public services are most inefficient, it must be noted that the nature of public services need to prioritize public interest over profit or efficiency. Outsourcing public services can make it difficult to provide sustainable services with high quality and low cost [54], and may have a negative impact on the employment conditions of workers [56]. Therefore, it is necessary to make strategic and operational decision-making on outsourcing of public services, taking into account the wider impact of outsourcing [59]. Therefore, whether certain variables should be weighted to reflect the nature of public services should be considered in future studies.

6. Conclusions

For the sustainable performance of public library services, public libraries need to utilize internal resources efficiently. Accordingly, many public libraries are making efforts to improve the efficiency. However, since public services have non-rivalry and non-excludability as their nature, it is difficult to increase efficiency to the level of private services, and outsourcing that operation is consigned to private institutions is considered a representative way to improve efficiency. Although some previous studies have discussed the relationship between outsourcing and efficiency, these studies have presented somewhat contradictory conclusions [12,13,14,15,16,17,18]. Therefore, the objectives of this study are to analyze the efficiency of public library services based on the establishing entity and outsourcing.
Public library services are classified into Type 1, Type 2, and Type 3 according to the establishing entity such as the central government or local governments, and the method of operation such as direct management or outsourcing. The results regarding the research questions of this study are summarized as follows. First, public libraries established by local governments (Types 2 and 3) are more efficient than those established by the central government (Type 1) in terms of the establishing entity. Second, public libraries outsourcing operations to private institutions (Type 3) are more efficient than those directly managed by the government (Types 1 and 2) in terms of the method of operation. Third, depending on the type of public libraries, the drivers that improve efficiency were shown to be different. Specifically, in the case of Type 1, the library area, and in the case of Types 2 and 3, the number of periodicals should be reduced. This study contributes to the literature on efficiency of public services in that it examined the establishing entity that previous studies did not pay much attention to. In addition, this study provides very meaningful results for strategic and operational decision-making regarding outsourcing in that it has dealt with controversial issues on the relationship between outsourcing and efficiency. Finally, specific guidelines on what inputs public libraries should reduce to improve efficiency are presented. Through this, this study is expected to contribute to achieving the sustainability of public services.

Author Contributions

Conceptualization and data collection, C.K.; literature review, H.K.; methodology, C.K. and K.C.; writing―original draft preparation, C.K. and H.K.; writing―review and editing, C.K., H.K., and K.C. All authors have read and agreed to the submitted version of the manuscript.

Funding

This research was financially supported by Hansung University.

Conflicts of Interest

The authors declare no conflict of interest.

Appendix A

The main analysis method used in this study, the input-oriented DEA model, looks at the inefficiency occurring due to excess use of inputs by the DMU to produce its outputs. In the figure below, the curve kk’ represents a firm that produces output X(q) efficiently, thus is the isoquant of the various combination of product factors, while curve ww’ is the iso-cost curve under the given input factors. By comparing DMUs D and C who utilize the input factors most efficiently based on cost minimization, it is possible to find out the inefficiency of input factors. OC, the line connecting O and C, show the input rate of DMU C, and here, inefficiency occurs when DMU C uses more input factors than what is necessary in order to produce the same outputs as DMU B.
Figure A1. Input-oriented DEA model.
Sustainability 12 09205 g0a1
If DMU C moves closer to point B along line OC in the figure, it is possible to maintain the initial output level while maintaining the level of inputs. That is, DMU B can reduce the rate of input factors used by C by the amount of BC in order to produce the same output, where the distance between BC represents DMU C’s technical inefficiency. DMU C’s technical efficiency can be expressed by OB/OC, and technical inefficiency as BC/OC. Thus, technical efficiency is expressed in a value between 0 and 1, where DMUs such as DMU B which are on the isoquant curve have a technical efficiency of 1, which becomes closer to 0 when the amount of input per output unit increases.

References

  1. Brewer, G.A.; Selden, S.C. Why elephants gallop: Assessing and predicting organizational performance in federal agencies. J. Publ. Adm. Res. Theory 2000, 10, 685–712. [Google Scholar] [CrossRef] [Green Version]
  2. Ferlie, E.; Hartley, J.; Martin, S. Changing public service organizations: Current perspectives and future prospects. Br. J. Manag. 2003, 14, S1–S14. [Google Scholar] [CrossRef]
  3. Kok, R.A.; Driessen, P.H. Antecedents of market orientation in semi-public service organizations: A study of Dutch housing associations. Serv. Ind. J. 2012, 32, 1901–1921. [Google Scholar] [CrossRef] [Green Version]
  4. Sanchez Solino, A. Sustainability of public services: Is outsourcing the answer? Sustainability 2019, 11, 7231. [Google Scholar] [CrossRef] [Green Version]
  5. Sauer, J.; Frohberg, K. Allocative efficiency of rural water supply–a globally flexible SGM cost frontier. J. Prod. Anal. 2007, 27, 31–40. [Google Scholar] [CrossRef]
  6. Bureaucracy, S.L. Dilemmas of the Individual in Public Services; Russell Sage Foundation: New York, NY, USA, 1980. [Google Scholar]
  7. Jones, B.D.; Baumgartner, F.R. The Politics of Attention: How Government Prioritizes Problems; University of Chicago Press: Chicago, IL, USA, 2005. [Google Scholar]
  8. Nishino, N.; Ueda, K.; Sato, Y. Modeling of decision making in membership services as public goods problems. CIRP Ann. 2010, 59, 473–476. [Google Scholar] [CrossRef]
  9. Tu, Y.; Wei, F. The impact of non-excludability on supply modes of infrastructure software. Adv. Inf. Sci. Serv. Sci. 2013, 5, 121. [Google Scholar]
  10. Varadarajan, R. Toward sustainability: Public policy, global social innovations for base-of-the-pyramid markets, and demarketing for a better world. J. Int. Mark. 2014, 22, 1–20. [Google Scholar] [CrossRef]
  11. Halaskova, M.; Gavurova, B.; Kocisova, K. Research and development efficiency in public and private sectors: An empirical analysis of EU countries by using DEA methodology. Sustainability 2020, 12, 7050. [Google Scholar] [CrossRef]
  12. DeLeon, L.; Denhardt, R.B. The political theory of reinvention. Public Adm. Rev. 2000, 60, 89–97. [Google Scholar] [CrossRef]
  13. Alonso, J.M.; Clifton, J.; Díaz-Fuentes, D. Did new public management matter? An empirical analysis of the outsourcing and decentralization effects on public sector size. Public Manag. Rev. 2015, 17, 643–660. [Google Scholar] [CrossRef] [Green Version]
  14. Grimshaw, D.; Vincent, S.; Willmott, H. Going privately: Partnership and outsourcing in UK public services. Public Adm. 2002, 80, 475–502. [Google Scholar] [CrossRef]
  15. Johnston, J.M.; Girth, A.M. Government contracts and “managing the market” exploring the costs of strategic management responses to weak vendor competition. Adm. Soc. 2012, 44, 3–29. [Google Scholar] [CrossRef]
  16. Lamothe, S.; Lamothe, M.; Feiock, R.C. Examining local government service delivery arrangements over time. Urban Aff. Rev. 2008, 44, 27–56. [Google Scholar] [CrossRef]
  17. Ball, D.; Earl, C. Outsourcing and externalisation: Current practice in UK libraries, museums and archives. J. Librariansh. Inf. Sci. 2002, 34, 197–206. [Google Scholar] [CrossRef] [Green Version]
  18. Girth, A.M.; Hefetz, A.; Johnston, J.M.; Warner, M.E. Outsourcing public service delivery: Management responses in noncompetitive markets. Public Adm. Rev. 2012, 72, 887–900. [Google Scholar] [CrossRef]
  19. Hemmeter, J.A. Estimating public library efficiency using stochastic frontiers. Public Financ. Rev. 2006, 34, 328–348. [Google Scholar] [CrossRef]
  20. Lee, C.C.; Lin, T.T.; Cheng, P.C. The determinants of the transportation outsourcing strategy for the express delivery company. Serv. Bus. 2013, 7, 207–225. [Google Scholar] [CrossRef]
  21. Sia, S.K.; Koh, C.; Tan, C.X. Strategic maneuvers for outsourcing flexibility: An empirical assessment. Decis. Sci. 2008, 39, 407–443. [Google Scholar] [CrossRef]
  22. Reynaers, A.M. Public values in public–private partnerships. Public Adm. Rev. 2014, 74, 41–50. [Google Scholar] [CrossRef]
  23. De Witte, K.; Geys, B. Evaluating efficient public good provision: Theory and evidence from a generalised conditional efficiency model for public libraries. J. Urban Econ. 2011, 69, 319–327. [Google Scholar] [CrossRef] [Green Version]
  24. Afonso, A.; Aubyn, M.S. Non-parametric approaches to education and health efficiency in OECD countries. J. Appl. Econ. 2005, 8, 227–246. [Google Scholar] [CrossRef] [Green Version]
  25. Li, P.; Yang, Z. Performance evaluation of the public libraries in USA using data envelopment analysis. Int. J. Appl. Sci. Tech. 2014, 4, 10–18. [Google Scholar]
  26. Reichmann, G.; Sommersguter-Reichmann, M. University library benchmarking: An international comparison using DEA. Int. J. Prod. Econ. 2006, 100, 131–147. [Google Scholar] [CrossRef]
  27. Cook, W.D.; Zhu, J. Modeling Performance Measurement: Applications and Implementation Issues in DEA; Springer Science & Business Media: New York, NY, USA, 2006. [Google Scholar]
  28. Masuda, K. Eco-efficiency assessment of intensive rice production in japan: Joint application of life cycle assessment and data envelopment analysis. Sustainability 2019, 11, 5368. [Google Scholar] [CrossRef] [Green Version]
  29. Reichmann, G.; Sommersguter-Reichmann, M. Efficiency measures and productivity indexes in the context of university library benchmarking. Appl. Econ. 2010, 42, 311–323. [Google Scholar] [CrossRef] [Green Version]
  30. Stroobants, J.; Bouckaert, G. Benchmarking local public libraries using non-parametric frontier methods: A case study of Flanders. Librariansh. Inform. Sci. Res. 2014, 36, 211–224. [Google Scholar] [CrossRef] [Green Version]
  31. Charnes, A.; Cooper, W.W.; Rhodes, E. Measuring the efficiency of decision making units. Eur. J. Oper. Res. 1978, 2, 429–444. [Google Scholar] [CrossRef]
  32. Palshikar, G.K.; Vin, H.M.; Saradhi, V.V.; Mudassar, M. Discovering experts, experienced persons and specialists for it infrastructure support. Serv. Sci. 2011, 3, 1–21. [Google Scholar] [CrossRef] [Green Version]
  33. Badinelli, R. A stochastic model of resource allocation for service systems. Serv. Sci. 2010, 2, 76–91. [Google Scholar] [CrossRef]
  34. Choi, K.; Lee, D.; Olson, D.L. Service quality and productivity in the US airline industry: A service quality-adjusted DEA model. Serv. Bus. 2015, 9, 137–160. [Google Scholar] [CrossRef]
  35. Momparler, A.; Lassala, C.; Ribeiro, D. Efficiency in banking services: A comparative analysis of Internet-primary and branching banks in the US. Serv. Bus. 2013, 7, 641–663. [Google Scholar] [CrossRef]
  36. Coelli, T.J.; Rao, D.S.P.; O’Donnell, C.J.; Battese, G.E. An Introduction to Efficiency and Productivity Analysis, 2nd ed.; Springer Science & Business Media: New York, NY, USA, 2005. [Google Scholar]
  37. Jacobs, R.; Smith, P.C.; Street, A. Measuring Efficiency in Health Care: Analytic Techniques and Health Policy; Cambridge University Press: Cambridge, UK, 2006. [Google Scholar]
  38. Banker, R.D.; Charnes, A.; Cooper, W.W. Some models for estimating technical and scale inefficiencies in data envelopment analysis. Manag. Sci. 1984, 30, 1078–1092. [Google Scholar] [CrossRef] [Green Version]
  39. Chen, T.Y. A measurement of the resource utilization efficiency of university libraries. Int. J. Prod. Econ. 1997, 53, 71–80. [Google Scholar] [CrossRef]
  40. Vitaliano, D.F. Assessing public library efficiency using data envelopment analysis. Ann. Public Coop. Econ. 1998, 69, 107–122. [Google Scholar] [CrossRef]
  41. Sharma, K.R.; Leung, P.; Zane, L. Performance measurement of Hawaii state public libraries: An application of Data Envelopment Analysis (DEA). Agric. Resour. Econ. Rev. 1999, 28, 190–198. [Google Scholar] [CrossRef] [Green Version]
  42. Worthington, A. Performance indicators and efficiency measurement in public libraries. Aust. Econ. Rev. 1999, 32, 31–42. [Google Scholar] [CrossRef] [Green Version]
  43. Hammond, C.J. Efficiency in the provision of public services: A data envelopment analysis of UK public library systems. Appl. Econ. 2002, 34, 649–657. [Google Scholar] [CrossRef]
  44. Miidla, P.; Kikas, K. The efficiency of Estonian central public libraries. Perform. Meas. Metrics 2009, 10, 49–58. [Google Scholar] [CrossRef]
  45. Lewin, A.Y.; Morey, R.C.; Cook, T.J. Evaluating the administrative efficiency of courts. Omega 1982, 10, 401–411. [Google Scholar] [CrossRef]
  46. Simar, L.; Wilson, P.W. Sensitivity analysis of efficiency scores: How to bootstrap in nonparametric frontier models. Manag. Sci. 1998, 44, 49–61. [Google Scholar] [CrossRef] [Green Version]
  47. Kim, C.; Kim, S.W. A mathematical approach to supply complexity management efficiency evaluation for supply chain. Math. Probl. Eng. 2015, 2015, 865970. [Google Scholar] [CrossRef] [Green Version]
  48. Hall, P. On the number of bootstrap simulations required to construct a confidence interval. Ann. Stat. 1986, 14, 1453–1462. [Google Scholar] [CrossRef]
  49. Case, K.E. Musgrave’s vision of the public sector: The complex relationship between individual, society and state in public good theory. J. Econ. Financ. 2008, 32, 348–355. [Google Scholar] [CrossRef]
  50. Vo, D.H. The economics of fiscal decentralization. J. Econ. Surv. 2010, 24, 657–679. [Google Scholar] [CrossRef]
  51. Ghulam, Y.; Jaffry, S. Efficiency and productivity of the cement industry: Pakistani experience of deregulation and privatisation. Omega 2015, 54, 101–115. [Google Scholar] [CrossRef] [Green Version]
  52. Jensen, P.H.; Stonecash, R.E. Incentives and the efficiency of public sector-outsourcing contracts. J. Econ. Surv. 2005, 19, 767–787. [Google Scholar] [CrossRef]
  53. Pollitt, C.; Bouckaert, G. Public Management Reform: A Comparative Analysis; Oxford University Press: New York, NY, USA, 2000. [Google Scholar]
  54. Krugman, P. Thanks for the M.R.E.s. New York Times, 12 August 2003; Section A. p. 17. [Google Scholar]
  55. Hart, O.; Shleifer, A.; Vishny, R.W. The proper scope of government: Theory and an application to prisons. Q. J. Econ. 1997, 112, 1127–1161. [Google Scholar] [CrossRef] [Green Version]
  56. Quiggin, J. Contracting out: Promise and performance. Econ. Labour Relat. Rev. 2002, 13, 88–104. [Google Scholar] [CrossRef] [Green Version]
  57. Savas, E.S. Privatization and Public-Private Partnerships; Chatham House Press: New Jersey, NJ, USA, 2000. [Google Scholar]
  58. Jensen, P.H.; Stonecash, R.E. The Efficiency of Public Sector Outsourcing Contracts: A Literature Review; Melbourne Institute of Applied Economic and Social Research, The University of Melbourne: Melbourne, Australia, 2004. [Google Scholar]
  59. Harland, C.; Knight, L.; Lamming, R.; Walker, H. Outsourcing: Assessing the risks and benefits for organizations, sectors and nations. Int. J. Oper. Prod. Manag. 2005, 25, 831–850. [Google Scholar] [CrossRef]
Figure 1. Result of bootstrap DEA.
Sustainability 12 09205 g001
Table 1. Categorization of public libraries in Korea.
Number of LibrariesEstablishing EntityMethod of Operation
Type 1232Office of EducationDirect management
Type 2452Local governmentDirect management
Type 3163Local governmentOutsourced to private institutions
Table 2. Input and output variables in previous literature on library service efficiency.
ResearcherSampleMethodInputOutput
Reference [23]290 local public librariesDEA
& FDH
Personnel expenditures,
Operating expenditures,
Infrastructure
Opening hours per week,
Youth books,
Fiction and non-fiction books,
Media
Reference [26]68 university librariesDEANumber of employees,
Total number of book materials
Number of book materials added,
Total circulation,
Number of serial subscriptions
Reference [39]23 university and college librariesDEALibrary staff,
Book acquisition expenditure,
Book collection,
Area of library space,
Seating capacity
Reader visits,
Book circulation,
Reference and on-line
research,
Annual service hours,
Reader satisfaction,
Inter-lending service
Reference [40]184 public librariesDEATotal holdings of all items
(books, audio-visual, maps, etc.),
Total hours of operation per week,
New books purchased,
Total serial subscriptions currently active
Annual total circulation of all library materials,
Number of reference questions answered
Reference [41]47 public librariesDEABook collection,
Library staff,
Days open,
Operating expenses
Book circulation,
Reader visits,
Reference transaction
Reference [42]168 local public librariesDEAGross library expenditureNumber of library issues
Reference [43]99 public library systemsDEATotal opening hours per week,
Number of books and audio-visual material,
Acquisitions of new material,
Number of serial subscriptions
Total number of items used to borrowers over the year,
Number of enquiries processed,
Number of requests processed
Reference [44]20 central public librariesDEAYearly acquisition expenditures,
Yearly salary expenditures,
Collection size,
Floor area
Number of readers,
Number of loans
Table 3. Correlations analysis (input variables).
InputX1 (NE)X2 (MB)X3 (LA)X4 (NB)X5 (BH)X6 (NP)
X1 (NE)1
X2 (MB)0.335 **1
X3 (LA)−0.0030.150 **1
X4 (NB)0.356 **0.702 **0.088 **1
X5 (BH)0.114 **0.258 **0.088 **0.241 **1
X6 (NP)0.278 **0.196 **0.0080.259 **0.0511
Note: ** p < 0.01; NE: Number of Employees, MB: Material Budget, LA: Library Area, NB: Number of Books; BH: Business Hours, NP: Number of Periodicals.
Table 4. Correlations analysis (output variables).
OutputY1 (NBB)Y2 (NU)Y3 (NRSU)
Y1 (NBB)1
Y2 (NU)0.847 **1
Y3 (NRSU)0.340 **0.324 **1
Note: ** p < 0.01; NBB: Number of Books Borrowed, NU: Number of Users, NRSU: Number of Reference Service Users.
Table 5. Selection of input and output variables.
CategoryVariableRelated Studies
InputNumber of employees (NE)References [29,39,41]
Library area (LA)References [23,39,44]
Number of books (NB)References [29,39,40,41,43,44]
Business hours (BH)References [40,41,43]
Number of periodicals (NP)References [40,43]
OutputNumber of users (NU)References [39,41,44]
Number of reference service users (NRSU)References [39,40,41]
Table 6. Data collection standards.
FactorsStandardsUnits
X1 (NE)Regular workers, non-regular workers and administrative staffPerson/year
X3 (LA)Required site aream2
X4 (NB)Domestic and foreign booksBooks
X5 (BH)Business hours per weekHours/week
X6 (NP)Domestic and foreign periodicalsBooks
Y2 (NU)Users of public library servicesPerson/year
Y3 (NRSU)Users of reference servicePerson/year
Table 7. Descriptive statistics of input and output data.
Input DataOutput Data
X1 (NE)X3 (LA)X4 (NB)X5 (BH)X6 (NP)Y2 (NU)Y3 (NRSU)
Average324687297,07571170563,172266,254
Median37266171,4967065335,480263,283
St. dev.80033,44383,47317597648,150166,050
Max11,610946,887735,82613713,9154,532,304668,415
Min21075535410234010,524
Table 8. Efficiency score (VRS).
TypePTE > SEPTE < SEPTE = SETotal
Scale InefficiencyPure Technical
Inefficiency
Efficiency
Type 1143 (61.64%)81 (34.91%)8 (3.45%)232 (100%)
Type 2188 (41.59%)217 (48.01%)47 (10.40%)452 (100%)
Type 347 (28.83%)72 (44.17%)44 (27.00%)163 (100%)
Note: PTE: Pure Technical Efficiency, SE: Scale Efficiency
Table 9. Excess quantity of input and projection point.
X1 (NE)X3 (LA)X4 (NB)X5 (BH)X6 (NP)
Type 1Average4975327133,87671307
Projection286213557,77148146
Plan−43%−60%−57%−32%−53%
Type 2Average201889993,97373121
Projection122446652,0235249
Plan−40%−50%−45%−28%−59%
Type 3Average446411659,87871128
Projection266195942,7775755
Plan−40%−52%−29%−20%−57%
Publisher’s Note: MDPI stays neutral with regard to jurisdictional claims in published maps and institutional affiliations.

