1. Introduction
Safety, closely followed by economic and environmental benefits, are the most common positive effects associated with the arrival of automated vehicles (AVs). This is somewhat expected as AVs, especially those with higher levels of automation, are expected to increase safety by reducing the human role in driving, which has been reported to contribute to over 90 percent of all road traffic accidents [
1,
2,
3]. In this paper, we adopt the SAE International, previously known as Society of Automotive Engineers (SAE), levels of driving automation [
4]. The SAE is arguably the most well-known and broadly used taxonomy in the field of automated driving research [
5], despite the existence of diverse views in the literature [
6]. SAE provides six levels of vehicle automation according to the technological capabilities and human involvement in the driving tasks, from complete driver control over the vehicle (level 0) to fully automated vehicle, where no manual interaction is needed (level 5), also known as fully automated and/or autonomous (hereafter will be called AVs), and the connected vehicles are further expected to contribute to route optimization, time savings, improved fuel economy, reduced traffic jams, lower costs and increased productivity due to the role change from driver to passenger [
5,
7,
8,
9]. Thus, it is eventually anticipated that AVs can be associated with broader sustainability objectives such as the UN Sustainable Developments Goal 11: Sustainable Cities and Communities, given their potential benefits [
10].
However, despite all of the foreseen benefits of AVs, numerous surveys have offered contradictory findings regarding their acceptance among the general population [
11,
12,
13,
14]. Aimed at shedding some light on the diverse findings, this study explores the users’ anticipation of AV safety and their overall perspective on AVs. For instance, Rödel et al. [
12] pointed out that when referring to acceptance of AVs, the majority of research to date does not specify the level of automation, as defined by SAE [
4]. Instead, research focuses on the general term of vehicle automation, which may result in confusion and uncertainty regarding problem framing. Indeed, the lack of specification of the level of automation has induced neglect of the transition phase from conventional vehicles (introduced in the 20th century) to automated vehicles anticipated to be widely used in the 21st century, which clearly is unrealistic given the extended period required for such a transition. Whilst studies report that travelers (i.e., potential AV users in the future) globally have an overall positive attitude towards AVs [
13], it was also shown that their user experience (UX) and user acceptance (UA) change in relation to each level of automation, with most positive results related to lower automation levels which drivers are already familiar with [
12].Hence, this article takes the debate among academics and practitioners on the deployment of AVs to the next level and highlights the illusion of solely stressing potential safety impacts. This article provides an evidence-based response to the proposition of widely deploying AVs even if they offer lower levels of safety [
15]. Consequently, the potential benefits which may be introduced by AVs, including safety, have not yet convinced a large proportion of the general public—i.e., potential future AV users—to overcome their reservations towards fully automated vehicles, clearly indicating that there are other factors to be identified and addressed aside from technological advancements [
11,
14,
15,
16]. Among others, legal liabilities, data management, reduced comfort, relinquishment of control of the vehicle, increased cost, as well as familiarization and management with such advanced automated systems, have been reported in the literature [
13,
16,
17,
18,
19].
The increased interest in the different facets of automated driving technology has led to several initiatives worldwide. Among other actions, the WISE-ACT COST Action [
20] was funded by the H2020 Framework program. WISE-ACT aims at investigating the wider impacts of Autonomous and Connected Transport, focusing on SAE Level 5 of automated driving vehicles, and describing the best practice on how to evaluate them. To address its overarching aim, one of the main WISE-ACT objectives is to assess user acceptability and inform the general public and key stakeholders about the opportunities and risks of automated and connected transport (ACT).
Within the context of the WISE-ACT research objectives on tackling user acceptability, this study explores the factors that can impact public decision-making on using SAE Level 5 AVs, beyond safety concerns and trust in automation [
21]. This article accounts for the opinion of vulnerable road users (VRUs), mainly of the elderly and people with disabilities. VRUs are defined here as “non-motorised road users, such as pedestrians and cyclists as well as motor-cyclists and persons with disabilities or reduced mobility and orientation” [
22]. These potential AVs users may be among those benefitting the most from the widespread AV deployment [
23]; yet, the elderly, people with disabilities and parents with young children belong to the most vulnerable social groups in terms of new technology acceptance given the interdependency of transport provision within households [
24,
25].
The remainder of this article is structured in the following way.
Section 2 reviews related work and research to pinpoint the most important findings regarding the factors influencing vulnerable road users or their carers’ willingness of, or reluctance to, use AVs.
Section 3 presents the method, while
Section 4 present and discuss the findings of the international WISE-ACT 2020 AV survey of the general public about the topic in focus, aimed at determining correlations of particular points of view with different socio-demographic characteristics, mainly focusing on parents and the elderly. Finally,
Section 5 discusses relevant survey findings along with the contribution extent of each factor identified on the overall attitude of travellers towards AVs, shedding light on a range of important factors beyond safety to meet global sustainability goals.
2. Identified Opportunities and Risks of AVs for Vulnerable Road Users
AVs offer vast opportunities to improve transport and accessibility for a wide range of travellers [
26]. However, not all AV impacts are positive or foster sustainability given the reported AV impacts; lack of privacy and/or comfort [
27], for instance, are an ever-growing focus within decision-makers’ policy agenda globally. Driving equates to independence, very frequently social interaction, freedom of choice, leisure, status and often facilitates basic household needs in most of the countries across the globe. Subsequently, the hype surrounding AVs is certainly understandable [
28,
29]. The importance of these factors has further grown within the COVID-19 context, where social distancing and the increased demand for the delivery of goods increased significantly [
30,
31].
Nonetheless, significantly less attention has been given to date on travel independence of vulnerable road users (VRUs). AVs are undeniably posed as a panacea for such social groups [
32]. Children, the elderly, the visually-impaired and people with deteriorating and reduced cognitive, motoric and sensory skills are among those potential users who would benefit significantly from a self-driving and fully automated vehicle [
23,
25]. For example, parents, especially those living in suburban neighbourhoods, perceive AVs as a convenient transport alternative for their children to travel to and from school and their extracurricular activities [
33,
34,
35]. Nonetheless, a previous study [
36] found that only a small minority would allow their children to travel unaccompanied in an AV, which is in alignment with our findings shown in
Section 4.
Among the most important risks for parents considering AVs as a transport mode for their children are the lack of control, which they would otherwise have themselves while driving, such as checking whether a seatbelt is on, automatically locking the doors, being aware of everyone else inside or near the vehicle and being able to stop the vehicle if the child for some reason does request it [
33,
34]. To ease these concerns, parents would like AVs to offer constant audio and preferably video control features, vehicle location tracking and secure passenger identification at all times [
33], suggesting that although parents may have a positive attitude toward using AVs, their concerns are not related to the technology but rather the lack of control and supervision of the vehicle. Adding a large number of remote-control features to an AV is feasible from a technological perspective [
35], however it does raise questions regarding whether automated transport for children would still offer the initially anticipated benefits, if a parent or carer would need to be, even if only virtually, still constantly present and in control of each journey. A more feasible scenario, at least during the early transition stages, may be the age limit of AV travellers [
33]. Age limit could be aligned with the law for acceptable age for letting a child alone at home, which in some states in the US, for instance, has been defined to be the age of eight years old [
37].
Equally, travel needs of the elderly, whose deteriorating sensory, motoric and/or cognitive abilities can affect their driving skills and road safety, appear as another example featured in the AV literature [
38,
39]. Vision, hearing, muscular strength, speed of muscle contraction and flexibility decrease with aging, reducing an individual’s capability of safely operating and controlling a vehicle. However, advanced driver assistant systems (ADAS) can contribute to resolving a lot of these sensory-motoric issues [
38]. A more complex safety related problem however lays in the age-related changes in cognitive functions such as attention, memory, information processing and decision-making [
39], which are critical for safe driving and interaction with in-vehicle information systems [
40]. While a fully automated vehicle (SAE Level 5) will completely takeover the driving task, there would still be a need for human-computer interaction (HMI), where the elderly person using an AV may have to communicate with the selected vehicle and provide their journey details, such as destination, route including desired stops, speed, urgency or parking preferences. Given the fact that the primary need for use of an AV for this user group would largely be the deterioration of cognitive skills, it is questionable whether acquiring all the required skills to use and operate an AV would be a much simpler task in all situations without increasing their personal security or safety risks. For instance, elderly users of conventional taxis are able to communicate their needs at all times with the driver; it is still unclear, however, how such interaction will be ensured in AVs, as human machine interfaces or communication systems with an external operator/supervisor might not be perceived equivalent to speaking directly with a human operator who is physically present in the vehicle. A recent study on AV bus users in Stockholm showed that users felt much safer with an operator or steward on-board the AV bus in comparison to not [
41].
Another important factor intertwined with equity concerns [
42] is linked with the relatively high costs associated with the use of AVs, at least for the time being [
43]. To operate in a fully automated mode, AVs are equipped with a wide range of advanced sensors and processing algorithms, which significantly increase the cost of production compared to a conventional vehicle. Yet, evidence from early surveys worldwide revealed that, on average, respondents across the general public would not pay more for an automated vehicle than they would for a non-automated one. These results are displayed in
Table 1.
These studies have certain limitations, but still offer helpful preliminary findings highlighting the need for more context specific and better coordinated survey approaches about such a core issue. For instance, clear discrepancies are observed among the willingness of people living in different countries. In fact, residents of the Global North, with the exception of New Zealand, seem to be less inclined to pay more for an AV compared to the amount they would pay for a conventional vehicle [
43]. On the contrary, residents in countries of the Global South, which have higher number of accidents, are willing to pay more for an AV anticipating increased safety on public roads.
Another limitation of these studies is that they do not link their findings about willingness-to-pay for the use of AVs with disposable income, at least at the national level. Especially for the elderly, it is important to consider that they rely largely on diverse public and private pension schemes often providing disposable incomes below the national average. Hence, the affordability of using AVs, particularly by VRUs, is another key issue in addition to safety concerns. Cost was also reported as one the major concerns among parents, when asked about the most important attitudes of using AVs for their children’s travel compared to security and privacy, lack of independence and boredom [
34].
On the other hand, shared mobility solutions have been reported as an option to reduce the individual cost of AVs for the users. Yet, a study in Israel and North America found that even if AV use would be completely free, 25% of the population would still not use them [
17]. The elderly are overall more favourable to use shared mobility, as long as it can cover their needs [
45]. Nonetheless, the advanced digital skills needed for using AVs, e.g., via Mobility as a Service (MaaS) platforms, as well as the challenges posed by the COVID-19 pandemic globally, revealed a further pitfall of shared mobility [
46]. Given the risks of shared vehicles, services and infrastructure suddenly turned into a major disadvantage of such options (e.g., MaaS) due to the greater exposure to a potential infection, affecting the people’s positive attitudes towards automated and shared mobility systems [
46].
Consequently, this article shows that safety is not the only factor that may affect the acceptance and trust of the public towards using AVs. Instead and in line with contemporary academic literature [
43], our findings show that reliability, usefulness and affordability, as well as the presence of a supervisor in the vehicle or remotely can affect the public’s acceptance towards automated technology. This article provides valuable insights on the factors which influence key design and deployment issues of AVs policies besides safety, with a particular emphasis on vulnerable road users.
4. Results
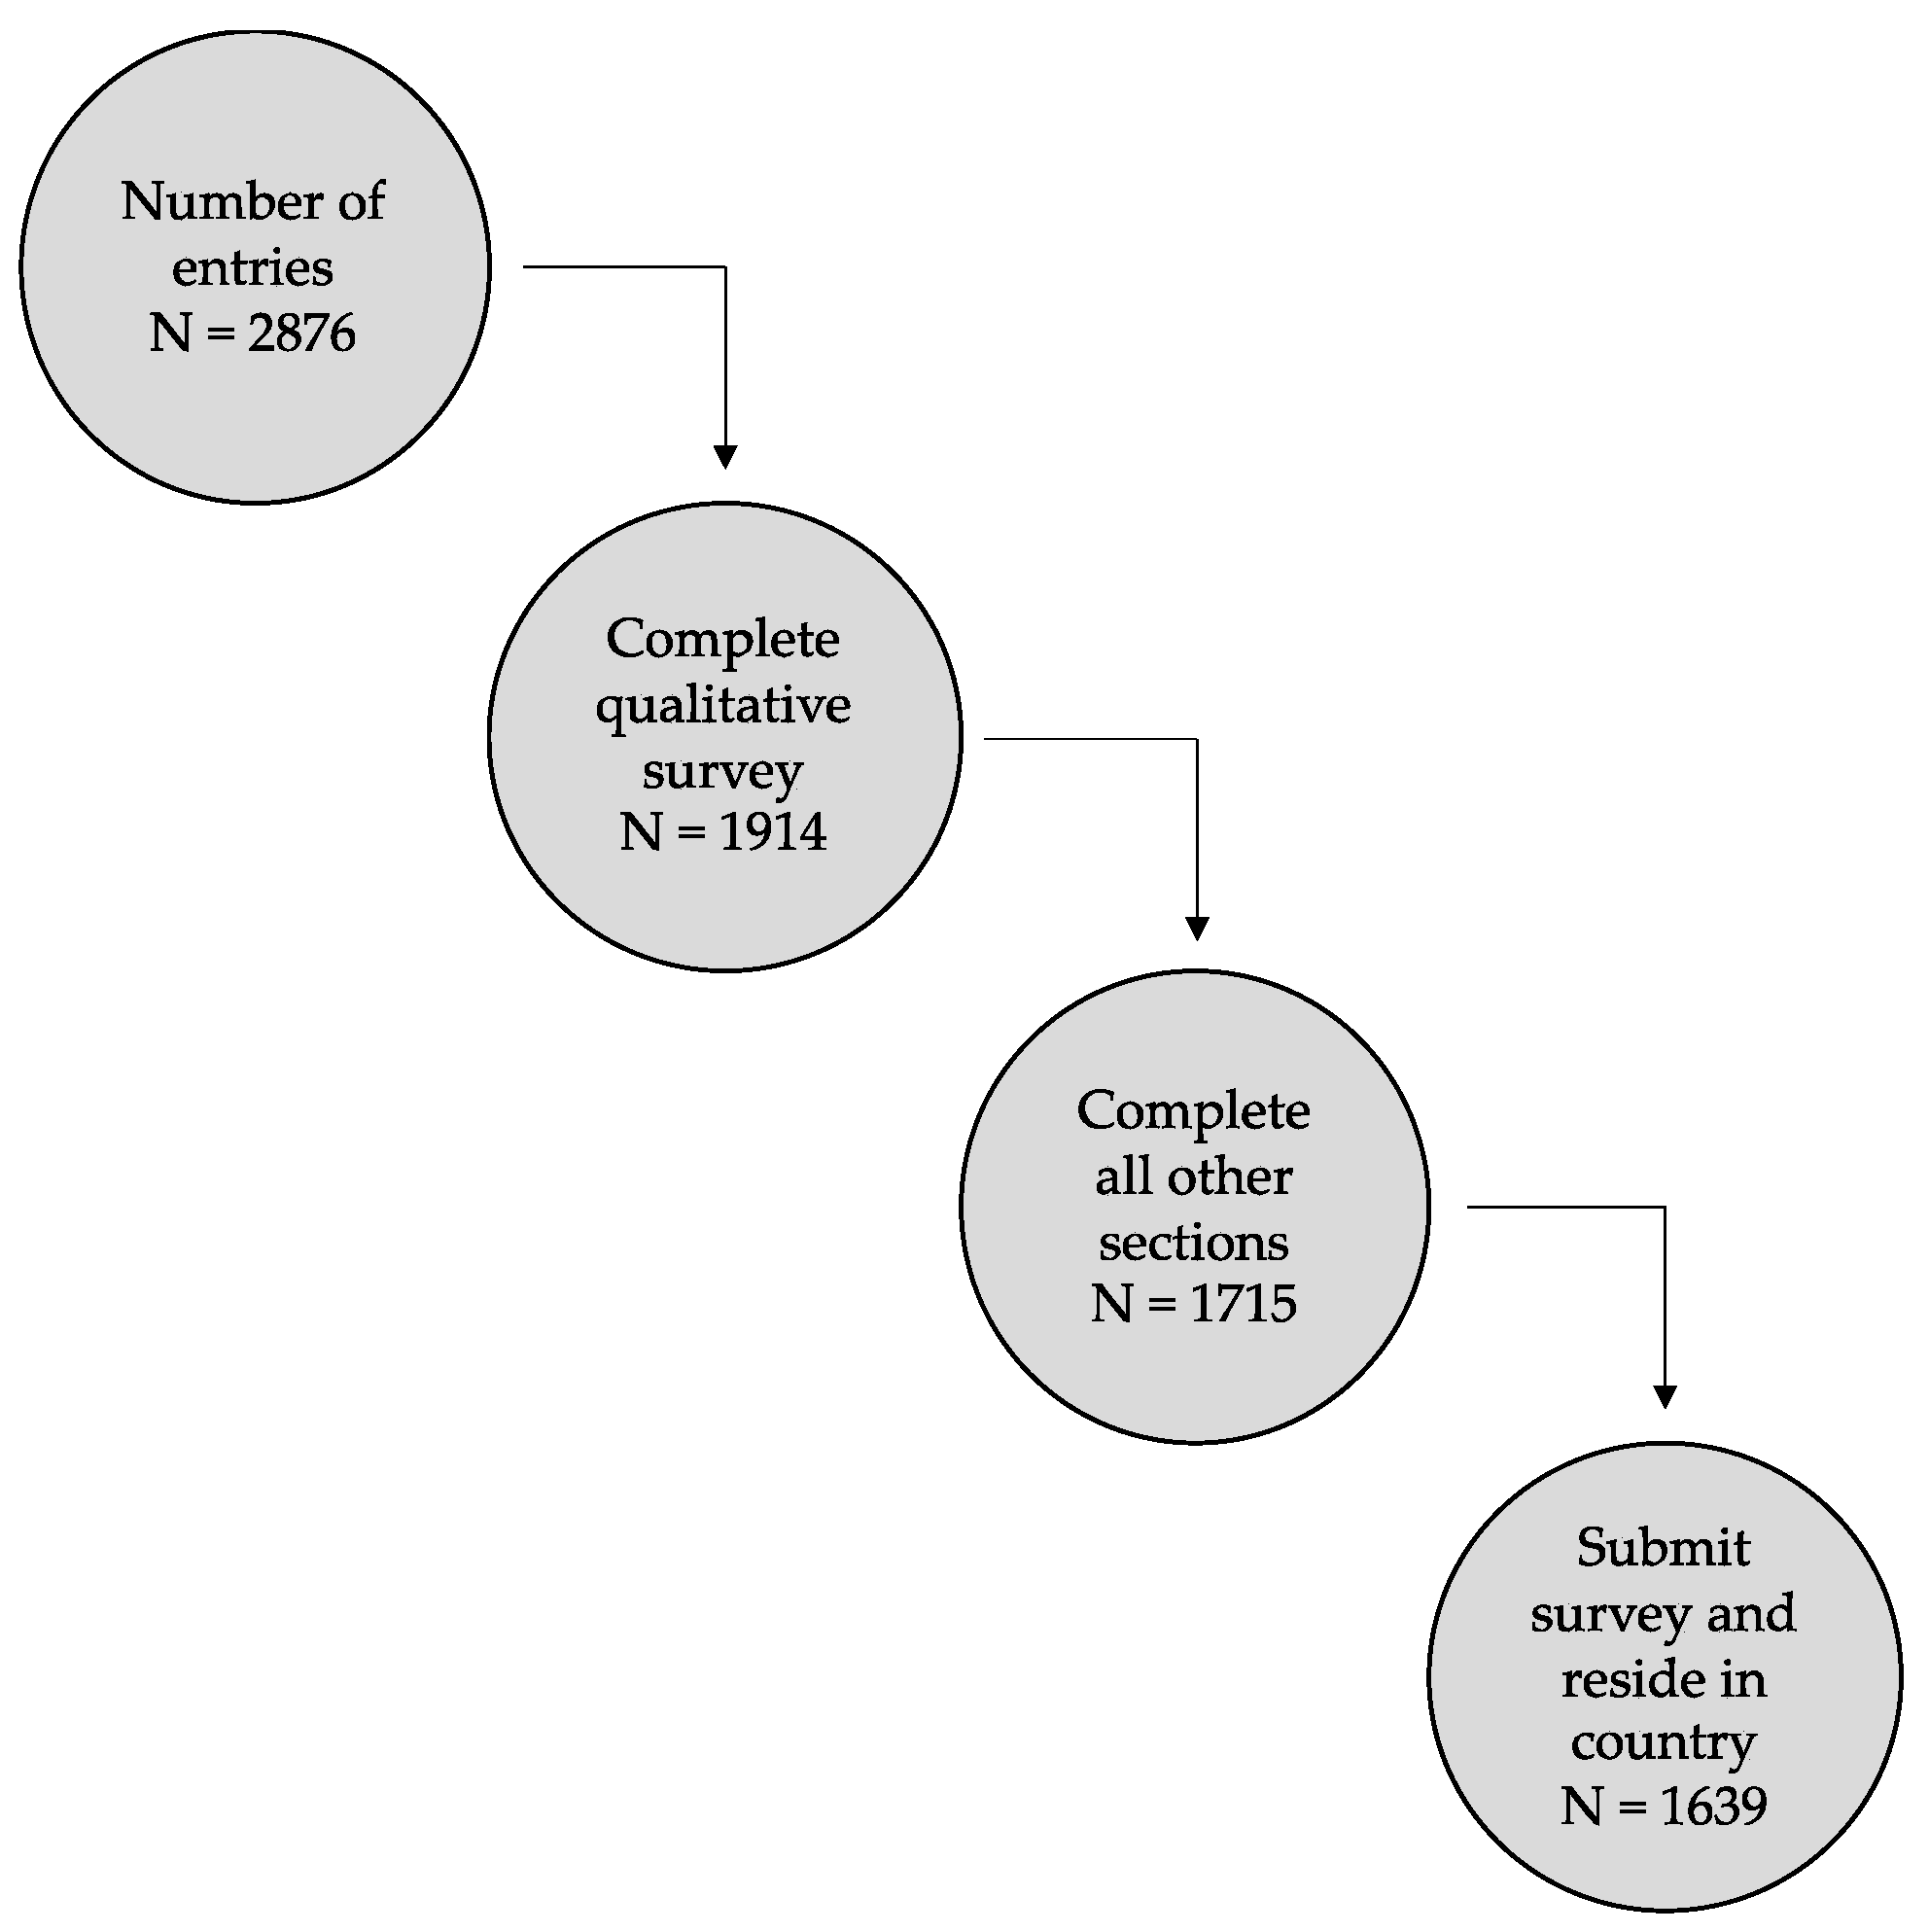
The sample of 1639 valid responses included a majority of male respondents, 68.7% (1126 men and 508 women, while 5 participants identify themselves otherwise); in
Table 4, the socio-economic characteristics of the sample together with level of reduced mobility are presented. Overall, the sample is quite balanced regarding age, despite an unavoidably higher representation of those within the 20–49 age groups and similarly regarding employees.
Section 4.1 reports the descriptive analysis of the questions on which this paper is focused, listed in
Table 2. Additional descriptive statistics on the survey’s questions are included in
Table A1,
Table A2,
Table A3 and
Table A4, in
Appendix A.
Section 4.2 reports the analysis of correlations among the variables to better understand how socio-economic characteristics of the sample matter as regards their potential use and perception of AVs. Finally,
Section 4.3 focuses on the attitudes of vulnerable road users towards AVs with special attention to elderly people (>65 years old), and people with disabilities.
4.1. Mobility Habits, AV Knowledge and Acceptance
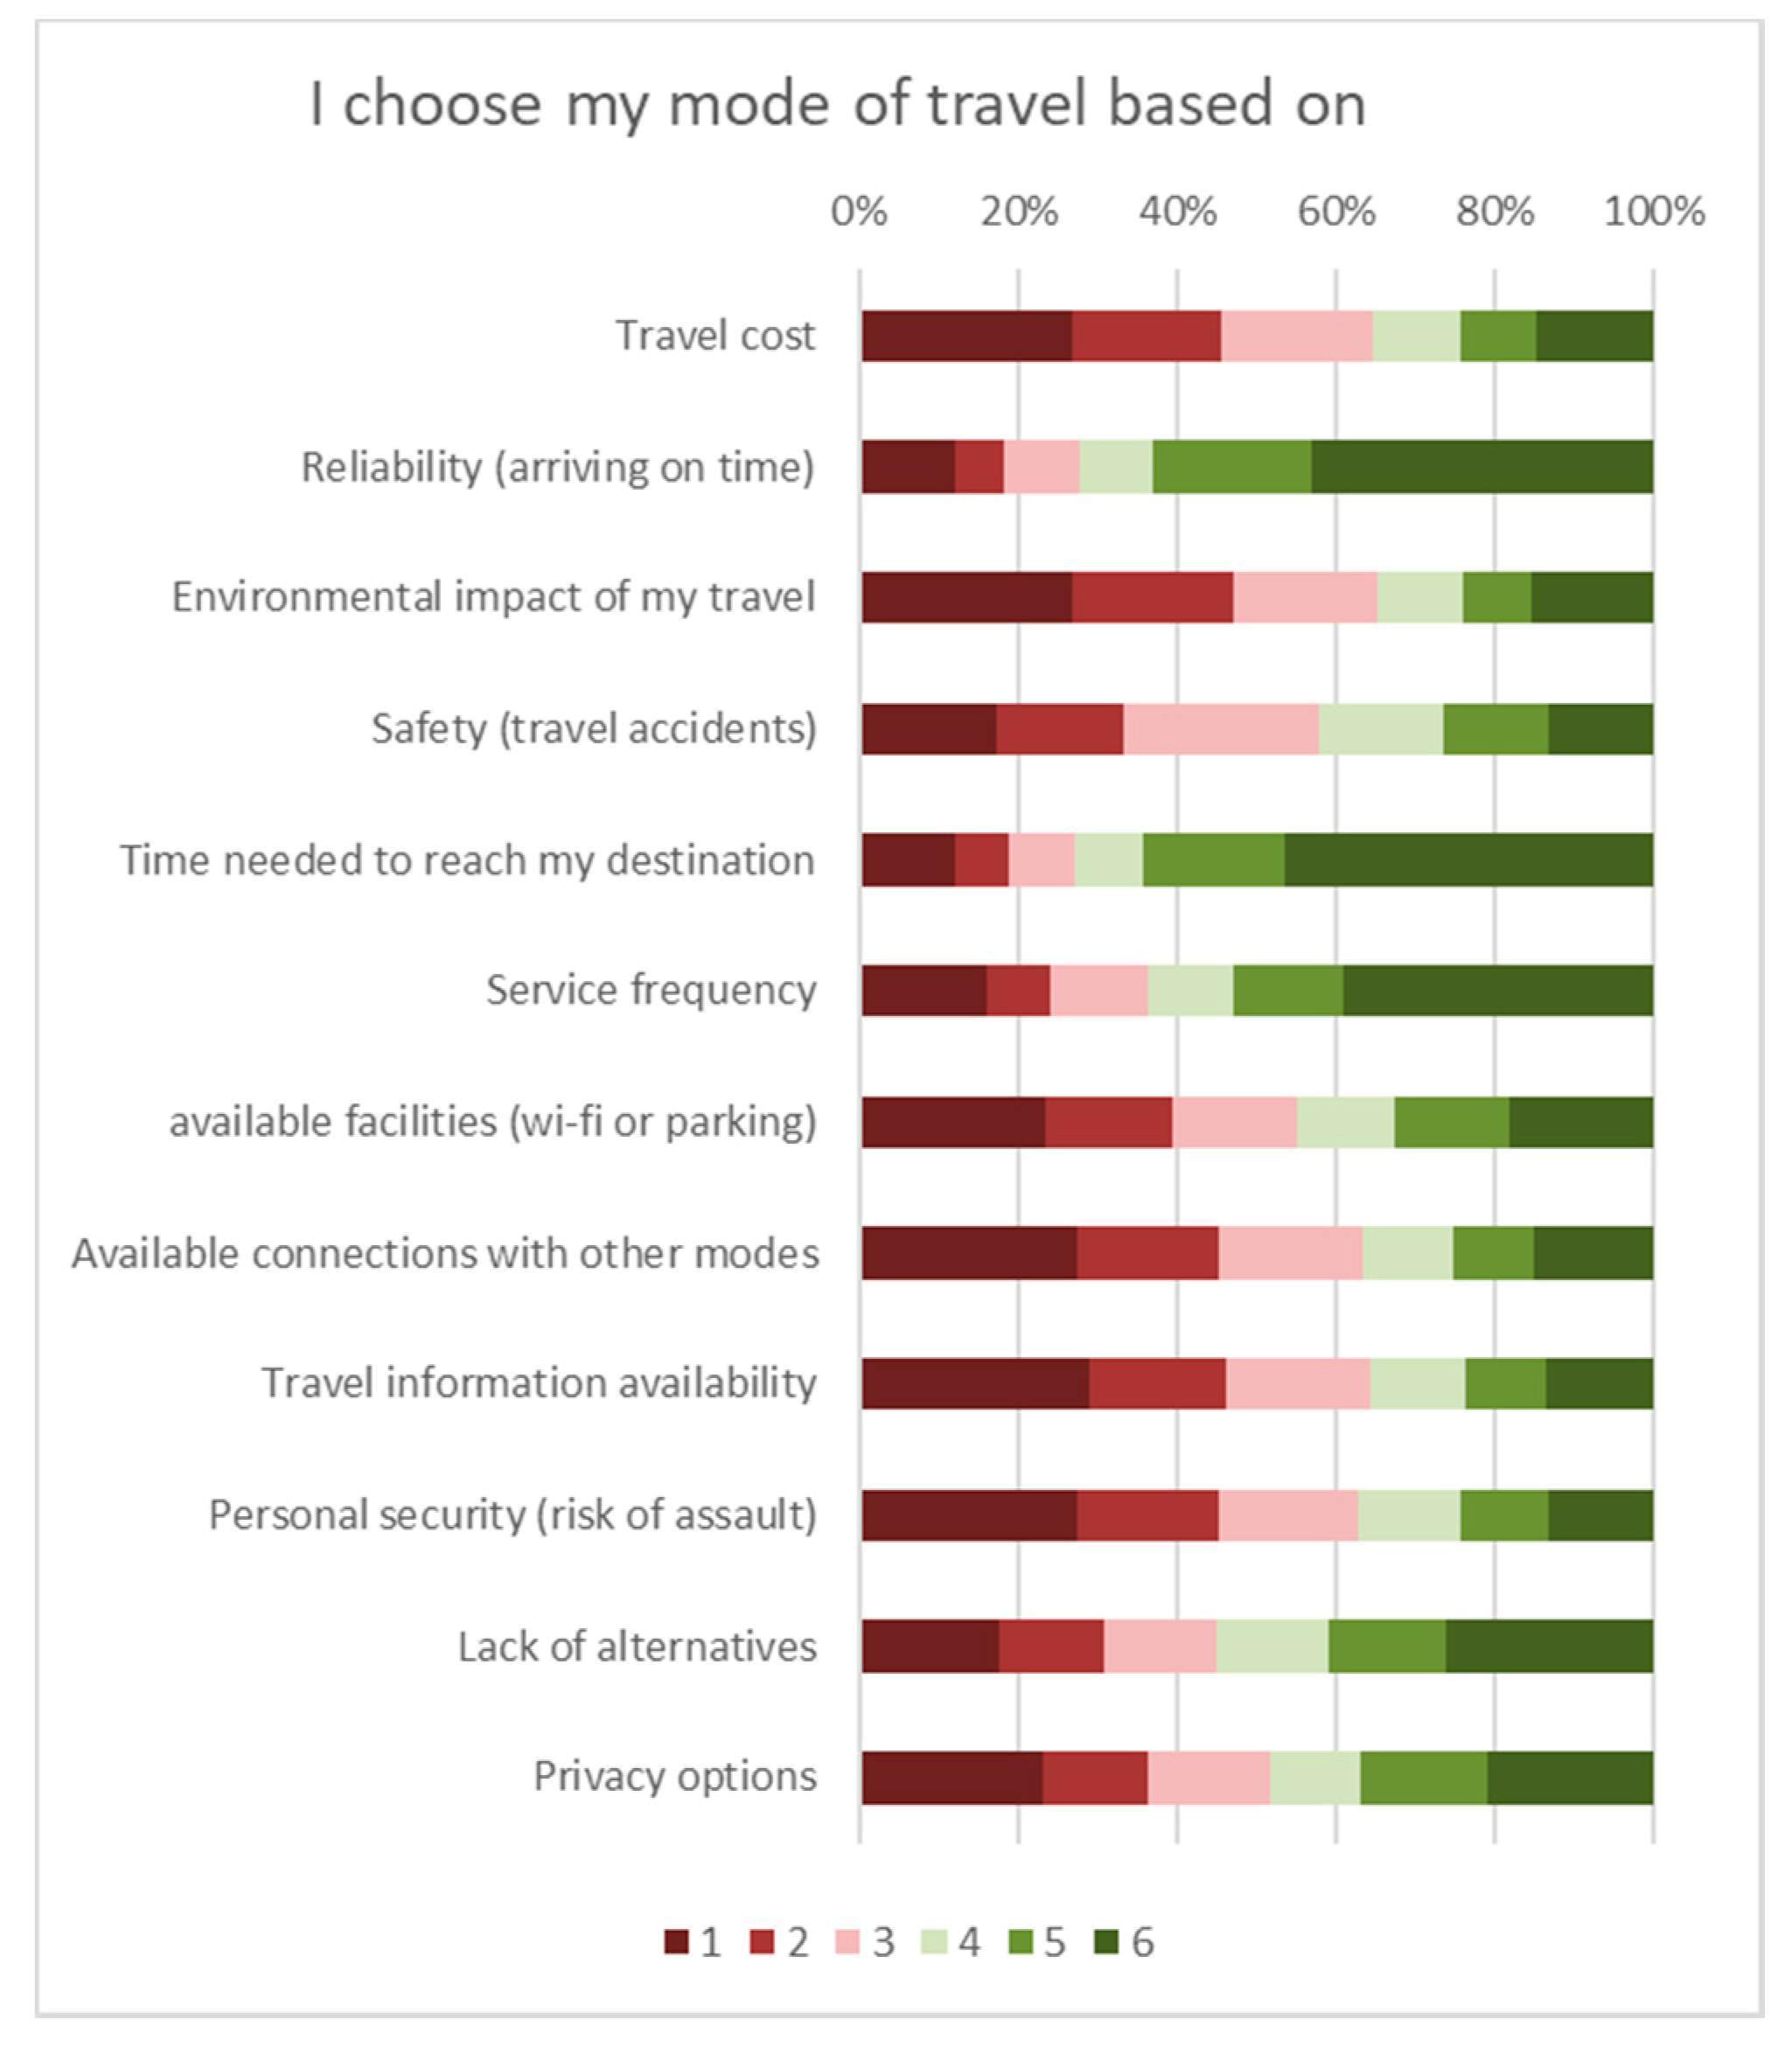
Concerning the mobility habits of our sample, the majority of participants (58%) indicated that their most important daily journey is to go to work, while 68% indicated that they use a private car for this journey. Respondents, as shown in
Figure 2, highlighted that the travel time to reach their destination is the most important factor for them when choosing their transport mode (M = 4.46, on a scale from 1 = Strongly Disagree to 6 = Strongly Agree), followed by the reliability of the transport mean (M = 4.42, on the same scale).
76% of the survey respondents claimed to have heard, read or seen information about AVs in the last 12 months, which is a sharp increase compared to the findings (52.2%) presented in Kyriakidis et al. [
11]. This increase justified the need to revisit relevant issues in 2020, hence building up on the hype surrounding AVs and the technological advancements in the preceding five years.
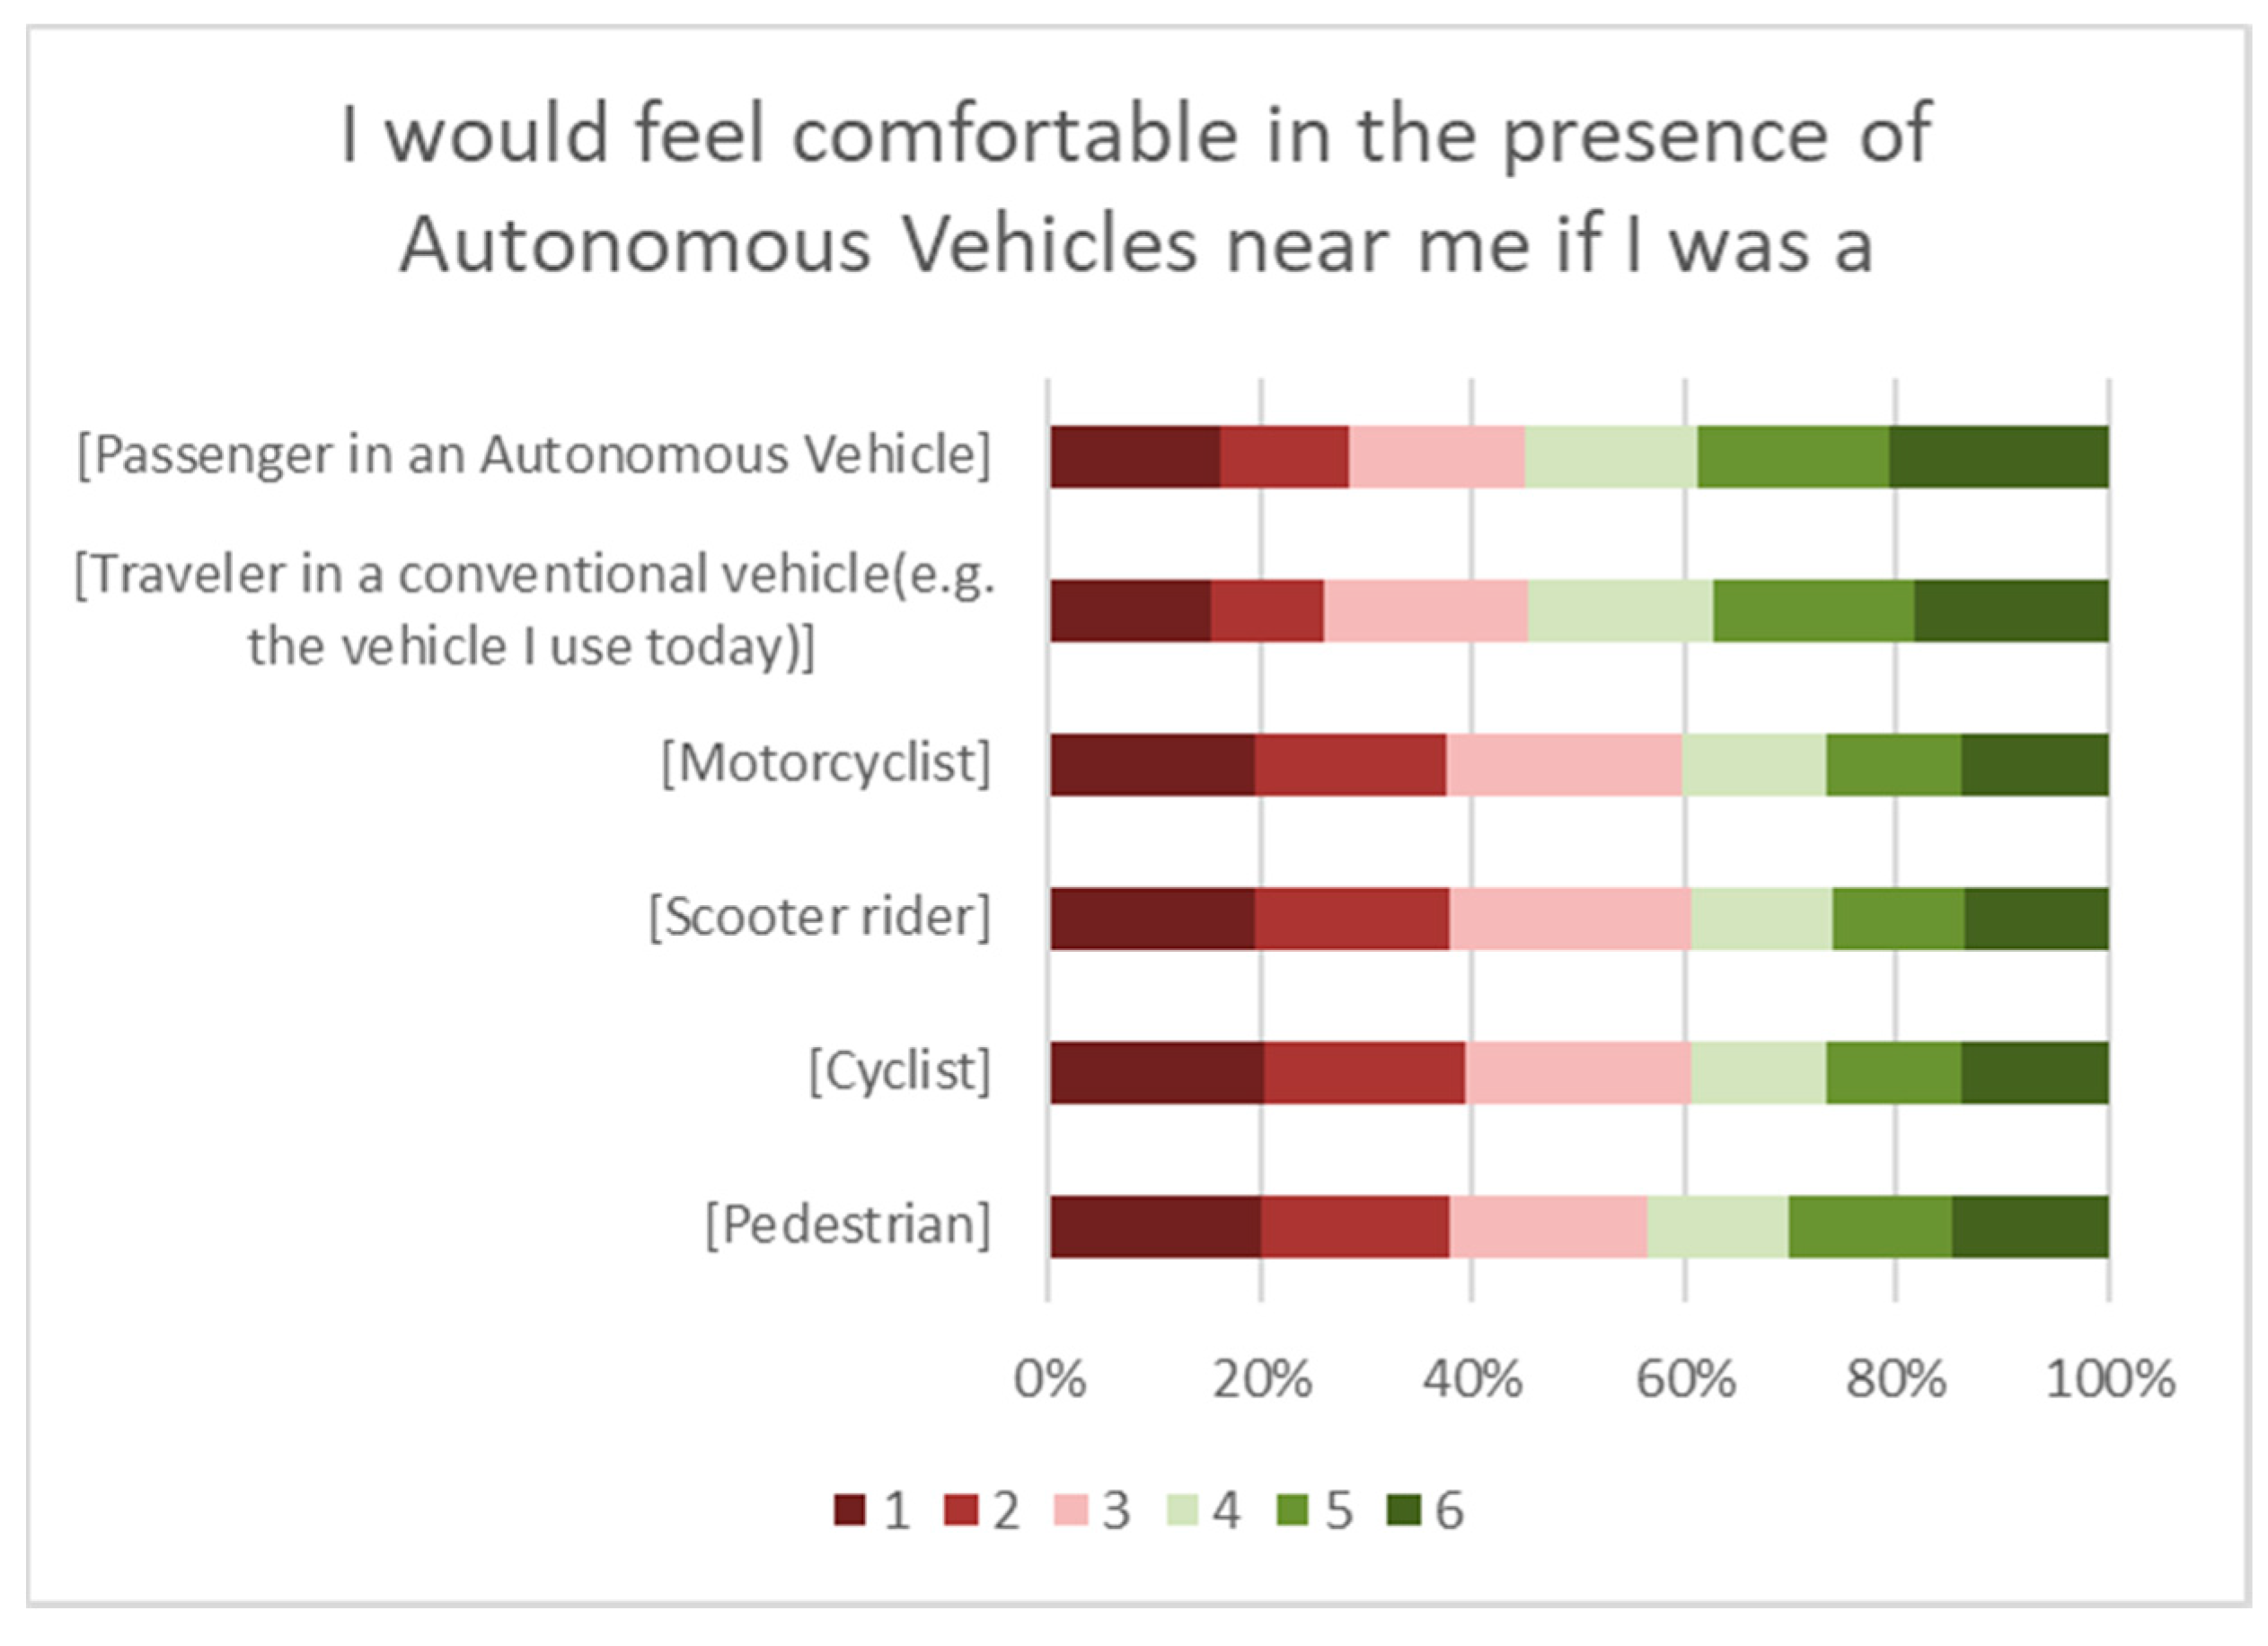
People were also asked to express their comfort in the presence of an AV. Their responses are shown in
Figure 3. Results showed that people, on average, would not feel uncomfortable in the presence of an AV, especially if they were either travelling in a conventional vehicle (M = 3.69) or passengers in an AV (M = 3.70).
Respondents were also asked to describe the conditions in which they would be willing to travel in an AV or allow their children to travel in an AV. Results revealed that people would be largely willing to travel in AV in the presence of a human operator inside the vehicle (M = 4.15). Similarly, people indicated that they would allow their children to travel in an AV if a human operator was in the vehicle (M = 4.0). On the other hand, they were quite reluctant to travel in an AV without the supervision of a human operator either inside the vehicle (M = 3.47) or remotely (M = 3.21), while they were rather sceptical about allowing their children travelling in an AV without the supervision of a human operator (M = 2.92).
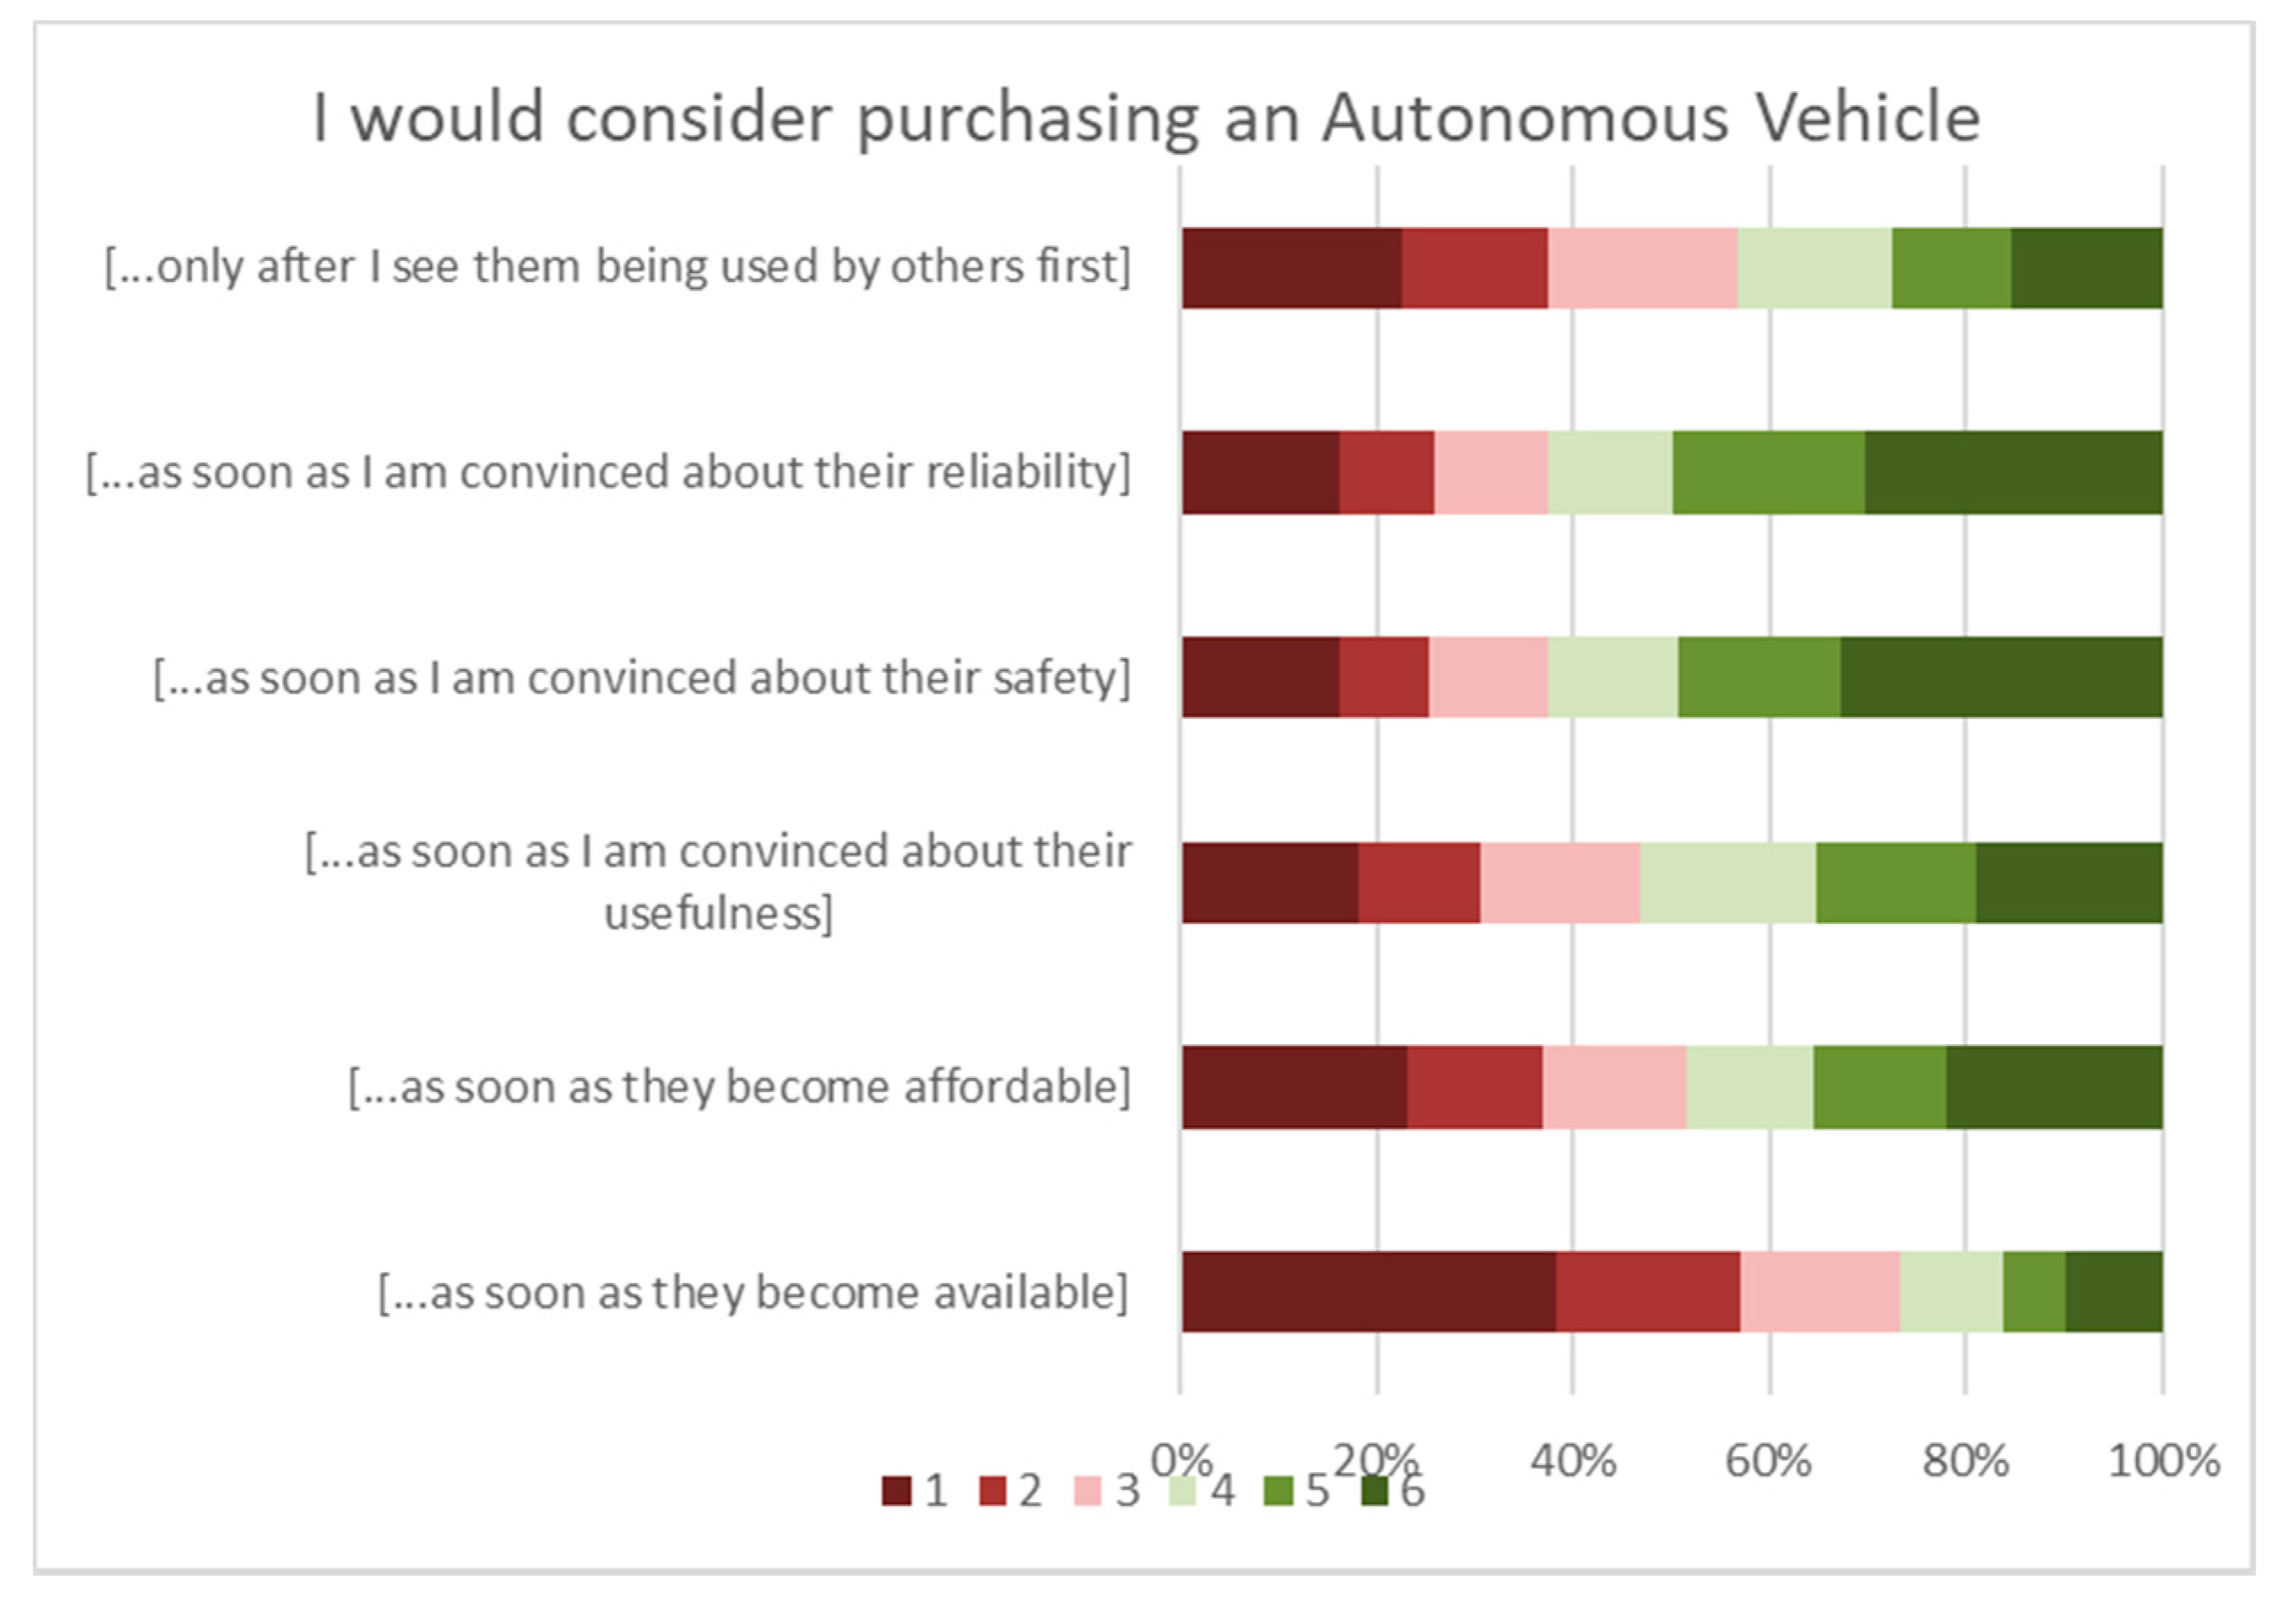
Survey participants also indicated that safety and reliability are the main drivers for their decision to purchase an AV (M = 4.03 and M = 4.01, respectively), which corresponds with the most important reasons for choosing to drive a car. The latter confirms the main argument of this paper, which is founded on the importance of safety for AVs deployment and not merely on their availability.
Figure 4 shows the six questions exploring the point in time when a respondent would be willing to purchase an AV.
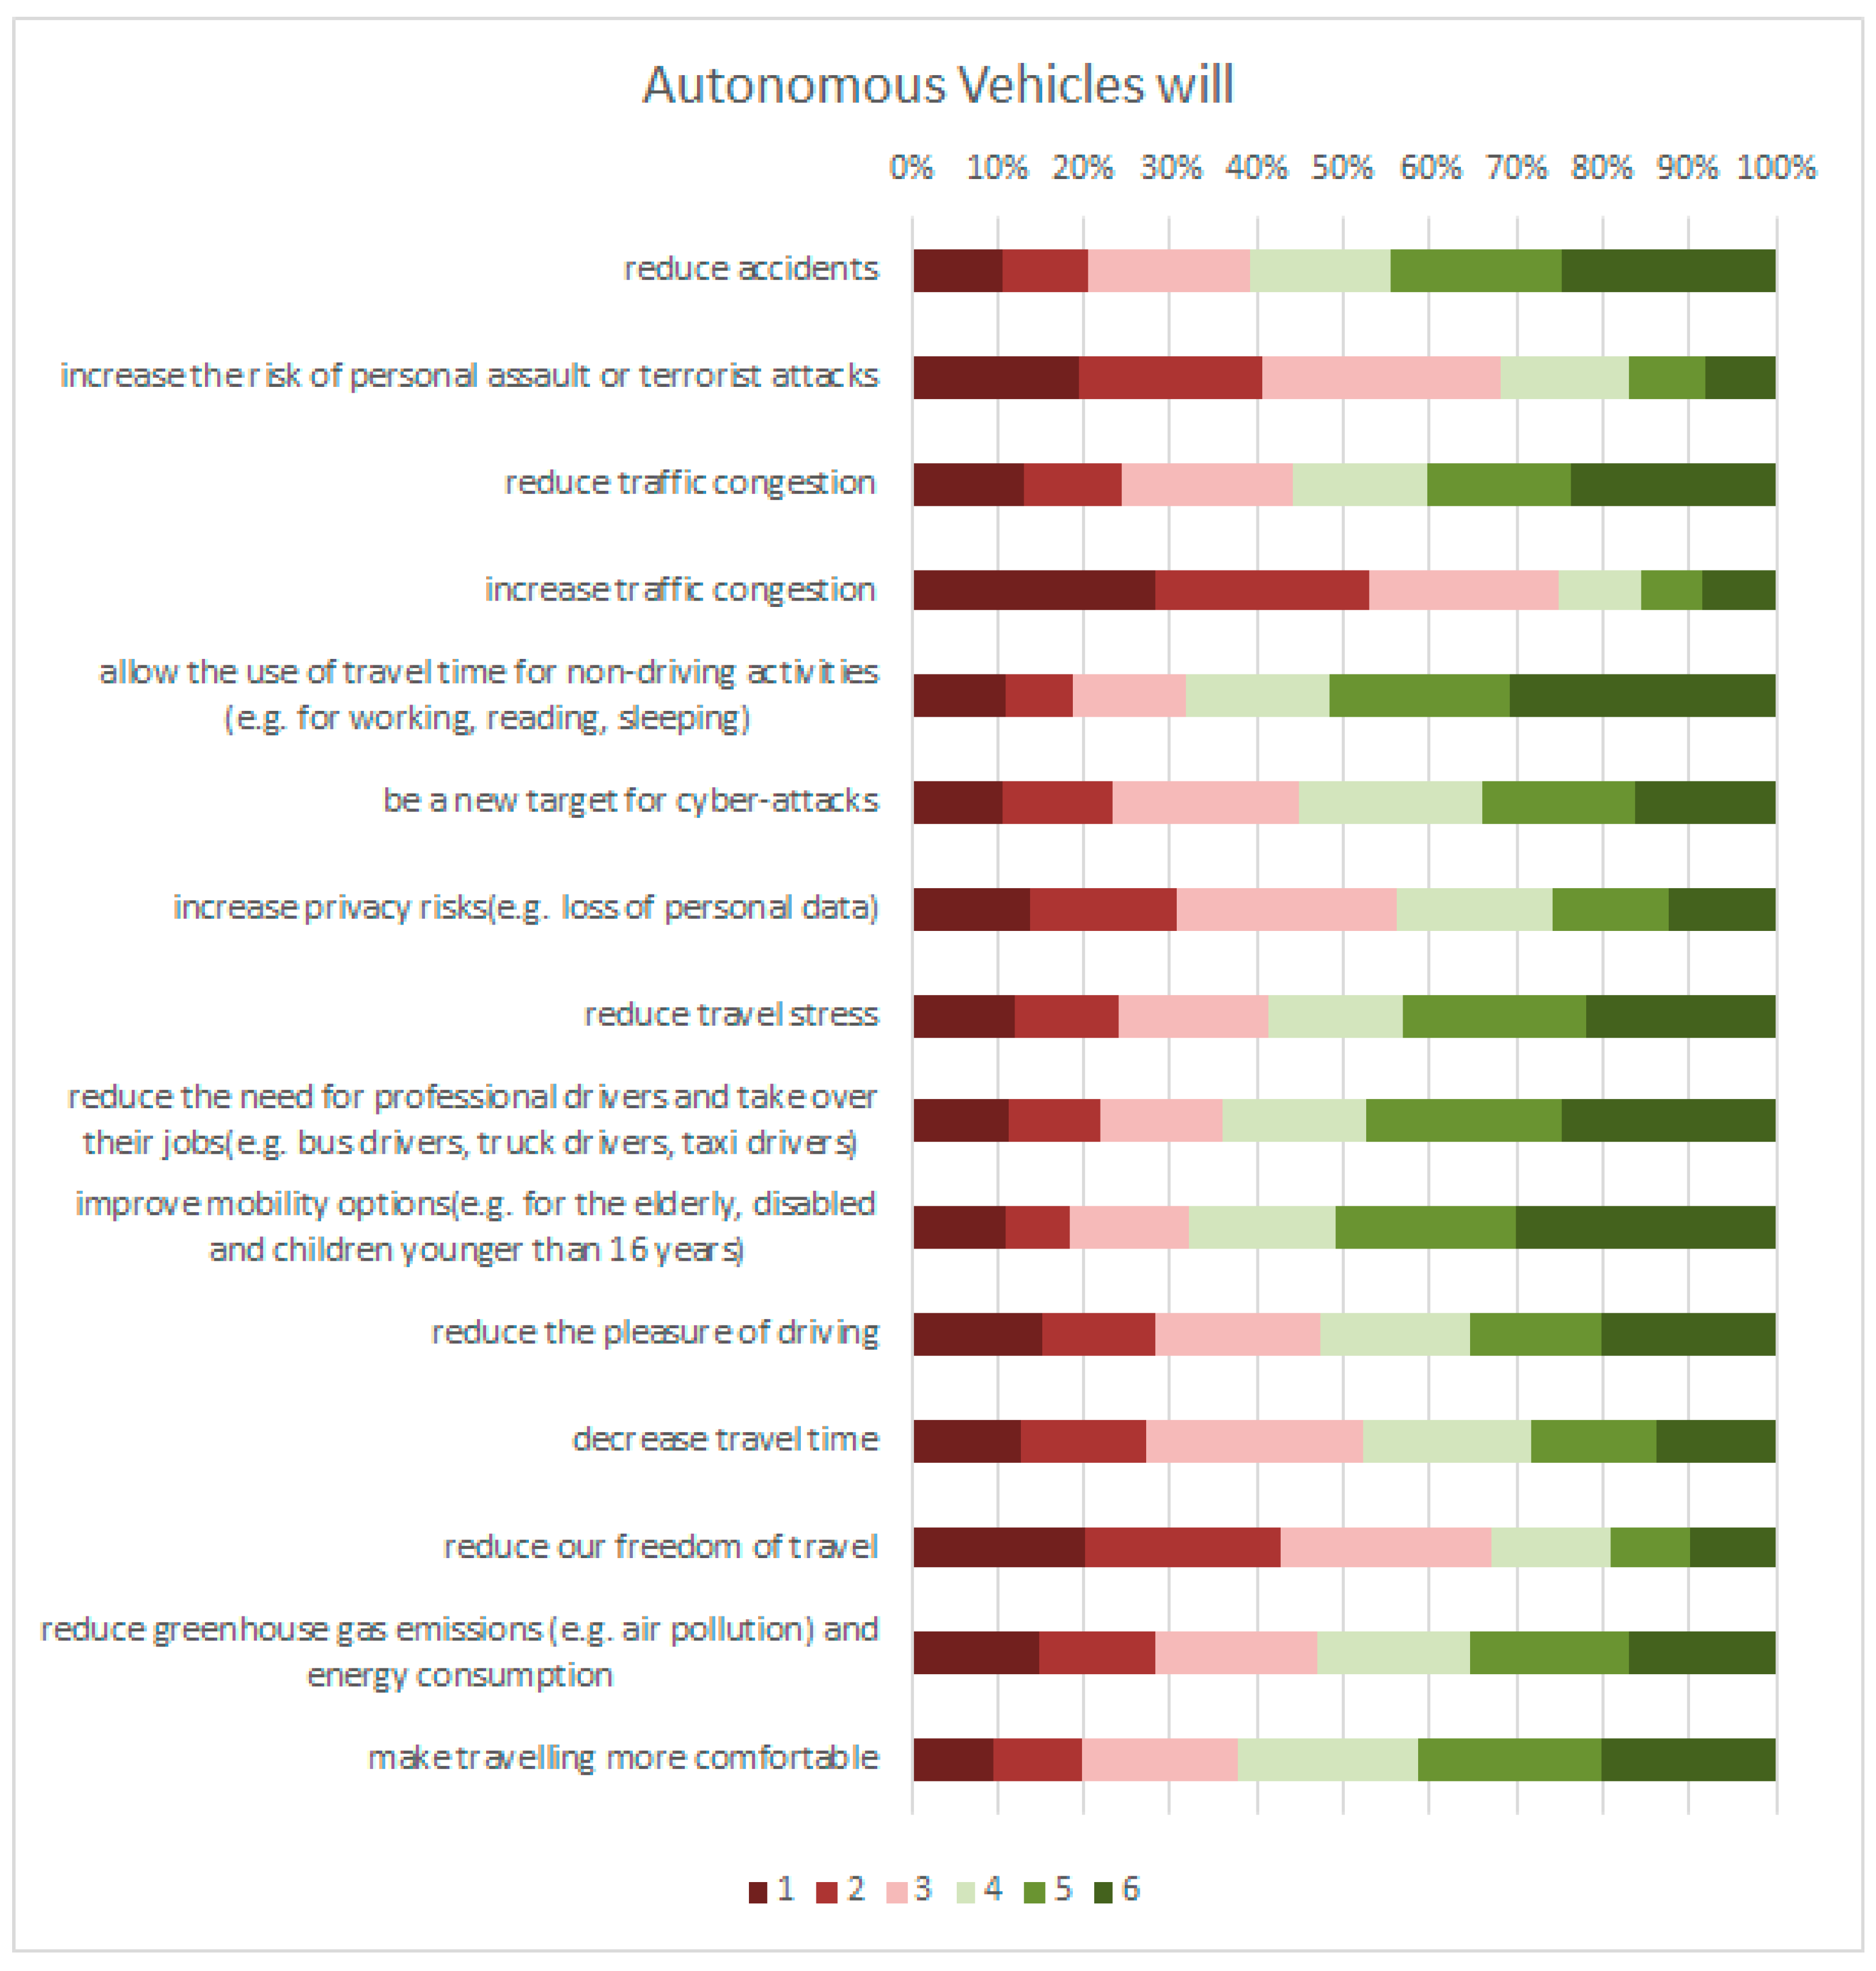
Finally, information regarding respondents’ expectations about the impacts of AV use were also asked, and responses are documented in
Figure 5. Respondents largely anticipate AVs to allow them to engage in activities other than driving tasks (M = 4.21, fifth row in
Figure 4) hence using their travel time more productively, while AVs are also anticipated to increase mobility for everyone (M = 4.20). Nevertheless, concerns were also raised across the sample countries. In particular, respondents are worried that AVs are likely to threaten the number of professional driving jobs (M = 4.03) which is also aligned with the Eurobarometer 2020 survey findings which focused only on EU countries [
48], while they will also reduce driving pleasure (M = 3.65).
Lastly, findings addressed the point that elderly respondents would be willing to purchase an AV in order to explore the impact of safety among other factors on the decision. The intention of respondents to purchase an AV as soon as these become affordable was also explored and compared to the GDP per capita (nominal) for each of the eight countries. Although findings indicate a small association (ρ = 0.054, p < 0.05), they also do show that the higher the GDP per capita the more positive respondents were towards purchasing an AV when these become affordable. No clear definition of affordability was provided to the respondents. Therefore, we assume that an affordable AV, in this instance, is equivalent to an affordable conventional vehicle, which naturally varies among the eight countries included in this survey.
4.2. Correlation between Socio-Economic Variables and Use and Perception of AVs
Table 5 shows the results of the Spearman correlation analysis and reports the coefficients related to the correlation between the socio-economic characteristics of the sample and their potential use and perception of AVs.
Firstly, a clear effect of age can be observed on people’s responses regarding the conditions under which they would travel in an AV or allow their children to travel in an AV. In fact, the older the participants the keener they are to travel in an AV with the presence of an operator in the vehicle. In contrast, the older the participants the more reluctant they are to use an AV without the physical or remote presence of an operator. Similar are the results regarding the effect of age on whether people would allow their children to travel in AVs, with both sets of findings offering valuable information regarding AV use by VRUs. Male participants seemed to be more open towards travelling in an AV without the supervision of human operators, while men also seem to be more positive towards allowing children in travelling in an AV with the remote supervision of a human operator or without the supervision of an operator.
Education also has an effect on people’s responses to the question about the conditions in which they would travel in an AV or allow their children to travel in an AV. The more educated the participants (e.g., university or postgraduate degree) the more open they are on traveling in an AV with the presence of an operator in the vehicle or remotely. Conversely, the better educated respondents were found more reluctant to use AVs without the physical or remote presence of an operator. The number of household members also has an impact on responses. Specifically, people with fewer members in the household are more inclined to travel in an AV with the supervision of a human operator. On the other hand, respondents of larger households are more willing to travel in an AV without the supervision of a human operator. The same trends are also established regarding whether people would allow children to travel in an AV. Households with fewer members tend to be less likely to allow their children to travel in an AV without the supervision of human operator. On the contrary, households with more members are more positive on allowing children to travel in an AV without the supervision of an operator.
The previous experience and use of ACC have also an effect on both questions assessing the presence of a human operator in the vehicle. In fact, those who have been more rarely using an ACC indicate stronger intention to travel in an AV with the supervision of a human operator in the vehicle, clearly demonstrating a link between previous engagement with automated driving assistance technologies and AV use uptake.
1111 out of the 1639 valid cases indicated that they use a private vehicle for their most important daily journey, while179, 120 and 43 participants declared public transport, private bicycle and shared car or motorbike, respectively.
Table 6 summarizes the findings on respondents’ main driver for choosing a specific transport mode. It can be clearly seen that respondents prefer a private car for their journeys due to their reliability and time to reach the destination. On the other hand, neither the cost nor the impact of the vehicle on the environment seem to be strong drivers against this choice. In contrast, environmental implications and cost of transport are the main drivers for those choosing public transport for their commute. For those commuting by bicycle, the time to reach destination, cost, reliability and environmental implications are the stronger drivers behind their choice. However, to draw more concrete conclusions the average daily mileage of the commuters shall also be recorded. This will be part of a follow up study. Finally, no clear indication of a single specific reason could be found among those who prefer to travel in a shared car or a motorbike.
4.3. AVs Opinions and Perceptions of Vulnerable Road Users
A more targeted analysis was conducted on vulnerable road users; in particular, the responses of individuals older than 65 years were analysed (N = 117, M = 70.41) to capture the opinion and intentions of the “elderly” towards AVs. The findings in
Table 7 offer valuable insight irrespective of the small proportion of this sub-sample compared to the overall survey sample, which, however, is in line with the relevant population segment in the selected eight countries which is below 20% (aside Italy: 23%) [
49]. A vast majority (79.5%) of the elderly population choose a private car for their most important daily journey, i.e., going for groceries or running errands (43%), or going to work (31%), while only 4% and 4.5% opt for public transport and walking, respectively.
Similar to the results for the entire dataset, most of the elderly use a private car to reach their destination because of the time needed, their reliability and the infrequent service of public transport. They would feel comfortable in the presence of AVs if they were travelling in a conventional vehicle, but they would also feel uncomfortable if they were driving a scooter or motorcycle. Proven safety and reliability are the main drivers for the elderly to purchase an AV, while they would be mostly willing to travel in an AV or allow their children to use AVs if an operator was physically present in the vehicle.
To address the range of VRUs within this international survey, a more focused analysis was also carried out on the responses derived from people with disabilities.
Table 8 presents valuable insights despite the small sample size (N = 53) compared to the global rate (3.2% compared to 15% globally) [
50]. Thirty-seven people indicated having mobility issues, while 16 were visually impaired, and 62.3% of the respondents use a private car owned by their household for their daily commuting activities. Going to work, to college, or running errands have been identified as the main daily journeys of these respondents.
Results do not show major differences compared to the elderly groups or general population. However, the overall more reserved responses of people with disabilities compared to the elderly should be stressed, which are in line with [
51,
52]. In addition, affordability of AVs is among the three main drivers, next to safety and reliability, for people with disabilities to consider purchasing an AV. Finally, unless travellers in a conventional vehicle, these 53 respondents would feel uncomfortable in the presence of an AV which highlights the need for a particular focus on such potential AV user needs who will arguably benefit by the deployment of AVs [
53].
5. Discussion
Results demonstrate that although safety may be among the important factors influencing the decision to use an AV, it is clearly not the only factor and, in some cases, not even the most important one, as argued within this article (
Section 1 and
Section 2). Most respondents prefer a human operator to be present in the vehicle, both when travelling themselves and when their children under the age of 16 are travelling. Our findings demonstrate the importance of safety on users’ acceptance of the technology, while it also highlights that a large proportion of respondents do not fully trust SAE Level 5 AVs for their journeys in the absence of human control. When linked with previous experience with automated systems, which in our survey is demonstrated by the use of Adaptive Cruise Control (ACC) as a proxy, it became obvious that past exposure and frequent use of driving assistance technologies increases the trust in more advanced automated vehicle technologies. These findings are in alignment with previous studies, e.g., [
11].
Additionally, safety and reliability are among the most decisive factors that will encourage users to purchase an AV. Similarly, this is in line with relevant literature [
54] given the slow technological progress in this respect. Reliability features as a key concern for human drivers (see
Table 6), so it is not surprising that they would expect the same service provision by an AV. A noteworthy finding of this survey is related to the size of households and their association with the trust in AVs. In fact, initial results show that the larger the household the higher the trust level is in AVs. This finding has not been extensively discussed in the literature yet. Assuming that larger households indicate families with children, it is interesting to further investigate this finding in order to better capture the opinion of people concerning the conditions under which they would allow their children to use AVs. The fact that smaller households appear to have a more reserved approach towards the use of AVs may be attributed to potentially higher level of education and access to information, particularly given the increased awareness (76%) about AVs compared to 2015 (
Section 4.1). Education has been found as a key variable in modal choice [
55] and our findings confirm that it plays a role in adopting AVs. In addition, the fact is that in the past two decades young people have started to drive later and the number of younger and smaller households without cars is increasing, which can result in more pessimistic (realistic) expectations of AVs feasibility and lower willingness to use a personal vehicle (regardless of the level of automation) [
55,
56]. It could also mean that parents (or carers) with more than one child would allow their offspring to travel together in the same AV without the presence of a human operator in the vehicle, as the older children may assist in supervising the younger ones or even call for assistance in case of emergency. These findings are intertwined with safety and may signal a higher value of statistical life by households with fewer members (e.g., single child), whereas larger households may put more trust among their household members when travelling (e.g., siblings). Admittedly, our findings may be considered counterintuitive; thus, future research shall investigate and further compare similar results in countries with traditionally larger households or increasing cultural diversities.
Our survey also stresses the impact of transport automation and digitalization on professional driver jobs e.g., taxi, bus, coach, freight. Findings indicate the worries of the public on the possible transformation of professional driving jobs, from actively driving vehicles to a more supervisory role either in-vehicle or remotely, although it is unclear what safety impact is anticipated through such a transformation. This finding is fully aligned with the findings of the Eurobarometer 2020 survey [
48] and the CAD Employment study [
57], stressing the need for relevant policies both in the short- and long-term.
Another factor to potentially hinder the use of AVs is the unavoidable loss of driving pleasure, which human drivers currently enjoy when driving their own vehicle [
55]. Although such behaviours may pose a direct risk to transport safety and accident reduction targets, it is still a notable impact which needs to be considered if wider support for AV deployment is to be sought. Naturally, this issue is of higher importance in certain countries due to their geography, weather or available transport infrastructure. Therefore, more detailed country analysis and an even wider country selection would offer better insight on this matter. Since 90% of accidents can be attributed to human-errors [
54], the added travel safety promised by automated vehicles will not be realized if vehicles continue to be human-driven or if there is an extensive transition period with the co-existence of AVs and conventional vehicles.
Insights on the use of AVs by vulnerable road users were also drawn. The fact that almost 80% of respondents over 65 years old and more than 60% of people with disabilities use their private vehicle for their daily commute (mainly due to reliability and infrequent service of public transport) indicates the vast benefits which may be capitalized by these user groups through the deployment of AVs. Our findings confirm the results of Pronello and Camusso [
55] showing how an insight in the potential of AVs in fulfilling time constraints, as perceived by elderly people, could be a factor favouring the introduction of AVs in certain categories of population if they consider that AVs would be less time consuming. Regardless of their trip purpose—going to work or for groceries—findings suggest that AVs should accommodate the needs of vulnerable road users (
Table 7 and
Table 8) ensuring easy access and intuitive interaction. At the same time, it is important to manage the public’s expectations regarding the AV deployment and functionalities, while avoiding any negative safety and/or sustainability implications. The increased use of AVs by vulnerable road users, in particular the elderly, may reduce, for instance, public transport ridership which includes a high proportion of elderly across countries. Thus, it is significant for policy makers to consider such findings and adjust relevant policies to support both the uptake of new technologies by all user groups, while meeting national and global sustainability objectives. Finally, this study has also investigated whether people are keen to allow their children to use AVs. Overall, findings are in agreement with previous studies, e.g., [
34,
36], and indicate that parents would be willing to let their children to use AVs if the vehicles were supervised (in-vehicle or remotely).
6. Conclusions
The hype surrounding the introduction and deployment of highly automated driving vehicles has increased over the last ten years; however, the decade ends on a rather pessimistic note [
58]. A number of issues related to AV deployment are yet to be addressed, including the concerns of the public over the safety implications of AVs deployment. Safety, however, is not solely responsible for the potential slow uptake of AVs.
By means of an online survey, which follows a two-wave approach, this study highlighted the importance of factors other than safety on public acceptance of AVs and potential uptake of the automated technology, based on information collected in Spring 2020 from eight European countries (first wave). The survey’s second wave, which started in September 2020, will be in progress until it reaches 14 countries. In the second wave, the survey is again open to the countries reached in the first wave, to allow an increase of the number of respondents and have, at the end, a panel of 14 countries with, at least, 300 answers per country.
Overall, it has been demonstrated that factors such as reliability, affordability, cost, driving pleasure and household size may affect AVs uptake; thus, they should not be neglected when designing policies on AVs introduction and deployment. AVs shall be designed accounting for the needs of vulnerable road users, ranging from young children to the elderly and people with disabilities. Considering the needs of vulnerable road users at an early stage of the vehicle design can generate revenue streams of niche user groups who depend strongly on mobility and may spend considerable proportions of their income to satisfy their mobility needs.
Our results, which are largely in alignment with previous research, e.g., [
25,
27,
57], can be used by policy makers and other actors in the field of AVs development and deployment in order to address the following issues (in addition to safety). First, to ensure AVs reliability and how to better meet the expectations of their potential users. Second, how to ensure affordability of AVs, either as private vehicles or as shared modes of transport, for the majority of the population. Third, how to better communicate the AVs functionalities, and how to better design AVs for those who have not been exposed to automated features or have special needs to use them. Fourth, how to demonstrate to the public the usefulness of AVs and how to best display their advantages, e.g., increased mobility for all, reduced stress of driving, reduced traffic congestion, improved navigation and smoother/faster driving times [
43].
It shall also be noted that many of the identified factors also apply to conventional vehicles, so actions may be taken even prior to the deployment of AVs in tandem with sustainability objectives. The need for coordinated approaches at city, regional, national and international levels both in the Global North and the Global South [
27] is pertinent due to the 2030 Sustainable Development Goals and the long-term implications of AVs. With coordinated actions and policies, it will be possible to address inherent inequalities of the transport system [
29] through new technological developments, whilst at the same time meeting common sustainability goals worldwide.
Despite the useful insights, this study has certain limitations. First, most of the survey’s participants were male, which does not necessarily represent the national gender quota. Further, males are usually more open to accepting new technologies [
59]; thus, findings shall be critically revisited in follow-up studies which may include a more balanced gendered sample. Second, an online survey does by default exclude a part of the population that has no access to or is not familiar with the internet (especially the elderly) [
60]. Therefore, findings have to be contrasted with a survey conducted by telephone or mail to capture the opinion of people who are not keen to, may have not access to or simply do not use the internet. Third, although insights on the use of AVs by children were drawn from the data, no children had actually participated in the survey due to the applicable research ethics framework. To address this drawback future studies would benefit by contacting and asking minors on their opinion on AVs since they will most likely be affected by the anticipated deployment of AVs in the coming decades.
Regardless of the acknowledged limitations, we expect that our findings are relevant for all stakeholders involved with the development of automated driving technology and contribute to the safety debate surrounding AVs.


 ,
, 


