1. Introduction
Tourist flow refers to the spatial distribution of tourists, reflecting the travel patterns of tourists in a certain region [
1]. Understanding the spatial distribution of tourist flows and the movement patterns of tourists can provide practical implications to tourism practitioners in terms of resource allocation, infrastructure construction, and effective tourism planning for a destination [
2,
3,
4,
5]. Tourist flow can also assist in the management of tourism’s environmental and cultural impacts [
4]. Cox found three movement patterns of humans; namely, distance-, direction-, and connection-based movement patterns [
6]. The distance-biased movement pattern denotes the distance-related intensity of movement. The direction-based movement pattern reflects the direct movement of tourists. Last, the connection-biased movement pattern pays attention to the connection points during movement, reflecting the important role of connection in determining the characteristics of the movement. Oppermann revealed that “trip itineraries” can be used to reflect travel patterns and tourist flows. In addition, Oppermann proposed two categorizations of tourist movements; namely, tourist movement among different locations and tourists’ stays in different locations [
7]. Zhong, Zhang, and Li pointed out the disadvantages of conventional directional bias, such as the inability to identify the emitted and the attracted tourist flows, and proposed a new concept of “functional tourism region” [
8]. Previous investigations of tourist flows are mostly based on scale. For example, Liu, Zhang, Zhang, and Chen categorized 31 provincial destinations in China into national and regional tourist centers and common and marginal destinations [
9]. Jin, Xu, Huang, and Cao investigated tourist flows in different attractions in Nanjing, the inner city of China [
10]. In summary, the identification of movement patterns of tourists seems to shift from complex to simple, and the investigation of the scale of the spatial distribution of tourists ranges from the country to the city level [
2,
11].
Familiarity with tourist flow can guide tourism practitioners to achieve effective and harmonious coordination in different areas of a destination and ultimately promote sustainable tourism development [
9]. Tourist flows can also assist tourism practitioners in identifying the potential of a particular destination and promoting balanced tourism development. With the enhanced accessibility brought by transportation, tourist travel is no longer restricted to the most commonly recommended or popular tourist attractions. Tibet, a remote and autonomous region of China, has been developing rapidly because of enhanced accessibility and China’s national development strategy of turning the plateau into a tourism destination [
12]. Tourist arrivals and tourism revenues in Tibet have increased by more than 20% since the opening of the Qinghai–Tibet railway in 2006 [
13,
14]. In addition, the rapid development of the Internet increases Tibet’s opportunities to connect with the outside world [
5]. Hence, Tibet may further develop its tourism industry. As a large destination with different prefectures, the present study selected Tibet as a case to generate tourist flow patterns from a regional perspective, together with the detailed tourist flow patterns in each of its prefectures. Hence, Tibet is selected as a case to help tourism practitioners come up with corresponding strategic plans for a balanced and sustainable tourism development [
12].
Although previous studies examined tourist movement patterns or categorized tourism destinations from a country or city level [
9,
10], the implications of the country- or city-level tourist flow is either very general or specific. The detailed implications of tourist flow to a regional-level perspective are also limited, to a certain extent. In addition, although previous studies explored tourists’ movement patterns or itineraries, tourist inflows and outflows received limited attention. Knowledge of tourist inflows and outflows can greatly assist destinations in balancing regional tourism development and developing their tourism effectively. Hence, the present study uses the theory of social network analysis (SNA) to identify the tourist flows in each of Tibet’s prefecture. Specifically, the present study aims to visualize tourist flow in Tibet and examine the differences among tourist inflows, outflows, and total tourist flow. Moreover, this study aims to summarize the patterns of tourism flows and provide practical implications for effective future tourism planning and development.
3. Methodology
Most previous studies adopted questionnaire surveys or secondary data to explore tourist flows or patterns in a destination [
19,
26]. For instance, Zeng identified the characteristics of tourist flow of Chinese tourists visiting Japan by retrieving 430 travel itineraries from travel agencies in China and 458 itineraries of independent tourists from their trip diaries [
28]. Nevertheless, the aforementioned traditional data collection methods, such as questionnaire surveys or secondary data, lack efficiency and completeness. Toha and Ismail discussed the applicability of various tracking technologies, such as global positioning system or land-based tracking technologies, to track the movement of tourists in historical cities of Melaka. However, an empirical investigation is still absent [
29].
Hence, considering the shortages of traditional data collection, such as questionnaire surveys, the present study employed the concurrent data collection method through the mobile signal to obtain rich data to gain comprehensive information of tourist flow. Recently, along with the wide adoption of smartphones by tourists during travel, large volumes of user-generated data have become available to generate rich data [
5]. The present study tracked the movements of tourists in Tibet by retrieving data via mobile phone signals of tourists. That is to say, mobile phone signal information from China Unicom telecommunication service was retrieved. In other words, for tourists who used the telecommunication service from China Unicom, their movements in Tibet were tracked. Specifically, once tourists entered Tibet, their mobile phone signals were identified and tracked through their points of entry. Similarly, once tourists left Tibet, points of exit were recorded. In the meantime, data were encrypted to protect the privacy of tourists, and the encryption assures that the personal information of tourists was kept confidential as no party can read or obtain this information. As a result, only their movements in Tibet were tracked and recorded.
In summary, in October and November 2018, tourist inflows and outflows of different prefectures (including domestic and international tourists) in Tibet were retrieved. October was selected because China’s National Day is in this month, which has a long holiday and is the peak season of tourism in Tibet. On the contrary, compared with October, November is the off-peak season for tourism in Tibet. Thus, the present study selected the representative data in October and November as an example to investigate the tourist flow pattern in peak and off-season in Tibet. The tourist flows of six regions (i.e., from west to east Tibet); namely, Ngari, Nagqu, Xigaze, Lhasa, Shannan, and Nyingchi prefectures, were retrieved based on the administrative regions in Tibet. Qamdo prefecture is not included because it received lower tourist flows compared with that in other prefectures of Tibet.
4. Findings and Discussion
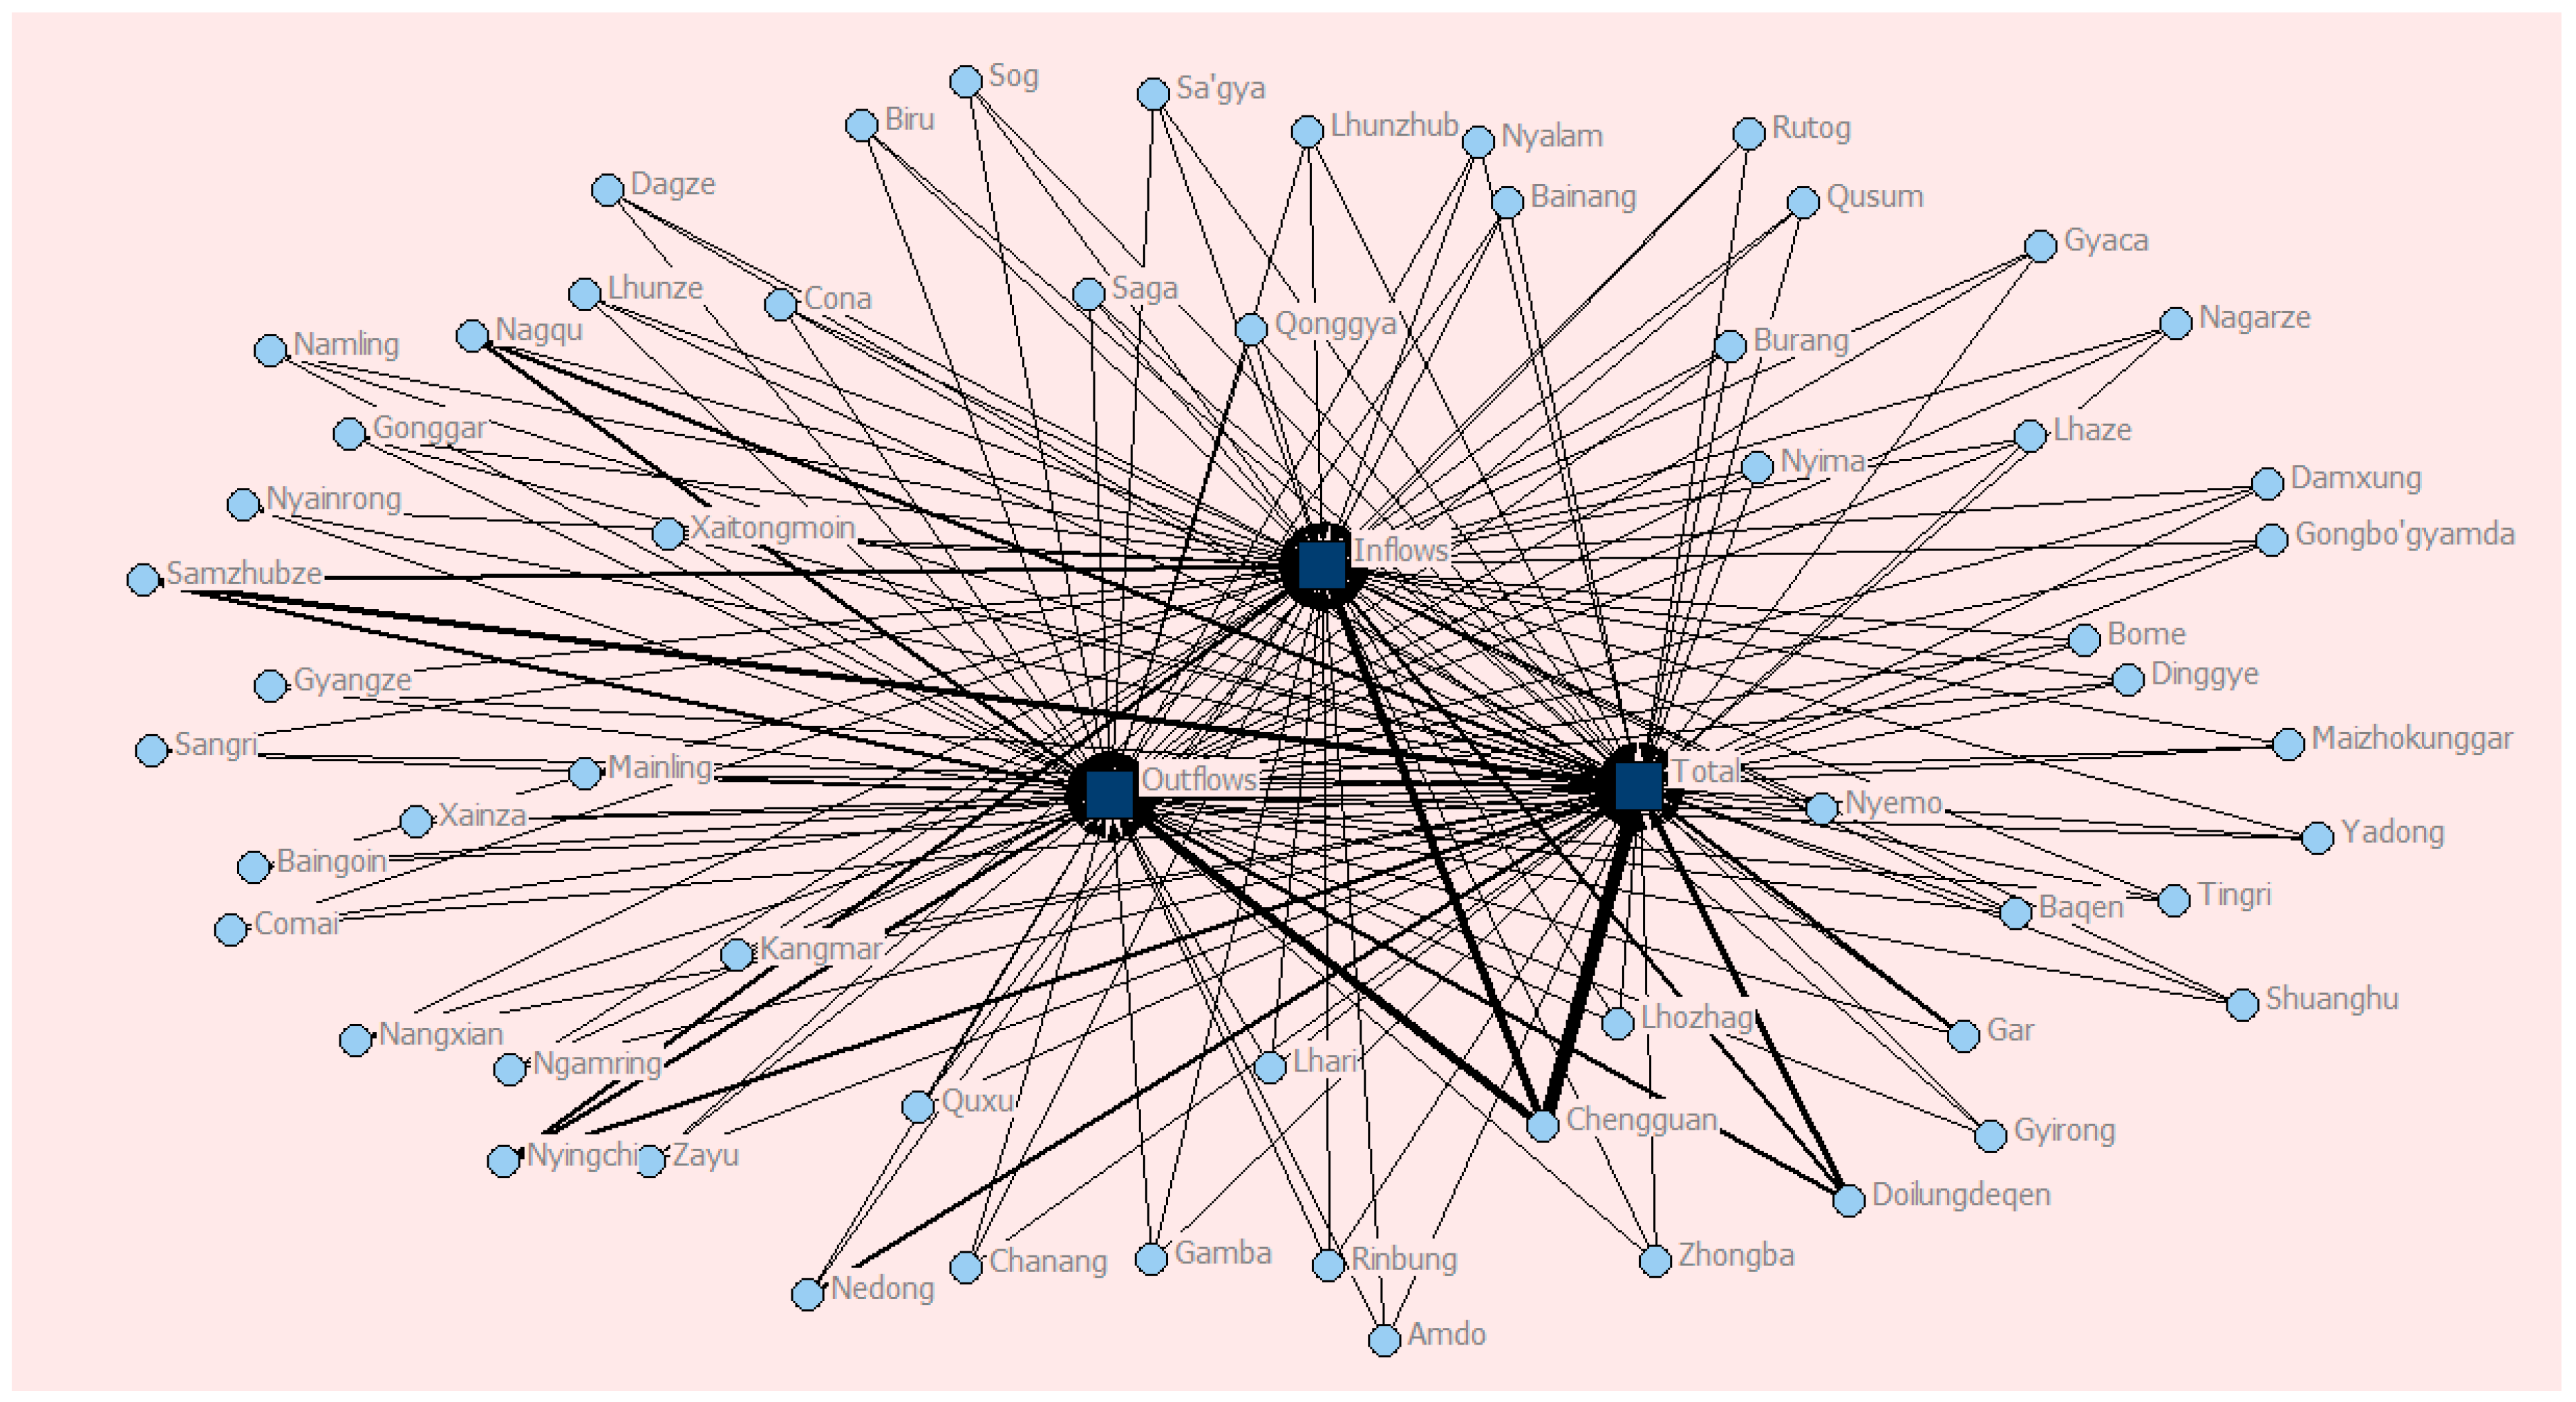
Figure 1 depicts the directions of tourist inflows, outflows, and the total tourist flow, including the intensity of tourist flows, using software UCIENT and NETDRAW. The light blue circles represent 59 districts among six prefectures in Tibet, whereas the three dark blue circles signify tourist inflows, outflows, and the total tourist flow. The degree of the thickness of the lines represents the intensity of the tourist flow. The findings show that Lhasa prefecture (i.e., Tibet) is Tibet’s transportation hub. In addition, Nagqu (i.e., Nagqu) and Xigaze (i.e., Samzhubze) prefectures are considered secondary transportation hubs. Furthermore, Nyingchi (i.e., Nyngchi) and Ngari (i.e., Gar) prefectures are supportive transportation hubs.
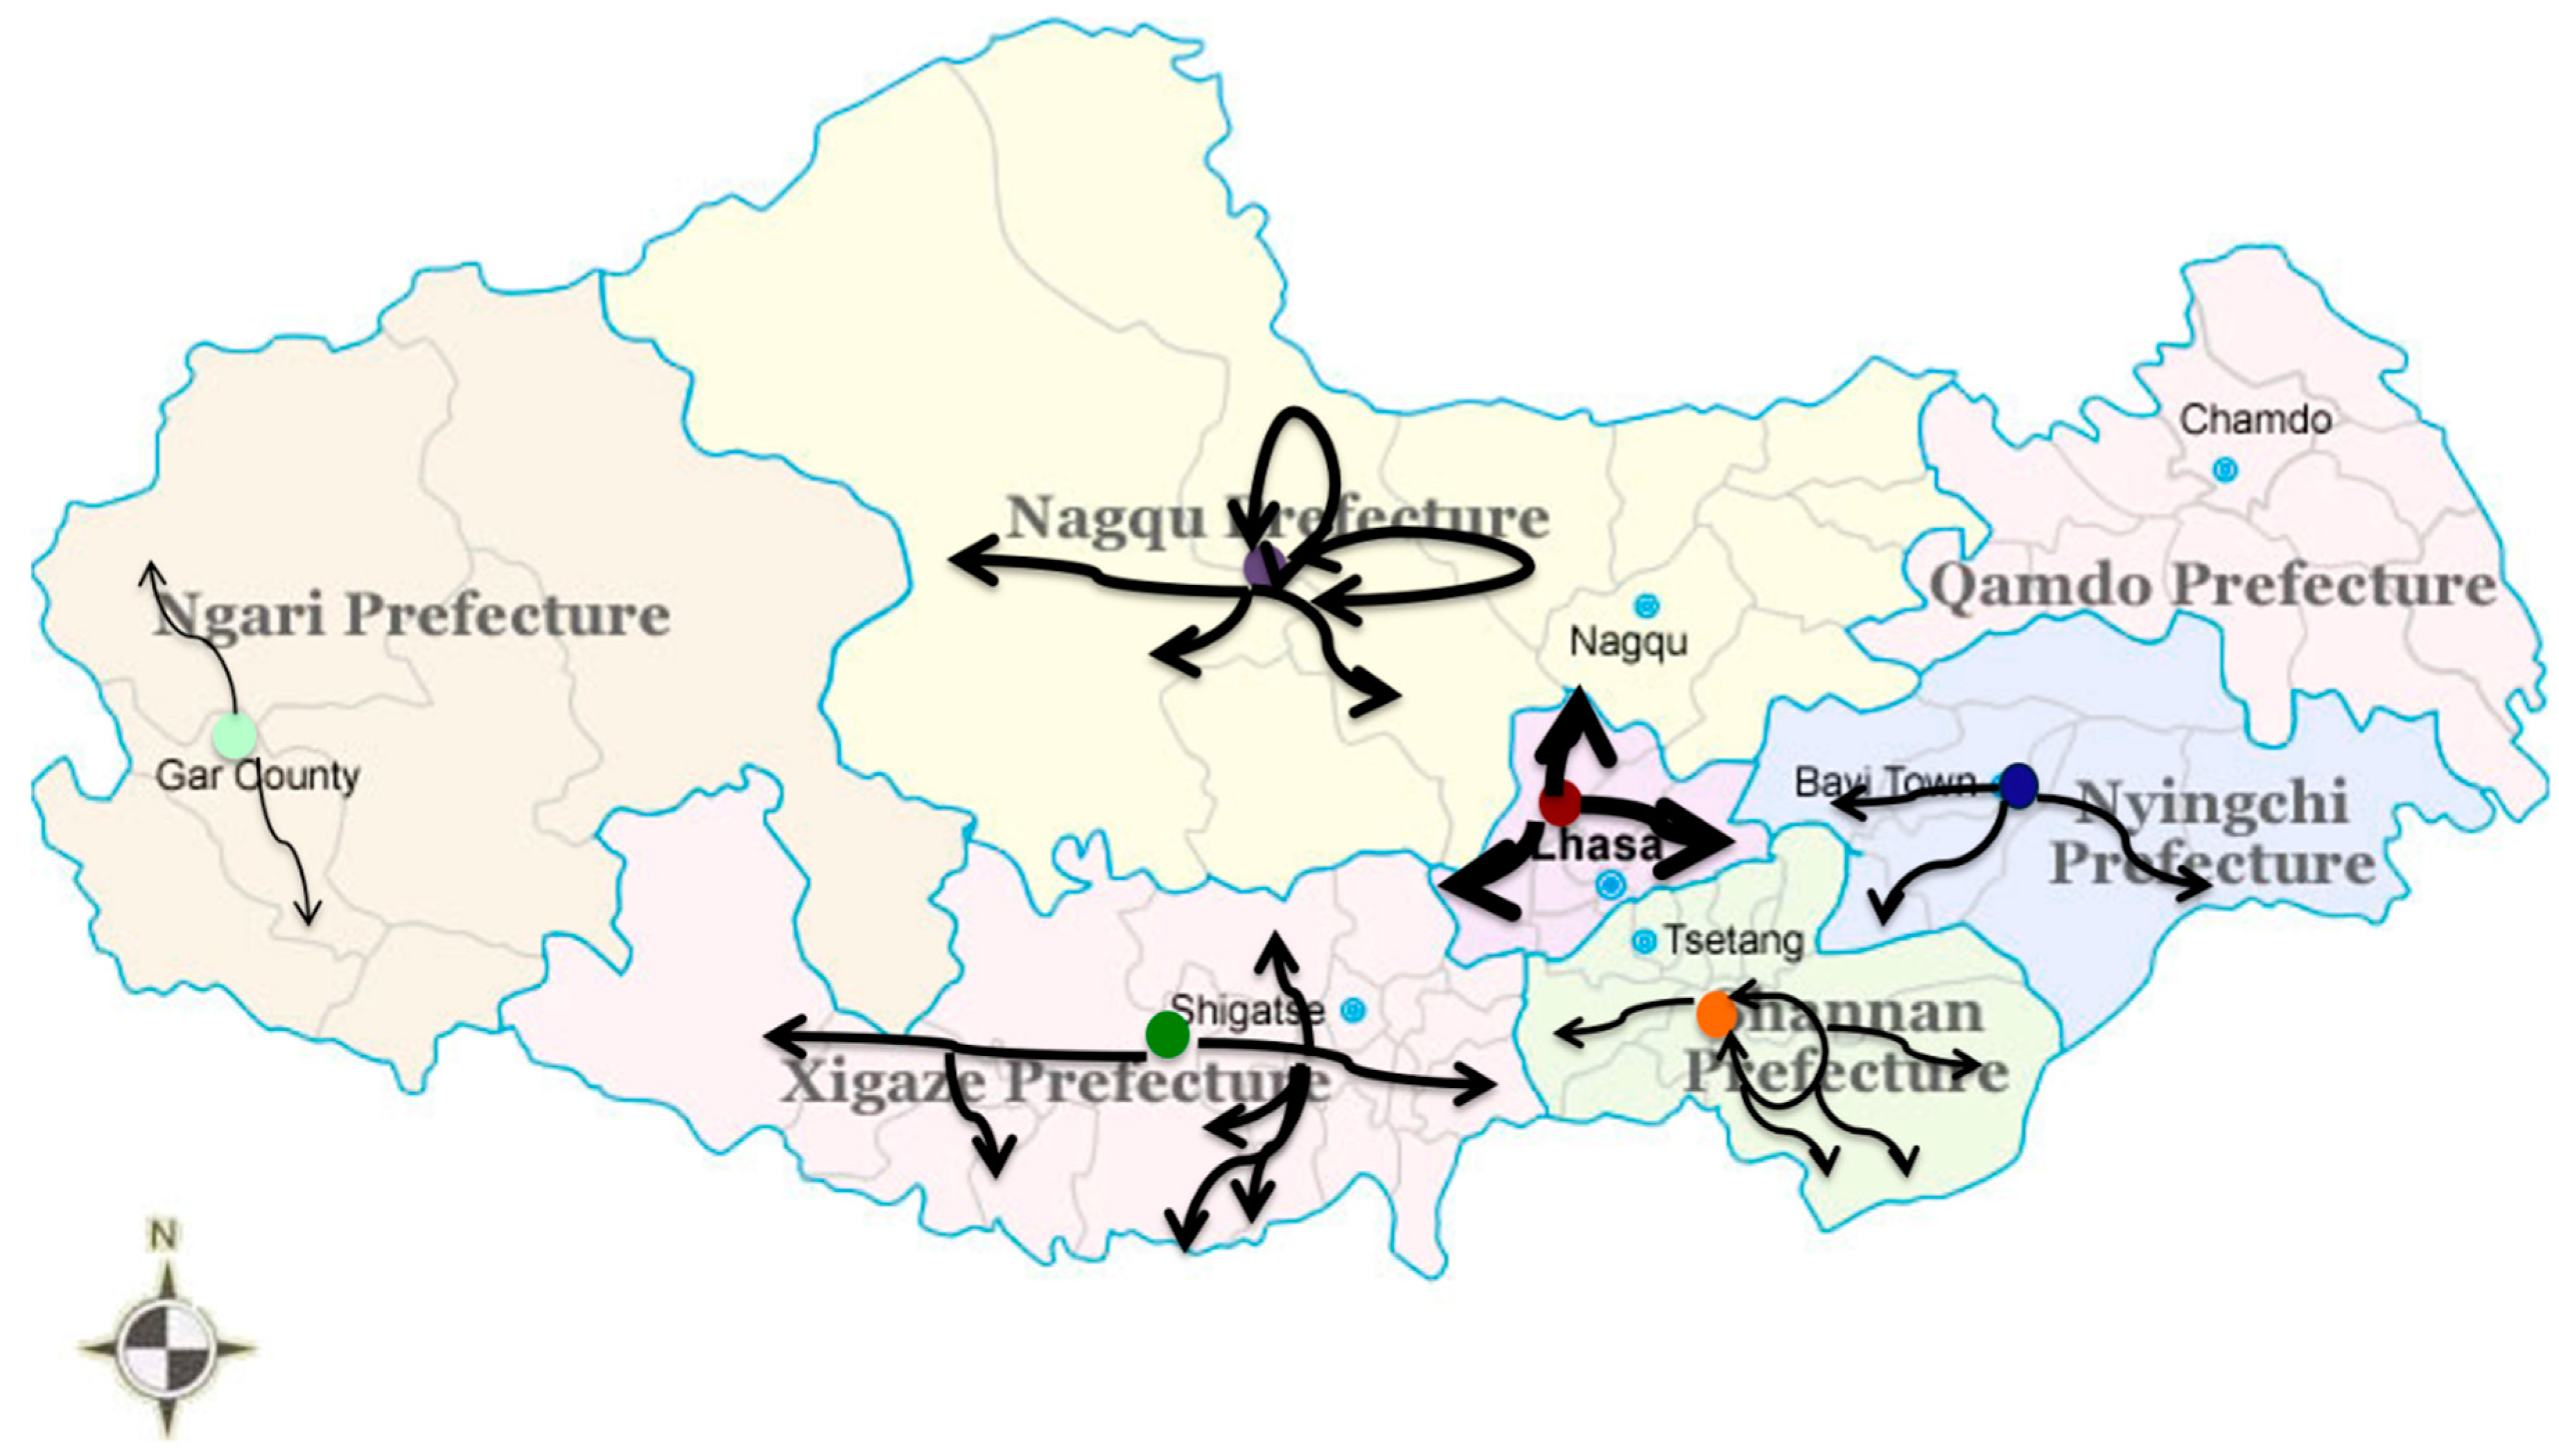
Figure 2 further indicates tourist flow patterns and directions in different Tibetan prefectures. The thickness of the lines represents the amount of tourist flows in different prefectures. The degree of the thickness of the lines represents the intensity of the tourist flows. Overall, tourist flow patterns are diversified among different prefectures in Tibet. Specifically, compared with other prefectures, the Lhasa prefecture received the most tourist flows, followed by Nagqu, Xigaze, Nyingchi, Shannan, and Ngari prefectures. The following sections will provide detailed information about the number of tourist inflows or outflows, present the number of total tourist flows in each prefecture in Tibet, compare the differences of tourist inflows and outflows, and identify the flow patterns of tourists.
Table 1 shows the number of tourist inflows and outflows and the total number of tourist flows in the Ngari prefecture in Tibet. Compared with other prefectures in Tibet, the Ngari prefecture has relatively fewer tourist flows. The Gar district is a central place that connects the northern and southern parts. In addition, no significant differences are found among tourist inflows, outflows, and the total number of tourist flows in the Ngari prefecture in October and November of 2018. Located in the western part of Tibet, the Ngari prefecture generally receives fewer tourists than its eastern parts. The tourist flow pattern in the Ngari prefecture is very simple which is indicated by “a three-point line.” Hence, tourism practitioners should consider the selling point of the Ngari prefecture, market its attractions, further encourage the exploration of tourists, and increase its tourist flow in different parts of the Ngari prefecture gradually.
Table 2 lists the number of tourist inflows and outflows and the total number of tourist flows of the Nagqu prefecture in Tibet. Nagqu generally plays a central role in connecting different parts of the Nagqu prefecture. Specifically, the Shuanghu district in the western part of the Nagqu prefecture receives fewer tourist flows than other areas in the Nagqu prefecture. In addition, tourist flows are concentrated in the central and eastern parts of Nagqu and are scattered in western parts, such as the Xainze district. Through paired samples t-test, significant differences (
p = 0.041) are found between October 2018 and November 2018 regarding tourist inflows of the Nagqu prefecture. They are significant at the 95% confidence interval. Specifically, the number of tourist inflows of the Nagqu prefecture in October 2018 is higher than those in November 2018. This result indicates that, for the Nagqu prefecture, compared with November, tourists prefer to visit Nagqu in October. In other words, efforts can be made by the Tibet tourist bureau to attract more tourists to visit Tibet in November by creating special themes, as an example.
Significant differences are found regarding tourist inflows of the Nagqu prefecture, whereas no significant difference is found between tourist outflows and the total number of tourist flow. The tourist flow of the Nagqu prefecture is characterized and reflected by the primary flows around the city center, along with the secondary flows between the core and the minor nodes (i.e., Nagqu–Amdo–Nyainrong; Nyainrong–Baqen–Nagqu). The tourist flow in Nagqu prefecture is generally indicated by the structure of “diffusion from the main center” and “clustering to the main center.” Patuelli et al. [
19] indicated that an increase in world heritage sites cannot only lead to a 4% increase in tourist inflows but also helps a certain region gain competitive advantages over other regions or districts. Hence, taking advantage of the Nagqu center and highlighting the appeal of attractions in nearby districts to extend the primary flows and increase the secondary flows can be considered. Lew and McKercher suggested that tourists can venture further as they become familiar with a region, thereby helping a destination increase secondary flows [
4].
Table 3 reveals the number of tourist inflows and outflows and the total number of tourist flows in the Xigaze prefecture. The number of total tourist flow in the Xigaze prefecture indicates that the Samzhubze district has the highest tourist flow, whereas the Gamba district has the lowest number of tourist flows. In addition, the Samzhubze district acts as a central place connecting all the other districts in the Xigaze prefecture. Moreover, the tourist flows in the eastern and western parts are relatively the same. Through paired sample t-test, significant differences (
p = 0.017) are found for tourist outflows in the Xigaze prefecture between October 2018 and November 2018. They are significant at 95% confidence. Regarding the total number of tourist flows of the Xigaze prefecture, the finding shows that the
p value is 0.062 and is significant at the 90% confidence interval. Specifically, tourist outflows and the total number of tourist flows of the Xigaze prefecture in November 2018 is greater than those in October 2018.
With the Tingri district as a center, tourist flows in the Xigaze prefecture are generally reflected by the primary flows among core nodes, the tertiary flows between the core and the minor nodes, and the normal moves among minor nodes. Thus, the Lhaze, Samzhubze, Bainang, and Tingri districts are the centers in western, central, eastern, and southern Xigaze, respectively. In summary, the tourist flow in the Xigaze prefecture is indicated by the structures of “balanced diffusion from the main center or diffusion from multiple centers.” Although Lew and McKercher [
4] indicated that certain tourists prefer time-efficient travel routes, the number of and the attractiveness of the attractions can effectively encourage tourists to extend their exploration in a certain region to achieve a balanced tourism development in different parts of the prefecture.
Table 4 indicates tourist inflows and outflows and the total number of tourist flows in the Lhasa prefecture. The Chengguan district in the Lhasa prefecture can be regarded as a distribution center for tourists, whereas the Nyemo district receives the least tourists among all areas in the Lhasa prefecture. Moreover, tourist flows are concentrated in the Chengguan and Doilungdeqen districts and are scattered in three different directions (i.e., north, west, and eastern parts). Damxung, Quxu, and Maizhokunggar districts represent the North, West, and East, respectively. A paired sample t-test shows that significant differences (
p = 0.094) exist between October 2018 and November 2018 regarding tourist outflows of the Lhasa prefecture. They are significant at the 90% confidence interval. Specifically, the number of tourist outflows of the Lhasa prefecture in November 2018 is greater than that in October 2018.
Significant differences are generally found on the tourist outflows of the Lhasa prefecture, whereas no significant difference is found on tourist inflows of the Lhasa prefecture and the total number of tourist flows. In summary, the tourist flow of the Lhasa prefecture is reflected in the concentrated center with scattering in different directions. In other words, scenic tourist spots (i.e., Potala Palace and Jokhang Temple) in the city center play dominant roles in influencing the overall tourist flow. The tourist flow pattern in the Lhasa prefecture is indicated by the structure of “diffusion from the main center.” The central tourist flow is similar to the findings of Leung et al. [
24], that tourist activities were within the center area of Beijing during the Olympics in Beijing in 2008. However, the tourist flow pattern in Tibet has further expanded in different directions.
Table 5 reveals the number of tourist inflows, outflows, and the total number of tourist flows in the Shannan prefecture. In general, the Nedong district is a central place connecting the western, southern, and eastern parts of the Nyingchi prefecture. This district also has the most tourist flows, whereas Comai has the lowest number of tourist flows. Furthermore, Nedong and its nearby districts receive more tourist flow, whereas the western, eastern, and southern parts receive less tourist flow. Paired sample t-test shows significant differences (
p = 0.020) between tourist outflows and the total number of tourist flows (
p = 0.015) of the Shannan prefecture from October to November 2018. They are significant at the 95% confidence interval. Specifically, tourist outflows and the total number of tourist flows in the Shannan prefecture in November 2018 is greater than that in October 2018.
In general, significant differences are found between tourist outflows and the total number of tourist flows. The tourist flow in the Shannan prefecture is generally indicated by the structures of “clustering from the main center” and “diffusion from a clustered circle.” The identified tourist flow is considered a relatively balanced tourist flow, reflecting the primary flows between core nodes and the secondary flows scattered in different directions. Contemporary urban transportation models assume that the majority of people will take the most efficient route in a tourist destination if possible [
4,
30]. However, the findings of the present study reflect that a region may achieve such a balanced tourist flow by considering the convenience of transportation and the attractiveness of the attractions. Thus, transportation is considered an important factor affecting the spatial distribution of tourist flow [
4,
31].
Table 6 shows tourist inflows and outflows and the total number of tourist flows in the Nyingchi prefecture. The Nyingchi district in the Nyingchi prefecture is a central place that connects the areas in three different directions in the Nyingchi prefecture. The Nyingchi district has the highest tourist flow, whereas Nangxian has the lowest tourist flow. Furthermore, Nyingchi and its nearby districts receive more tourist flows than the districts that are remote to the Nyingchi district. In other words, districts that are far away from the Nyingchi district receive less tourist flows than nearby districts. The paired sample t-test shows significant differences (
p = 0.041) in tourist outflows in the Nyingchi prefecture between October 2018 and November 2018. They are significant at the 90% confidence interval. Specifically, tourist outflows of the Nyingchi prefecture in November 2018 were more than those in October 2018.
Tourist flow is generally concentrated in the Nyingchi district, and the flow is scattered in the western and eastern parts. Gongbo’gyamda and Nangxian districts represent the western direction, and the Zayu district indicates the eastern direction. In contrast to other prefectures, tourist flow in the Nyingchi prefecture is different in attracting more tourist flow in the western part than that in the eastern part. Similar to the tourist flow pattern identified in the Lhasa prefecture, the tourist flow pattern in the Nyingchi prefecture is also indicated by the structure of “diffusion from the main center” but with less tourist flow directions.
In conclusion, from a regional perspective, tourist flow in the western parts is lower than that in the eastern parts of Tibet. Ma and Wu found that the spatial structure of a destination is not in a state of equilibrium, and tourists tend to prefer the products in the eastern part of Xi’an, China [
3]. The total number of tourist flows in different prefectures in November is generally more than that in October 2018. Jin et al. [
10] stated that the tourist flow pattern is characterized by “diffusion from a single center,” “clustering to a single center,” and “balancing between multiple centers.” Findings reveal that the tourist flow patterns of the Nagari, Lhasa, and Nyingchi prefectures mainly belong to the “(diverse) diffusion from the main center.” The tourist flow pattern in Nagqu prefecture extends the identified tourist flow pattern by adding “clustering to the main center” to “diffusion from the main center.” By contrast, Xigaze and Shannan prefectures reflect different tourist flow patterns despite what is identified by previous studies. The tourist flow pattern of the Xigaze prefecture is indicated by “a balanced diffusion from the main center or balancing between multiple centers,” and that of the Shannan prefecture is reflected by “diffusion from a clustered circle.” Furthermore, the tourist flow patterns in different prefectures in Tibet are characterized by primary, secondary, and tertiary flows [
10].
5. Implications and Conclusions
The present study uses the SNA theory to visualize tourist flow and specifically examine tourist inflows, outflows, and the total number of tourist flow, thereby identifying tourist flow patterns in each of the different prefectures in Tibet. The findings show that the Lhasa prefecture has the most tourist flow among other prefectures in Tibet. Specifically, the Lhasa prefecture attracts the largest number of tourist flow, followed by Nagqu, Xigaze, Nyingchi, Shannan, and Ngari prefectures. Similar to the concept of distance decay [
32,
33], the findings of the present study reveal that distance also plays a vital role in determining the amount of tourist flow in Tibet. The overall structure of the tourist flow pattern is spreading from the center to outer parts, and the tourist flow in eastern parts is stronger than that in western parts. Zhong et al. detected regional disparity and found that China’s eastern economic belt continues to have tourism-related benefits [
8]. The present study extends SNA by integrating tourist flow into the movement patterns of tourists to identify tourist flow pattern. The findings of the present study not only provide an overall picture of the tourist flow in a certain region (i.e., Tibet) but also indicate the detailed tourist flow pattern in each of the prefectures in Tibet. Furthermore, they contribute to the literature by providing tourist flow pattern from a regional perspective and extending the identification of the structures of tourist flow pattern identified by previous studies.
The findings of the present study also provide valuable practical implications to tourism practitioners regarding the infrastructure construction of a certain region. Becken et al. [
2] pointed out that the information about international visitor arrivals to New Zealand can provide sufficient information at a geographic level for infrastructure-related decision-making. The findings suggest that the Tibet tourism bureau must consider increasing the tourist flow in the western part to balance the development between eastern and western parts. The Ngari prefecture has the lowest tourist flow. Thus, tourist practitioners must come up with corresponding measures, such as infrastructure construction and transportation consideration, to attract more tourists. Among all different prefectures in Tibet, the Shannan and Xigaze prefectures reflect a relatively balanced tourist flow that helps promote healthy and sustainable tourism development. In other words, “balancing between multiple centers” can be considered to facilitate the balanced tourism and economic development of different areas in a region.
In conclusion, although previous studies have identified either movement patterns or itineraries of tourists [
4,
5], considerations of tourist inflows and outflows are lacking. Hence, the present study identifies the inflows and outflows of tourists in Tibet based on the SNA to provide implications to balance its regional economic development and promote its sustainable tourism development. Tourist flows in different prefectures in Tibet are identified and analyzed by retrieving data generated by the mobile phone signal of China Unicom. The findings show that the Lhasa prefecture is the transportation hub of Tibet. Tourist flow in the eastern part is generally stronger than that of the western part in Tibet. The tourist flow pattern identified for different prefectures in Tibet mainly includes “(diverse or balanced) diffusion from the main center,” “clustering to the main center,” and “diffusion from a clustered circle.” In addition, future studies can be extended to other countries and regions to investigate tourist flow patterns to promote sustainable development by balancing regional economic development. The present study has three limitations. First, positioning-related errors may exist through tracking tourist flow by a mobile signal. In addition, the present study only tracked flow patterns of tourists who used the China Unicom telecommunication service, but those tourists who used other mobile telecommunication companies were not tracked. Moreover, the present study only investigated tourist flow patterns in each of the prefectures in Tibet, and tourist flow patterns that cross different prefectures were not considered. Hence, future research can track the flow patterns of tourists who use different mobile telecommunication companies and compare the differences in tourist flow patterns who use different mobile telecommunication companies. Future studies can further explore the different preferences of tourists from different countries or origins and examine tourist flow patterns that cross regions to provide accurate implications for tourism practitioners regarding regional tourism development.


