1. Introduction
The paradigm shift from a linear to a circular economy represents an opportunity to address different emerging challenges of the 21st century regarding various aspects derived from population growth and resource scarcity in terms of water, energy or even food, as well as the need to transition to a low-carbon economy [
1].
Since wastewater treatment plants (WWTPs) are a nexus for water-waste energy and a fundamental pillar of sustainable development, they play a key role in the implementation of a circular economy. Furthermore, proper development planning for future WWTPs that is coupled with sustainable solutions is an increasing concern. Currently, a paradigm shift is taking place from the concept of ‘wastewater treatment plants’ to that of ‘water resource recovery facilities’ (WRRFs), and increasing interest in next-generation modelling for circular-economy-related processes has been observed [
2,
3,
4]. Specifically, processes related to sewage waste valorisation and energy generation (e.g., anaerobic digestion and biogas production) are major issues to be addressed [
5,
6].
However, socio-environmental challenges regarding circular economy implementation are becoming a major concern. Conventional methods of information gathering and processing to properly support decision-making are becoming highly time- and resource-consuming. Hence, new methods of assessing decision-making processes are required to meet current challenges, such as the rapidly changing environment [
7].
On the one hand, simulation software allows the estimation of the output of problems by varying the process configuration and the input data, hence providing a general framework for the creation of study cases. Simulation-based methods are convenient for representing the behaviour of a real system for further purposes, e.g., fault diagnosis as used for the case of water supply networks in the work of Cugueró-Escofet et al. [
8], but validated actual data and good knowledge of the actual system are required to obtain reliable results. Usually, the output of these processes is summarized in key performance indicators (KPIs). Some examples of modelling practices for WWTPs include energy and mass balance simulation—see, e.g., [
3,
9,
10,
11]—and economic assessment, together with viability analysis, as presented in the work of Montsori et al., for the case of a waste-to-energy system [
12]. However, employing these approaches is resource- and time-consuming, so new, more integrated and automated methods are required for future WWTP planning. Further work is also required to assess the impacts of new technologies and different configurations, develop real case studies and address the uncertainties associated with each Scenario.
On the other hand, decision support systems (DSSs) enhance the decision-making process and allow a higher degree of complex problem solving from a more holistic perspective that usually includes environmental and economic assessments. Examples of the application of DSSs to optimize decision-making regarding WWTPs can be found in recent literature, e.g., [
13,
14]. In addition, DSSs are being developed and validated for specific processes in WWTPs, as in [
15], where Santos-Clotas et al. developed a DSS to optimize the operation of a biogas upgrading facility. In regard to regional-level planning and management, DSSs may be supplemented with further simulation or algorithm-based methods, e.g., in [
16], where KPI-based models were developed to evaluate the performance of different worldwide circular economy implementation projects on a large-scale basis. Additionally, in [
17], a specific network of waste-to-energy pathways was designed and optimized for waste- and biomass-sourced energy carriers. Hence, DSSs have been proven to be useful for process- and plant-level decision-making. In addition, simulation-based methods are interesting for performing studies at the regional level.
In recent years, different projects have been conducted to enhance WWTPs development and demonstrate their achievements with simulation models and pilot plants—see, e.g., [
18,
19]—and have also included different user-adapted DSS tools as a means to compare and highlight the added value of the proposed technologies. Since both simulation- and DSS-based procedures have the potential to overcome challenges in circular economy implementation, DSS coupled with plant simulation is a promising strategy for providing holistic insights from the technical to the strategic levels of decision-making. However, there is a lack of available solutions that fully merge simulation and DSS methods for WWTP planning, mainly due to the lack of available case-study data to carry out extensive simulation and validation studies.
Thus, there is a need for innovative tools to provide assessments of potential technology implementation in WWTPs in order to facilitate their transition towards more sustainable processes. The authors propose and validate such a tool here. The focus has been placed on the implementation of processes related to the sewage sludge line due to their relevance to the circular economy transition. Some studies have focused on WWTP water line technology assessments—see, e.g., [
2,
20]—and there is also increasing interest in the implementation of the circular economy, where WWTP waste management plays a key role. Aside from anaerobic digestion, which is a widely implemented process, other well-known processes that enhance sewage sludge treatment include thermal hydrolysis, which, in turn, sanitizes sludge, allowing it to become a class A biosolid according to the U.S. Environmental Protection Agency (EPA) [
21] and increases anaerobic digestion biogas production. Another process that enhances sewage sludge treatment is drying followed by thermal valorisation of the final sludge cake, which allows a substantial reduction in waste production and increases energy recovery, which is usually consumed in the prior drying process. Although these processes are well known, there is still a lack of tools to provide holistic assessments of the combination of sewage sludge processing technologies.
Hence, the objective of this paper is to develop and validate with real case-study data a WWTP simulator coupled with a DSS, using a hierarchical KPI approach to the case-study assessment focused on sewage sludge valorisation processes. The combination of these methods will allow extended and automated performance studies of the different strategies for sludge management and their corresponding technology configurations in real case studies. This will provide a substantial enhancement to the decision-making process for optimum circular economy strategy implementation through the selection of the best-fitting sewage sludge valorisation strategies and will also improve the management of all the required decision-making data of the whole wastewater treatment system under study.
2. Materials and Methods
In the study described by Castillo et al. [
14], a comprehensive guide to DSS design can be found. The usual steps of DSS development are as follows: (1) problem analysis (i.e., stating the objective and both the conceptual and the physical system frameworks), (2) data and knowledge acquisition, (3) cognitive analysis, (4) model selection, and (5) model implementation.
2.1. Problem Analysis
Regarding problem analysis, four tasks must be performed: (a) determine the objective of the tool, (b) determine what data are required for input into the tool, (c) determine what data are available from the system under study and (d) determine what procedures are required to fulfil the objective based on the available data and their properties (these are generic methods only and will later be the foundation for model selection and implementation).
The objective of the tool presented here is to provide an assessment of sewage sludge valorisation processes in a real sanitation system. The data required for the assessment are time-series of KPIs designed ad hoc by the authors and based on common drivers of the wastewater sector for the wastewater sector, with a focus on waste and asset management aspects [
22,
23]. Data on the mass, energy, nutrient, pollutant emissions (as equivalent CO
2 kg) and economic balances are needed, and parameter estimations are required to characterize the performance of each evaluated technology.
2.2. Data and Knowledge Acquisition
Raw data were acquired from operational measurements and analyses performed by operators of each WWTP and were available from an internal server database. The datasets were automatically imported and adapted to the format required by the tool. Each dataset was categorized by system—i.e., by WWTP—and year, and comprised 38 measures (as shown in
Table 1). Hence, data input management was standardized in timestamp matrices of 38 columns and 365 rows—i.e., 1 row per day—for each WWTP included in the simulation.
Information was acquired through interviews with operators and managers related to the sanitation system under study, as well as through extensive analysis of the literature. This information was used to characterize the simulation processes related to each technology included in the simulation (both conventional and innovative technologies). Inputs, outputs and potential KPIs were identified for each simulated process (for more details, see the ‘Model Implementation’ section).
2.3. Cognitive Analysis
The acquired knowledge from the previous step (‘Data and knowledge acquisition stage’) was used in combination with the stated objective and requirements of the tool. A KPI hierarchy was designed by the authors, based on common drivers of the wastewater sector, and a level of hierarchy was assigned to each indicator. KPIs have been used as a means to process a wide variety of information regarding different aspects of WWTP impacts, costs and benefits for each of the potential Scenarios and to characterize the performance of the most relevant functions (such as energy consumption, nutrient mass balance and process stability. The hierarchy of the KPIs was designed with three levels, namely: the top level, including five KPIs that are envisioned as helping decision-makers at a regional scale, i.e., considering the impacts of new WWTP development and planning for the sanitation system; the intermediate level, including 14 KPIs dedicated to decision-maker assessments at the WWTP level; and the lower level, with 19 KPIs that gather most of the daily information required by operators in order to properly supervise the daily performance of the WWTP and detect anomalies or abnormal tendencies. For further information about each KPI, see
Table 2.
The KPIs from the top level—i.e., Layer 1—are designed to agglomerate all the issues concerning the concept of sustainability. Specifically, KPI L1_1 (viability index) corresponds to the equally weighted and normalized sum of the other four KPIs in Layer 1, and attempts to condense the most relevant KPIs regarding top-level decision-making (it is assumed that all of the KPIs involved are highly relevant to guarantee project viability, which is why they are equally weighted). The material circularity index (KPI L1_2) indicates how much material—e.g., fuels, nutrients, metals—is recovered compared to the theoretical maximum recoverable amount. The energy self-sufficiency index (KPI L1_3) quantifies the sum of all energy consumed against that produced by the same system, without differentiating the energy type—i.e., electrical or thermal. The risk and impacts index (KPI L1_4) is designed to condense the information from the KPIs of the lower levels—i.e., Layer 2 and Layer 3—and indicates how many of them show values that exceed normality. The economic assessment index (KPI L1_5) describes the economic balance, basically through the calculation of the net present value (NPV). Note that further amortisation beyond the correspondent technology lifespan used—i.e., 10 years—has not been considered. The design of the KPIs in Layer 2 and Layer 3 is based on commonly used performance indicators for WWTPs, as indicated in [
24,
25].
2.4. Model Selection
The methodology presented here is based on a simulation model, with KPIs as outputs. Each Scenario corresponds to a WWTP and its corresponding dataset with a specific technology configuration (either the current configuration or another that includes new processes). The simulation model comprises mass, nutrient and energy balances for each process of the sewage sludge line (similarly as in the works of Fernández-Arevalo et al. and Carlsson et al. [
3,
10]), raw emissions estimates and economic assessments (for the latter, NPV was calculated assuming a 4% discount rate and a lifespan period of 10 years). Performance parameters are required to properly simulate some processes and were estimated from existing data or theoretical estimations. The raw input to this simulation method consists of the different physical, chemical and energetic inputs and outputs of each process. The KPIs were computed from this raw input and other input data, e.g., stoichiometric and process parameters, economic pricing of commodities and disposal costs (which are determined for each case study and whose values used for the present study can be seen in the ‘Case study’ section).
2.5. Model Implementation
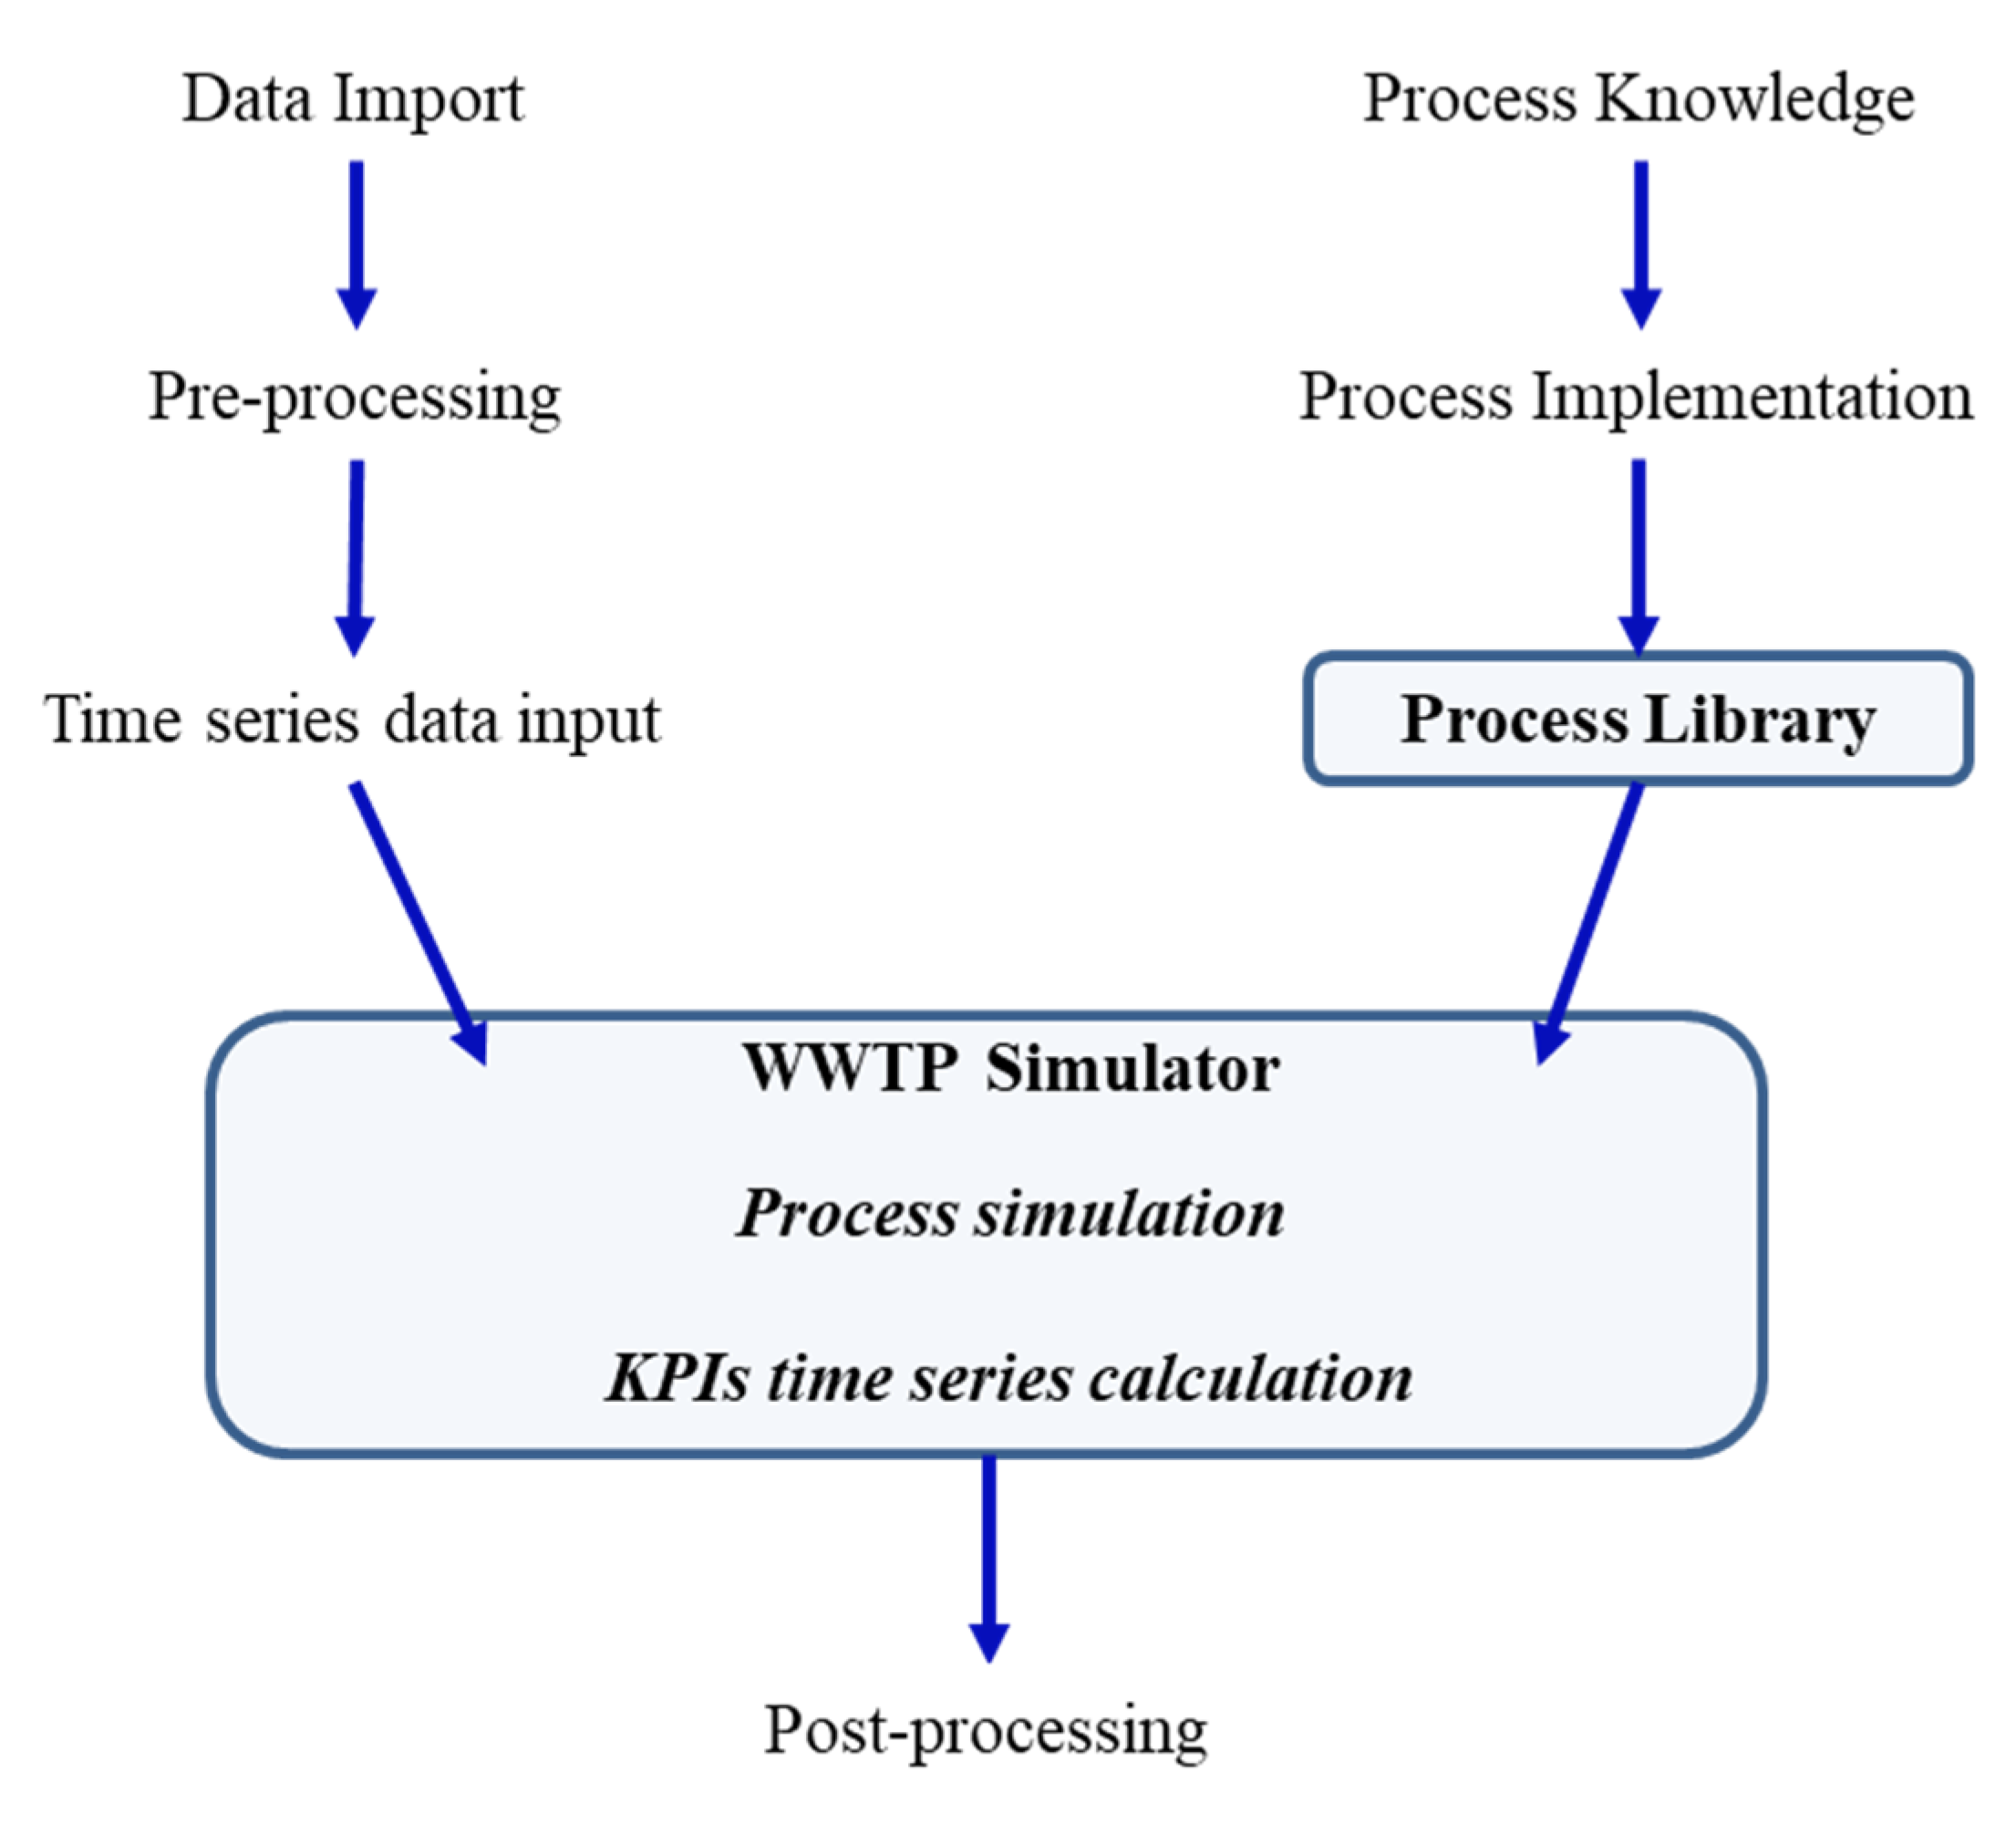
The model presented here was implemented in a software tool developed in MATLAB-SIMULINK. MATLAB is a widely used numerical computing and programming platform at many research institutions and organisations, which makes it a convenient prototyping and development framework. SIMULINK is a visual programming environment that allows the integration of MATLAB code. This suits the purpose of the tool presented here, which aims to develop a set of toolboxes for each of the processes considered in its development. Hence, the simulation model was integrated into the SIMULINK environment, a visual programming environment in which each process considered was implemented as a system block (i.e., a self-contained unit of code related to at least one process of the system). A tailored process library was created with these process building blocks.
The aim of the DSS–WWTP simulator tool is to provide an assessment for different combinations of existing or potential technologies by simulating each Scenario and assessing the performance of the WWTP with the KPIs. Thus, the use of a library for the different implemented technologies and the KPIs as the output of the simulation for assessment is a core feature of the presented tool. Overall, the developed DSS–WWTP simulator has two main modules: the process library and the WWTP simulator. The WWTP simulator module includes two submodules, namely, the process simulation and the KPI calculation. The scheme of the presented tool and its modules is summarised in
Figure 1.
The data import phase involves the extraction of raw data (in a daily time-series format) from WWTP practitioner databases. The pre-processing phase involves data conditioning techniques to adapt gathered data to the format required by the MATLAB platform (the time-series data input format) such as integration, sorting and validation. On the other hand, process knowledge refers to the collection of information related to the performance and the basic concepts regarding each of the processes involved in the simulated system (i.e., the processes involved in a WWTP). Process implementation refers to the coding of the real processes in system blocks.
The process library includes each WWTP process that is implemented in the simulation tool, as in the following procedure: first, identification, definition and classification of all unit operations of the WWTP are performed, as well as a qualitative determination of the corresponding key added value of each unit to the overall performance, according to conventional standards described in [
24,
25]. Second, a set of technological options are determined for each unit operation (including the non-implementation alternative for the corresponding operation unit). Then, for each technological option (of each unit operation), the process inputs and outputs are determined. Finally, for each process input and output, the minimum significant parameters are identified, as well as whether they are available for each WWTP to be simulated; if they are not available, their computation by estimation, stoichiometry, mass balance assumptions or other mathematical approaches is considered, taking into account that parameters with relatively high variability or time-dependent deviations will be measured and not assumed as constant values.
The current version of the developed tool presented here consists of four unit operations. Each of these four unit operations considers one of their most representative technologies (the ones already implemented at full scale and well known across the wastewater sector) and, by default, they also consider their absence. This way, simulations can be done with different configurations of technologies (i.e., different WWTP process layouts) resulting from the combination of each one of these technologies, and also enables the possibility of neglecting the use of one or more of these unit operations to design the Scenarios.
The four unit operations of the tool under study are sludge conditioning, sludge drying, sludge thermal valorisation and biogas valorisation. The first three each have one technology implemented: thermal hydrolysis (TH), conventional sludge drying (SD) and thermal valorisation (TV), respectively. These selected technologies are representative of each of their corresponding unit operations, and the possibility to neglect the use of these technologies is included. For example, each Scenario can consider TH or not, in which case it is represented as NP (No Pretreatment) instead of TH; for the cases of SD and TV, their correspondent counterparts that reflect the absence of such technology are noted as ND and NTV, respectively.
Biogas valorisation involves two different technologies: biogas cogeneration (BC) and biogas upgrading (BU), but the possibility of neglecting biogas valorisation (i.e., including in the simulation a ‘no biogas valorisation’) is not considered. The implementation procedures for each of the aforementioned technology options (i.e., TH, SD, TV, BC and BU) are shown in
Table 3,
Table 4,
Table 5,
Table 6 and
Table 7, respectively. Note that anaerobic digestion (if present, which is the case of the case study) is modelled according to the data from each case study (as shown in
Table 1).
The WWTP simulation module consists of a basic WWTP simulation scheme containing selected processes drawn from the process library. A Scenario is created once the data inputs and the WWTP configuration (generated by combining the WWTP simulation scheme with the selected library processes) are established. Therefore, for a WWTP, each Scenario consists of its corresponding data set (shown in
Table 1) and the overall configuration of the building blocks of the simulation scheme created from the basic blocks and the processes selected from the process library.
The KPIs are calculated and ordered as shown in
Table 2 for each of the simulated Scenarios based on the different parameters of the simulation (the inputs and outputs of several of the processes involved). Validation tests of this tool were carried out with a real WWTP as a case study.
3. Results
3.1. Case Study
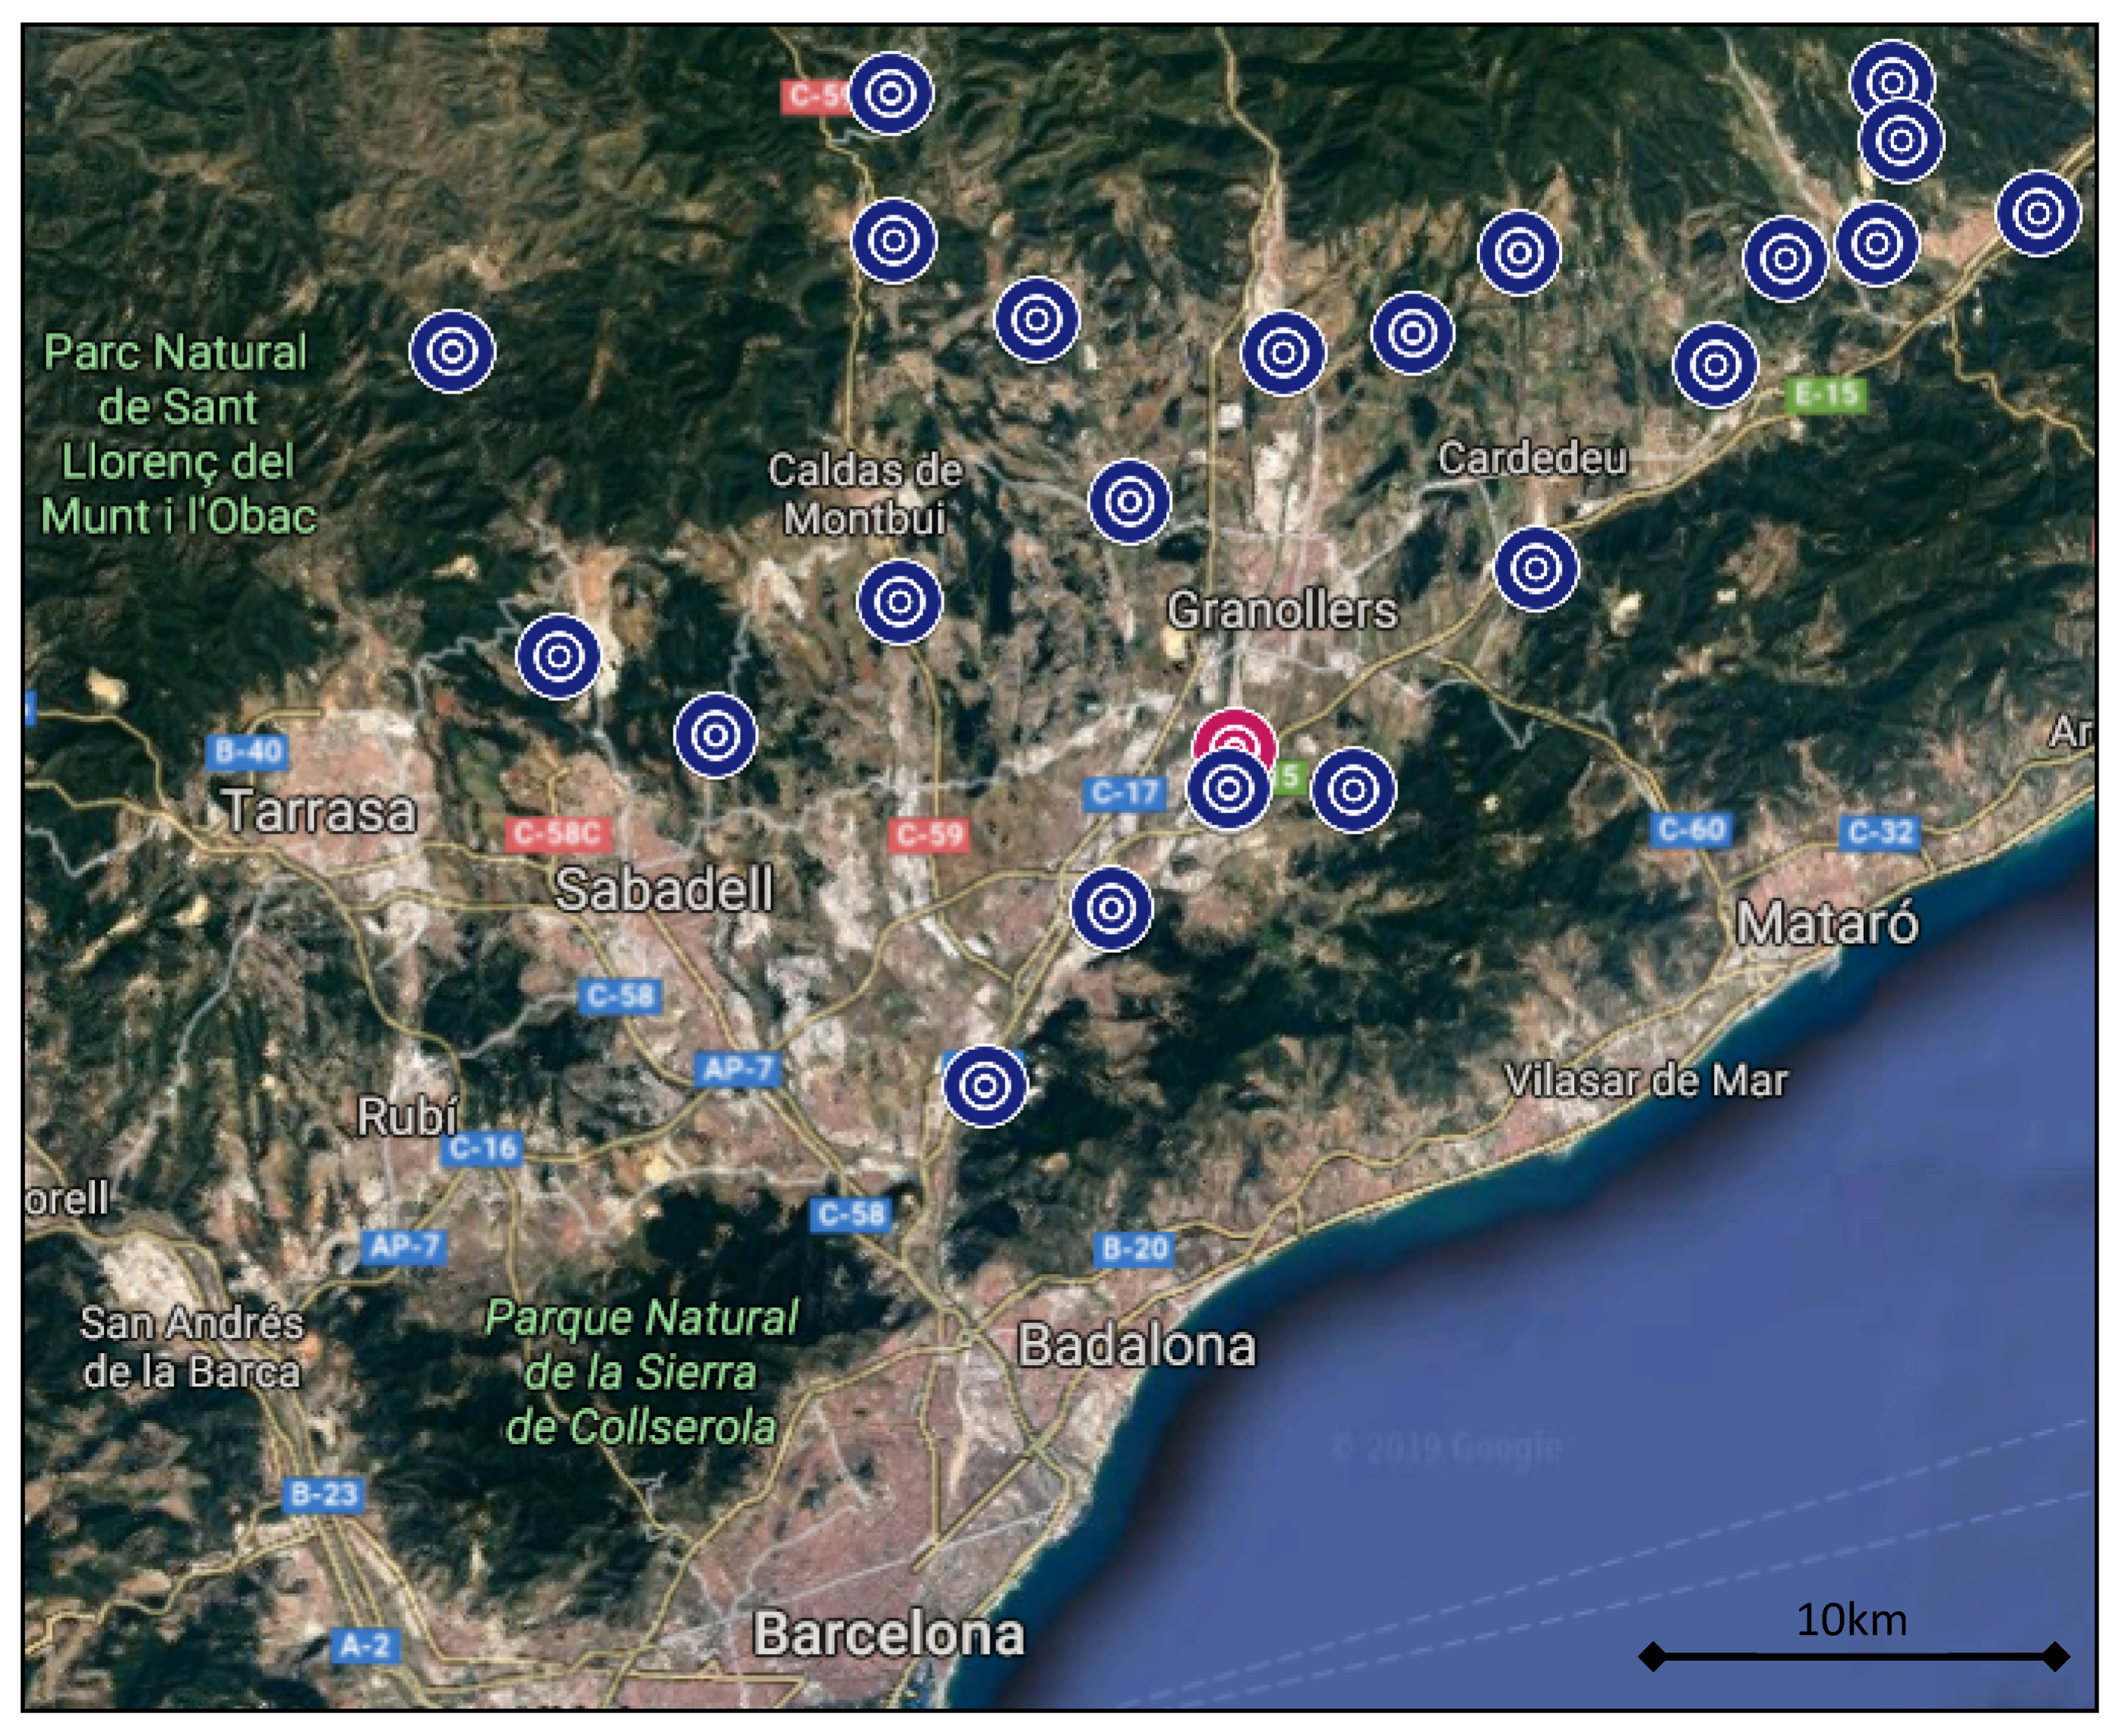
The proposed tool was tested with a case study WWTP of a real sanitation system comprised within the Consorci Besòs Tordera (CBT) environment. CBT is a public local water administration composed of 64 municipalities in four different regions of Catalonia (Spain) with a population of approximately 470,000 inhabitants that manages 26 sanitation systems. The area served by these WWTPs features a contrast between high-anthropic-pressure areas (urban and industrial, relatively close to the metropolitan area of Barcelona) and other rural areas.
The WWTPs managed by CBT have a treatment capacity ranging from 1000 to 30,000 m
3/d, and they are located in the northern region of Barcelona, specifically in the upper parts of the Besòs River basin and the Tordera River basin.
Figure 2 shows a map of the WWTPs of the sanitation system. Specifically, in this work, the DSS–WWTP simulator tool was tested in the Granollers municipality’s WWTP (GR WWTP), which is one of the most representative WWTPs from the 26 sanitation systems of CBT due to its treatment capacity and the high anthropogenic impact of its wastewater.
Eight Scenarios were simulated for the GR WWTP, created by combining the unit operation technologies shown in
Table 3,
Table 4,
Table 5,
Table 6 and
Table 7.
Table 8 lists each Scenario and its corresponding configuration. Note that thermal valorisation (TV) is always considered together with sludge drying (SD) because the latter is a required process before enabling sludge thermal valorisation; on the contrary, sludge drying is not considered without thermal valorisation in this case study.
To perform economic analysis, NPV (i.e., KPI L1_5) was calculated for Scenarios 2–8. Their correspondent cash flows already account for savings expected in comparison to Scenario 1 cash flow (the current plant layout). Based on data gathered from interviews with expert consultants of the processes involved, an investment cost was approximated for each technology: 4,000,000 € for both thermal valorisation and sludge drying processes (TV and SD, which will be considered simultaneously in this case study, as shown in Scenarios 2, 4, 7 and 8); 5,000,000 € for biogas upgrading technologies; and 3,000,000 € for thermal hydrolysis technologies. In addition, to complete the cost–benefit analysis, costs were assigned to each different waste generated according to cost trends of the last years in Catalonia: for dehydrated sludge, 50 €/ton; for ashes (obtained after sludge thermal valorisation), 80 €/ton; and for other minor wastes, such as those from the pre-treatment of the water line, 80 €/ton. Additionally, an electricity price of 0.1005 €/kWh was assigned for electricity consumption of the case study. To perform the economic assessment (i.e., KPI L1_5), the NPV was calculated using the aforementioned data, assuming a discount rate of 4% and a time period of 10 years. Note that inversion costs considered to calculate the NPV are related only to technology acquisition and installation, without further including additional costs related to required adaptations of the WWTP to the new technologies.
3.2. Scenario Comparison
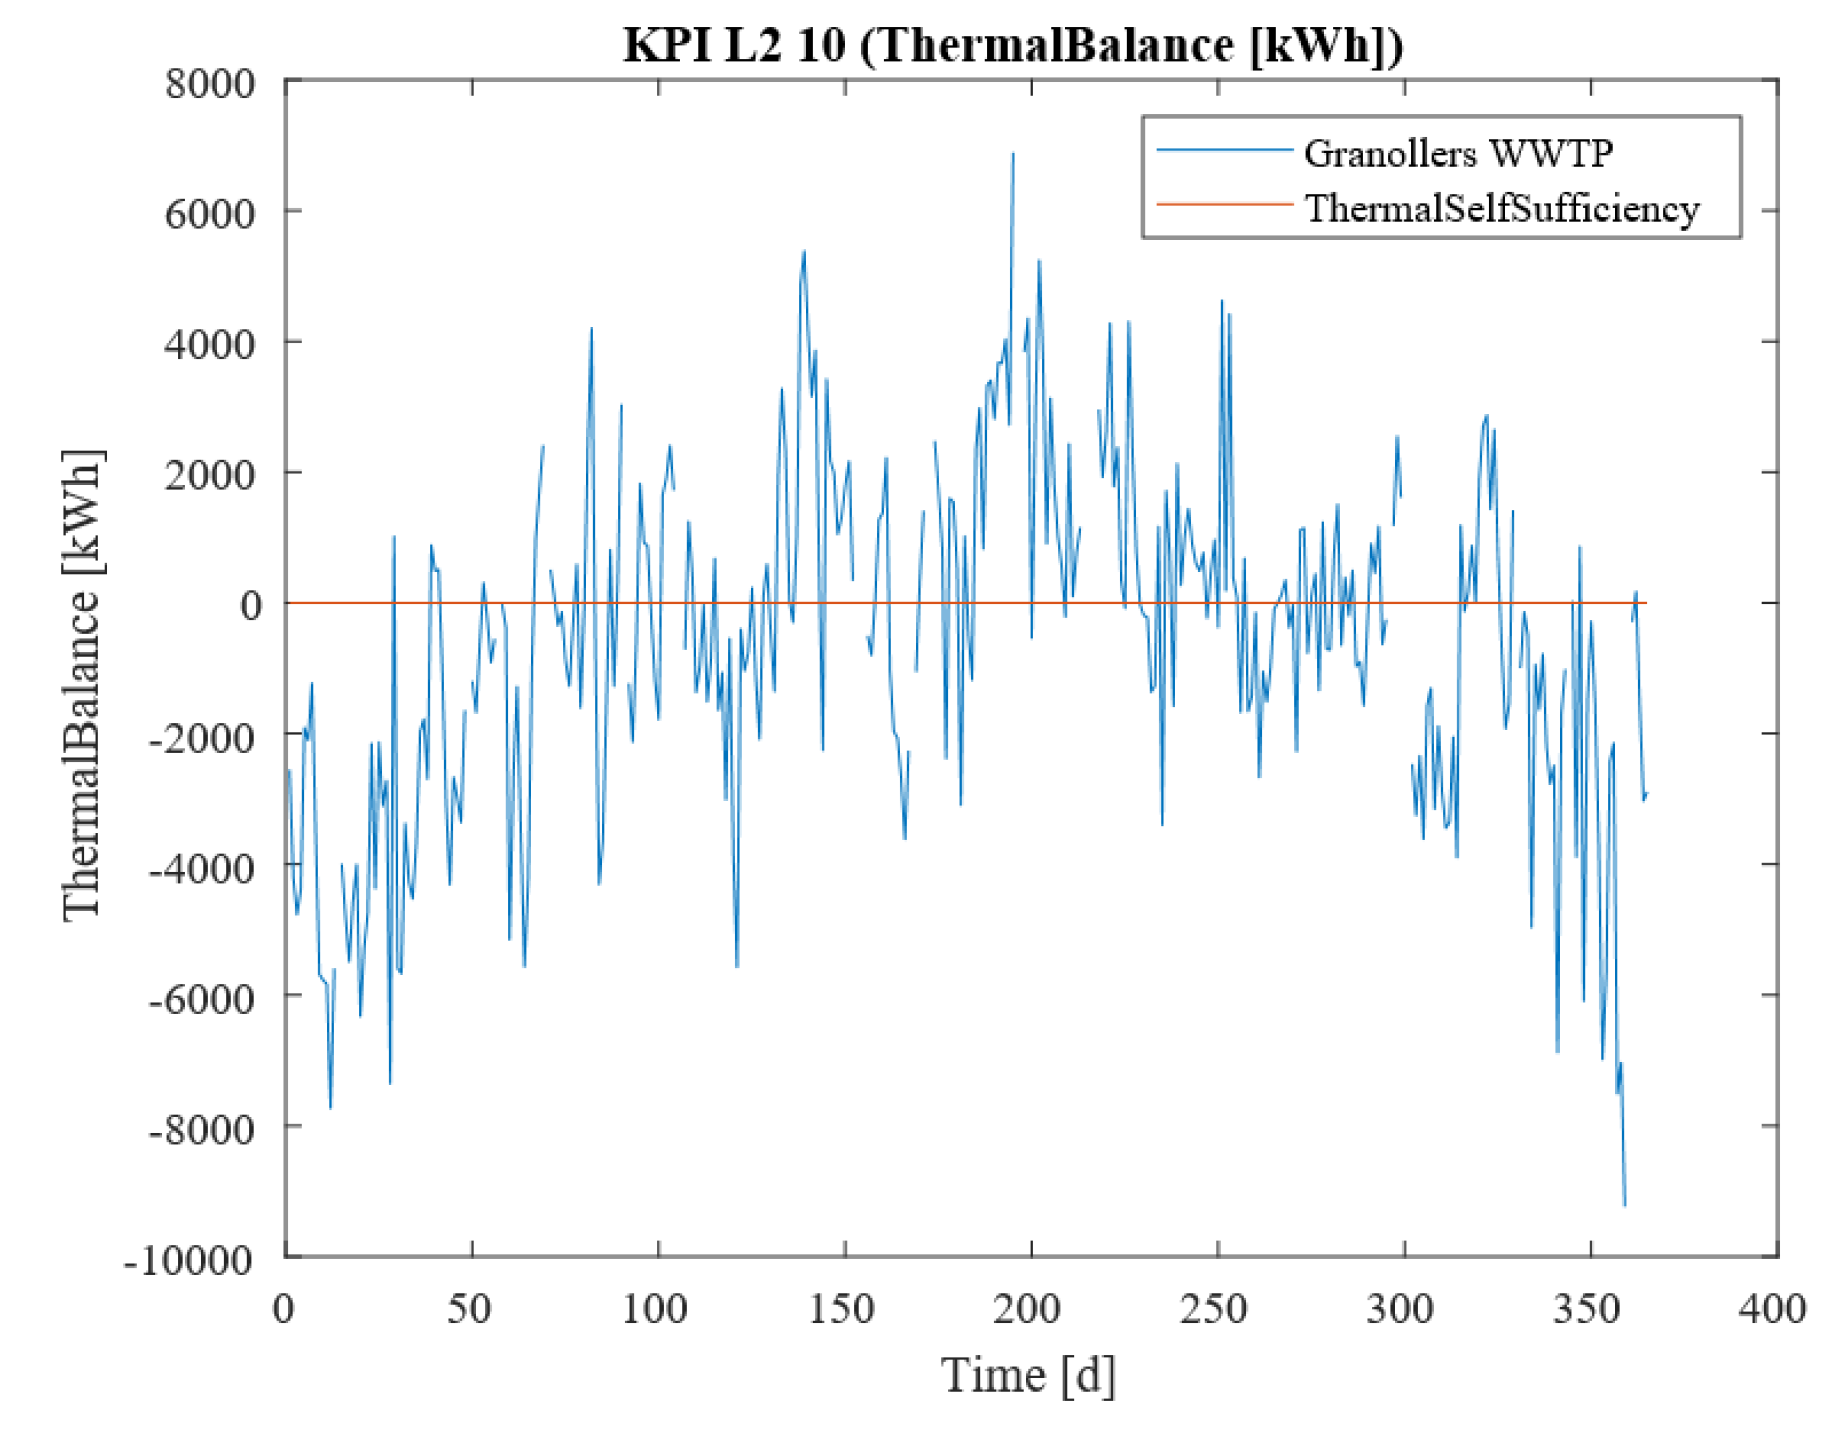
The application of the DSS–WWTP simulator tool to the eight Scenarios in the case study of the representative GR WWTP in the CBT environment allowed the integrated assessment of each of the technologies involved in the simulation via pair-wise comparison. Scenario 1 includes the technologies corresponding to the current configuration of the real GR WWTP (that is, the control Scenario). Note that since Scenario 1 does not include any investment cost, its NPV is not expressed when calculating KPI L1_5. The results are shown as annual averages with their corresponding deviations. However, the presented tool also allows us to show KPIs as a time series, as shown in
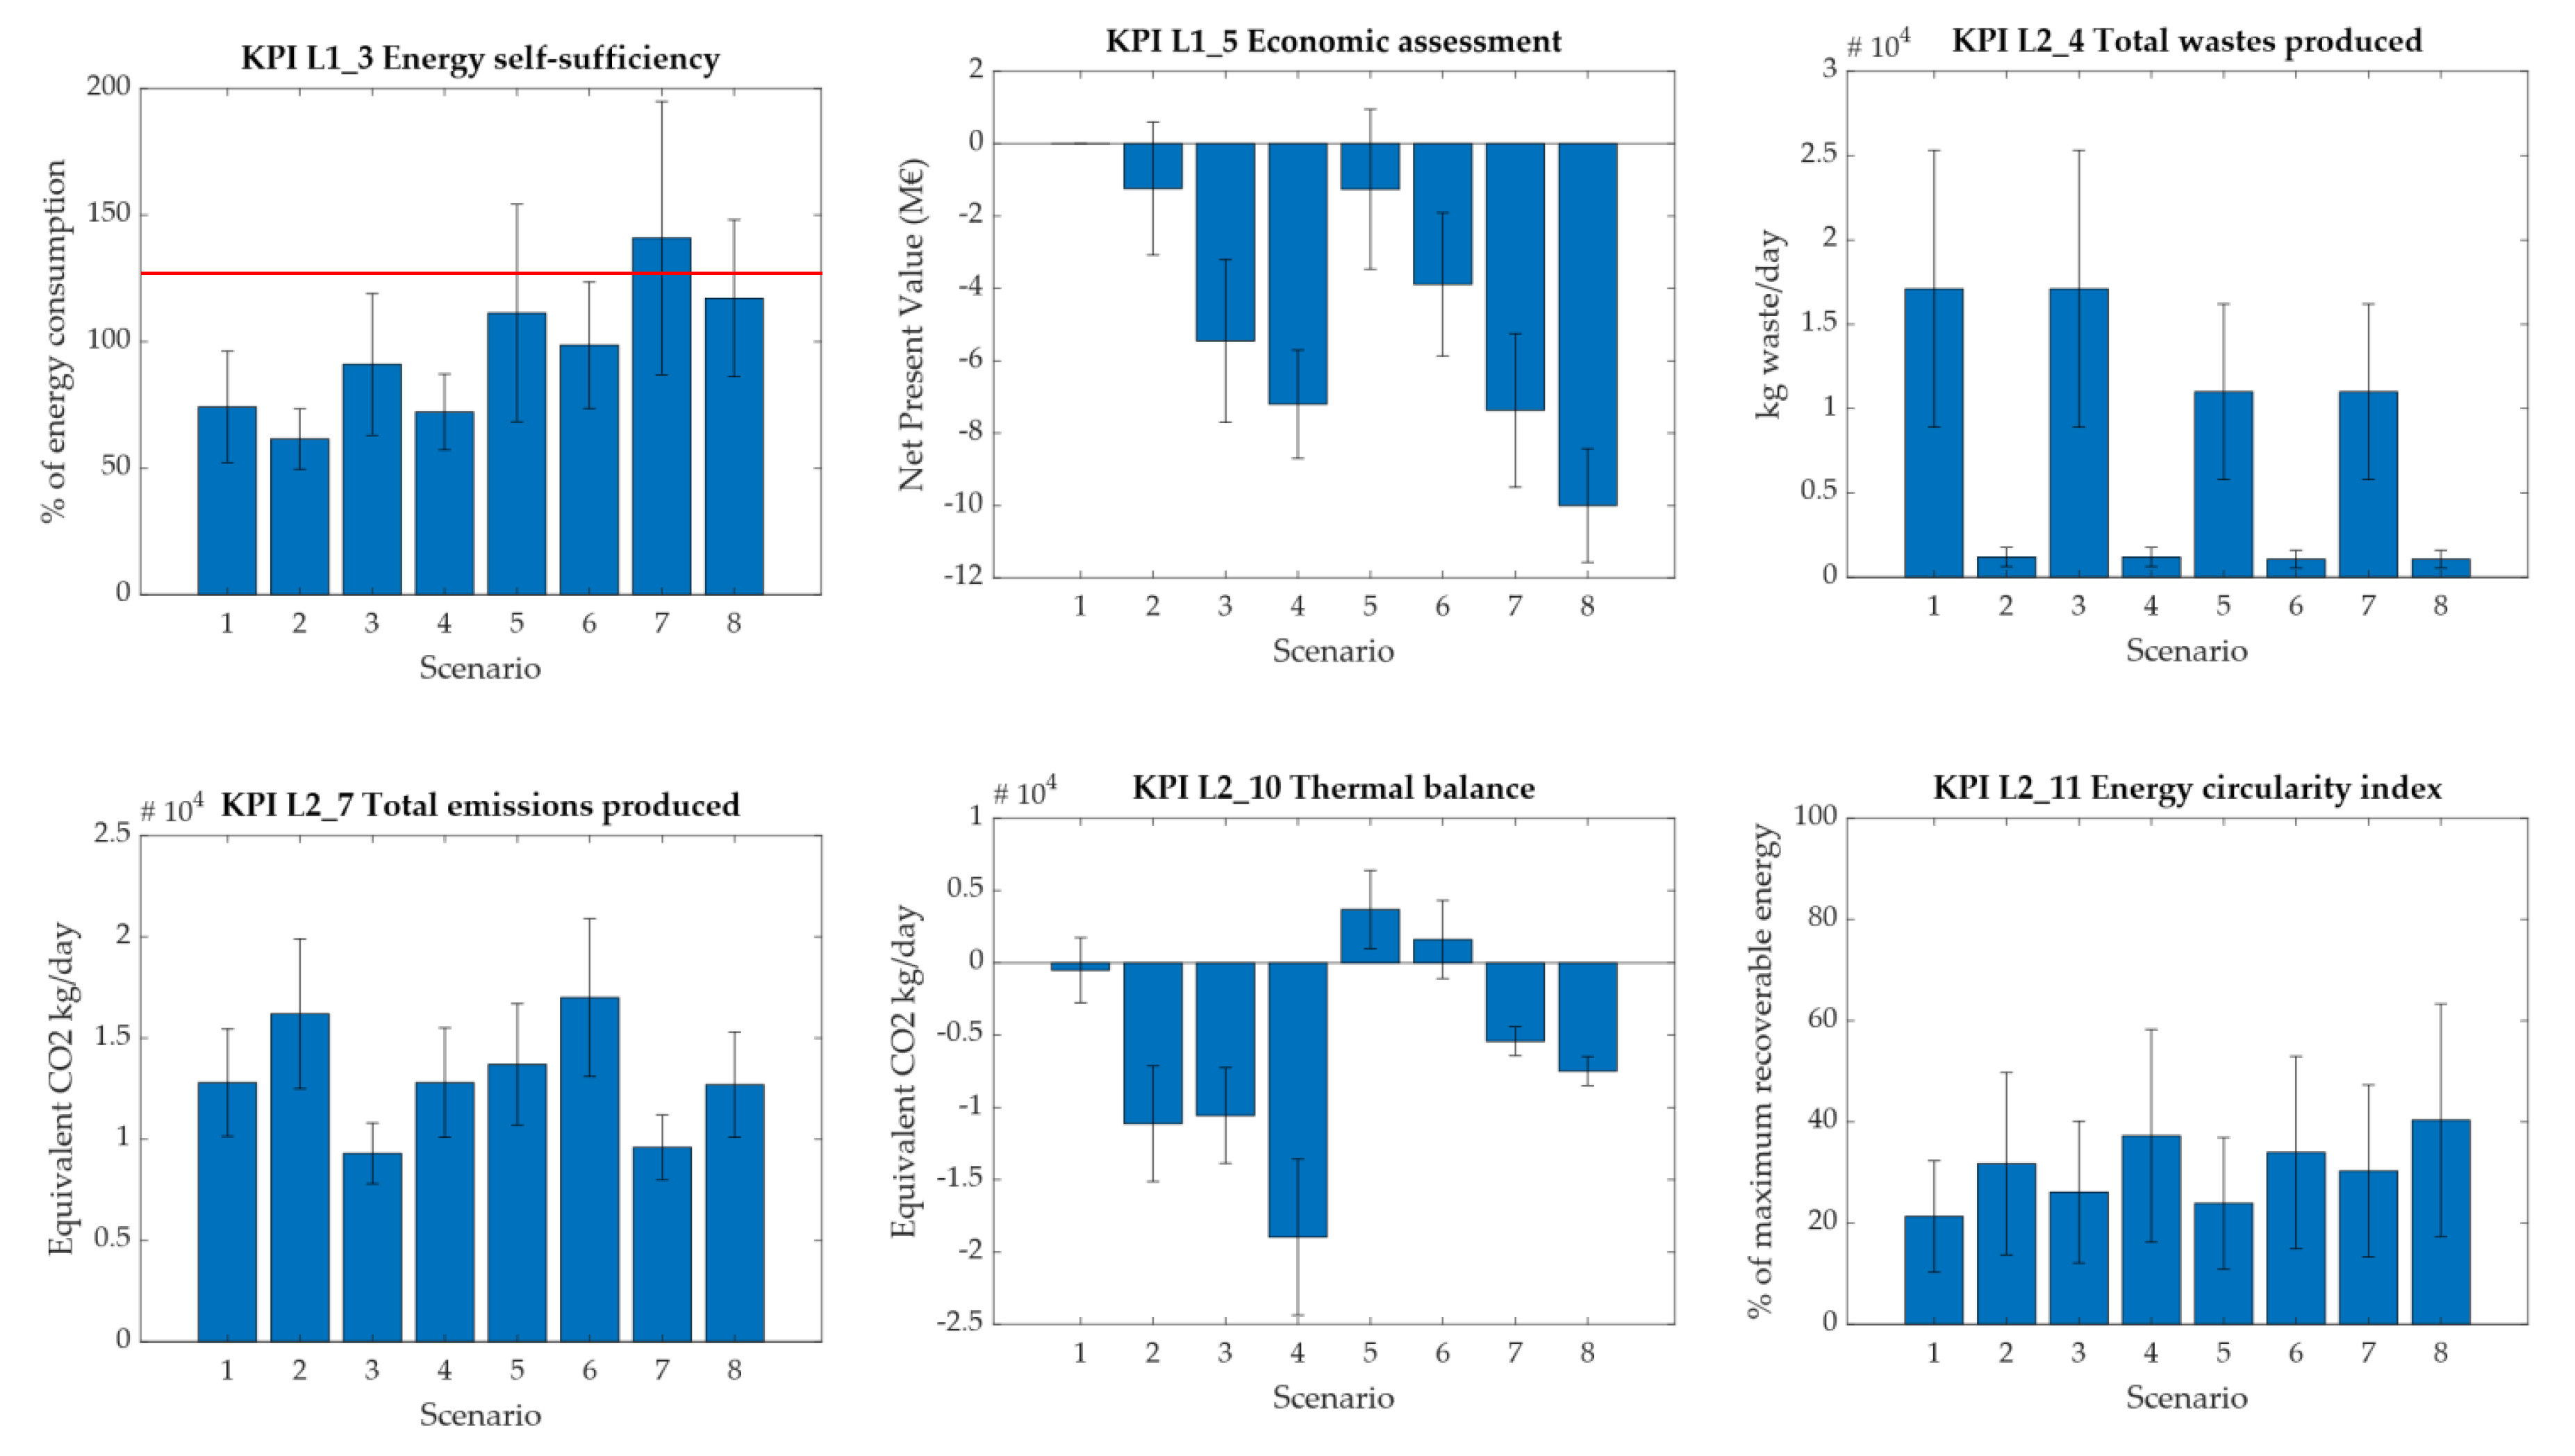
Figure 3. For the sake of brevity, in this work, an array of six representative KPIs was selected from the full list to simplify data analysis and discussion, as shown in
Figure 4.
The results in
Figure 4 show that there are large deviations (accounting for 20–50% of most KPIs), compared to the standard tolerance margin of 10% deviation that is applied for real plant measurements. This is probably because average annual data were used. It is important to highlight that KPI L2_10 (thermal balance) shows different deviations in each Scenario, since it is strongly affected by the temperature and, thus, by seasonal variations within the corresponding year.
Only Scenario 7 seems to be clearly energy-positive, since KPI L1_3 indicates that the energy produced exceeds 100% of the energy consumed; Scenario 5 would also seem energy positive, but its associated variabilities are significantly high, reaching a minimum of 70% energy self-sufficiency. Besides, note that this KPI refers to both electricity and heat balances. The economic balance (i.e., KPI L1_5) indicates that Scenarios 2 and 5 have the best NPV results (about −1.2 M€ each).
As shown by KPI L2_4, waste production was drastically reduced in Scenarios with thermal valorisation (that is, Scenarios 2, 4, 6 and 8, where a reduction of approximately 90% was achieved). Scenarios 5 and 7 also allow waste production reductions of up to approximately 30%. The trend observed for total CO2 equivalent emissions (KPI L2_7) seems to favour Scenarios 3 and 7 (which show 30% lower emissions than Scenario 1) and penalize Scenario 6 (with an emissions increase of approximately 30% compared with that in Scenario 1).
KPI L2_10 may be interpreted as the overall average thermal balance over a year. Thus, its deviations can be interpreted as the upper and lower ranges of thermal balance for the hottest and coldest seasons of the year, respectively. Scenario 1 shows a thermal balance around thermal equilibrium (the zero mark), with a lower deviation range dipping into the negative zone (up to approximately −2500 kW/day). This indicates that during the coldest seasons of the year, the current GR WWTP (as its current technology is represented in Scenario 1) might have a thermal demand of approximately 2.5 MWh/day. Only Scenarios 5 and 6 show a positive thermal balance (thus having excess thermal production). Scenarios 2, 3, 4, 7 and 8 clearly show negative thermal energy balances, accounting for 11,100, 10,600, 19,000, 5400 and 7500 kW/day, respectively.
Finally, KPI L2_11 shows how much energy may be recovered by the plant itself compared with the maximum theoretical thermodynamic energy recoverable from the organic matter input to the plant. As a general trend, Scenarios 1 and 5 show the lowest energy recovery ratios (approximately 22%), while those Scenarios with sludge thermal valorisation (i.e., Scenarios 2, 4, 6 and 8) allow around a 50% greater energy recovery (around 30–35% total energy recovery). The average energy recovery for Scenarios 3 and 7 is in between these values (around 25–30%). However, note that for this specific KPI, all Scenarios have deviations of approximately 50% of the average value. Thus, only qualitative comparisons are viable.
3.3. Technology Comparison
The potential impacts of each technology in the selected KPIs are determined in this section with a pairwise comparison strategy. Since each Scenario is affected by a combination of multiple technologies, each with its own effects on the KPIs, the pairwise comparison allows us to discern the effects of each technology. However, KPI L2_10 is not included in the tables in this section because its values are discussed based on the minimum and maximum values attained for thermal balances as shown in
Figure 4. Note that NPV of Scenario 1 is not accounted for because it does not involve any inversion costs (instead, the annual cash flow used to calculate the NPV of the other Scenarios corresponds to the differential with that of Scenario 1).
Table 9 summarizes the results for each pair of Scenarios with and without thermal valorisation. The Scenarios with thermal sludge valorisation (i.e., Scenarios 2, 4, 6 and 8) show (compared with their counterparts, i.e., Scenarios 1, 3, 5 and 7, respectively) a decrease in energy self-sufficiency (KPI L1_3) ranging from −10% to −25%; a decrease between 35% and 200% in the NPV value (KPI L1_5) is achieved (i.e., higher costs); a decrease of 90% in waste production (KPI L2_4); an increase in emissions (KPI L2_7) ranging from 25% to 35%; and an increase in the total energy recovered ranging from 40% to 50% (KPI L2_11). For the thermal balance (KPI L2_10), for Scenario pairs 1–2 and 3–4, there is an increase in demand of 10,600 kW/day and 8400 kW/day, respectively; on the other hand, for both Scenario pairs 5–6 and 7–8, the thermal demand increases by 2100 kW/day for each of those pairs.
Table 10 summarizes the results for each pair of Scenarios with and without biogas upgrading. The Scenarios with biogas upgrading technologies (i.e., Scenarios 3, 4, 7 and 8) show (compared with their counterparts, i.e., Scenarios 1, 2, 5 and 6, respectively) an increase in energy self-sufficiency (KPI L1_3) ranging from 15% to 30%; a decrease of NPV (KPI L1_5) ranging around 160% to 480% (i.e., higher costs); no change in waste production (KPI L2_4); a decrease in emissions (KPI L2_7) ranging from 25% to 30%; and an increase in the total energy recovered ranging from 15% to 30% (KPI L2_11). For the thermal balance (KPI L2_10), for Scenario pairs 1–3 and 2–4, there is an increase in demand of 10,000 kW/day and 7800 kW/day, respectively; however, for both Scenario pairs 5–7 and 6–8, the thermal demand increases by 9100 kW/day.
Table 11 summarizes the results for each pair of Scenarios with and without thermal hydrolysis. The Scenarios with thermal hydrolysis (i.e., Scenarios 5, 6, 7 and 8) show (compared with their counterparts, i.e., Scenarios 1, 2, 3 and 4, respectively) an increase in energy self-sufficiency (KPI L1_3) ranging from 50% to 60%; a decrease of NPV (KPI L1_5) ranging from around 35% to 210% (i.e., higher costs); a decrease between 10% to 35% in waste production (KPI L2_4); an increase in emissions (KPI L2_7) ranging from 0% to 15%; and an increase in total energy recovered ranging from 5% to 15% (KPI L2_11). Regarding the thermal balance (KPI L2_10), for Scenario pairs 1–5 and 3–7, there is a decrease in demand of 4200 kW/day and 5100 kW/day, respectively; however, for Scenario pairs 2–6 and 4–8, the thermal demand decreases by 12,500 and 11,300 kW/day, respectively.
4. Discussion
The presented tool has the purpose of performing holistic Scenario analysis by considering the impacts, costs and benefits of the implementation of new processes by means of KPI analysis. In addition, the hierarchical organisation of the KPIs in three decision-making layers or levels is meant to provide rapid Scenario analysis based on the priorities of the decision-maker. For example, if the implementation of a new process should be more focused on, e.g., the technical and performance aspects of critical WWTP functionalities, then the KPIs in Layer 2 and Layer 3, i.e., the plant and process levels of decision-making, respectively, should be given more importance when drawing conclusions.
The use of daily measurements as input data and the nature of the implementation of the simulation model allow a daily timeline of each KPI to be obtained for each Scenario, as shown for the KPI L2_10 in
Figure 3. This feature enables further time-dependent (e.g., seasonal) analysis. However, in this work, major trends based on overall yearly data were determined for the real case study to simplify data analysis and discussion.
It is important to highlight that further combinations of these Scenarios can be performed and are important for identifying the appropriate implementation combination for the processes according to the criteria applied for each case study. One of the main motivations to develop the presented tool revolves around the circular economy, with a special focus on the optimisation of waste management strategies and the sludge line of WWTPs to improve their overall performance. Hence, the tool provides value and applicability for decision support in real facilities.
Scenarios with thermal hydrolysis (i.e., Scenarios 5, 6, 7 and 8, respectively) might allow WWTPs to increase their current percentage of energy self-sufficiency by a relative 50–60% (note that it is a relative increase in relation to the original percentage of this KPI, instead of an absolute percentage point increase), allowing, for the case of Scenario 8, a seemingly energy-positive WWTP to be reached. If the most energy-positive WWTP with minimal economic costs is desired, Scenario 5 would be the most suitable (although it presents an NPV of −1.2 M€ and its energy self-sufficiency has significant variability). Hence, the implementation of thermal hydrolysis before anaerobic digesters and thermal valorisation (the layout implemented in the WWTP simulation model) would be the best-studied setup for achieving a potentially energy-positive WWTP according to the method presented.
As a general trend, thermal valorisation Scenarios (i.e., Scenarios 2, 4, 6 and 8) present major benefits in terms of waste reduction but also present the highest emissions increases (by 25% to 35%), with some of the most demanding thermal energy balances. However, they also present the highest values of the energy circularity index (KPI L2_11) since thermal valorisation allows major energy recovery from sewage sludge’s organic matter. Despite the remarkable energy recovery achieved in these Scenarios, higher amounts of energy are also required to sustain the whole process (especially due to heat demand to dry sludge before its thermal valorisation). However, combined thermal valorisation of sewage sludge with other external organic fuels (such as those from green biomass) might enhance the energy balance of the thermal valorisation process (a strategy that has not been addressed in this work).
It is important to highlight that thermal hydrolysis combined with thermal valorisation (Scenarios 6 and 8) presents a synergy from an energy optimisation perspective (since it reduces the need for thermal energy demand, thus increasing energy self-sufficiency compared to Scenarios 2 and 4, respectively). Actually, thermal hydrolysis seems to neglect the reduction in thermal energy demand from the implementation of thermal valorisation when comparing Scenario pairs 5–6 and 7–8, where thermal balance demand just increases by about 2100 kW while, for the analogous thermal valorisation implementation (Scenario pairs 1–2 and 3–4), thermal demand increases by 10,600 and 8400 kW, respectively. Hence, if energy recovery maximisation is a priority, Scenarios 7 and 8 would be the most applicable, but they would come at a significant cost (with NPV values around −7.4 and −10.0 M€, respectively).
On the other hand, biogas upgrading is a well-known process that has been studied in many recent works due to its better performance than co-generation in biogas valorisation; see, e.g., [
15,
26]. The efficiency of this process is shown in Scenario 3: it allows an increase in the energy recovery of 15–30% and an emissions reduction of 25–30%. However, the economic cost increases considerably (NPV for biogas upgrading technology is estimated around −5.5 M€, as shown for Scenario 3), and the replacement of the conventional co-generation biogas valorisation in the upgrading process—where it is assumed that upgraded biogas is injected to the grid and thus is not available for heat generation—reduces the heat available from co-generation. Thus, Scenario 3 has a thermal demand of approximately 10,600 kW/day, and Scenario 4 has an even higher thermal demand (19,000 kW/day). Their counterpart Scenarios with thermal hydrolysis (i.e., Scenarios 7 and 8) show remarkably lower thermal energy demands (approximately 5400 and 7500 kW/day, respectively) but with an increase in economic costs (i.e., NPV) by about 40%, the highest among all Scenarios studied, as observed from comparing Scenario pairs 3–7 and 4–8. Hence, thermal hydrolysis presents this additional synergy with biogas upgrading (in terms of thermal balance) but at the expense of having the highest economic costs among all the Scenarios considered. Although biogas upgrading does not currently provide significant improvements to WWTP performance if its economic cost is taken into account, its feasibility depends on the evolution of national energy markets, and it may become more beneficial in the future.
Thus, if the practitioner is looking for a sustainable transition from Scenario 1 with a minimal economic cost increase, Scenario 5 would be the most economically feasible (with an NPV of −1.2 M€). It has no significant impact on emissions increase (nor decrease) while guaranteeing a positive thermal balance and an overall energy-positive WWTP, as shown by KPI L1_3. Besides, it is important to note that in a sector that provides essential public services such as wastewater treatment, projects with negative NPV do not strictly imply the infeasibility of the project. Furthermore, thermal hydrolysis allows synergies (related to the thermal balance) with both thermal valorisation and biogas upgrading technologies; for instance, it seems that thermal valorisation would not add an increase in thermal demand if it is implemented after thermal hydrolysis.
To face the upcoming challenges of sewage sludge valorisation in the context of the circular economy, practitioners are looking for a holistic waste management strategy, i.e., a strategy that considers the whole set of available sanitation facilities and their features. Thus, if environmental criteria are prioritized, Scenarios 3 and 7 would be the most beneficial among the Scenarios considered here to allow the circular economy transition, both based on the implementation of biogas upgrading (allowing about 25–30% emission decrease) but at higher costs (around NPV of −5.5 M€ and −7.4 M€, respectively). On the other hand, if economic criteria are prioritized, Scenario 5 would be the most feasible (revolving around thermal hydrolysis, or waste-to-energy); although both Scenario 5 and Scenario 2 present almost the same NPV value, Scenario 5 (thermal hydrolysis) shows additional benefits (such as guaranteeing a positive thermal balance with further related synergies to implementation of other technologies, no emission increase and a still significant waste reduction).
Finally, the existence of different DSS-optimisation methods allowing to avoid exhaustive manual analyses of different combinations of technologies and propose an optimal solution according to certain optimisation criteria should be mentioned; see, e.g., [
18,
27,
28,
29,
30,
31,
32]. The tool presented here is not focused on this feature; however, its simulation-based nature and its design will allow the implementation of such optimisation techniques in future stages, providing an automated optimal outcome for the design process. The proposed tool aims to be a support tool for practitioners that provides sanitation system simulation and analysis in order to perform a rapid and holistic analysis of system performance and hence to enable potential enhancements to operational decision-making, as shown here in the considered case study.
5. Conclusions
The presented DSS–WWTP simulator tool is based on a combination of methods (process simulation, hierarchical KPIs and Scenario analysis) that are usually considered separately. The visual programming approach presented here using the MATLAB-SIMULINK environment allows a more intuitive design approach than other methods, with easier and more standardized implementation of the different processes. This approach also allows better reusability and scalability for the processes implemented, which are compiled in a toolbox that may be expanded with additional processes of interest for further assessment. Thus, one of the main features of the tool presented here is its ready scalability and configurability for the systems under study. Currently implemented processes are related to the WWTP sludge line, since circular economy concerns related to WWTPs are mainly related to sewage-sludge-related issues. However, due to the aforementioned scalability, further toolboxes for this tool may include different operational units and processes in addition to those related to the sludge line.
The case study of the GR WWTP showed the following: thermal hydrolysis is the most suitable technology considering the aforementioned estimations and assumptions for Scenario simulation (based on mixed economic, environmental and energetic criteria) and presents synergies with the thermal balances of other technologies, such as thermal valorisation or the transition from biogas co-generation to biogas upgrading; thermal valorisation is better than thermal hydrolysis from an overall energy recovery performance, but it is less environmentally friendly and does not provide a positive thermal balance; finally, biogas upgrading is the most expensive technology evaluated herein but allows the highest emissions reduction.
In addition, this tool could be applied as a supporting tool for asset management purposes and for long term performance monitoring. Hence, further work may be focused on, e.g., the implementation of fault detection and isolation methods to detect and isolate abnormal behaviour involving WWTP systems. Future work will also consider the inclusion of further processes of interest in the tool process library and the optimisation of their combination to provide an optimal outcome for decision-making support.


