Comparison of Fuzzy AHP and AHP in Multicriteria Inventory Classification While Planning Green Infrastructure for Resilient Stream Ecosystems


Abstract
1. Introduction
2. Literature Review
3. Research Methodology
3.1. AHP
3.2. Fuzzy AHP
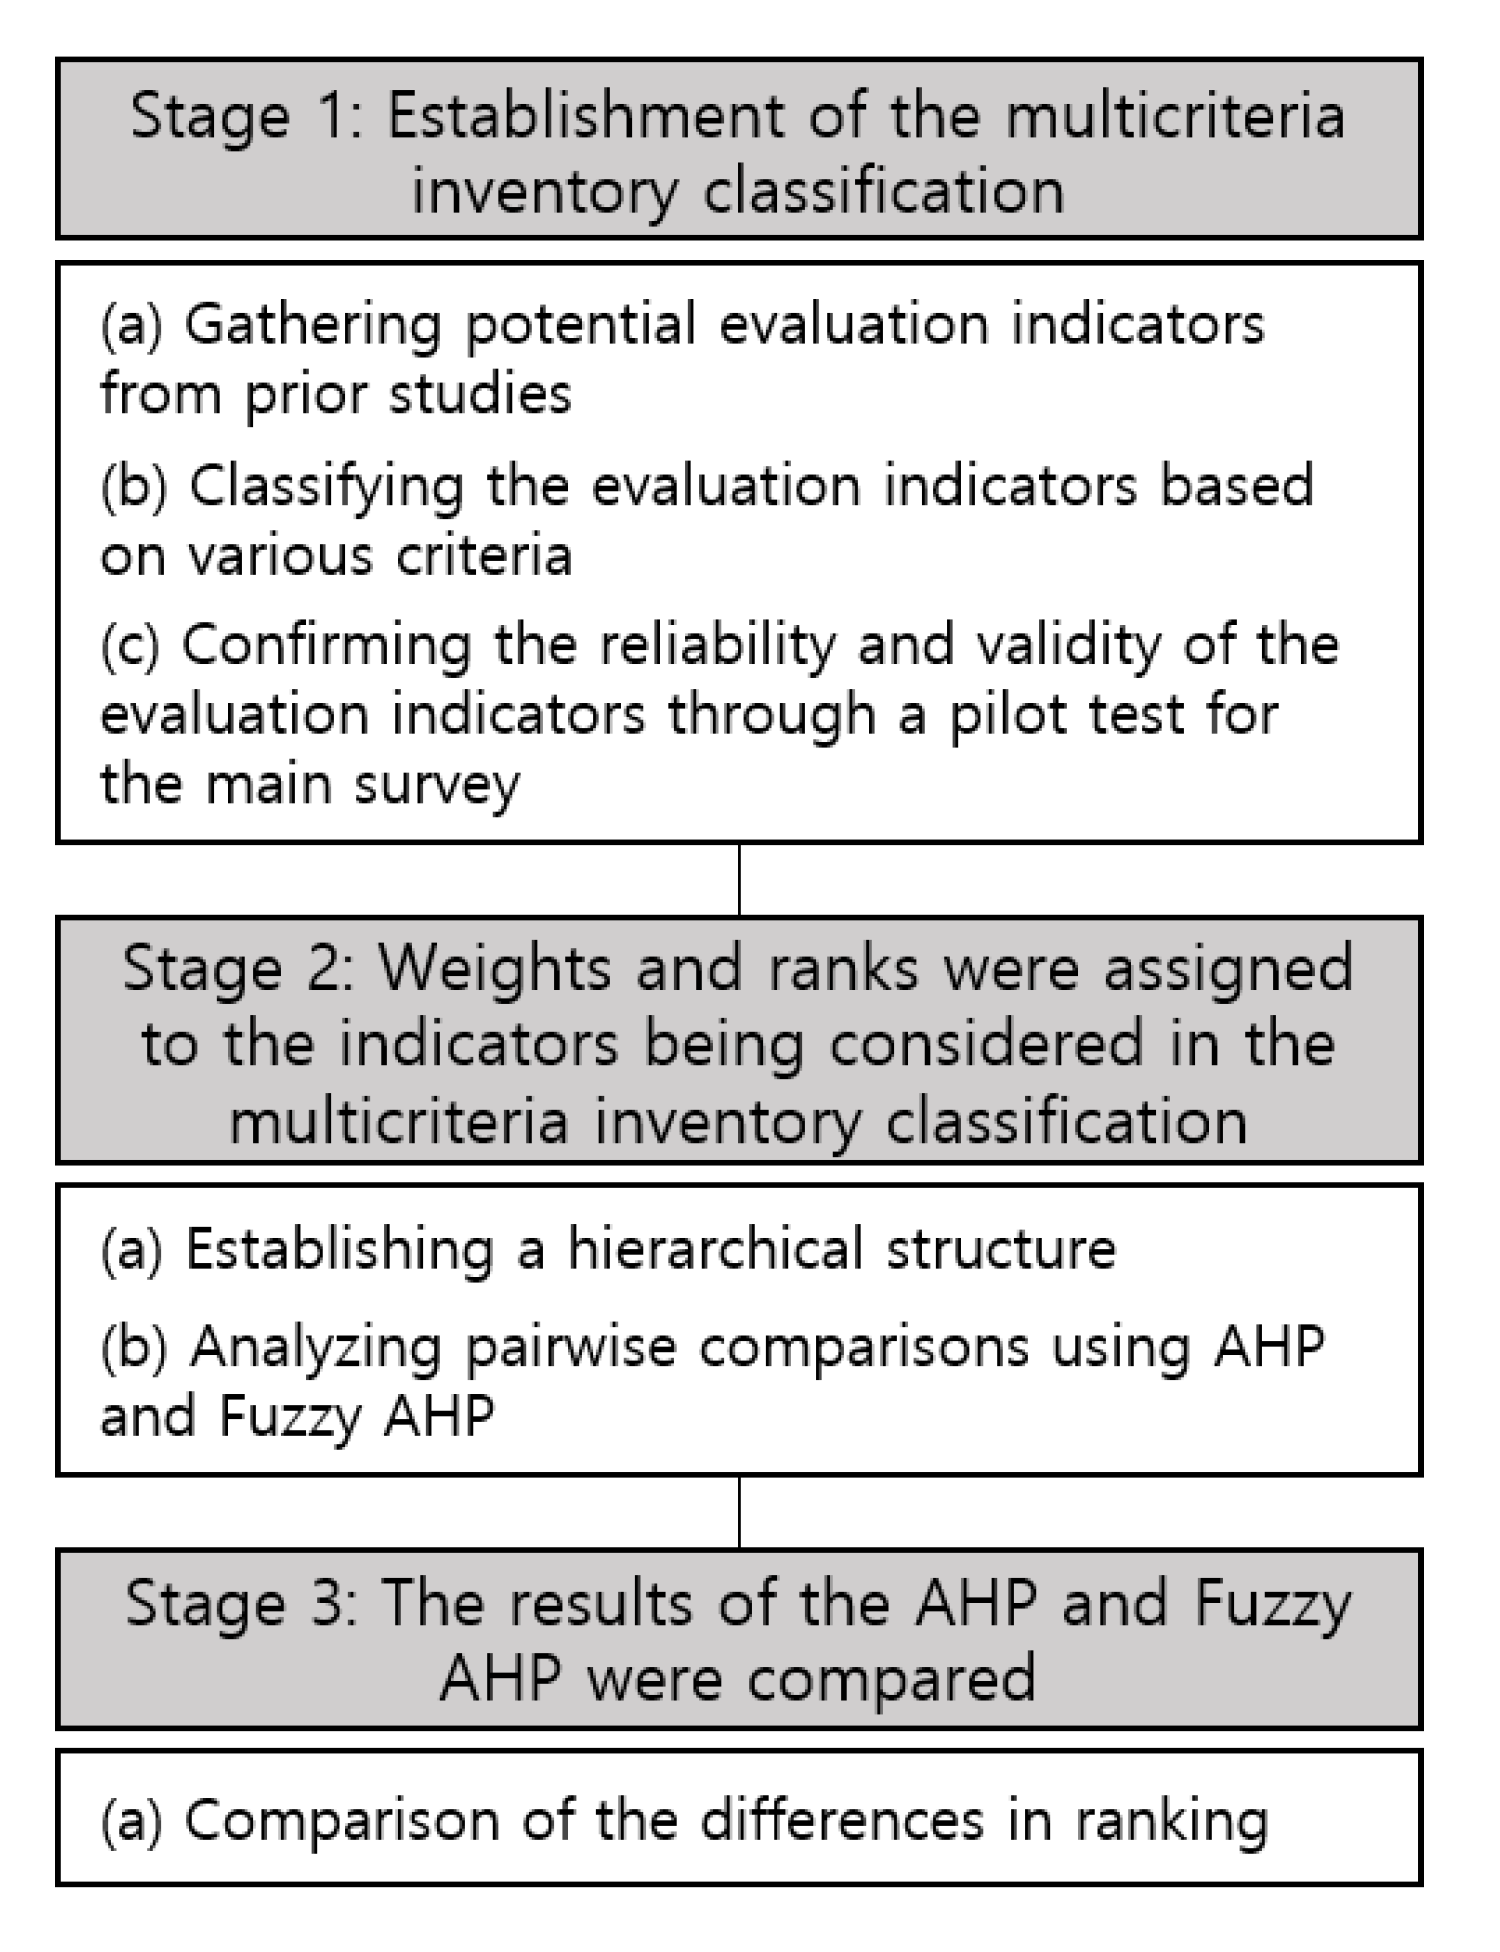
3.3. Methodology Framework
4. Results
4.1. Establishment of the Multicriteria Classification
4.1.1. Gathering Potential Evaluation Indicators from Prior Studies
4.1.2. Classifying Evaluation Indicators Based on “Classification Criteria”
4.1.3. Confirming the Reliability and Validity of Evaluation Indicators
4.2. Assigning Weights and Ranks to Indicators Considered in the Multicriteria Inventory Classification
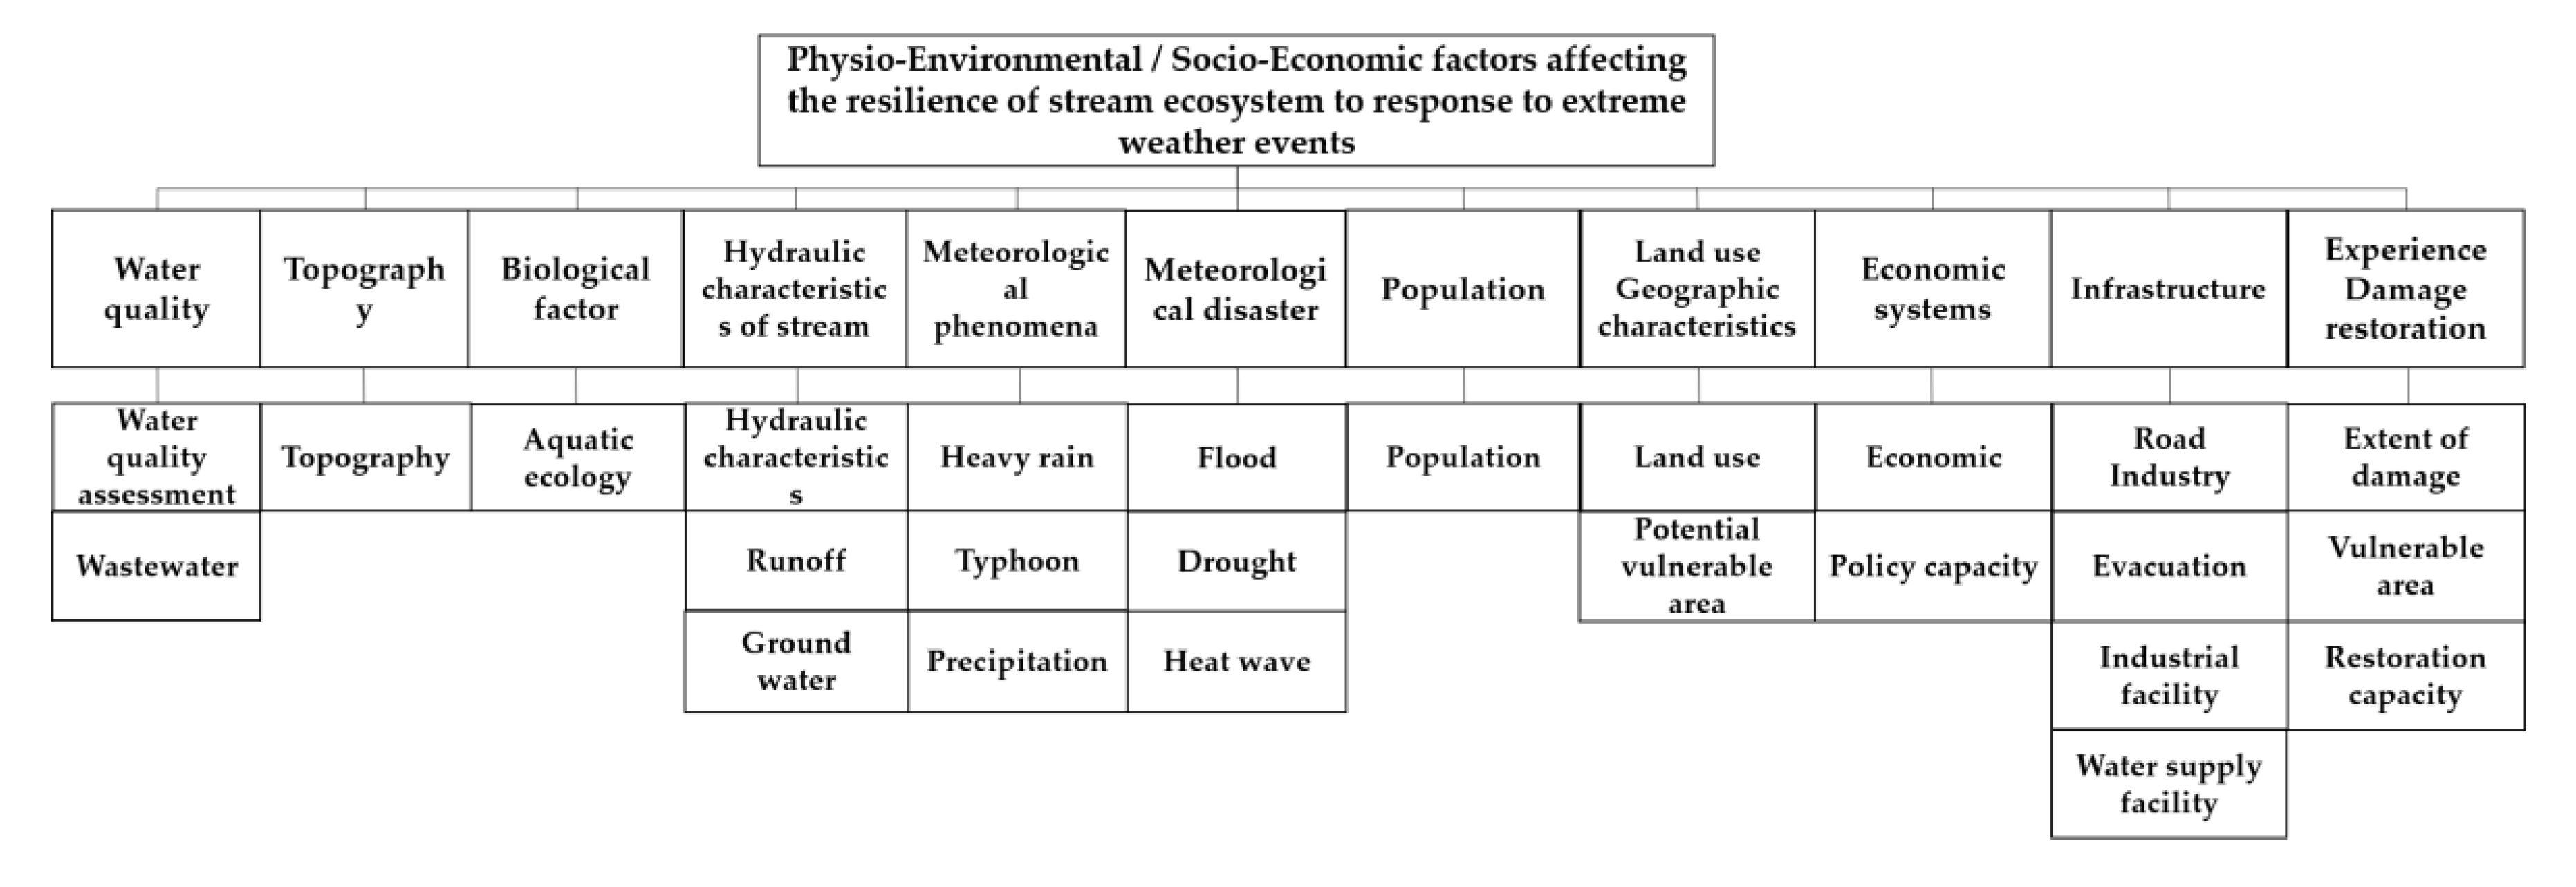
4.2.1. Establishing a Hierarchical Structure
4.2.2. Analyzing Pairwise Comparison Results through AHP and Fuzzy AHP
4.3. Comparison between the AHP and Fuzzy AHP Results
5. Discussion
6. Conclusions
Author Contributions
Funding
Conflicts of Interest
Appendix A

| Division | Subdivision | Evaluation Indicator | Factor Loading | Communalities | Explained Variances | Prior Studies | |
|---|---|---|---|---|---|---|---|
| Water quality | Water quality assessment | Hydrogen ion concentration (pH) | 0.761 | 0.841 | 79.861 | 0.831 | [68,91] |
| Biological oxygen demand (BOD) | 0.738 | 0.923 | [67,68,92] | ||||
| Chemical oxygen demand (COD) | 0.620 | 0.857 | [67,68,92] | ||||
| Total organic carbon (TOC) | 0.840 | 0.894 | [68] | ||||
| Suspended solids (SS) | 0.867 | 0.776 | [68] | ||||
| Dissolved oxygen concentration (DO) | 0.656 | 0.808 | [68] | ||||
| Total phosphorus (T-P) | 0.657 | 0.841 | [67,68,89,92] | ||||
| Count of coliform group (MPN1/100 mL) | 0.652 | 0.503 | [68] | ||||
| Wastewater | Whether certain water pollutants are released | 0.750 | [64] | ||||
| Water pollution prevention facility capacity | 0.952 | 0.933 | [65] | ||||
| Nonpoint pollution reduction facility capacity | 0.575 | 0.659 | [64,92] | ||||
| Topography | Topography | Riverside width | 0.877 | 0.769 | 76.893 | 0.696 | [68] |
| Transverse structures | 0.877 | 0.769 | [68] | ||||
| Biological factors | Aquatic ecology | Aquatic health index | 0.934 | 0.872 | 87.219 | 0.782 | [67,68] |
| Stream lateral/vertical continuity | 0.934 | 0.872 | [67,68] | ||||
| Hydraulic characteristics of streams | Hydraulic characteristics | Stream density of small watersheds | 0.894 | 0.808 | 76.783 | 0.745 | [93] |
| Average river temperature | 0.611 | 0.561 | [91] | ||||
| Flow rate | 0.876 | 0.914 | [92] | ||||
| Flux | 0.879 | 0.785 | [92] | ||||
| Runoff | Hundred-year frequency of daily direct runoff | 0.718 | 0.789 | [84] | |||
| Daily maximum runoff | 0.628 | 0.600 | [61,94] | ||||
| Annual maximum runoff | 0.928 | 0.884 | [58,62,95] | ||||
| Groundwater | Groundwater level | 0.869 | 0.801 | [59,83,96] | |||
| Meteorological phenomena | Heavy rain | “Heavy rain” warning level rainfall | 0.742 | 0.563 | 74.210 | 0.758 | [66,94] |
| Typhoons | Frequency of typhoon occurrence | 0.857 | 0.826 | [66] | |||
| Precipitation | Annual precipitation | 0.883 | 0.790 | [45,62,93,95,96,97] | |||
| Average daily precipitation over 80 mm | 0.821 | 0.834 | [13,45,95] | ||||
| Hundred-year frequency of precipitation | 0.680 | 0.832 | [84,94] | ||||
| Maximum precipitation per day | 0.561 | 0.524 | [2,13,21,45,61,62,64,65,95,98,99,100] | ||||
| Average number of consecutive days without precipitation | 0.878 | 0.785 | [64] | ||||
| Evaporation rate | 0.862 | 0.783 | [96] | ||||
| Meteorological disasters | Floods | Hundred-year flood volume | 0.767 | 0.589 | 74.200 | 0.725 | [66] |
| Droughts | Number of days under SPI2-1 for three months a year | 0.954 | 0.711 | [92] | |||
| Number of days under EDI3-1 for three months a year | 0.927 | 0.413 | [92] | ||||
| Heat waves | Number of days over the highest heat index of 32 °C | 0.713 | 0.816 | [25,65] | |||
| Average heat index of June–September | 0.642 | 0.821 | [25] | ||||
| Number of tropical nights | 0.900 | 0.906 | [2,13,24,25,64,65,99,101] | ||||
| Number of days under a heat wave | 0.872 | 0.937 | [2,13,24,25,65,97,99,101,102] |
Appendix B
| Division | Subdivision | Evaluated Indicator | Factor Loading | Communalities | Explained Variances | Prior Studies | |
|---|---|---|---|---|---|---|---|
| Population | Population | Population of small watersheds | - | - | - | - | [2,13,45,47,68,93,96] |
| Land use/ Geographic characteristics | Land use | Ratio of urbanization promotion area to the total area | 0.669 | 0.635 | 72.217 | 0.745 | [68,103] |
| Ratio of agricultural area to the total area | 0.737 | 0.780 | [2,45,47,68,72,93,96] | ||||
| Ratio of forest area to the total area | 0.876 | 0.790 | [2,45,68,95,100] | ||||
| Ratio of grassland area to the total area | 0.883 | 0.881 | [68] | ||||
| Ratio of wetland area to the total area | 0.769 | 0.707 | [68] | ||||
| Ratio of bare land area to the total area | 0.901 | 0.820 | [68] | ||||
| Ratio of area under water to the total area | 0.601 | 0.459 | [25,68] | ||||
| Potentially vulnerable areas | Ratio of occupancy area of the stream site to the total area | 0.532 | 0.603 | [13,21,72,103] | |||
| Ratio of area below the hundred-year flood-level to the total area | 0.690 | 0.724 | [84] | ||||
| Lowland area under 10 m | 0.715 | 0.697 | [21,93,99] | ||||
| Distance to the stream and residential areas | 0.910 | 0.881 | [64,100,104] | ||||
| Proximity to the inundated area | 0.891 | 0.795 | [83] | ||||
| Percentage of inundated area | 0.758 | 0.616 | [58,65,67,100,105] | ||||
| Economy/System | Economy | Gross regional domestic product (GRDP) | 0.831 | 0.844 | 75.073 | 0.745 | [13,21,23,41,65,90,92,93,98,99,103] |
| Financial independence rate | 0.906 | 0.821 | [13,21,23,41,84,93,94,98,99,101,103] | ||||
| Policy capacity | Environmental/disaster/safety management and firefighting officials | 0.728 | 0.645 | [21,59,98,103] | |||
| Cost of stream restoration | 0.684 | 0.606 | [67] | ||||
| Disaster management capacity of local government | 0.900 | 0.837 | [84,103] | ||||
| Infrastructure | Road/industry | Road density | 0.852 | 0.851 | 83.692 | 0.929 | [2,13,21,25,58,65,93,94,95,98,103] |
| Rate of industrialization | 0.856 | 0.817 | [13,72,83,89,94,101] | ||||
| Evacuation | Number of shelters | 0.708 | 0.927 | [83] | |||
| Information on evacuation routes | 0.769 | 0.774 | [83] | ||||
| Industrial facilities | Area of water supply facilities | 0.760 | 0.759 | [65,72] | |||
| Area of electricity supply facilities | 0.736 | 0.834 | [65,72] | ||||
| Area of gas supply facilities | 0.893 | 0.922 | [65,72] | ||||
| Area of heat supply facilities | 0.857 | 0.894 | [65,72] | ||||
| Area of oil storage and oil supply facilities | 0.769 | 0.698 | [65,72] | ||||
| Water supply facilities | Capacity of flood-control dam and reservoir | 0.916 | 0.857 | [21,58,61,83,94] | |||
| Capacity of domestic drainage facilities | 0.738 | 0.900 | [21,58] | ||||
| Capacity of rainwater pumping station | 0.832 | 0.853 | [58,94,105] | ||||
| Capacity of storm water storage tank | 0.634 | 0.935 | [94,105] | ||||
| Whether to secure emergency drainage facilities | 0.608 | 0.841 | [64] | ||||
| Sewage distribution rate | 0.632 | 0.806 | [2,13,62,84,89,94,101,103] | ||||
| Water supply distribution rate | 0.824 | 0.804 | [62,93,95,101,103] | ||||
| Water demand per unit area | 0.719 | 0.884 | [62,95] | ||||
| Groundwater availability | 0.603 | 0.710 | [62,96,106] | ||||
| Experience/Damage restoration | Extent of damage | Property damage | 0.572 | 0.614 | 77.885 | 0.875 | [21,58,94,105] |
| Total number of victims | 0.784 | 0.848 | [21,99,105] | ||||
| Number of casualties | 0.794 | 0.883 | [21,99,103] | ||||
| Vulnerable areas | Ratio of flooding area to the total area | 0.817 | 0.704 | [58,72] | |||
| Ratio of area prone to floods to the total area | 0.920 | 0.855 | [99,100,101,103,104,105] | ||||
| Area habitually under drought | 0.806 | 0.667 | [101] | ||||
| Restoration capacity | Damage recovery cost | 0.872 | 0.783 | [105] | |||
| Number of disaster recovery projects | 0.906 | 0.837 | [84] | ||||
| Number of psychological recovery support projects for disaster victims | 0.905 | 0.818 | [107] |
References
- World Meteorological Organization (WMO). The Global Climate in 2015–2019. Available online: https://library.wmo.int/doc_num.php?explnum_id=9936 (accessed on 28 October 2020).
- Lee, K.H.; Chung, E.G.; Kim, K.H.; Yu, J.A.; Lee, E.J. Vulnerability assessment of water quality and aquatic ecosystem to climate change in Korea using proxy variables. J. Korean Soc. Water Environ. 2012, 28, 444–452. [Google Scholar]
- Lee, J.K.; Kim, Y.O.; Kang, N.E. Analysis of Climate Change Researches Related to Water. Clim. Chang. Res. 2012, 3, 71–88. [Google Scholar]
- Trimmel, H.; Weihs, P.; Leidinger, D.; Formayer, H.; Kalny, G. Can riparian vegetation shade mitigate the expected rise in stream temperatures during heat waves in a pre-alpine river? Hydrol. Earth Syst. Sci. Discuss. 2018, 22, 437–461. [Google Scholar] [CrossRef]
- Kundzewicz, Z.W.; Kanae, S.; Seneviratne, S.I.; Handmer, J.; Nicholls, N.; Peduzzi, P.; Mechler, R.; Bouwer, L.M.; Arnell, N.; Mach, K.; et al. Le risque d’inondation et les perspectives de changement climatique mondial et régional. Hydrol. Sci. J. 2014, 59, 1–28. [Google Scholar] [CrossRef]
- Holling, C.S. Resilience and stability of ecological systems. Rev. Lit. Arts Am. 1973, 4, 1–23. [Google Scholar] [CrossRef]
- Folke, C. Resilience: The emergence of a perspective for social-ecological systems analyses. Glob. Environ. Chang. 2006, 16, 253–267. [Google Scholar] [CrossRef]
- Randhir, T.O. Resilience of Watershed Systems to Climate Change. J. Earth Sci. Clim. Chang. 2014, 5, e109. [Google Scholar] [CrossRef]
- Artmann, M.; Bastian, O.; Grunewald, K. Using the concepts of green infrastructure and ecosystem services to specify leitbilder for compact and green cities-The example of the landscape plan of Dresden (Germany). Sustainability 2017, 9, 198. [Google Scholar] [CrossRef]
- Reisinger, A.J.; Woytowitz, E.; Majcher, E.; Rosi, E.J.; Belt, K.T.; Duncan, J.M.; Kaushal, S.S.; Groffman, P.M. Changes in long-term water quality of Baltimore streams are associated with both gray and green infrastructure. Limnol. Oceanogr. 2019, 64, S60–S76. [Google Scholar] [CrossRef]
- Keeley, M.; Koburger, A.; Dolowitz, D.P.; Medearis, D.; Nickel, D.; Shuster, W. Perspectives on the use of green infrastructure for stormwater management in cleveland and milwaukee. Environ. Manag. 2013, 51, 1093–1108. [Google Scholar] [CrossRef] [PubMed]
- Flynn, C.D.; Davidson, C.I. Adapting the Social-Ecological System Framework for Urban Stormwater Management: The Case of Green Infrastructure Adoption. Available online: https://www.ecologyandsociety.org/vol21/iss4/art19/ (accessed on 29 October 2020).
- Yoo, G.Y.; Kim, I.E. Development and Application of a Climate Change Vulnerability Index; Korea Environment Institute: Seoul, Korea, 2008; ISBN 9788984643215. [Google Scholar]
- Jeon, E.Y.; Byun, B.S. A study on the development and application of community resilience evaluation indicators for Responding to climate change. Geogr. J. Korea 2017, 51, 47–58. [Google Scholar]
- Hwang, S.A.; Hwang, S.J.; Park, S.R.; Lee, S.W. Examining the relationships between watershed urban land use and stream water quality using linear and generalized additive models. Water 2016, 8, 155. [Google Scholar] [CrossRef]
- Kim, J.A.; Lee, S.W.; Hwang, G.S.; Hwang, S.J.; Kim, C.G.; An, K.J. Effects of streamline complexity on the relationships between urban land use and ecological communities in streams. Paddy Water Environ. 2016, 14, 299–312. [Google Scholar] [CrossRef]
- Vugteveen, P.; Rouwette, E.; Stouten, H.; van Katwijk, M.M.; Hanssen, L. Developing social-ecological system indicators using group model building. Ocean Coast. Manag. 2015, 109, 29–39. [Google Scholar] [CrossRef]
- Beckingham, B.; Callahan, T.; Vulava, V. Stormwater ponds in the southeastern, U.S. coastal plain: Hydrogeology, contaminant fate, and the need for a social-ecological framework. Front. Environ. Sci. 2019, 7, 1–14. [Google Scholar] [CrossRef]
- Park, T.S.; Kim, K.M.; Yoon, Y.S.; Lee, S.B. Analysis of Flood Damage Characteristics and Development of Flood Damage Index; Korea research Institute for human settlements: Daejeon, Korea, 2005. [Google Scholar]
- Kotzee, I.; Reyers, B. Piloting a social-ecological index for measuring flood resilience: A composite index approach. Ecol. Indic. 2016, 60, 45–53. [Google Scholar] [CrossRef]
- Kim, Y.K.; Yoo, J.A.; Chong, E.S. Water management vulnerability assessment considering. J. Clim. Chang. Res. 2012, 3, 1–12. [Google Scholar]
- Koh, J.K.; Kim, H.S. A study on local vulnerability assessment to climate change–The case of municipalities of Gyeonggi-Do. J. Environ. Policy Adm. 2010, 18, 79–105. [Google Scholar]
- Lee, B.D.; Kim, B.T.; Cho, Y.S. A study on vulnerability assessment to climate change in regional fisheries of Korea. J. Fish. Bus. Adm. 2011, 42, 57–70. [Google Scholar]
- Koo, Y.S.; Kim, J.E.; Kim, J.S.; Lee, S.H. Study on the improvement of adaptation ability by vulnerability analysis of heat wave-The case of Busan metropolitan city. J. Korean Reg. Dev. Assoc. 2015, 27, 331–348. [Google Scholar]
- Kim, K.; Eum, J.H. Policies for improving thermal environment using vulnerability assessment–A case study of Daegu, Korea. J. Korea Assoc. Geogr. Inf. Stud. 2018, 21, 1–23. [Google Scholar] [CrossRef]
- Choi, E.H.; Bae, S.S.; Jee, H.K. Prioritization for water storage increase of Agricultural reservoir using FAHP method. J. Korea Water Resour. Assoc. 2013, 46, 171–182. [Google Scholar] [CrossRef]
- Yang, X.L.; Ding, J.H.; Hou, H. Application of a triangular fuzzy AHP approach for flood risk evaluation and response measures analysis. Nat. Hazards 2013, 68, 657–674. [Google Scholar] [CrossRef]
- Shin, J.Y.; Park, Y.J.; Kim, T.W. Evaluation of Inland Inundation Risk in Urban Area using Fuzzy AHP. J. Korea Water Resour. Assoc. 2014, 47, 789–799. [Google Scholar] [CrossRef]
- Kabir, G.; Ahsan Akhtar Hasin, M. Comparative analysis of ahp and fuzzy ahp models for multicriteria inventory classification. Int. J. Fuzzy Log. Syst. 2011, 1, 1–16. [Google Scholar]
- Ishizaka, A. Comparison of fuzzy logic, AHP, FAHP and hybrid fuzzy AHP for new supplier selection and its performance analysis. Int. J. Integr. Supply Manag. 2014, 9, 1–22. [Google Scholar] [CrossRef]
- Mosadeghi, R.; Warnken, J.; Tomlinson, R.; Mirfenderesk, H. Comparison of Fuzzy-AHP and AHP in a spatial multi-criteria decision making model for urban land-use planning. Comput. Environ. Urban Syst. 2015, 49, 54–65. [Google Scholar] [CrossRef]
- Plebankiewicz, E.; Kubek, D. Multicriteria selection of the building material supplier using AHP and fuzzy AHP. J. Constr. Eng. Manag. 2016, 142, 04015057. [Google Scholar] [CrossRef]
- Özdağoğlu, A.; Özdağoğlu, G. Comparison of AHP and Fuzzy AHP for the multi-criteria decision making processes with linguistic evaluations. İstanbul Ticaret Üniversitesi Fen Bilim. Derg. 2007, 6, 65–85. [Google Scholar]
- Sander, H.A.; Polasky, S. The value of views and open space: Estimates from a hedonic pricing model for Ramsey County, Minnesota, USA. Land Use Policy 2009, 26, 837–845. [Google Scholar] [CrossRef]
- Scott Shafer, C.; Scott, D.; Baker, J.; Winemiller, K. Recreation and amenity values of Urban Stream corridors: Implications for green infrastructure. J. Urban Des. 2013, 18, 478–493. [Google Scholar] [CrossRef]
- United States Environmental Protection Agency (USEPA). Reducing Stormwater Costs through Low Impact Development (LID) Strategies and Practices. Available online: https://www.epa.gov/sites/production/files/2015-10/documents/2008_01_02_nps_lid_costs07uments_reducingstormwatercosts-2.pdf (accessed on 29 October 2020).
- Liu, Y.; Theller, L.O.; Pijanowski, B.C.; Engel, B.A. Optimal selection and placement of green infrastructure to reduce impacts of land use change and climate change on hydrology and water quality: An application to the Trail Creek Watershed, Indiana. Sci. Total Environ. 2016, 553, 149–163. [Google Scholar] [CrossRef]
- Han, M.Y.; Kim, J.K.; Park, S.C. The effect of greening roof on the quantity and quality of rainfall runoff. J. Archit. Inst. Korea Plan. Des. 2003, 19, 279–285. [Google Scholar]
- Mei, C.; Liu, J.; Wang, H.; Yang, Z.; Ding, X.; Shao, W. Integrated assessments of green infrastructure for flood mitigation to support robust decision-making for sponge city construction in an urbanized watershed. Sci. Total Environ. 2018, 639, 1394–1407. [Google Scholar] [CrossRef] [PubMed]
- Lee, H.M.; You, S.J.; Park, S.; Chon, J.H. A study on categories of green infrastructure to enhance urban resilience. J. Korea Plan. Assoc. 2018, 53, 215–235. [Google Scholar] [CrossRef]
- Park, S.M.; Lee, W.K.; Kwon, T.H.; Lee, B.D.; Son, Y.H.; Cho, Y.S. Vulnerabilitiy assessment for ocean to climate change using Spatial information based on GIS. Spat. Inf. Res. 2011, 19, 1–9. [Google Scholar]
- McClanahan, T.R.; Donner, S.D.; Maynard, J.A.; MacNeil, M.A.; Graham, N.A.J.; Maina, J.; Baker, A.C.; Beger, M.; Campbell, S.J.; Darling, E.S.; et al. Prioritizing key resilience indicators to support coral Reef management in a Changing climate. PLoS ONE 2012, 7, 1–7. [Google Scholar] [CrossRef]
- Davidson, J.L.; van Putten, I.E.; Leith, P.; Nursey-Bray, M.; Madin, E.M.; Holbrook, N.J. Toward Operationalizing Resilience Concepts in Australian Marine Sectors Coping with Climate Change. Available online: https://www.ecologyandsociety.org/vol18/iss3/art4/ (accessed on 29 October 2020).
- Moore, S.E.; Huntington, H.P. Arctic marine mammals and climate change: Impacts and resilience. Ecol. Appl. 2008, 18, S157–S165. [Google Scholar] [CrossRef]
- Kim, S.J.; Kim, S.M.; Kim, S.M. A study on the vulnerability assessment for agricultural infrastructure using principal component analysis. J. Korean Soc. Agric. Eng. 2013, 55, 31–38. [Google Scholar] [CrossRef]
- Douxchamps, S.; Debevec, L.; Giordano, M.; Barron, J. Monitoring and evaluation of climate resilience for agricultural development–A review of currently available tools. World Dev. Perspect. 2017, 5, 10–23. [Google Scholar] [CrossRef]
- Kim, M.H.; Bang, H.S.; Na, Y.E.; Kim, M.R.; Oh, Y.J.; Kang, K.K.; Cho, K.J. Vulnerability assessment of rice production by main disease and pest of rice plant to climate change. J. Korea Soc. Environ. Restor. Technol. 2013, 16, 147–157. [Google Scholar] [CrossRef][Green Version]
- Ifejika Speranza, C. Resilient Adaptation to Climate Change in African Agriculture; German Development Institute: Born, Germany, 2010; ISBN 9783889854896. [Google Scholar]
- Byun, J.Y.; Lee, W.K.; Choi, S.H.; Oh, S.H.; Yoo, S.J.; Kwon, T.S.; Sung, J.H.; Woo, J.W. Vulnerability assessment for forest ecosystem to climate change based on spatio-temporal information. Korean J. Remote Sens. 2012, 28, 159–169. [Google Scholar] [CrossRef]
- Lim, S.J.; Kim, H.J.; Lee, S.H. Forest vulnerability assessment of Pine and pine mushroom using GIS. J. Agric. Life Sci. 2014, 48, 1–11. [Google Scholar] [CrossRef]
- Davoudi, S.; Shaw, K.; Haider, L.J.; Quinlan, A.E.; Peterson, G.D.; Wilkinson, C.; Fünfgeld, H.; McEvoy, D.; Porter, L. Resilience: A bridging concept or a dead end? “Reframing” resilience: Challenges for planning theory and practice interacting traps: Resilience assessment of a pasture management system in Northern Afghanistan Urban resilience: What Does it mean in planni. Plan. Theory Pract. 2012, 13, 299–333. [Google Scholar] [CrossRef]
- Eum, J.H. Vulnerability assessment to urban thermal environment for spatial planning–A case study of Seoul, Korea. J. Korean Inst. Landsc. Archit. 2016, 44, 109–120. [Google Scholar] [CrossRef]
- Durance, I.; Ormerod, S.J. Climate change effects on upland stream macroinvertebrates over a 25-year period. Glob. Chang. Biol. 2007, 13, 942–957. [Google Scholar] [CrossRef]
- Bêche, L.A.; Connors, P.G.; Resh, V.H.; Merenlender, A.M. Resilience of fishes and invertebrates to prolonged drought in two California streams. Ecography 2009, 32, 778–788. [Google Scholar] [CrossRef]
- Lawrence, J.E.; Lunde, K.B.; Mazor, R.D.; Bêche, L.A.; McElravy, E.P.; Resh, V.H. Long-term macroinvertebrate responses to climate change: Implications for biological assessment in mediterranean-climate streams. J. N. Am. Benthol. Soc. 2010, 29, 1424–1440. [Google Scholar] [CrossRef]
- Lee, M.H.; Jung, I.W.; Bae, D.H. Korean flood vulnerability assessment on climate change. J. Korea Water Resour. Assoc. 2011, 44, 653–666. [Google Scholar] [CrossRef][Green Version]
- Muller, M. Adapting to climate change: Water management for urban resilience. Environ. Urban. 2007, 19, 99–113. [Google Scholar] [CrossRef]
- Kim, D.E.; Jung, Y.; Park, M.J.; Yoon, J.Y.; Kim, S.D.; Choi, M.H. Vulnerability analysis of water resources considering climate change. J. Wetl. Res. 2011, 13, 25–33. [Google Scholar]
- Park, H.S.; Kim, H.J.; Chae, Y.R.; Kim, Y.J. Assessment of water use vulnerability considering climate and socioeconomic changes in Han river watershed. J. Korean Soc. Civ. Eng. 2017, 37, 965–972. [Google Scholar]
- Ahn, J.H.; Hong, Y.S.; Kang, H.S.; Han, D.H.; Jang, J.H.; Seo, D.I.; Park, Y.H. Water Quality Management Strategy in the Context of Climate Change; Korea Enviornment Institute: Sejong, Korea, 2010; ISBN 9788984645257. [Google Scholar]
- Bae, D.H.; Lee, M.H. Flood vulnerability assessment and case analysis due to climate change. Korea Res. Inst. Hum. Settl. 2010, 20–31. [Google Scholar]
- Chung, J.W.; Lee, W.K.; Cui, G.S.; Lee, S.C.; Choi, S.H.; Choi, H.A. Application study of vulnerability assessment models for water resources to climate change by spatial and watershed scales. J. Clim. Chang. Res. 2010, 1, 21–30. [Google Scholar]
- Lee, B.W.; Chung, D.H.; Kim, B.C. Relative importance evaluation of advertising agency selection sing AHP. Korean J. Adevert. Public Relat. 2011, 13, 7–30. [Google Scholar]
- Seoul National University (SNU). MOE Research on Climate Change Vulnerability Survey/Evaluation Measures Such as Non-Point Pollution Reduction Facilities; SNU: Seoul, Korea, 2014. [Google Scholar]
- Han, W.S.; Sim, O.B.; Lee, B.J.; You, J.H. The proposal of evaluation method for local government infrastructure vulnerability relating to climate change driven flood. J. Clim. Chang. Res. 2012, 3, 25–37. [Google Scholar]
- Myung, S.J.; Kim, J.Y.; Shin, S.H.; An, B.O. Assessing Vulnerability to Climate Change of the Physical Infrastructure and Developing Adaptation Measures in Korea II; Korea Environment Institute: Seoul, Korea, 2010; ISBN 9788984645196. [Google Scholar]
- Ryu, J.N.; Hwang, S.I.; Kim, H.J.; Lee, B.K.; Lee, Y.K.; Jung, A.Y. Sustainability Assessment of Water Infrastructure and Services. Available online: https://library.kei.re.kr:444/dmme/img/001/014/007/%ec%82%ac%ec%97%85_2018_03_%eb%a5%98%ec%9e%ac%eb%82%98_%ed%99%a9%ec%83%81%ec%9d%bc.pdf (accessed on 29 October 2020).
- Ministry of Environment. Guide to Diagmosis of Health Deterioration in River Aquatic Ecosystem; MOE: Sejong, Korea, 2019.
- Saaty, T.L. A scaling method for priorities in hierarchical structures. J. Math. Psychol. 1977, 15, 234–281. [Google Scholar] [CrossRef]
- Srdjevic, B.; Medeiros, Y.D.P. Fuzzy AHP assessment of water management plans. Water Resour. Manag. 2008, 22, 877–894. [Google Scholar] [CrossRef]
- Chae, B.G.; Cho, Y.C.; Song, Y.S.; Seo, Y.S. Development of an evaluation chart for landslide susecptivility using the AHP analysis method. J. Eng. Geol. 2009, 19, 99–108. [Google Scholar]
- Koh, J.K.; Kim, H.S. A study on Vulnerability Assessment to Climate Change in Gyeonggi-Do; Gyeonggi Research Institute: Gyeonggi, Korea, 2009. [Google Scholar]
- Song, K.W.; Lee, Y. Re-scaling for improvement the consistency of the AHP method. Soical Sci. Res. Rev. 2007, 29, 271–288. [Google Scholar]
- Cho, S.K.; Lee, J.S. Development of the attributes and their weights for evaluation of amenity of seoul by applying fuzzy-AHP. Seoul Stud. 2006, 7, 1–16. [Google Scholar]
- Lee, S. Determination of priority weights under multiattribute decision-making situations: Ahp versus fuzzy ahp. J. Constr. Eng. Manag. 2015, 141, 1–9. [Google Scholar] [CrossRef]
- Kutlu, A.C.; Ekmekçioǧlu, M. Fuzzy failure modes and effects analysis by using fuzzy TOPSIS-based fuzzy AHP. Expert Syst. Appl. 2012, 39, 61–67. [Google Scholar] [CrossRef]
- Van Laarhoven, J.M.P.; Pedrtycz, W. A fuzzy extension of Saaty’s priority theory. Fuzzy Sets Syst. 1983, 11, 229–241. [Google Scholar] [CrossRef]
- Mo, S.W.; Kim, C.B. A Relative Importance Evaulation of the industrial sector according to the FTA using AHP and fuzzy AHP. J. Ind. Econ. Bus. 2012, 25, 1827–1842. [Google Scholar]
- Daǧdeviren, M.; Yüksel, I. Developing a fuzzy analytic hierarchy process (AHP) model for behavior-based safety management. Inf. Sci. 2008, 178, 1717–1733. [Google Scholar] [CrossRef]
- Chung, D.H.; Yang, H.C. Reliability and validity assessment in 3D video measurement. J. Broadcast Eng. 2012, 17, 49–59. [Google Scholar] [CrossRef]
- Young, A.; Sean, P. A beginner’s guide to factor analysis: Focusing on exploratory factory analysis. Tutor. Quant. Methods Psychol. 2013, 9, 79–94. [Google Scholar] [CrossRef]
- Taherdoost, H. Sampling methods in research methodology; How to choose a sampling technique for research. Int. J. Acad. Res. Manag. 2016, 5, 18–27. [Google Scholar] [CrossRef]
- Balica, S.F.; Douben, N.; Wright, N.G. Flood vulnerability indices at varying spatial scales. Water Sci. Technol. 2009, 60, 2571–2580. [Google Scholar] [CrossRef]
- Park, G.J.; Kim, H.S.; Park, M.J.; Kin, S.D.; Choi, M.H.; Yoon, J.Y. Assessment of flood vulnerability considering climate change using entropy method. J. Korean Soc. Hazard Mitig 2011, 1, 263–264. [Google Scholar]
- Hwang, Y.J. Application of geographic database for prediction of flood vulnerable area. J. Korean Assoc. Reg. Geogr. 2006, 12, 172–178. [Google Scholar]
- Jun, H.D.; Kim, S.J. Analysis of future hydrological cycle considering the impact of climate change and hydraulic structures in Geum River Basin. J. Korean Soc. Hazard Mitig. 2014, 14, 299–309. [Google Scholar] [CrossRef]
- Hahm, C.H.; Kim, G.H. A study of ecological flow assesment for environmental development in natural river. J. Korean Soc. Geospat. Inf. Sci. 2010, 18, 47–53. [Google Scholar]
- Ahn, S.R.; Lee, Y.J.; Park, G.A.; Kim, S.J. Analysis of fucture land use and climate change impact on stream discharge. J. Korean Soc. Civ. Eng. B 2008, 28, 215–224. [Google Scholar]
- Kim, E.S.; Yoon, K.Y.; Lee, S.H. Lake vulnerability assessment. J. Korea Acad. Coop. Soc. 2014, 15, 6877–6883. [Google Scholar] [CrossRef]
- Lee, J.W.; Chun, S.H.; Kim, K.H.; Kim, C.W. Flow analysis based on the recovery of lateral connectivity in the River. J. Wetl. Res. 2014, 16, 213–220. [Google Scholar] [CrossRef][Green Version]
- Hare, J.A.; Morrison, W.E.; Nelson, M.W.; Stachura, M.M.; Teeters, E.J.; Griffis, R.B.; Alexander, M.A.; Scott, J.D.; Alade, L.; Bell, R.J.; et al. A vulnerability assessment of fish and invertebrates to climate change on the Northeast, U.S. continental shelf. PLoS ONE 2016, 11, 1–30. [Google Scholar] [CrossRef]
- Jo, Y.T.; Kim, H.C.; Kim, G.H.; Nam, K.H.; Kim, H.T. A Study on vulnerability assessment of water quality caused by drought in daegu metropolitan city. J. Korea Soc. Water Environ. 2018, 34, 223–224. [Google Scholar]
- Kang, J.Y.; Oh, K.S. Establishing flood vulnerability assessment indicies for climate chagne adaptation and its application: The case of the Seoul metropolitan area. J. Korean Urban Manag. Assoc. 2014, 27, 43–67. [Google Scholar]
- Jung, Y.; Choi, M.H. Survey-based approach for hydrological vulnerability indicators due to climate change: Case study of small-scale rivers. J. Am. Water Resour. Assoc. 2012, 48, 256–265. [Google Scholar] [CrossRef]
- Oh, S.H.; Lee, W.K.; Byun, J.Y.; Park, S.M.; Kwak, H.B.; Cui, G.S.; Kim, M.I.; Jung, R.S.; Nam, K.J.; Shin, D.H. A study on vulnerability assessment and prioritizing sectors to support adaptation strategy to climate change–Case study of Gangwon province. J. Clim. Chang. Res. 2012, 3, 245–257. [Google Scholar]
- Shin, H.J.; Kwon, H.J.; Lee, J.Y.; Lee, J.H.; Park, C.G. Vulnerability evaluation for water supply of irrigation facilities: Focusing on Dangjin-si, Yesan-gun, Cheongyang-gun, South Korea. J. Korean Soc. Agric. Eng. 2018, 60, 33–42. [Google Scholar] [CrossRef]
- Kim, C.C.; Kim, T.G. Evaluation on climate change vulnerability of Korea National Parks. Korean, J. Ecol. Environ. 2016, 49, 42–50. [Google Scholar] [CrossRef]
- Lee, S.H.; Kang, J.E.; Bae, H.J.; Yoon, D.K. Vulnerability assessment of the air pollution using entropy weights: Focused on ozone. J. Korean Assoc. Reg. Geogr. 2015, 21, 751–763. [Google Scholar]
- Lee, J.H. A study on linkage methodology between climate change vulnerability assessment and adapation policy. Korea Resour. Econ. Assoc. Conf. 2016, 235–266. [Google Scholar]
- Kang, J.E.; Lee, M.J. Assessment of flood vulnerability to climate change using fuzzy model and GIS in Seoul. J. Korean Assoc. Geogr. Inf. Stud. 2012, 15, 119–136. [Google Scholar] [CrossRef]
- Kim, S.M.; Kim, N.E. A study on vulnerability assessment to climate change–Focused on 22 municipalities of JeollaNamDo. J. Korea Assoc. Gov. 2012, 19, 99–123. [Google Scholar] [CrossRef]
- Yoo, S.J.; Lee, W.K.; Oh, S.H.; Byun, J.Y. Vulnerability assessment for public health to climate change using Spatio-temporal information based on GIS. J. Korea Spat. Inf. Soc. 2012, 20, 13–24. [Google Scholar] [CrossRef]
- Myung, S.J. Cliamte change vulnerability assessment using spatial analysis. Water Futur. 2011, 44, 57–62. [Google Scholar] [CrossRef]
- Adelekan, I.O. Vulnerability assessment of an urban flood in Nigeria: Abeokuta flood 2007. Nat. Hazards 2011, 56, 215–231. [Google Scholar] [CrossRef]
- Hwang, H.S.; Byun, B.S. Building vulnerability index on climate change: Focused on Seoul metropolitan city. J. Environ. Policy Adm. 2011, 19, 93–119. [Google Scholar]
- Sullivan, C.; Meigh, J. Targeting attention on local vulnerabilities using an integrated index approach: The example of the climate vulnerability index. Water Sci. Technol. 2005, 51, 69–78. [Google Scholar] [CrossRef] [PubMed]
- Hyun, J.H.; Kim, H.S.; Ahn, Y.J. Examination on Koreas disaster psychological support services based on 912 Gyeongju earthquake experience. J. Community Welf. 2018, 65, 169–201. [Google Scholar] [CrossRef]


| Scale | Definition | Explanation |
|---|---|---|
| 1 | Equal importance | Two criteria contribute equally to the objective |
| 3 | Moderate importance | Judgment moderately favors one criterion over another |
| 5 | Strong importance | Judgment strongly favors one criterion over another |
| 7 | Very strong importance | One criterion is favored very strongly over another |
| 9 | Extreme importance | There is evidence favoring one criterion that is of the highest possible order of affirmation |
| 2, 4, 6, 8 | Immediate values between those of the above scale | When a compromise is required |
| Reciprocals | Compared to activity ‘b’, if any of the above numbers is assigned to element ‘a’, ‘b’ is the reciprocal of ‘a’ | |
| Fuzzy Number | Linguistic Scale | Fuzzy Triangular Scale | Reciprocal Fuzzy Triangular Scale |
|---|---|---|---|
| 1 | Equal importance | (1, 1, 1) | (1, 1, 1) |
| 3 | Moderate importance | (1, 3/2, 2) | (1/2, 2/3, 1) |
| 5 | Strong importance | (3/2, 2, 5/2) | (2/5, 1/2, 2/3) |
| 7 | Very strong importance | (2, 5/2, 3) | (1/3, 2/5, 1/2) |
| 9 | Extreme importance | (5/2, 3, 7/2) | (2/7, 1/3, 2/5) |
| Field | Classification | Evaluation Indicator Classification Criteria | |
|---|---|---|---|
| Stream ecosystem | Socio-economic | Population density Population in flood prone areas Proximity to river/stream Past experiences of extreme weather disaster Preparedness/awareness Quality of water supply Quality of energy supply Warming system | Evacuation routes Institutional capacity Emergency services Shelters Land use Regional GDP per capita Infrastructure management Dams and storage capacity Ration of disaster-prone area |
| Physio-environmental | Groundwater level Water quality Health of aquatic organisms Rainfall index Recovery time after floods Evaporation rate Dikes/levees | Flood duration River discharge Flow velocity Storm surge index Drought index Heat wave index | |
| Division | Subdivision | Explained Variances | |
|---|---|---|---|
| Water quality | Water quality assessment | 79.864 | 0.831 |
| Wastewater | |||
| Topography | Topography | 76.893 | 0.696 |
| Biological factors | Aquatic ecology | 87.219 | 0.782 |
| Hydraulic characteristics of stream | Hydraulic characteristics | 76.783 | 0.745 |
| Runoff | |||
| groundwater | |||
| Meteorological phenomena | Heavy rain | 74.210 | 0.758 |
| Typhoons | |||
| Precipitation | |||
| Meteorological disasters | Floods | 74.200 | 0.725 |
| Droughts | |||
| Heat waves |
| Division | Subdivision | Explained Variances | |
|---|---|---|---|
| Population | Population | - | - |
| Land use/Geographic characteristics | Land use | 72.217 | 0.745 |
| Potentially vulnerable areas | |||
| Economy/System | Economy | 75.073 | 0.745 |
| Policy capacity | |||
| Infrastructure | Road/Industry | 83.692 | 0.929 |
| Evacuation | |||
| Industrial facilities | |||
| Water supply facilities | |||
| Experience/Damage restoration | Extent of damage | 77.885 | 0.875 |
| Vulnerable areas | |||
| Restoration capacity |
| First Tier | Second Tier | Overall Outcome | |||||
|---|---|---|---|---|---|---|---|
| Division | Local Weights | Rank | Subdivision | Local Weights | Rank | Global Weights | Rank |
| Water quality | 0.068 | 9 | Water quality assessment | 0.54 | 1 | 0.036 | 14 |
| Wastewater | 0.46 | 2 | 0.031 | 16 | |||
| Topography | 0.063 | 11 | Topography | 1.000 | 1 | 0.063 | 4 |
| Biological factors | 0.089 | 6 | Aquatic ecology | 1.000 | 1 | 0.089 | 1 |
| Hydraulic characteristics of streams | 0.111 | 3 | Hydraulic characteristics | 0.371 | 2 | 0.041 | 11 |
| Runoff | 0.403 | 1 | 0.045 | 9 | |||
| Groundwater | 0.226 | 3 | 0.025 | 20 | |||
| Meteorological phenomena | 0.094 | 5 | Heavy rain | 0.488 | 1 | 0.046 | 8 |
| Typhoons | 0.228 | 3 | 0.022 | 22 | |||
| Precipitation | 0.284 | 2 | 0.027 | 19 | |||
| Meteorological disasters | 0.129 | 1 | Floods | 0.386 | 2 | 0.05 | 6 |
| Heat waves | 0.429 | 1 | 0.055 | 5 | |||
| Droughts | 0.185 | 3 | 0.024 | 21 | |||
| Population | 0.067 | 10 | Population | 1.000 | 1 | 0.067 | 3 |
| Land use/geographic characteristics | 0.116 | 2 | Land use | 0.407 | 2 | 0.047 | 7 |
| Potentially vulnerable areas | 0.593 | 1 | 0.069 | 2 | |||
| Economy/system | 0.0698 | 8 | Economy | 0.387 | 2 | 0.027 | 18 |
| Policy capacity | 0.613 | 1 | 0.043 | 10 | |||
| Infrastructure | 0.087 | 7 | Road/industry | 0.230 | 2 | 0.02 | 23 |
| Evacuation | 0.165 | 4 | 0.014 | 25 | |||
| Industrial facilities | 0.228 | 3 | 0.02 | 24 | |||
| Water supply facilities | 0.377 | 1 | 0.033 | 15 | |||
| Experience/damage restoration | 0.107 | 4 | Extent of damage | 0.263 | 3 | 0.028 | 17 |
| Vulnerable areas | 0.353 | 2 | 0.038 | 13 | |||
| Restoration capacity | 0.384 | 1 | 0.041 | 12 | |||
| First Tier | Second Tier | Overall Outcome | |||||
|---|---|---|---|---|---|---|---|
| Division | Local Weights | Rank | Subdivision | Local Weights | Rank | Global weights | Rank |
| Water quality | 0.081 | 8 | Water quality assessment | 0.055 | 1 | 0.045 | 6 |
| Wastewater | 0.045 | 2 | 0.037 | 13 | |||
| Topography | 0.076 | 10 | Topography | 1.000 | 1 | 0.076 | 3 |
| Biological factors | 0.094 | 6 | Aquatic ecology | 1.000 | 1 | 0.094 | 1 |
| Hydraulic characteristics of streams | 0.107 | 2 | Hydraulic characteristics | 0.398 | 2 | 0.042 | 10 |
| Runoff | 0.411 | 1 | 0.044 | 7 | |||
| Groundwater | 0.196 | 3 | 0.021 | 23 | |||
| Meteorological phenomena | 0.097 | 4 | Heavy rains | 0.396 | 1 | 0.039 | 12 |
| Typhoons | 0.304 | 2 | 0.03 | 18 | |||
| Precipitation | 0.301 | 3 | 0.029 | 19 | |||
| Meteorological disasters | 0.109 | 1 | Floods | 0.354 | 2 | 0.039 | 11 |
| Heat waves | 0.440 | 1 | 0.048 | 5 | |||
| Droughts | 0.206 | 3 | 0.022 | 22 | |||
| Population | 0.078 | 9 | Population | 1.000 | 1 | 0.078 | 2 |
| Land use/geographic characteristics | 0.101 | 3 | Land use | 0.421 | 2 | 0.042 | 9 |
| Potentially vulnerable areas | 0.579 | 1 | 0.058 | 4 | |||
| Economy/system | 0.074 | 11 | Economy | 0.404 | 2 | 0.03 | 17 |
| Policy capacity | 0.596 | 1 | 0.044 | 8 | |||
| Infrastructure | 0.088 | 7 | Road/industry | 0.314 | 2 | 0.028 | 20 |
| Evacuation | 0.216 | 3 | 0.019 | 24 | |||
| Industrial facilities | 0.069 | 4 | 0.006 | 25 | |||
| Water supply facilities | 0.400 | 1 | 0.035 | 15 | |||
| Experience/damage restoration | 0.095 | 5 | Extent of damage | 0.266 | 3 | 0.025 | 21 |
| Vulnerable areas | 0.375 | 2 | 0.036 | 14 | |||
| Restoration capacity | 0.359 | 1 | 0.034 | 16 | |||
Publisher’s Note: MDPI stays neutral with regard to jurisdictional claims in published maps and institutional affiliations. |
© 2020 by the authors. Licensee MDPI, Basel, Switzerland. This article is an open access article distributed under the terms and conditions of the Creative Commons Attribution (CC BY) license (http://creativecommons.org/licenses/by/4.0/).
Share and Cite
Park, Y.; Lee, S.-W.; Lee, J. Comparison of Fuzzy AHP and AHP in Multicriteria Inventory Classification While Planning Green Infrastructure for Resilient Stream Ecosystems. Sustainability 2020, 12, 9035. https://doi.org/10.3390/su12219035
Park Y, Lee S-W, Lee J. Comparison of Fuzzy AHP and AHP in Multicriteria Inventory Classification While Planning Green Infrastructure for Resilient Stream Ecosystems. Sustainability. 2020; 12(21):9035. https://doi.org/10.3390/su12219035
Chicago/Turabian StylePark, Yujin, Sang-Woo Lee, and Junga Lee. 2020. "Comparison of Fuzzy AHP and AHP in Multicriteria Inventory Classification While Planning Green Infrastructure for Resilient Stream Ecosystems" Sustainability 12, no. 21: 9035. https://doi.org/10.3390/su12219035
APA StylePark, Y., Lee, S.-W., & Lee, J. (2020). Comparison of Fuzzy AHP and AHP in Multicriteria Inventory Classification While Planning Green Infrastructure for Resilient Stream Ecosystems. Sustainability, 12(21), 9035. https://doi.org/10.3390/su12219035