Article

Delineation of Soil Fertility Management Zones for Site-specific Nutrient Management in the Maize Belt Region of Nigeria

1
International Institute of Tropical Agriculture, Ibadan PMB 5320, Oyo, Nigeria
2
Department of Agronomy, Bayero University Kano, Kano 700001, Nigeria
3
Department of Soil Science, Bayero University Kano, Kano 700001, Nigeria
4
Centre for Dryland Agriculture (CDA), Bayero University Kano, Kano 700001, Nigeria
*
Author to whom correspondence should be addressed.
Sustainability 2020, 12(21), 9010; https://doi.org/10.3390/su12219010
Submission received: 27 July 2020 / Revised: 20 August 2020 / Accepted: 24 August 2020 / Published: 29 October 2020
(This article belongs to the Section Environmental Sustainability and Applications)

Abstract

:
Site-specific nutrient management can reduce soil degradation and crop production risks related to undesirable timing, amount, and type of fertilizer application. This study was conducted to understand the spatial variability of soil properties and delineate spatially homogenous nutrient management zones (MZs) in the maize belt region of Nigeria. Soil samples (n = 3387) were collected across the area using multistage and random sampling techniques, and samples were analyzed for pH, soil organic carbon (SOC), macronutrients (N, P, K, S, Ca and Mg), micronutrients (S, B, Zn, Mn and Fe) content, and effective cation exchange capacity (ECEC). Spatial distribution and variability of these parameters were assessed using geostatistics and ordinary kriging, while principal component analysis (PCA) and multivariate K-means cluster analysis were used to delineate nutrient management zones. Results show that spatial variation of macronutrients (total N, available P, and K) was largely influenced by intrinsic factors, while that of S, Ca, ECEC, and most micronutrients was influenced by both intrinsic and extrinsic factors with moderate to high spatial variability. Four distinct management zones, namely, MZ1, MZ2, MZ3, and MZ4, were identified and delineated in the area. MZ1 and MZ4 have the highest contents of most soil fertility indicators. MZ4 has a higher content of available P, Zn, and pH than MZ1. MZ2 and MZ3, which constitute the larger part of the area, have smaller contents of the soil fertility indicators. The delineated MZs offer a more feasible option for developing and implementing site-specific nutrient management in the maize belt region of Nigeria.

1. Introduction

Sustainable management of soil is of prime importance for increasing and sustaining crop yields globally and more importantly in sub-Saharan Africa (SSA), where food production is not at pace with the high food demand that resulted from the rapidly growing population [1,2]. Substantial area with high production potential in the SSA region has been degraded due to continuous cropping with poor nutrient management [3]. In the same vein, increasing demographic pressure has also resulted in the cultivation of marginal lands that are prone to fertility decline and other environmental degradations [3]. Use of the extended traditional fallow periods to restore soil fertility and enhance/sustain crop productivity is no longer feasible in the region. Consequently, the use of inorganic fertilizer to increase crops yield gained momentum among farmers in the region [4]. However, use of fertilizer in the region is being promoted through blanket recommendations in which the same rate is prescribed for heterogeneous soil and agro-ecological zones [5]. This practice leads to nutrient imbalance [6] and low fertilizer use efficiency [7], which affects the sustainability and productivity of farmlands [8].
Tropical soils (including those in SSA) are characterized by high spatial variability on both macro- and/or micro-scales due to the combined effects of intrinsic (e.g., bio-physical and chemical processes) and extrinsic factors (e.g., crop management, fertilizer and tillage, among others) operating at different intensities and on different spatiotemporal scales [9,10]. Spatial variability in soils and the corresponding variability of yield response of various crops to nutrient application have already been observed across SSA [11,12,13,14]. Therefore, uniform fertilizer recommendation and application might result in over application in zones, fields, or soils with high nutrient status and under application in those with low nutrient status. Several studies in SSA [11,12,13,15] have recommended that nutrient management and fertilizer recommendation strategies should be tailored towards field-, site-, or soil-specific conditions to achieve balanced and effective fertilizer use and close nutrients related yield gaps. Matching the right fertilizer with the right recommendation is therefore regarded critical in optimizing and sustaining crop yield and economic returns.
The soil management (or soil fertility management) zoning approach is a popular and feasible approach to developing and implementing site-specific nutrient management strategies to manage spatial variability on macro- and micro-scales [10]. In this approach, sites (fields) are divided into variable zones that are relatively homogenous and can be used as zones or clusters for the development of site-specific nutrient management and recommendations. The nutrient management or soil fertility management zone (MZ) is defined as a technique utilizing the spatial management tools of precision agriculture, which represent a cost-effective approach to improving crop productivity, nutrient management, and reducing detrimental environmental impact [16]. Spatial delineation of MZs with their specific soil management recommendations, has proved capable of providing sustainable management decision solutions for natural resource management in many crop productions zones [17].
Various qualitative approaches, such as detailed soil survey maps [18,19], yield maps [20], and interpretation of remotely sensed images [21] have been used for delineation of MZs. However, these approaches were criticized as being either expensive, less precise, laborious, or localized. Currently, a quantitative approach using geostatistics to delineate the MZs is recognized for its ability to provide precise spatial information about soil properties, which aids decision-making on appropriate use of farming inputs and soil management decisions [17,22]. With the use of geo-statistics, soil property values at sampled locations are used to predict those of unsampled locations based on the spatial correlation behavior of that property [23,24]. When multiple soil factors are involved, the development of MZs using geostatistical analysis also requires the use of a multivariate statistical tools. Principal component analysis (PCA) and clustering are the multivariate methods commonly used to delineate MZs in most natural resource studies [25]. As a dimension reduction technique, the PCA identifies an orthogonal linear recombination of correlated variables that summarizes the principal sources of variability in the data [26]. Some researchers used either PCA [26] or multivariate cluster analysis [27,28] for delineating MZs. However, Tripathi et al. [10], Mohamed et al. [17], and others combined both techniques to delineate MZs by performing the multivariate clustering on the principal components (PCs) scores of soil fertility variables and demonstrated that this technique improves the accuracy and representativeness of MZ delineation.
In Nigeria, the maize belt region is the most intensified farming area [29]. The region is characterized as the most suitable zone for arable crop production (especially maize) in the country due to its intense solar radiation, adequate and well-defined rainy season, and low incidences of pests and diseases [30]. In contrast, the small content of organic matter and the sandy nature of the soils in the region increases vulnerability to degradation and nutrient leaching [31]. Currently, maize and other crops produced in the region are being largely managed by uniform “blanket” fertilizer recommendation(s) developed in the 1970s [30]. With our discussion above in mind, this results in nutrient imbalances in the soil through over- or under-application of fertilizer. To our knowledge, there is a dearth of information about the soil spatial variability and corresponding MZs covering the entire maize belt region of Nigeria. Moreover, site-specific nutrient recommendation decision support tools such as the Quantitative Evaluation of the Fertility of Tropical Soils (QUEFTS) [6] and the Nutrient Expert (NE) tool [5] have been developed for maize in the Nigerian maize belt. The challenge remains to develop and integrate the geospatial soil MZs so that the models can be efficiently used among peasant small-scale farmers who, in most cases, cannot afford soil testing of their fields. As such, this study aimed to develop a soil fertility information guide for informed policy making and input provision, especially for fertilizer and extension services in this region, by (1) assessing the spatial variability of soil properties in the maize belt cropping region of Nigeria using geostatistical analysis, and (2) delineating nutrient management zones using the combination principal component and multivariate cluster analyses.

2. Materials and Methods

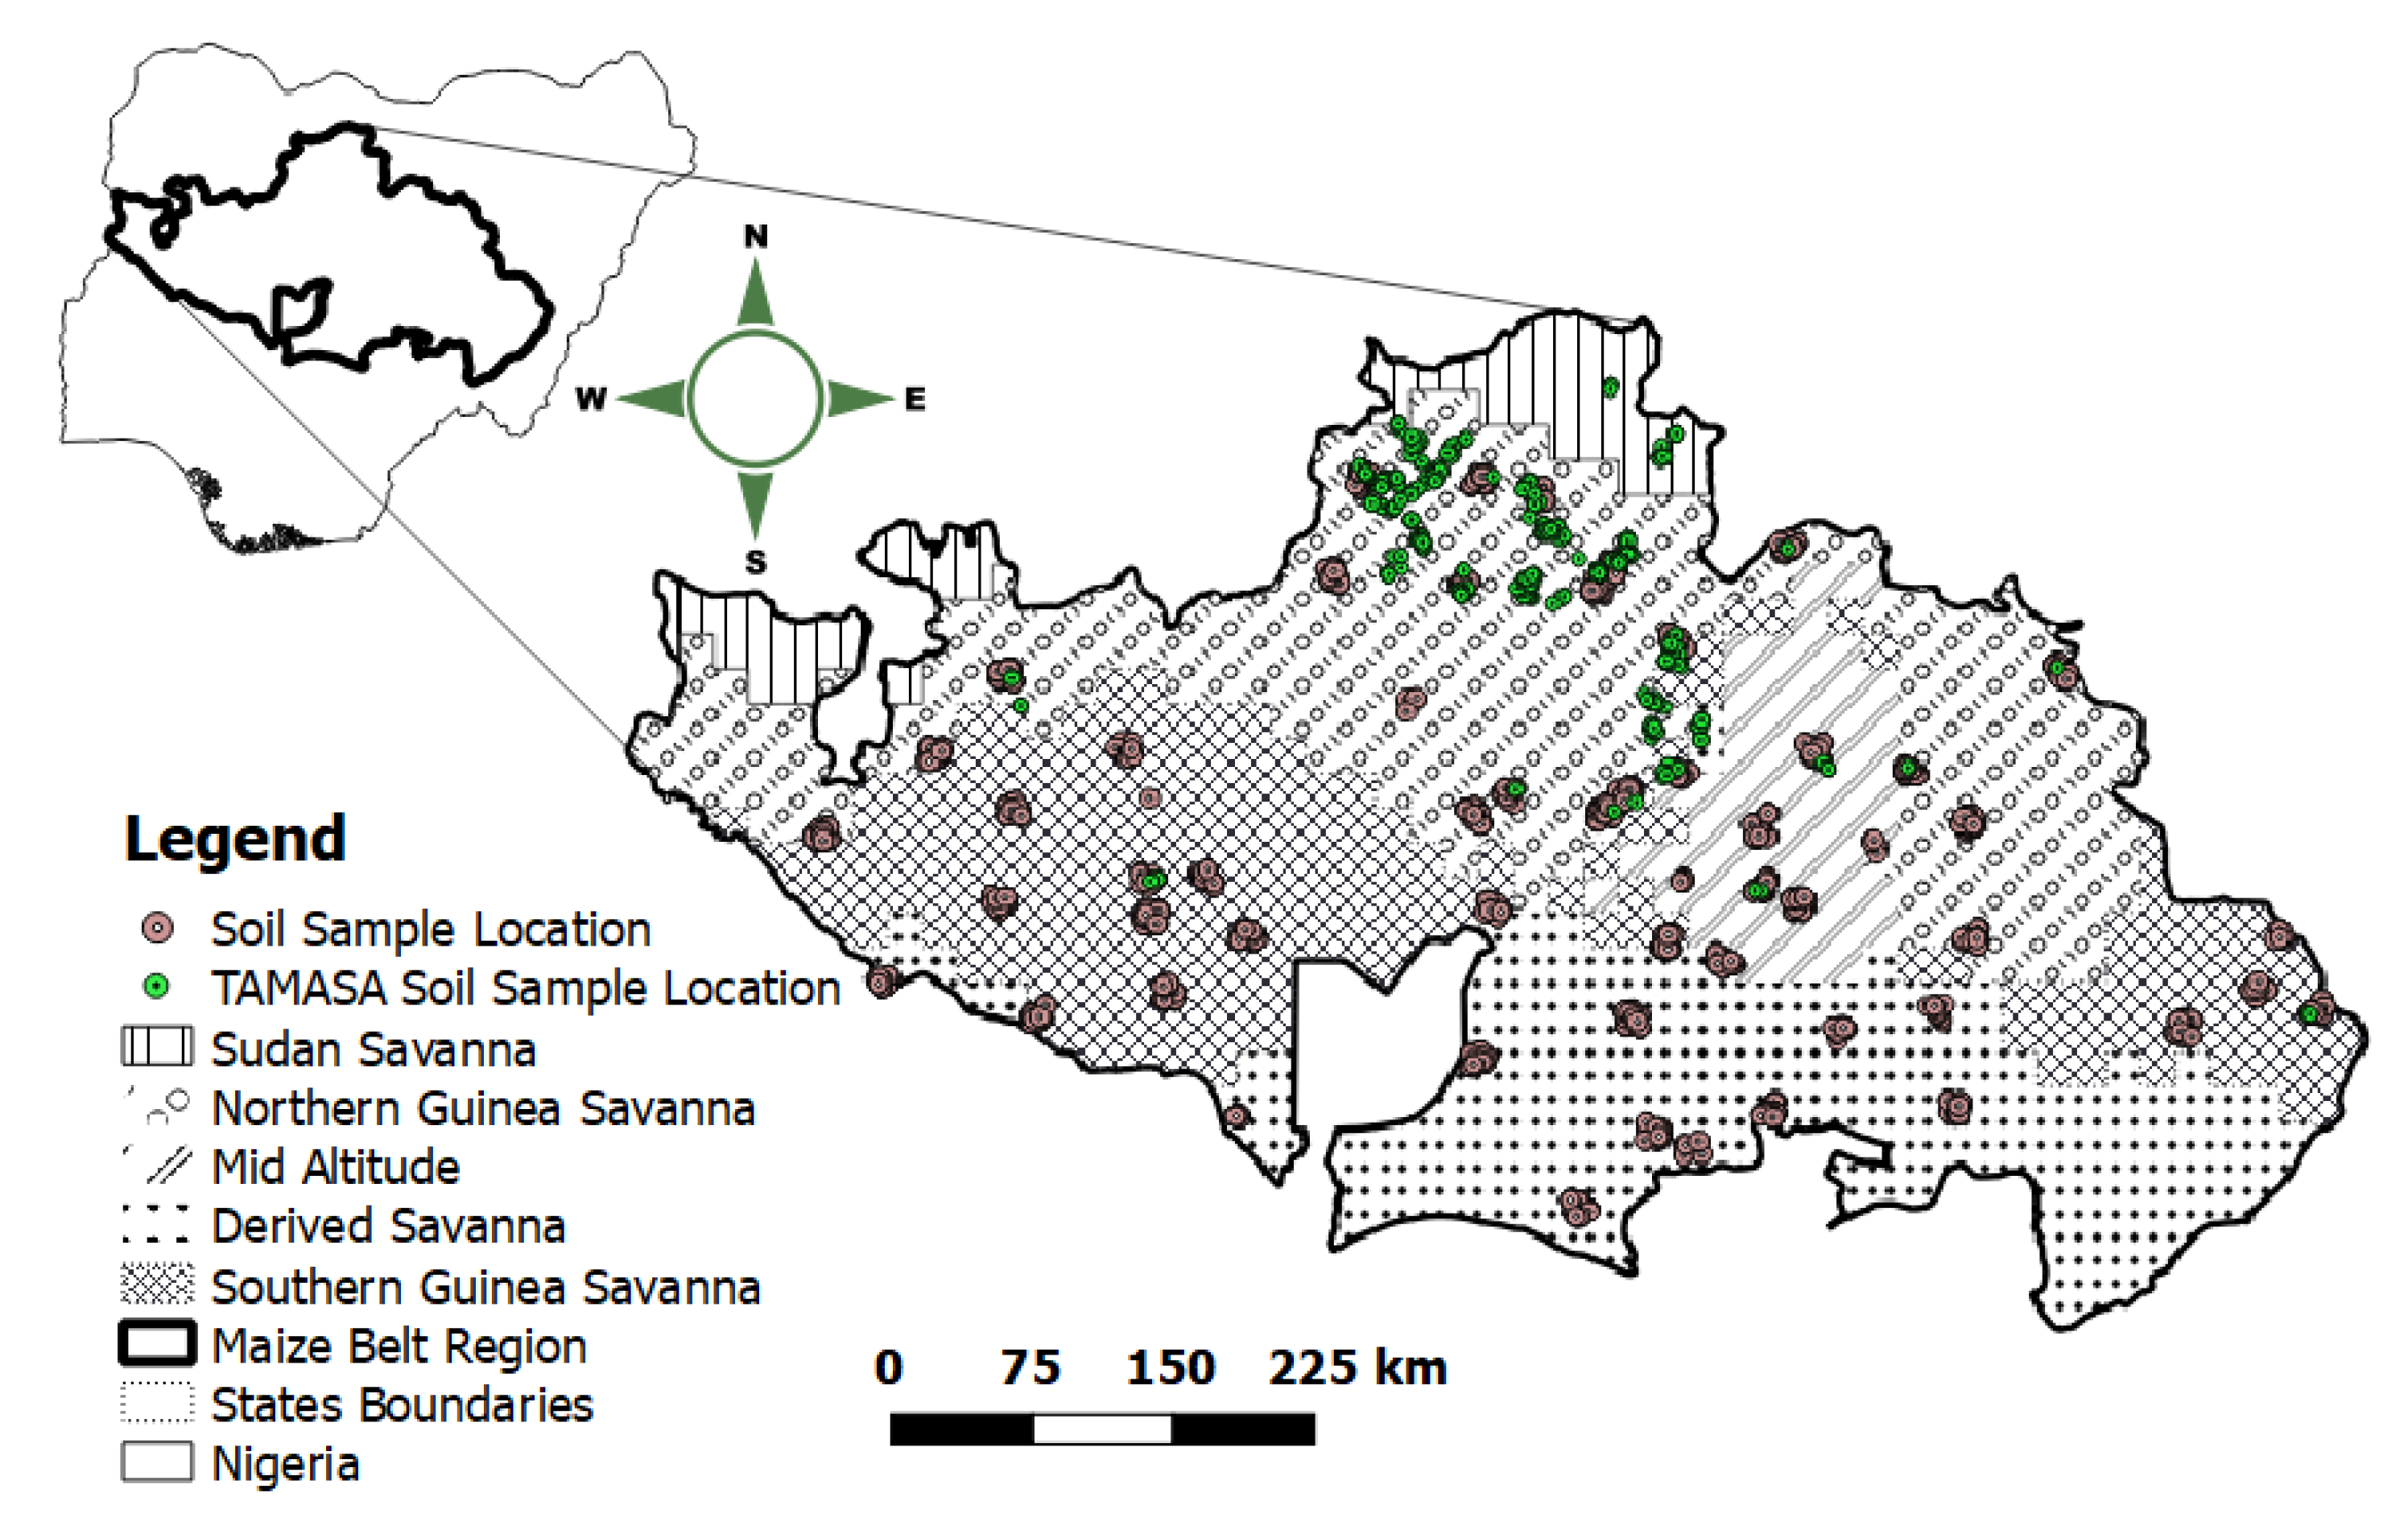
2.1. Description of Study Area

The study covered 60 of 133 administrative Local Government Areas (LGAs) across 8 administrative States that fall within the maize belt cropping region of Nigeria (Figure 1). The area encompasses five major agro-ecologies as follows: (i) derived savanna (DS), which is a transitional area found in the southern part of the area bordering the forest vegetation zone and the savannas; (ii) the southern Guinea savanna (SGS); (iii) northern Guinea savanna (NGS); (iv) Sudan savanna (SS); and (v) mid-altitude (MA). Altitude increases from less than 100 m in the DS to 1400 m in the MA. Dominant soils in the area are Entisols/Inceptisols, Alfisols, Ultisols, and Vertisols. Oxisols are also present but on a much smaller scale and restricted only to the extreme southern parts of the area [30]. Rainfall is unimodal and decreases in amount from 1800 mm in the derived savanna to 700 mm in the Sudan savanna, in the duration of seven to four months in the same direction as rainfall amount [30]. Mean annual minimum and maximum temperatures are 16 and 33 °C, respectively, throughout the entire region.
Crop production in the region is significantly at subsistence level and is dominated by smallholders (75%) with an average land holding between 0.8 and 1.5 ha [32]. Major crops grown in the area are cereals, which include maize, sorghum, millet, and rice cultivated as sole, intercropped, or in rotation mostly with legumes such as cowpea, soybean, and groundnuts [33,34]. Production is rainfed, with little commercial irrigation for production of high value crops like vegetables, rice, and wheat.

2.2. Soil Sampling and Laboratory Analyses
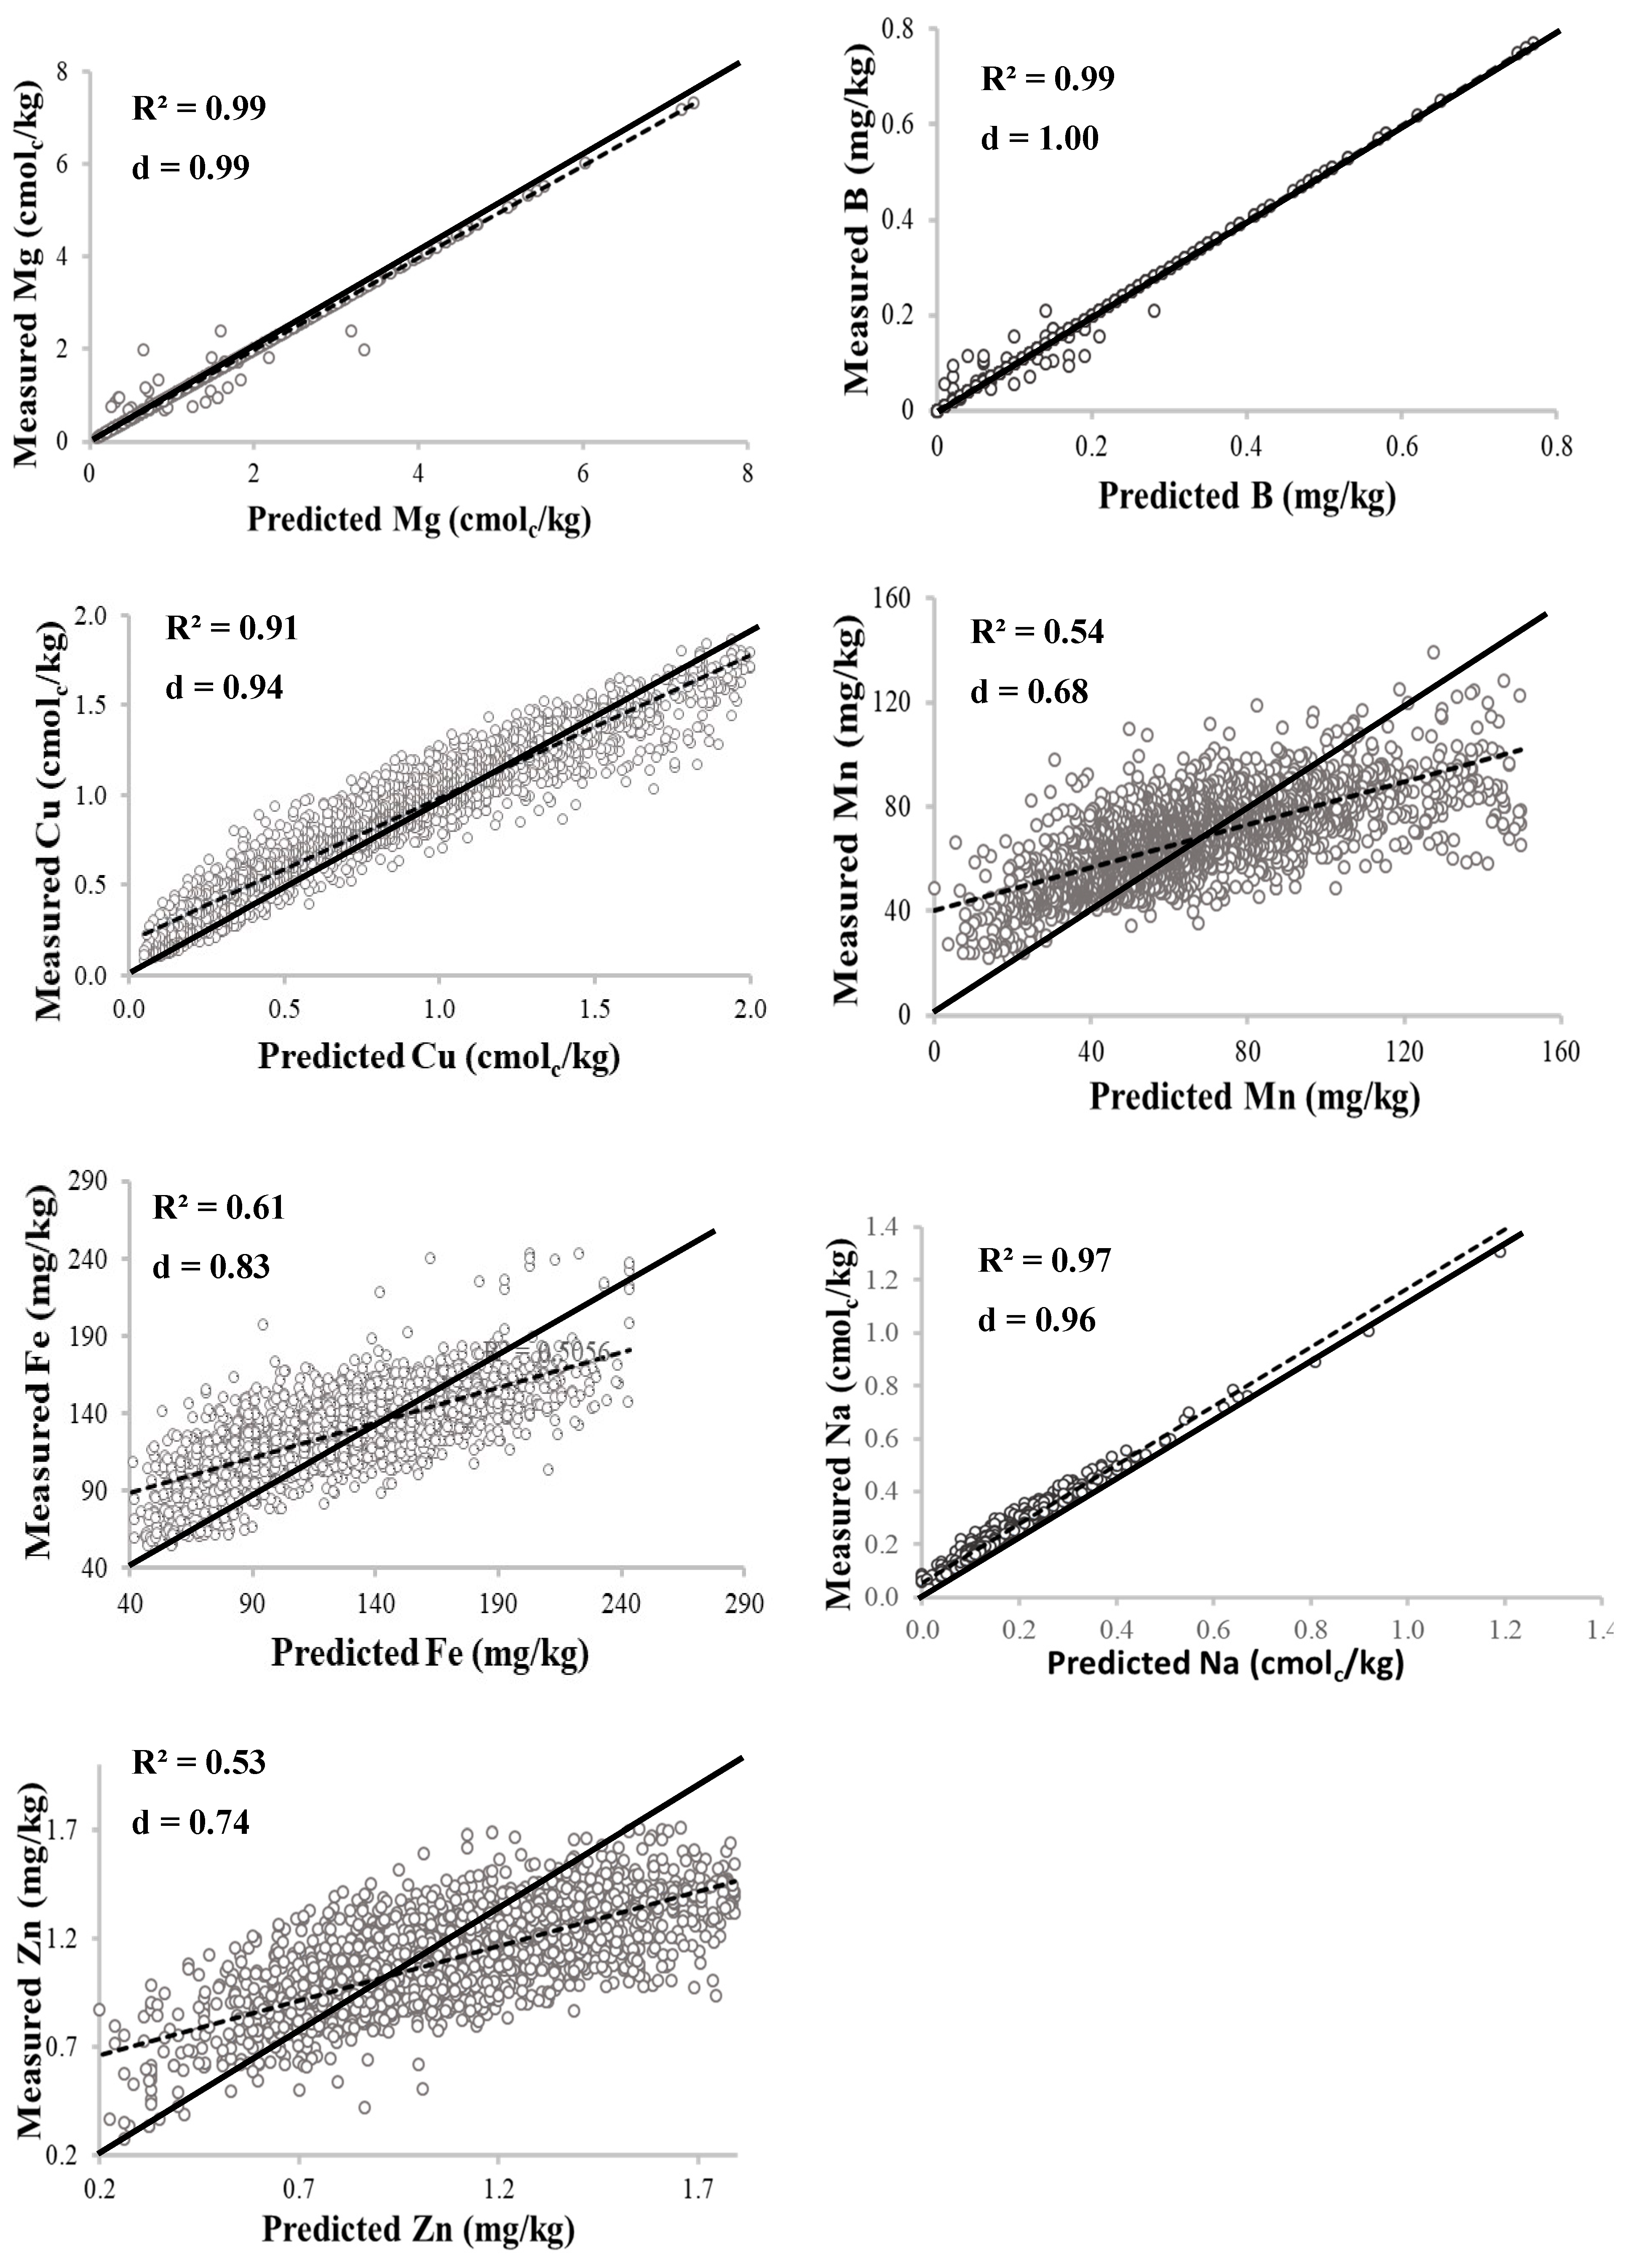
A stratified multistage sampling procedure on a 1 km2 resolution Discrete Global Grid (DGG) of the study area was used for soil sampling site selection. Sixty (60) of the 133 LGAs in the study area were selected based on the criterion that they contain more than 3 unique cropland sentinels. In each of the 60 selected LGAs, a 10 × 10 km sentinel was further selected at random. In each of the 60 selected sentinels (1 in each LGA), 10 grid cells of 1 × 1 km were then randomly selected. Finally, 5 (100 × 100 m) grid cells were randomly selected from the geographical centroid of the 10, 1 × 1 km grid cells in each of the 60 sentinels (resulting in 3000 geo-referenced points) and used as sites for soil sampling. Soil samples were collected in 2016 by sampling from 4 points at each identified site at a depth of 0–20 cm using a soil auger. Other soil data used in this study were obtained from published (95 data points described by Shehu et al. [13]) and unpublished data sets (292 points) collected between 2016 and 2018 by the project “Taking Maize Agronomy to Scale in Africa” (TAMASA) in Nigeria. Predictions based on AfSIS Bruker-Alpha KBr Mid InfraRed (MIR) spectral models were used for individual Mehlich-3 extractable nutrient contents as well as pH, effective cation exchange capacity (ECEC), SOC, and total N (Ntot) for the 3000 soil samples. The procedure for soil sampling and laboratory analyses of both the published and unpublished datasets obtained from the TAMASA project remains the same as described by Shehu et al. [13].

2.3. Data Analyses

2.3.1. Descriptive Statistics

The data for each of the measured soil parameters were first subjected to descriptive statistical analysis (which include mean, standard deviation, minimum, maximum, lower and upper quartiles, skewness, kurtosis, and coefficient of variation (CV)). Correlation analysis was also performed to understand the relationships among the soil properties using JMP Pro version 14 statistical software.

2.3.2. Geostatistical Analysis

Geostatistical analysis of the soil parameters was performed in Geostatistical Analyst extension module of ArcGIS 10.4.1 software. Ordinary kriging procedure was used to estimate interpolated values of each soil parameter at non-measured points based on Equation (1) [35]:
γ ( h ) = 1 2 N ( h ) i = 1 N ( h ) [ Z ( x i ) Z ( x i + h ) ] 2
where γ ( h ) represents semivariance at lag distance (h), N (h) is the number of measured pairs separated by (h), and Z(xi) and Z (xi + h) are sampled measured values at ith sampling point separated by vector (h).
Before fitting the semi-variogram model, the skewed values of soil properties were log-transformed to assume a near normal distribution. To select the best fitting model, different variogram models, namely, spherical, exponential, stable, circular, and Gaussian, were fitted to each soil parameter. Each model was evaluated for interpolation bias and accuracy based on three cross validation indices: root mean square error (RMSE), index of agreement (d-index), and coefficient of determination (R2) (Equations (2)–(4)).
R M S E =   i = 1 n ( M i   P i ) 2 n
d = 1   i = 1 n ( P i   M i   ) 2 i = 1 n { | ( P i M ¯ ) | + | M i   M ¯ | } 2
R 2 = [ i = 1 n ( M i M ¯ ) ( P i P ¯ ) ] i = 1 n ( M i M ¯ ) 2   i = 1 n ( P i P ¯ ) 2 2
where M and P are respectively the measured and predicted values at ith point, M   ¯ is the mean of the measured values, P   ¯ is the mean of the predicted values, and n is the number of observations.
The RMSE calculates the degree of model error of estimation; thus, a lower RMSE value indicates better model performance [36]. The d-index, as recommended by Willmott [37], and R2 are non-dimensional values in the range of 0–1. Values of zero (0) represents no agreement between measured and predicted values, while 1 represents perfect agreement between measured and predicted values [38]. The d-index represents the ratio of mean square error to potential error. The coefficient of determination (R⁠2) estimates the combined dispersion against the single dispersion of the measured and predicted series [39]. The best fitting model for each parameter is that with both lowest RSME, highest d, and highest R2 values and is thus selected because it has the highest prediction accuracy. Therefore, the model with higher prediction accuracy for individual soil property was selected for the spatial analysis.
Nugget-to-sill ratio was used to assess the spatial dependence of soil parameters (Equation (5)) as proposed by Cambardella et al. [40]. Low ratio (≤0.25) indicates high spatial dependence, moderate ratio (<0.75) indicates moderate spatial dependence, and high ratio (≥0.75) indicates weak spatial dependence.
n u g g e t / s i l l = C 0 C 0 +   C 1
C0 is the nugget effect; C1 is the partial sill of the semivariogram.

2.3.3. Principal Component Analysis

Because of the large volume of data points, multiple numbers, and co-linearity of the variables involved in this study, there might be the tendency for less stable variables to result in less reliable eigenvector values. This may consequently compromise expressions of the results. Based on that, principal component analysis (PCA) was used to summarize major variations contained in the whole dataset to reduce the number of uncorrelated dimensions, called the principal components (PCs). Use of PCA to discard correlated or redundant variables was described in McCabe [41]. Given that each variable is standardized to obtain a variance of 1 in PCA, only PCs with eigenvalues ≥1 were selected, so that the variability explained by each selected PC is greater than that attributed to individual parameters. The scores of the selected PCs were used to delineate the management zones.

2.3.4. Multivariate K-means Clustering

The scores of the selected PCs were used to develop MZs based on K-means cluster analysis performed using JMP Pro version 14. As an unsupervised machine learning technique, a cluster algorithm identifies sub-groups of variables in a dataset that have similar patterns and groups them as clusters. The major aim of clustering is therefore to create homogeneity among members of the same cluster while maximizing heterogeneity among clusters. In K-means clustering, the optimum number of clusters (K) that defines the dataset is selected when the algorithm stops detecting new trends in the data. At this point, the cubic clustering criterion (CCC) or the stopping criterion is high [42]. Finally, analysis of variance (ANOVA) was performed to compare the soil contents of each parameter in the different clusters (MZs). Mean values with significant differences (p ≤ 0.05) among the MZs were compared and separated using Tukey’s HSD (Honestly Significant Difference) test.

3. Results and Discussion

3.1. Exploratory Statistics of the Soil Properties

The descriptive or exploratory statistics summarizing the status and spatial variability of the soil properties are presented in Table 1. Except the soil pH, significant variability in the spatial distribution of the soil properties within the study area (as indicated by the high coefficient of variability) have been observed. The average soil pH (5.99) in the study area fell within the moderately acidic category, and this level is considered suitable for most crops [43]. The average content of SOC in the study area (i.e., 0.79%) is rated low (according to the Esu [44] soil fertility classification of Nigerian Savanna soils), despite the SOC content varying from 0.11 to 3.85%. The low average level of SOC might be linked to the low application of organic manure as most farmers in the area seldom leave crop residues on their fields during harvest.
Average total N {Ntot} (i.e., 0.65 g/kg) and available P (i.e., 4.29 mg/kg) in the area were classified as low according to the National Special Programme for Food Security (NSPFS) [45] soil fertility classification. Low N and P contents in some parts of the study area have been similarly reported in previous studies by Ekeleme et al. [46], Kamara et al. [47], and Shehu et al. [48]. The coefficient of variation (CV) of exchangeable cations (Ca, Mg, Na and K) in the area ranged between 52 and 67%. The average contents of exchangeable cations fall within the moderate fertility class (except K, which falls within high fertility status) according to Esu [44] fertility ratings of Nigerian savanna soils. This finding corroborates those of Shehu et al. [6] and Jimoh et al. [49] who also reported moderate to high levels of exchangeable cations, which can be related to the soil development process of the area. Another study in this area by Møberg and Esu [50] reported similar findings and attributed the results to the presence of large deposits of K-bearing Feldspar minerals in most soils in the area.
Distribution of micronutrients Fe, Mn, Zn, Cu, and B exhibits moderate to high spatial variability in the area based on CV > 30% according to Wilding [51] classification. Average values for Fe (129 mg/kg) and Mn (68.34 mg/kg) are very high, while that of Zn (1.18 mg/kg) is moderate according to Esu [44] soil fertility classification. These findings are contrary to those of Shehu et al. [6], where all these nutrients were observed to be high in the area. Kparmwang and Malgwi [52] similarly found moderate levels of these nutrients in the same area. The content of B in the study area is small (0.085 mg/kg) and varies over a range of 0.01 to 0.77 mg/kg. Copper also shows high variability (ranging between 0.05 and 30.57 mg/kg). The moderate to high spatial variability observed in the distribution of most of the studied soil nutrients re-justified the adoption of site-specific nutrient management to ensure balanced nutrient supply, improve nutrient limited yield, and maintain good soil health [53].

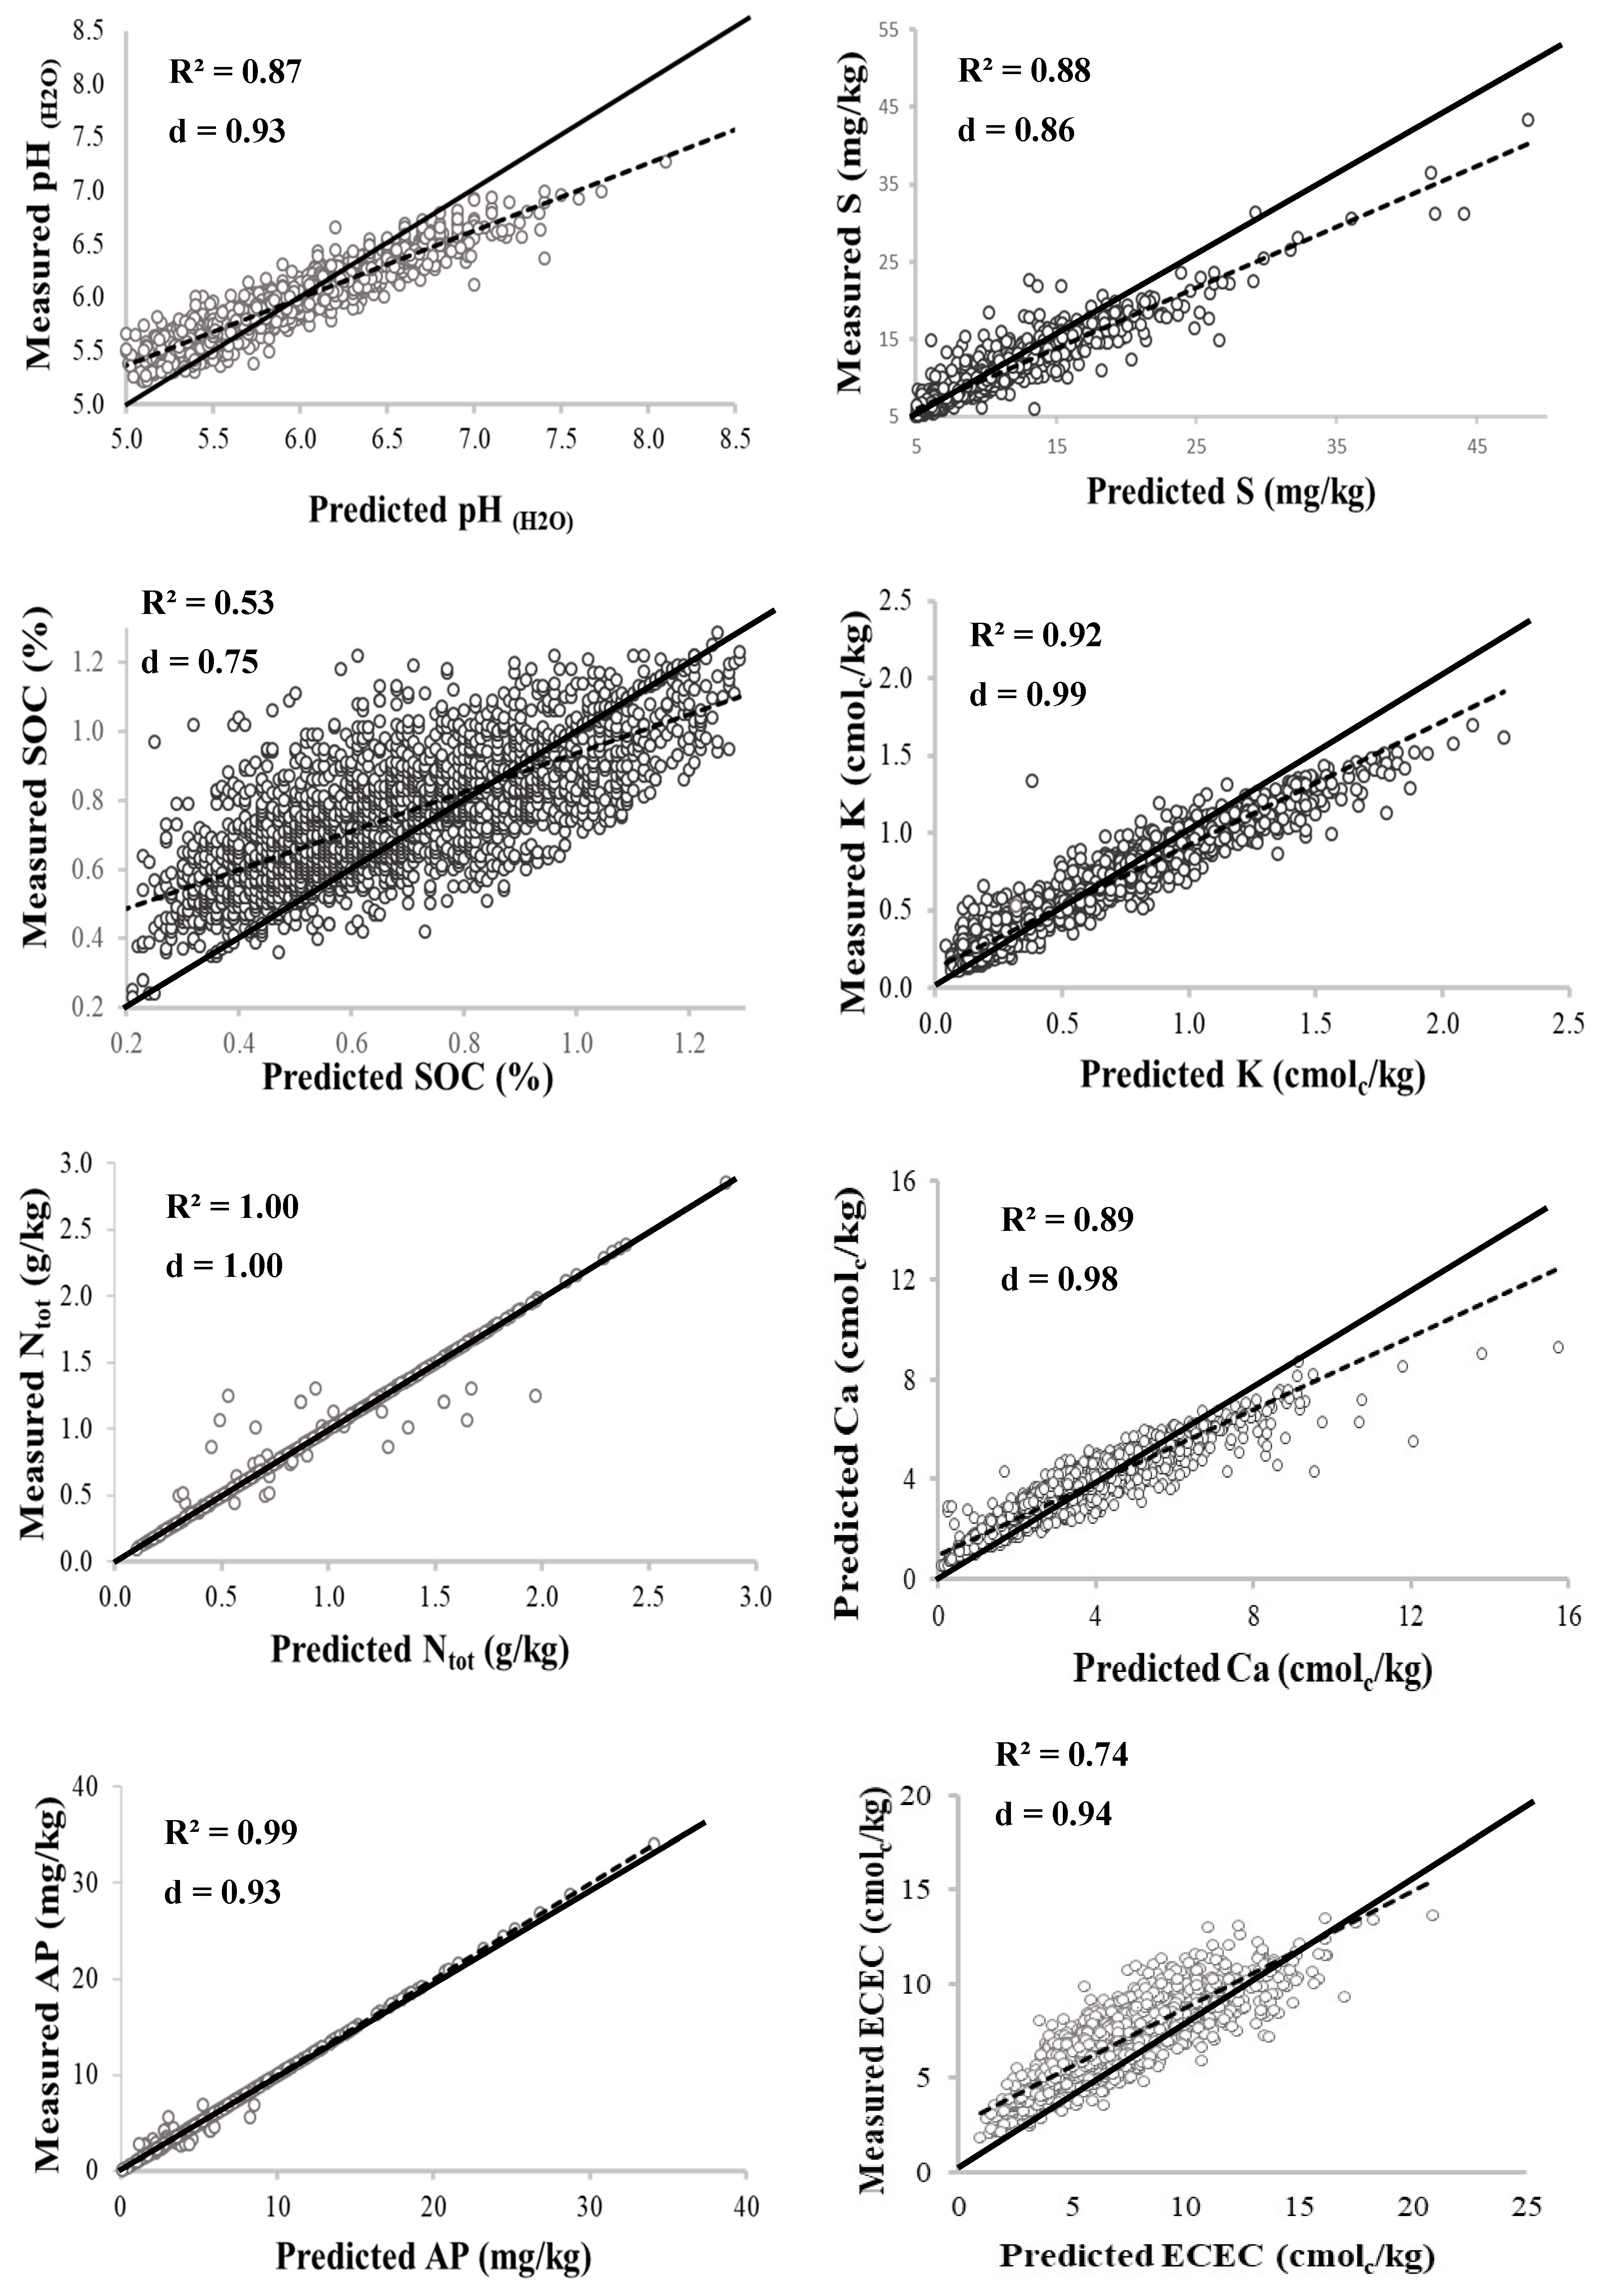
3.2. Relationships between the Soil Properties

The result of correlation analysis among the soil properties is presented in Table 2. Significant positive correlation was observed between SOC and other soil properties (with the exception of soil pH), though the strength of the correlation strongly varied among the soil properties. The soil properties with strong positive correlation (i.e., correlation coefficient >0.50) with SOC are Ntot, S, and B. This implies the importance of soil organic matter in soil nutrient supply and bioavailability, especially in areas with high sand content. Moreover, the ECEC is largely dependent on the soil’s organic matter (correlation coefficient 0.48). Studies by Zingore et al. [54] and Vanlauwe et al. [55] have recommended the rotation of cereal crops with legumes, crop residue preservation, and the application of well managed manure among others as measures to increase the SOC in SSA. A significant but weak negative correlation was observed between soil pH, SOC, and Ntot as well. Likewise, a weak positive correlation was found between the soil pH and Ca, Mg, and available P (AP). This might indicate the potential for rainfall (which commonly comes in high intensity in the study area) to substantially leach out Ca and Mg, thus decreasing the soil pH. Meanwhile, the moderately acidic nature of the soils (as explained above) and increase in soil pH can enhance the AP, thus justifying the positive relationship between soil pH and AP. It has been documented that only at a pH above 7.5 can an increase in soil pH reduce AP due to the formation of calcium phosphates.

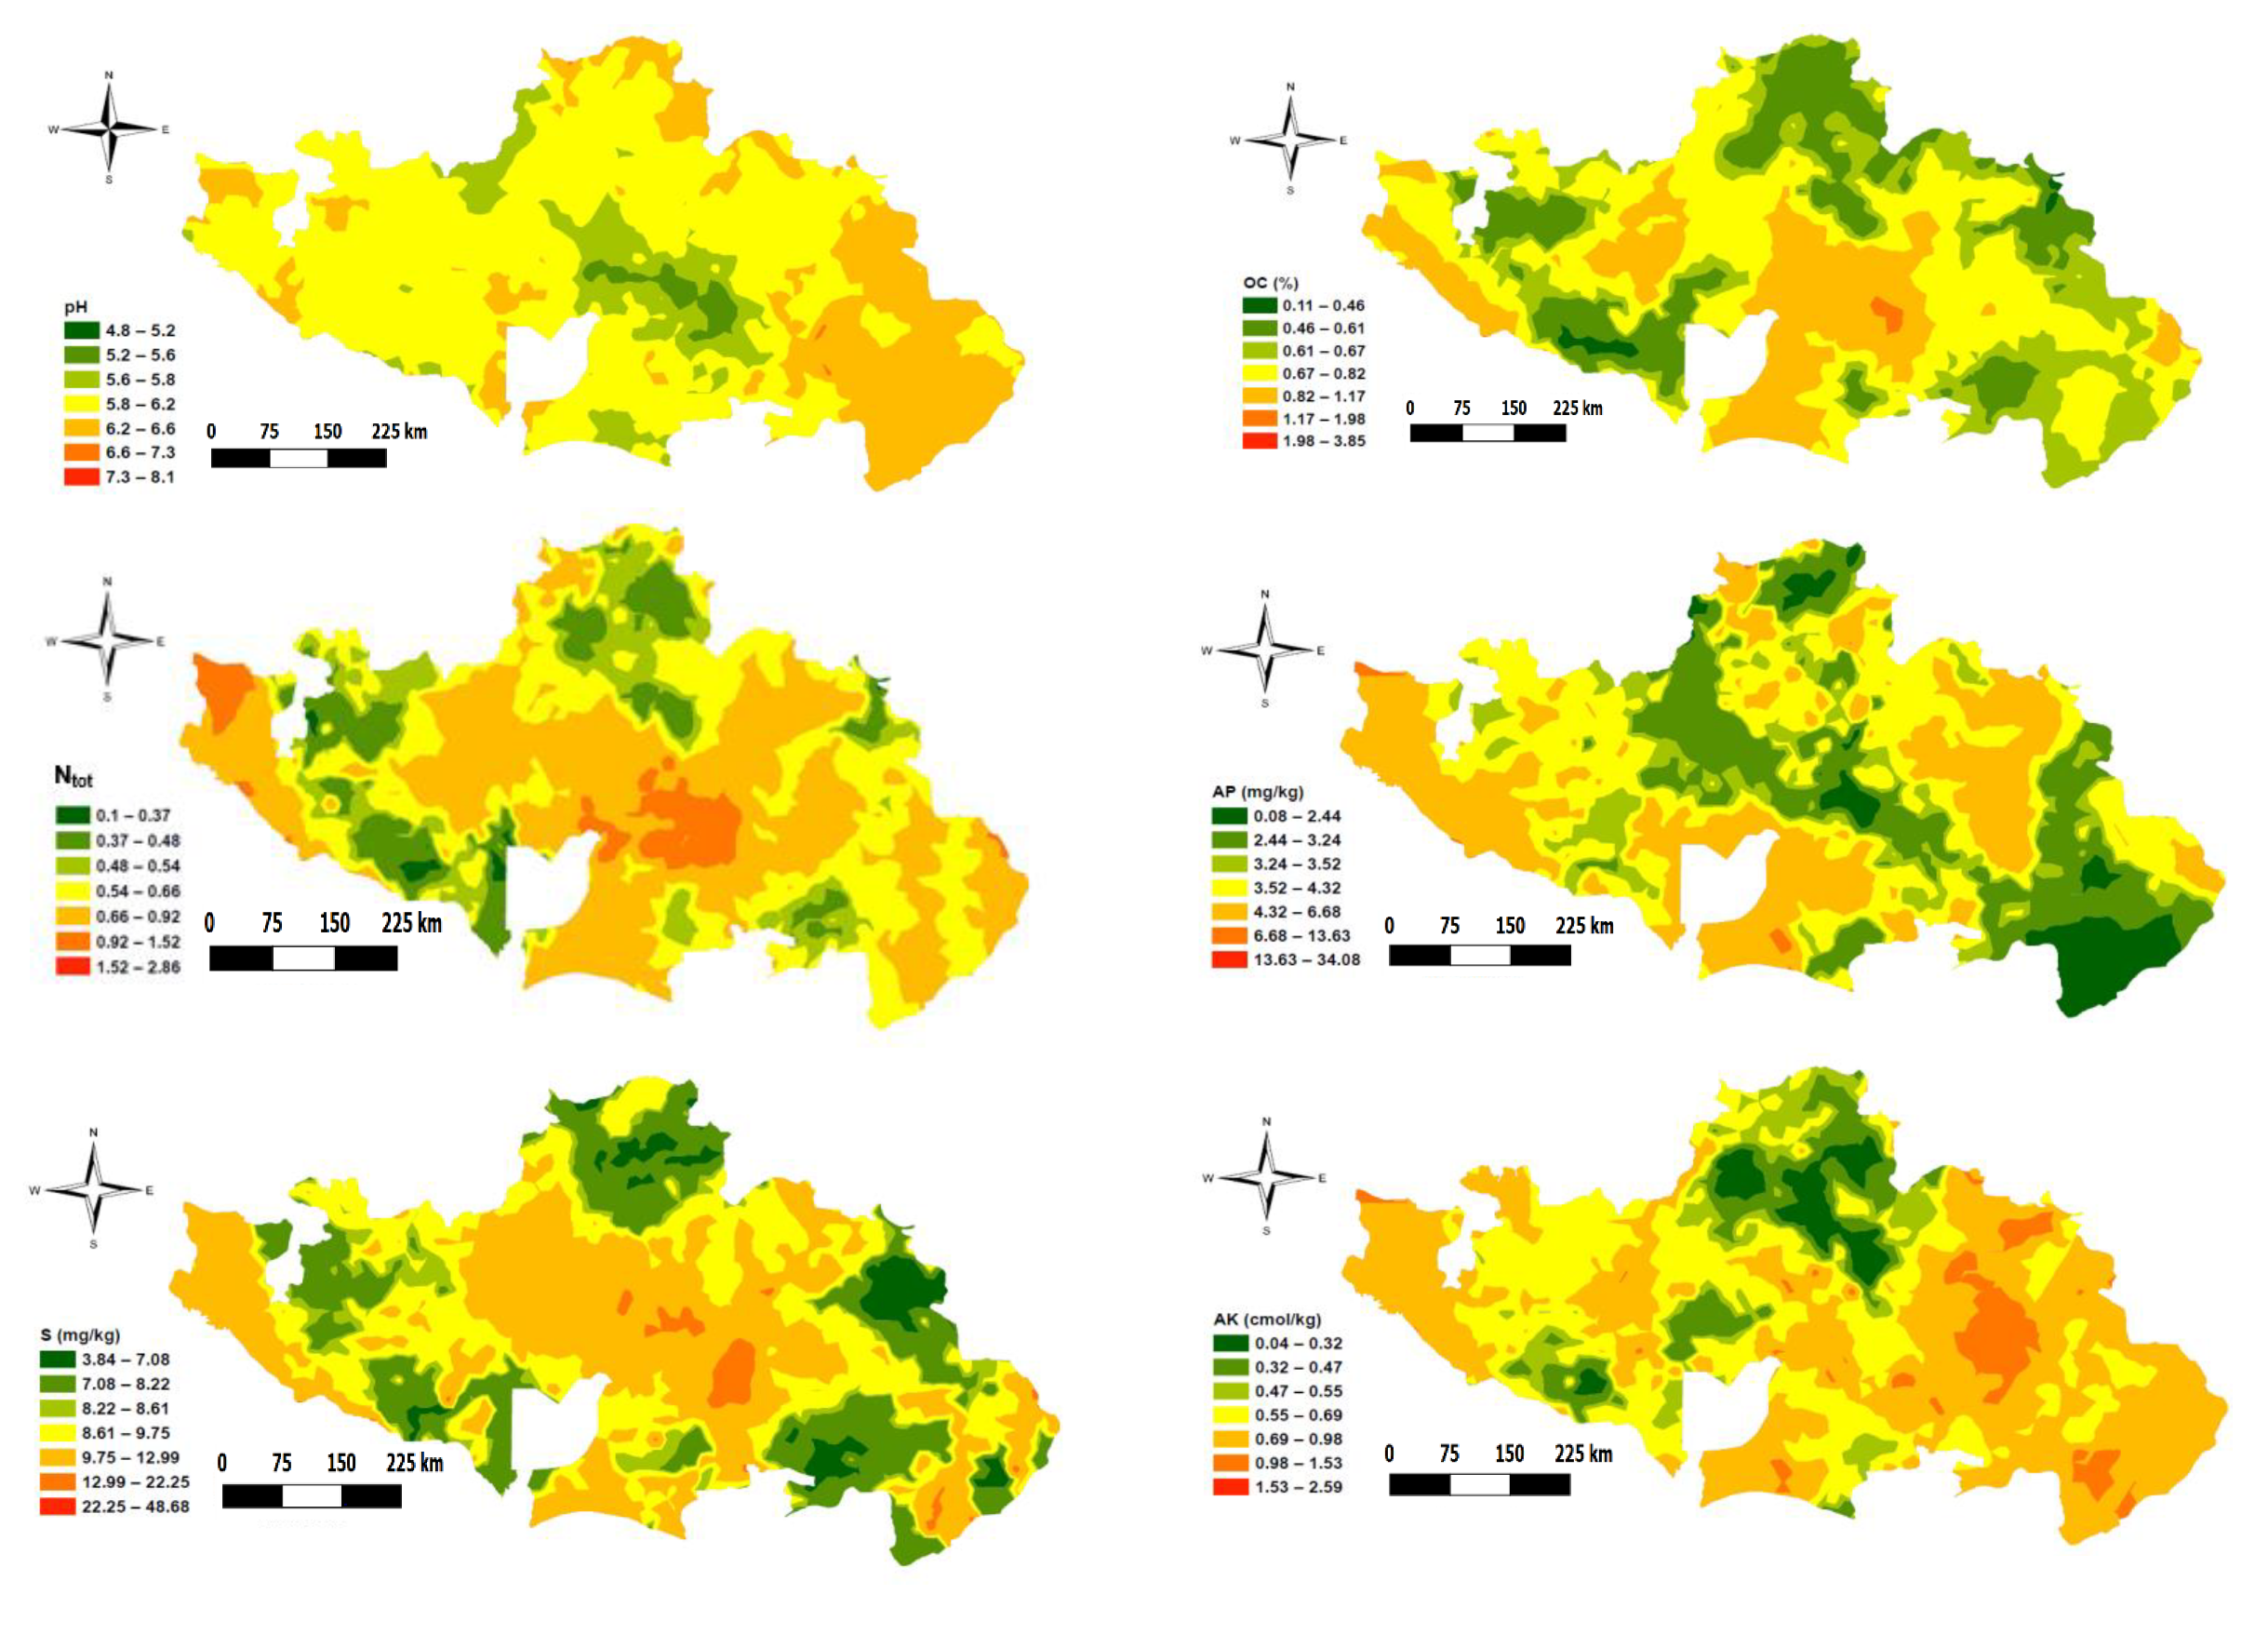
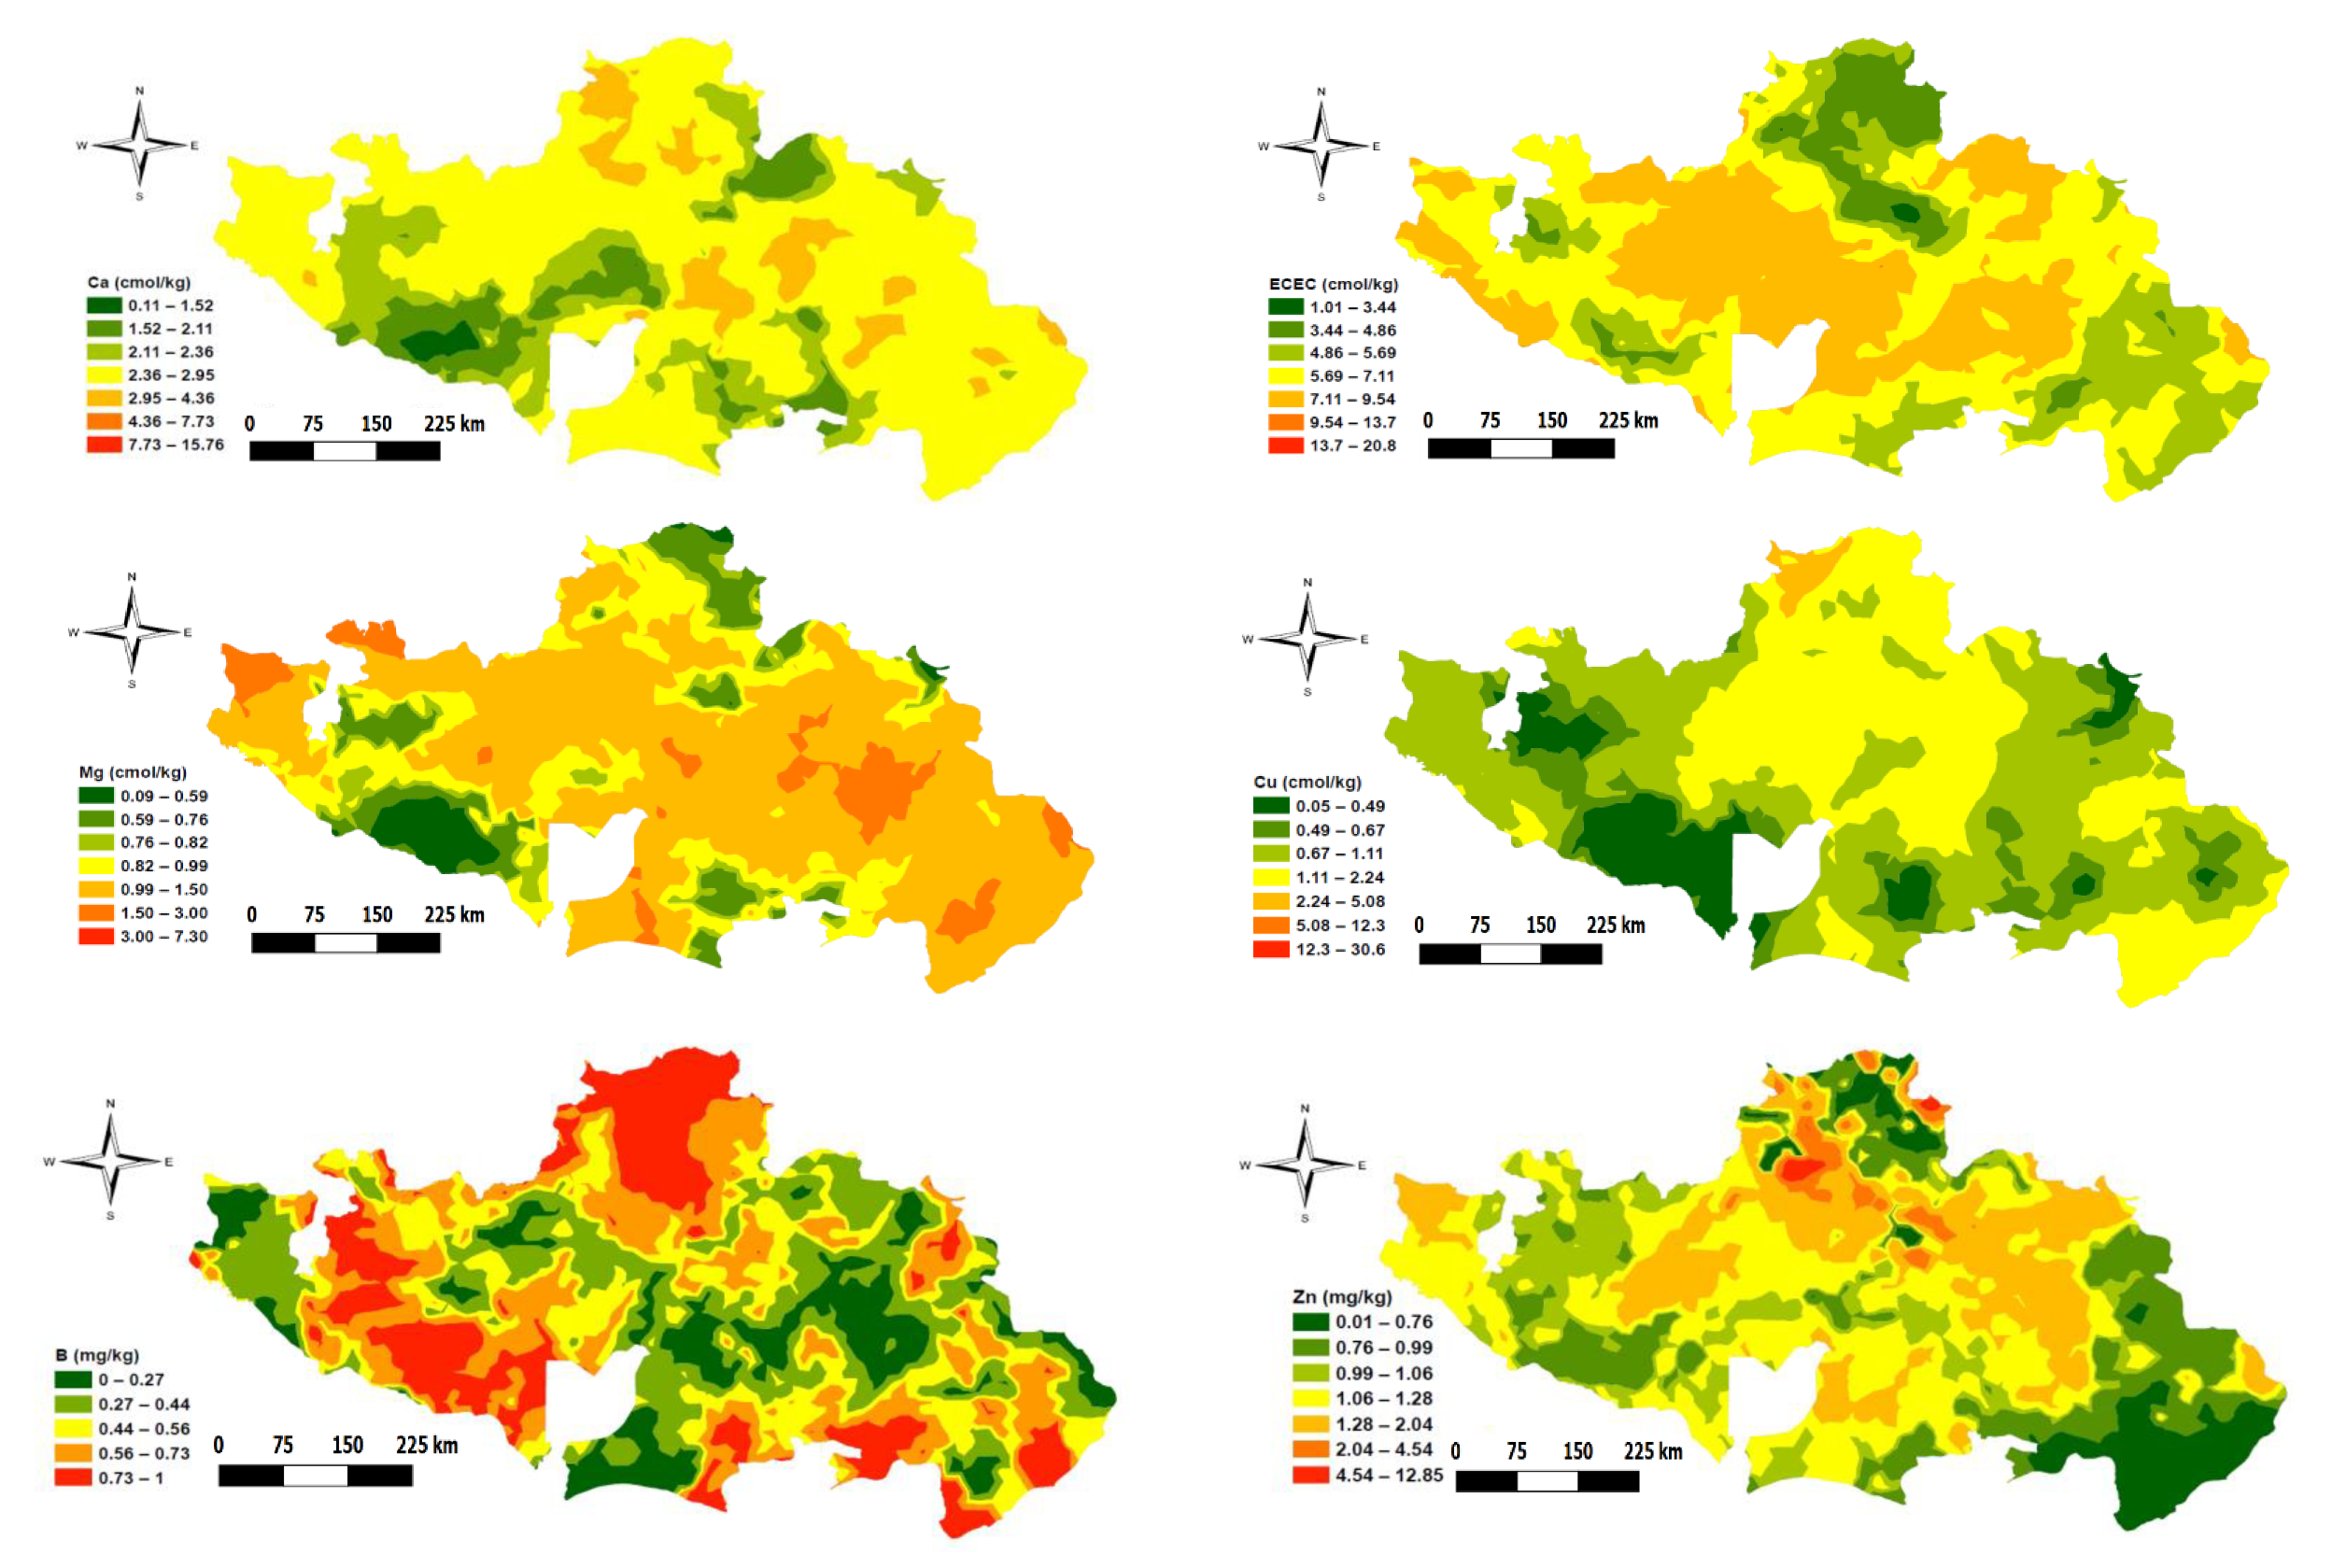
3.3. Geospatial Analysis of the Soil Properties

As shown in Table 1, the data distribution of all the soil properties was skewed, and this indicates a lack of normality in the distribution. Based on that, the data was log-transformed before performing geostatistical analysis. Before choice of model, different models (stable, exponential, Gaussian, spherical, and circular) were evaluated for prediction accuracy based on cross validation using RMSE, d-index, and R2 as earlier presented above in the materials and methods section. Summary of the geostatistical characteristics of the soil properties is presented in Table 3, while cross validation results are shown in Figure 2. For most of the properties, the stable model function had the highest prediction accuracy and was therefore selected. Other model functions selected were exponential for S, Cu, Fe, and Na; circular for P; and spherical for Zn. However, studies of Jiang et al. [56], Tripathi et al. [10], and Mohamed et al. [17] found that the spherical function is the best fitting for most environmental variables.
The nugget-to-sill ratio measures the spatial dependence of variables [40]. A ratio of ≤0.25 means that a large portion of variance was introduced due to intrinsic/localized soil factors such as parent material and other characteristics inherent to the soil. Ratio ≥0.75 indicates that variance was largely a result of extrinsic factors, such as cropping practice, fertilizer application, and farming systems, which vary among farmers [10], while the ratio between 0.25 and 0.75 indicates that variance was a result of the interaction of intrinsic and extrinsic factors. As presented in Table 3, overall, the nugget-to-sill ratio ranged from 0.000 (for available P) to 0.719 (for Ca), while overall range values varied from the smallest (1100 m) for K to the largest (9515 m) for Ca. This indicates that the spatial distribution of most studied soil properties possesses high spatial dependence across the area of study. The range value of semivariogram determines the distance after which spatial dependence ceases to exist. Therefore, the smaller range and nugget-to-sill ratio values of K mean that K variations in the soil are strongly due to inherent soil and environmental factors. Moreover, the high range and nugget-to-sill ratio values of Ca hint to artificially or anthropogenically induced variability [40], probably due to farming practices and soil management history.
A map of the study area showing the spatial distribution of the soil variables is presented in Figure 3. As observed through the significant correlation between the variables (Table 2) earlier presented above, the distribution pattern in the study area among the soil properties likewise followed a similar trend (i.e., properties with positive correlation showed a similar spatial distribution pattern in the study area, and vice versa). For instance, the highest correlation between SOC and Ntot resulted in a very similar distribution pattern. Equally, variables that have a negative correlation with pH showed high values where pH was low, and vice-versa. This is consistent with results reported by Mohamed et al. [17], which showed a negative correlation between SOC, N, P, and K with pH. Except for Cu and B, most of the soil properties values were lower in the northern part of the study area, which constitutes parts of northern Guinea and Sudan savannas. Levels of SOC, Ntot, S, K, Ca, ECEC, and Mg were higher around the central part of the study area, which is characterized by mid-altitude/mountainous vegetation. The higher content of these nutrients (i.e., SOC, Ntot, S, K, Ca, ECEC, and Mg) around the mountainous vegetation area could be related to its higher altitude (i.e., >1400 m above sea level). The higher altitude area is associated with high rainfall and low temperature that slows the rate of soil biological activities and thus creates rich nutrient contents in the soil. Lower nutrient levels in the extreme south-western part of the area could be explained by their proximity to the river, low altitude (<100 m above sea level), and higher rainfall (>1500 mm), which encourage heavy nutrient leaching beyond the crop rooting zone.

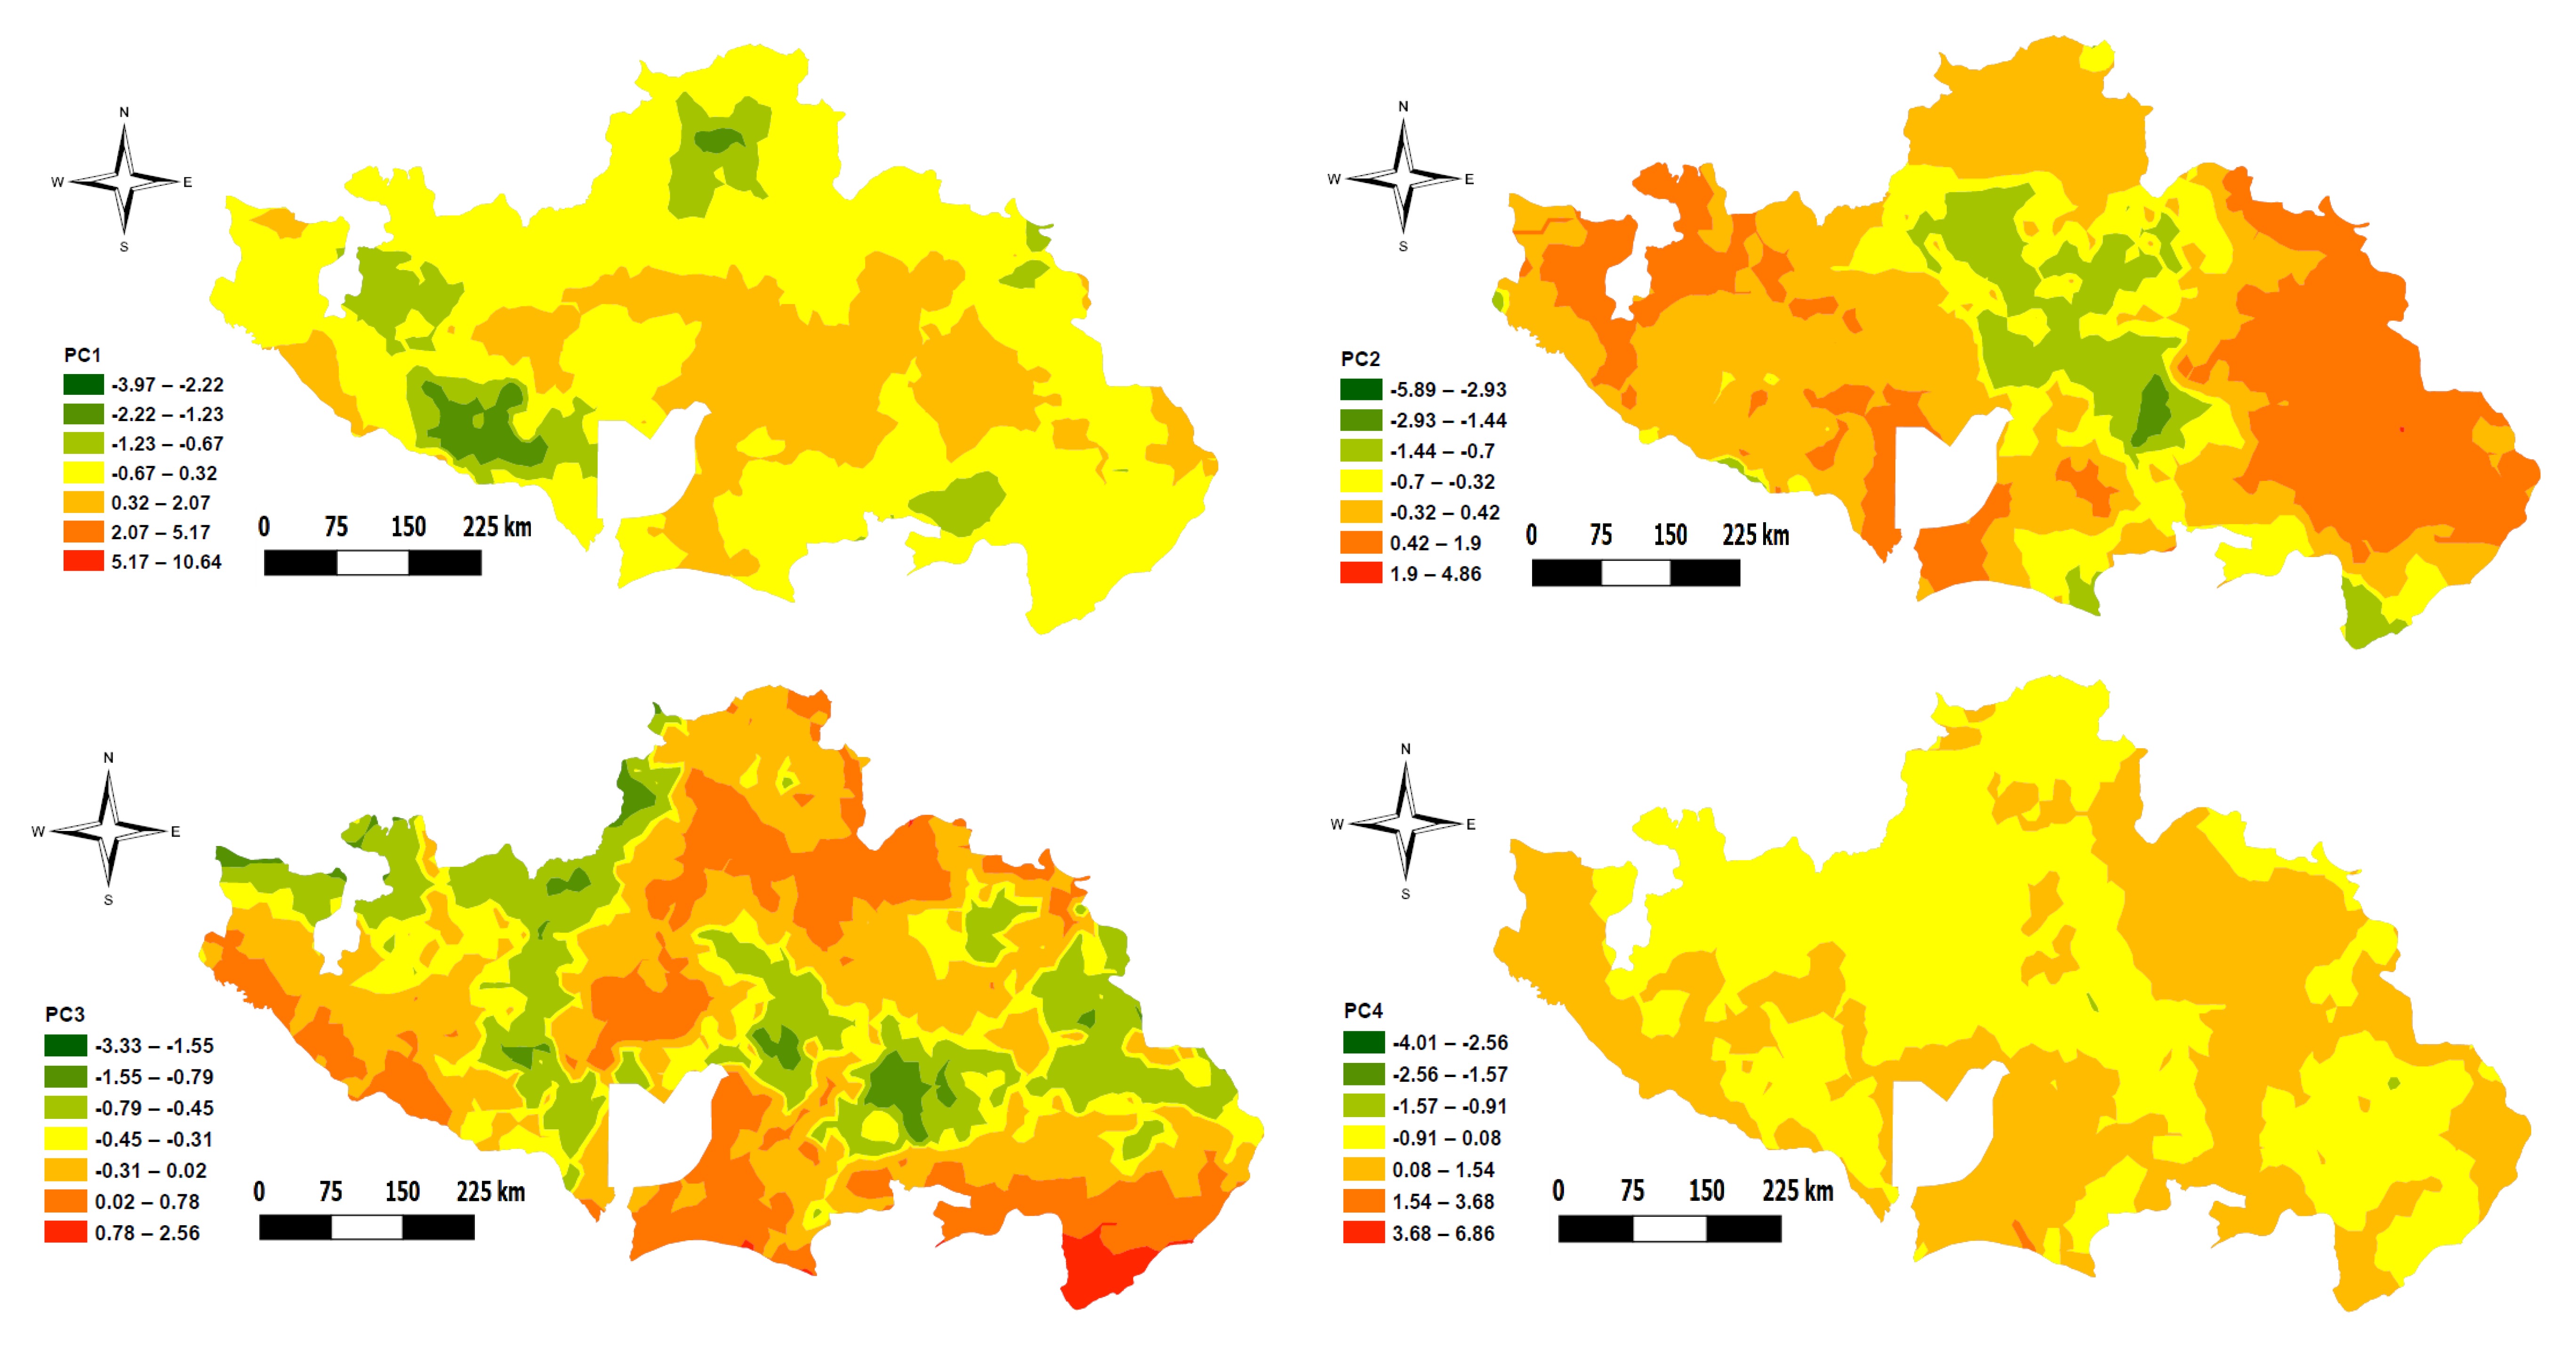
3.4. Principal Component Analysis (PCA)

The results of correlation analysis in Table 2 indicated significant correlation among the soil variables. For this reason, the PCA was performed to summarize the variability in the data into principal components (PCs). The number of PCs produced (Table 4) is always equal to the number of variables involved in the analysis. Fifteen PCs were produced, out of which the first 4 that together explained 62.14% of the variation were retained for further analysis based on having an eigen value ≥1. As explained by Sharma [57], a PC with eigen value ≥1 explains more variance than an individual attribute. The maps of the PCs are shown as Figure 3.
The result of component is presented in Table 4 and Table 5. Principal component 1 explained 34.01% of the total variance in the data (Table 4), and is associated with SOC and related soil parameters, such as available N, K, Ca, S, ECEC, Mg, and B (Table 5). The additional 11.31% of the variance was explained by PC 2, which seems to be associated with pH and related parameters (such as Ca). PC 3 explained another additional 9.26% and was loaded by available P but with negative correspondence to K and positive correspondence to Cu. PC 4 was most loaded by available P but with positive correspondence to K and negative correspondence to Cu, explaining the additional 7.55%. The kriging interpolation map of the 4 retained PCs is shown in Figure 4.

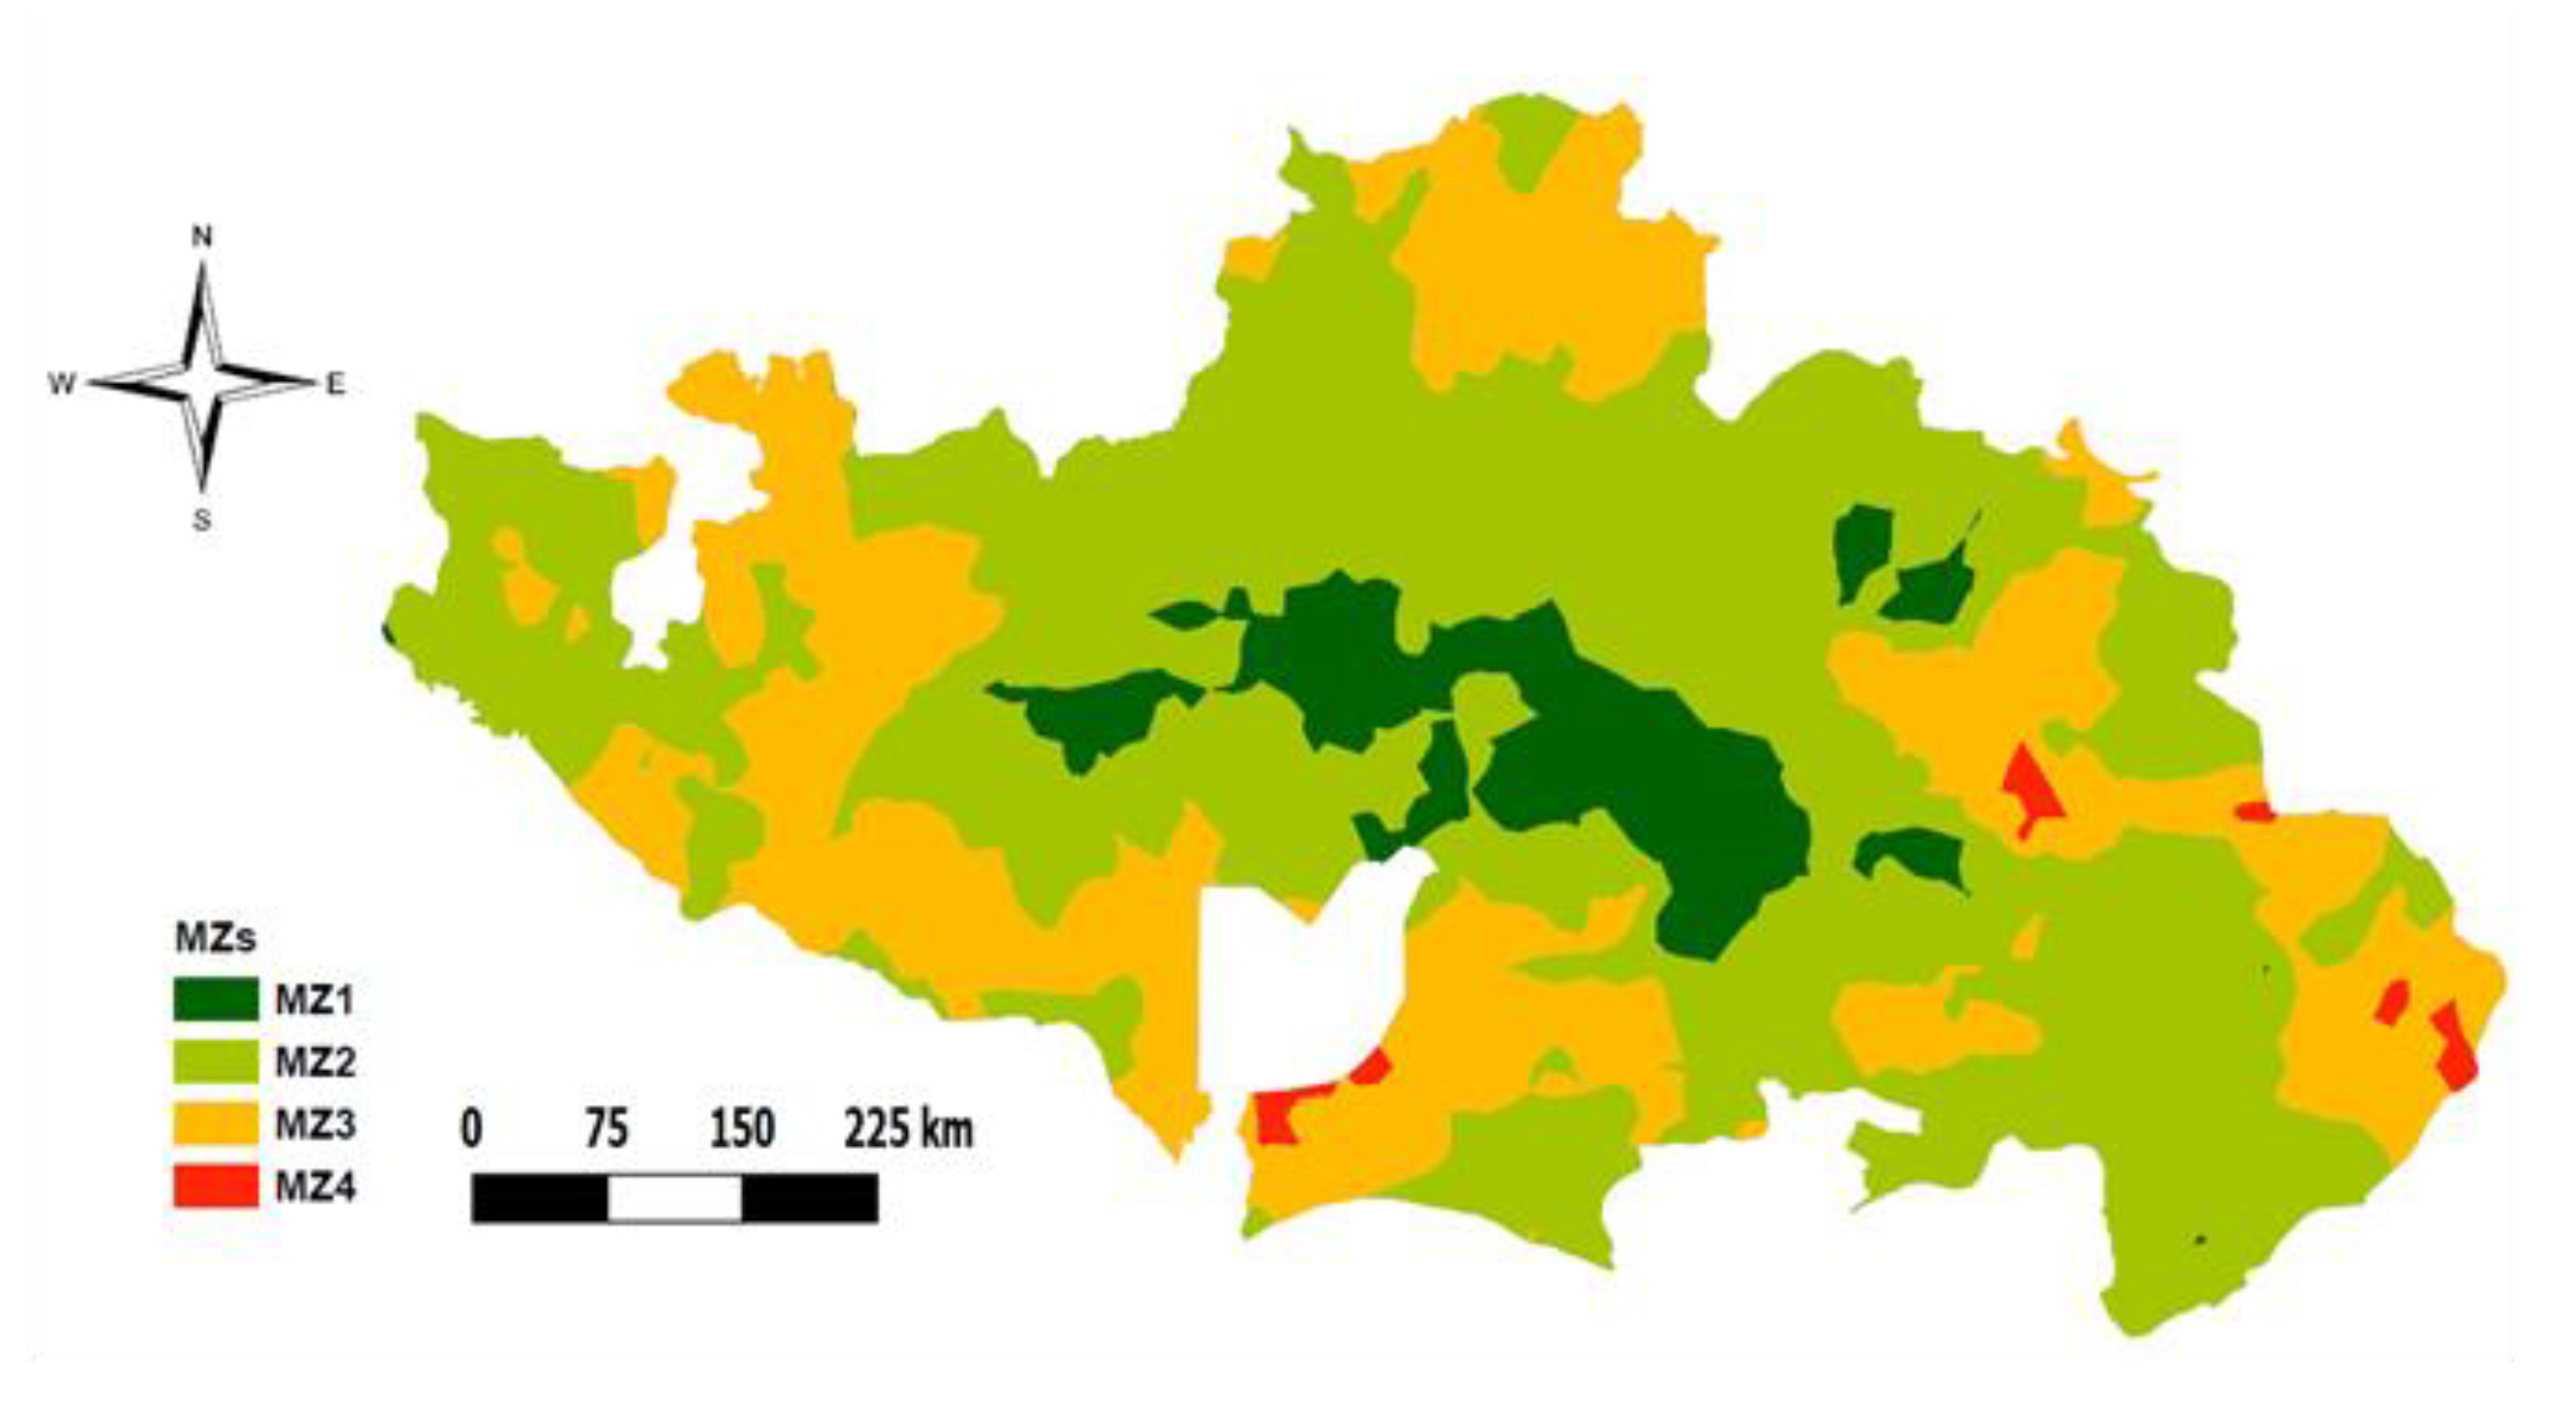
3.5. Multivariate Clustering and Delineation of MZs

K-means cluster analysis was done on the scores of the four selected PCs. The optimum number of clusters was selected based on attainment of high cubic clustering criterion (CCC). High CCC in this analysis was attained by four clusters. The clusters show clearly segregated zones when mapped apart from MZ4, with distinct characteristics (Figure 5). MZ1 is the third largest and is located predominantly around the central part of the study area. MZ2 has the largest land proportion of all the MZs and seems to cover the central parts, whereas MZ3, the second largest, is found at the outer sections of the study area. MZ4 comprises of only a very small area and seems to be in the same form as spots within MZ3. The ANOVA results (Table 6) show that MZ1 is characterized by a relatively high content of most soil variables especially SOC, Ntot, S, Ca, Mg, K, and ECEC (except AP). MZ4 is characterized by relatively high pH, AP, and Zn contents. MZ1 and MZ4 both have relatively high micronutrient concentrations (Zn, B, and Mn) compared with the other two MZs (i.e., MZ2 and MZ3). Both these zones (i.e., MZ1 and MZ4) represent the more fertile parts of the study area, with MZ4 probably being the more fertile because of the higher availability of P but representing a very small portion of the study. MZ2 and MZ3 do not differ significantly. Both zones have low SOC and ECEC, and are consequently relatively low in K, Ca, and Mg. MZ2 has a slightly lower pH and clearly higher Cu (1.20 mg/kg) and Fe content (164.6 mg/kg) in the soil compared with MZ3. The overall soil organic matter content (SOC) is low in all MZs, and thus farmers in these areas are recommended to increase soil organic matter content through cereal-legume rotation, application of manure, and preserving crop residues on the field after harvest. For MZ2 and especially MZ3, the SOC is extremely low, portraying high degradation and low productivity of the soils in these two zones. This can be related partly to inherently low nutrient contents in the soils and continuous cropping of high nutrient demanding crops without adequate application of organic or inorganic fertilizers [58].
In the same trend, AP content is generally small across all the MZs. Consequently, high P rates are required for P demanding crops like maize [6,13]. However, available compound fertilizer for most cereals is in the form of either NPK 15:15:15 or 20:10:10, i.e., containing the same ratios of P and K. Therefore, using these fertilizer blends to target high P and low K application rates, as in the case of MZ2 which has a lesser K requirement, is not advisable. Therefore, compound fertilizer with low K and high P contents is recommended for this zone. The low P content in the area can be related to intrinsic factors, such as the result of soil formation from low weatherable parent materials [48], or extrinsic factors, such as intensive crop cultivation [29], limited use of P fertilizers [59], and complete removal of crop residue that is commonly practiced by farmers in the area [32]. Sulphur content in MZ3 (the second largest zone) is low, and to enhance crop productivity and ensure nutrient balance, application of S might be required in this zone. Additionally, micronutrients (Zn, B and Mn) are low, especially in MZ2 and MZ3. Response of maize to S and other micronutrients has been reported in some parts of SSA, including the study area [56,57,58,59,60,61,62]. This might also point to the need for application of these micronutrients in MZ3 and MZ4 to sustain yield and prevent nutrient imbalances. However, we first recommend further research in these zones to understand the response and factors affecting the bioavailability of these three micronutrients (i.e., Zn, B, and Mn).

4. Conclusions

Moderate to high spatial variability was observed in most of the studied soil properties in the study area. Spatial variation of pH and macronutrients (N, P, and K) was largely influenced by indigenous or inherent bio-physical factors, while variation of most micronutrients was significantly influence by both indigenous and artificially human-induced soil management factors. This emphasizes the need for the development of site- or area-specific soil management advises. Combined use of geostatistical, principal component, and multivariate K-means cluster analyses was successful in delineating soil nutrient management zones with a unique nutrient requirement in this study. Four MZs were delineated and differed significantly in spatial extent and distribution, as well as respective nutrient levels. Overall, soil organic carbon, total nitrogen, and available phosphorus are the most deficient across all the MZs, and therefore their management is of critical importance for sustainable crop production in the area. Therefore, the identified geospatial management zones, if integrated into the already calibrated and validated site-specific nutrient management (SSNM) and decision support tools such as nutrient expert (NE) and QUEFTS (Quantitative Evaluation of Fertility of Tropical Soils) in the study area when field soil information is not available, can offer a more feasible means of implementing SSNM. This is because most of the farmers in the study area are small holders with inadequate access to laboratory facilities to periodically conduct soil tests on their fields in a quest to use developed SSNM decision support tools. Moreover, the differences in nutrient contents of the MZs indicates the need for informed decisions by policy makers and other stakeholders regarding nutrient management.

Author Contributions

Conceptualization, K.T.A. and J.E.H.; methodology, K.T.A. and A.M.A.; software, K.T.A.; validation, A.M.A. and B.M.S.; formal analysis, K.T.A.; investigation, A.M.S. and R.S.; resources, J.M.J.; data curation, K.T.A. and J.E.H.; writing—original draft preparation, K.T.A.; writing—review and editing, J.E.H., A.Y.K., J.M.J.; B.M.S. and J.B.A.; visualization, K.T.A.; supervision, I.B.M.; project administration, J.E.H., J.M.J. and A.Y.K. All authors have read and agreed to the published version of the manuscript.

Funding

This research was funded by Bill and Melinda Gates Foundation: OPP1113374.

Acknowledgments

We thank OCP-Africa fertilizer company for making the ‘Developing efficient and affordable fertilizer products for increased and sustained yield in the maize belt of Nigeria’ project possible. This research is largely based on the data generated through this project. The Bill and Melinda Gates Foundation (BMFG) funded the ‘Taking maize Agronomy to Scale in Africa (TAMASA)’ project. Both projects were managed by the International Institute of Tropical Agriculture (IITA) in collaboration with Centre for Dryland Agriculture (CDA) of Bayero University Kano, Institute for Agricultural Research (IAR) and National Agricultural Extension Research and Liaison Services (NAERLS) Ahmadu Bello University (ABU) Zaria, Nigeria. We also appreciate the financial support of the Africa Centre of Excellence through the student research grant of the Centre for Dryland Agriculture (CDA) of Bayero University Kano. We also acknowledge the partnership of State Agricultural Development Projects (ADPs) of Kano, Kaduna, Katsina, Taraba, Bauchi, Nassarawa, Plateau and Niger. We also thank the staff of both IITA and CDA for their support during the field and laboratory works.

Conflicts of Interest

The authors declare no conflict of interest.

References

  1. Vlek, P.; Le, Q.B.; Tamene, L. Land Decline in Land-Rich Africa—A Creeping Disaster in the Making; CGIAR Science Council Secretariat: Rome, Italy, 2008; p. 55. [Google Scholar]
  2. Dewitte, O.; Arwyn, J.; Otto, S.; Henrik, B.M.; Michel, B.; Almami, D.; Jozef, D.; Tahar, G.; Stephen, H.; Robert, J. Harmonization of the soil map of Africa at the continental scale. Geoderma 2013, 211, 138–153. [Google Scholar] [CrossRef] [Green Version]
  3. Bationo, A.; Lamers, J.; Lehmann, J. Recent achievement of sustainable soil management in Sub-Saharan Africa. Nutr. Cycl. Agroecosyst. 2015, 102, 1–3. [Google Scholar] [CrossRef] [Green Version]
  4. Liverpool-Tasie, L.S.O.; Omonona, B.T.; Sanou, A.; Ogunleye, W.O. Is increasing inorganic fertilizer use for maize production in SSA a profitable proposition? Evidence from Nigeria. Food Policy 2017, 67, 41–51. [Google Scholar] [CrossRef] [PubMed] [Green Version]
  5. Rurinda, J.; Shamie, Z.; Jibrin, M.J.; Tesfaye, B.; Kenneth, M.; Jens, A.A.; Pampolino, M.F.; Ibrahim, M.; James, M.; Kamara, A.Y. Science-based decision support for formulating crop fertilizer recommendations in sub-Saharan Africa. Agric. Syst. 2020, 180, 102790. [Google Scholar] [CrossRef]
  6. Shehu, B.M.; Bassam, A.L.; Jibrin, M.J.; Alpha, Y.K.; Ibrahim, B.M.; Jairos, R.; Shamie, Z.; Peter, C.; Vanlauwe, B.; Adam, M.A. Balanced nutrient requirements for maize in the Northern Nigerian Savanna: Parameterization and validation of QUEFTS model. Field Crop. Res. 2019, 241, 107585. [Google Scholar] [CrossRef]
  7. Cassman, K.G.; Dobermann, A.; Walters, D.T. Agroecosystems, nitrogen-use efficiency, and nitrogen management. Ambio 2002, 31, 132–140. [Google Scholar] [CrossRef]
  8. Esau, T.; Zaman, Q.; Groulx, D.; Corscadden, K.; Chang, Y.; Schumann, A.; Havard, P. Economic analysis for smart sprayer application in wild blueberry fields. Precis. Agri. 2016, 17, 753–765. [Google Scholar] [CrossRef]
  9. Goovaerts, P. Geostatistics for Natural Resources Evaluation; Oxford University Press: Oxford, UK; New York, NY, USA, 1997. [Google Scholar]
  10. Tripathi, R.; Nayak, A.K.; Mohammad, S.; Lal, B.; Priyanka, G.; Raja, R.; Mohanty, S.; Anjani, K.; Panda, B.B.; Sahoo, R.N. Delineation of soil management zones for a rice cultivated area in eastern India using fuzzy clustering. Catena 2015, 133, 128–136. [Google Scholar] [CrossRef]
  11. Kihara, J.; Nziguheba, G.; Zingore, S.; Coulibaly, A.; Esilaba, A.; Kabambe, V.; Njoroge, S.; Palm, C.; Huising, J. Understanding variability in crop response to fertilizer and amendments in sub-Saharan Africa. Agric. Ecosys. Env. 2016, 229, 1–12. [Google Scholar] [CrossRef] [Green Version]
  12. Kihara, J.; Weldesemayat, G.; Nziguheba, G.; Kinyua, M.; Zingore, S.; Sommer, R. Application of secondary nutrients and micronutrients increases crop yields in sub-Saharan Africa. Agron. Sustain. Dev. 2017, 37, 25. [Google Scholar] [CrossRef] [Green Version]
  13. Shehu, B.M.; Merckx, R.; Jibrin, J.M.; Kamara, A.Y.; Rurinda, J. Quantifying variability in maize yield response to nutrient applications in the Northern Nigerian Savanna. Agron. J. 2018, 8, 18. [Google Scholar] [CrossRef] [Green Version]
  14. Akinseye, F.M.; Hakeem, A.A.; Kamara, A.Y.; Elijah, A.A.; Anthony, M.W. Understanding the response of sorghum cultivars to nitrogen applications in the semi-arid Nigeria using the agricultural production systems simulator. J. Plant. Nutr. 2020, 43, 834–850. [Google Scholar] [CrossRef]
  15. Tittonell, P.; Vanlauwe, B.; Corbeels, M.; Giller, K.E. Yield gaps, nutrient use efficiencies and response to fertilisers by maize across heterogeneous smallholder farms of western Kenya. Plant. Soil 2008, 313, 19–37. [Google Scholar] [CrossRef] [Green Version]
  16. Franzen, D.W.; Hopkins, D.H.; Sweeney, M.D.; Ulmer, M.K.; Halvorson, A.D. Evaluation of soil survey scale for zone development of site-specific nitrogen management. Agron. J. 2002, 94, 381–384. [Google Scholar] [CrossRef]
  17. Mohamed, S.M.; Sameh, M.S.; Manqiang, L.; Rong-Jiang, Y.; Ahmed, I.A.; Peng, L.; Jiaoguo, J.; Xiaoyun, C. Soil properties spatial variability and delineation of site-specific management zones based on soil fertility using fuzzy clustering in a hilly field in Jianyang, Sichuan, China. Sustainability 2019, 11, 7084. [Google Scholar] [CrossRef] [Green Version]
  18. Reyniers, M.; Maertens, K.; Vrindts, E.; De Baerdemaeker, J. Yield variability related to landscape properties of a loamy soil in central Belgium. Soil Tillage Res. 2006, 88, 262–273. [Google Scholar] [CrossRef]
  19. Ortega, R.A.; Santibanez, O.A. Determination of management zones in corn (Zea mays L.) based on soil fertility. Comput. Electron. Agric. 2007, 58, 49–59. [Google Scholar] [CrossRef]
  20. Hornung, A.; Khosla, R.; Reich, R.; Inman, D.; Westfall, D.G. Comparison of site-specific management zones: Soil-color-based and yield-based. Agron. J. 2006, 98, 407–415. [Google Scholar] [CrossRef] [Green Version]
  21. Cambouris, A.; Nolin, M.; Zebarth, B.; Laverdière, M. Soil management zones delineated by electrical conductivity to characterize spatial and temporal variations in potato yield and in soil properties. Am. J. Potato Res. 2006, 83, 381–395. [Google Scholar] [CrossRef]
  22. Mueller, T.; Hartsock, N.; Stombaugh, T.; Shearer, S.; Cornelius, P.; Barnhisel, R. Soil electrical conductivity map variability in limestone soils overlain by loess. Agron. J. 2003, 95, 496–507. [Google Scholar] [CrossRef]
  23. Vieira, S.R.; Hatfielf, J.L.; Nielsen, D.R.; Biggar, J.W. Geostatistical theory and application to variability of some agronomical properties. Hilgardia 1983, 51, 1–7. [Google Scholar] [CrossRef] [Green Version]
  24. Rikalovic, A.; Cosic, I.; Lazarevic, D. GIS-based multi-criteria analysis for industrial site selection. Procedia Eng. 2014, 69, 1054–1063. [Google Scholar] [CrossRef] [Green Version]
  25. Behera, S.K.; Mathur, R.K.; Shukla, A.K.; Suresh, K.; Prakash, C. Spatial variability of soil properties and delineation of soil management zones of oil palm plantations grown in a hot and humid tropical region of southern India. Catena 2018, 165, 251–259. [Google Scholar] [CrossRef]
  26. Mallarino, A.P.; Oyarzabal, E.S.; Hinz, P.N. Interpreting within-field relationships between crop yields and soil and plant variables using factor analysis. Precis. Agric. 1999, 1, 15–25. [Google Scholar] [CrossRef]
  27. Lark, R. Forming spatially coherent regions by classification of multivariate data: An example from the analysis of maps of crop yield. Int. J. Geog. Info. Sci. 1998, 12, 83–98. [Google Scholar] [CrossRef]
  28. Fleming, K.L.; Westfall, D.G.; Weins, D.W.; Brodahl, M.C. Evaluating farmer defined management zone maps for variable rate fertilizer application. Precis. Agric. 2000, 2, 201–215. [Google Scholar] [CrossRef]
  29. Salami, B.T.; Ade, J.B.; Sanginga, N. Delineation of management zones by classification of soil physico-chemical properties in the Northern Savanna of Nigeria. Afr. J. Agric. Res. 2011, 6, 1572–1579. [Google Scholar]
  30. Federal Fertilizer Department (FFD). Fertilizer Use and Management Practices for Nigeria, 4th ed.; Federal Fertilizer Department, Federal Ministry of Agriculture and Rural Development: Abuja, Nigeria, 2012.
  31. Salako, F.K.; Hauser, S.; Babalola, O.; Tian, G. Improvement of the physical fertility of a degraded Alfisol with planted and planted natural fallow under humid tropical conditions. Soil Manag. 2001, 17, 41–47. [Google Scholar] [CrossRef]
  32. Abdoulaye, T.; Wossen, T.; Awotide, B. Impacts of improved maize varieties in Nigeria: Ex-post assessment of productivity and welfare outcomes. Food Secur. 2018, 10, 369–379. [Google Scholar] [CrossRef]
  33. Ado, A.Y.; Yusuf, H.A. Evaluation of strategies for soil fertility improvement in northern Nigeria and the way forward. J. Agron. 2008, 7, 15–24. [Google Scholar]
  34. Adewopo, J.B. Smallholder maize-based systems. In Multifunctional Land Uses in Africa, Sustainable Food Security Solutions; Elisabeth, S., Madelene, O., Eds.; Routledge: Abington, UK, 2019; pp. 114–129. [Google Scholar]
  35. Krig, D.G. Lognormal-de Wijsian. In Geostatistics for Ore Evaluation; Printpak (Cape) Ltd.: Johannesburg, South Africa, 1981. [Google Scholar]
  36. Moriasi, D.N.; Arnold, J.G.; Van Liew, M.W.; Binger, R.L.; Harmel, R.D.; Veith, T.L. Model evaluation guidelines for systematic quantification of accuracy in watershed simulations. Am. Soc. Agric. Biol. Eng. 2007, 50, 885–900. [Google Scholar] [CrossRef]
  37. Willmott, C.J. Some comments on the evaluation of model performance. Bull. Am. Meteorol. Soc. 1982, 63, 1309–1313. [Google Scholar] [CrossRef] [Green Version]
  38. Tofa, A.; Chiezey, U.; Babaji, B.; Kamara, A.Y.; Adnan, A.A.; Beah, A.; Adam, A.M. Modeling planting-date effects on intermediate-maturing maize in contrasting environments in the nigerian savanna: An application of DSSAT model. Agronomy 2020, 10, 871. [Google Scholar] [CrossRef]
  39. Krause, P.; Boyle, D.P. Comparison of different efficiency criteria for hydrological model assessment. Adv. Geosci. 2005, 5, 89–97. [Google Scholar] [CrossRef] [Green Version]
  40. Cambardella, C.A.; Moorman, T.B.; Novak, J.M.; Parkin, T.B.; Turco, R.F.; Konopka, A.E. Field-scale variability of soil properties in central Iowa soils. Am. Soil Sci. Soc. J. 1994, 58, 1501–1511. [Google Scholar] [CrossRef]
  41. McCabe, G.P. Principal variables. Technometrics 1984, 26, 137–144. [Google Scholar] [CrossRef]
  42. Sarle, W.S. The Cubic Clustering Creterion; SAS Technical Report A-108; SAS Institute Inc.: Cary, NC, USA, 1983. [Google Scholar]
  43. Brady, N.C.; Weil, R.R. The Nature and Properties of Soils, 13th ed.; Pearson Education: Singapore, 2002; ISBN 9780130167637. [Google Scholar]
  44. Esu, I.E. Detailed Soil Survey of NIHORT Farm at Bunkure Kano State, Nigeria; Ahmadu Bello University Zaria: Kaduna, Nigeria, 1991. [Google Scholar]
  45. National Special Programme for Food Security (NSPFS). Nigerian Soil Fertility Rating and Thematic Maps; National Special Programme for Food Security: Abuja, Nigeria, 2005. [Google Scholar]
  46. Ekeleme, F.; Jibrin, M.J.; Kamara, A.Y.; Oluoch, M.; Samndi, A.M.; Fagge, A.A. Assessment of the relationship between soil properties, Striga hermonthica infestation and the on-farm yields of maize in the dry Savannas of Nigeria. Crop. Prot. 2014, 66, 90–97. [Google Scholar] [CrossRef]
  47. Kamara, A.Y.; Ekeleme, F.; Jibrin, M.J.; Tarawali, G.; Tofa, I. Assessment of level, extent and factors influencing Striga infestation of cereals and cowpea in a Sudan Savanna ecology of Northern Nigeria. Agric. Ecosyst. Env. 2014, 188, 111–121. [Google Scholar] [CrossRef]
  48. Shehu, B.M.; Jibrin, M.J.; Samndi, A.M. Fertility status of selected soils in the Sudan Savanna biome of Northern Nigeria. Int. J. Soil Sci. 2015, 10, 74–83. [Google Scholar] [CrossRef] [Green Version]
  49. Jimoh, A.I.; Malgwi, W.B.; Aliyu, J.; Shobayo, A.B. Characterization, classification and agricultural potentials of soils of Gabari district, Zaria, northern Guinea savanna zone Nigeria. J. Trop. Biol. Env. Sci. 2011, 13, 102–113. [Google Scholar]
  50. Møberg, J.P.; Esu, I.E. Characteristics and composition of some savanna soils in Nigeria. Geoderma 1991, 48, 113–129. [Google Scholar] [CrossRef]
  51. Wilding, L.P. Spatial variability: Its documentation, accommodation and implication to soil surveys. In Soil Spatial Variability; Nielsen, D.R., Bouma, J., Eds.; Pudoc: Wageningen, The Netherlands, 1985. [Google Scholar]
  52. Kparmwang, T.; Malgwi, W.B. Some available micronutrients in profiles of ultisols and entisols developed from sandstone in North.-Western Nigeria. In Proceedings of the 23rd Annual Conference on Soil Science Society of Nigeria, Sokoto, Nigeria, 2–5 March 1997; pp. 43–50. [Google Scholar]
  53. Aref, F. Iron, copper and manganese concentration in maize leaf as influenced by soil and foliar application of zinc sulfate and boric acid. Int. J. Acad. Res. 2011, 3, 1080–1087. [Google Scholar]
  54. Zingore, S.; Delve, R.J.; Nyamangara, J.; Giller, K.E. Multiple benefits of manure: The key to maintenance of soil fertility and restoration of depleted sandy soils on African smallholder farms. Nutr. Cycl. Agroecosyst. 2008, 80, 267–282. [Google Scholar] [CrossRef]
  55. Vanlauwe, B.; Kihara, J.; Chivenge, P.; Pypers, P.; Coe, R.; Six, J. Agronomic use efficiency of N fertilizer in maize-based systems in sub-Saharan Africa within the context of integrated soil fertility management. Plant. Soil 2011, 339, 35–50. [Google Scholar] [CrossRef]
  56. Jiang, H.; Liu, G.; Liu, S.; Li, E.; Wang, R.; Yang, Y.F.; Hu, H.C. Delineation of site-specific management zones based on soil properties for a hillside field in central China. Arch. Agron. Soil Sci. 2012, 58, 1075–1090. [Google Scholar] [CrossRef]
  57. Sharma, S. Applied Multivariate Techniques; John Wiley and Sons: New York, NY, USA, 1996. [Google Scholar]
  58. Jones, A.; Breuning-Madsen, H.; Brossard, M. Soil Atlas of Africa; Publications Office of the European Union: Luxembourg, 2013. [Google Scholar]
  59. Oyinbo, O.; Chamberlin, J.; Vanlauwe, B.; Vranken, L.; Kamara, A.Y.; Craufurd, P.; Miet, M. Farmers’ preferences for high-input agriculture supported by site-specific extension services: Evidence from a choice experiment in Nigeria. Agric. Syst. 2019, 173, 12–26. [Google Scholar] [CrossRef]
  60. Friesen, D.K. Fate and efficiency of sulfur fertilizer applied to food crops in West Africa. Fertil. Res. 1991, 29, 35–44. [Google Scholar] [CrossRef]
  61. Ojeniyi, S.O.; Kayode, G.O. Response of maize to copper and sulfur in tropical regions. J. Agric. Sci. Camb. 1993, 120, 295–299. [Google Scholar] [CrossRef]
  62. Nziguheba, G.; Tossah, B.K.; Diels, J.; Franke, A.C.; Aihou, K.; Iwuafor, E.N.O.; Nwoke, C.; Merckx, R. Assessment of nutrient deficiencies in maize in nutrient omission trials and long-term field experiments in the West African Savanna. Plant. Soil 2009, 314, 143–157. [Google Scholar] [CrossRef]
Figure 1. Map of study location showing soil sampled points.
Sustainability 12 09010 g001
Figure 2. Relationships between the measured and simulated soil properties.
Sustainability 12 09010 g002aSustainability 12 09010 g002b
Figure 3. Spatial distribution map of the studied soil properties.
Sustainability 12 09010 g003aSustainability 12 09010 g003b
Figure 4. Krigged map of the first four selected principal components.
Sustainability 12 09010 g004
Figure 5. Soil management zones for the study area.
Sustainability 12 09010 g005
Table 1. Descriptive statistics of the studied soil properties.
Soil VariableNMeanUpper (75%) QuartileLower (25%) QuartileMinimumMaximumKurtosisSkewnessSDCV (%)
1pH(H2O)28535.996.245.734.788.10.660.280.416.8
2SOC (%)28720.790.970.520.113.854.51.540.3847.9
3Ntot (g/kg)28660.650.820.410.12.862.741.390.3452.1
4AP (mg/kg)28284.295.172.530.0834.116.393.002.7864.8
5S (mg/kg)23119.8011.37.13.8448.6812.112.434.0841.9
6K (cmolc/kg)28950.650.840.410.042.590.730.730.3655
7Ca (cmolc/kg)28622.843.661.690.1115.763.61.361.7160
8ECEC (cmolc/kg)26416.668.114.771.0120.871.10.852.5638.3
9Mg (cmolc/kg)25731.111.410.620.097.347.962.150.7567.7
10Cu (cmolc/kg)22181.111.460.560.0530.57249.111.71.13101.2
11Fe (mg/kg)2562129.0154.0100.634.6527.26.21.2743.4133.6
12Zn (mg/kg)25581.1812.341.710.00712.8476.437.340.81268.9
13B (mg/kg)23540.0850.120.030.010.779.982.50.09103
14Mn (mg/kg)235268.3783.244.80.03482.314.62.3936.3853.2
15Na (cmolc/kg)25240.140.160.100.001.3352.654.850.0752.05
SOC: soil organic carbon; Ntot: total nitrogen; AP: available phosphorus; ECEC: effective cation exchange capacity. SD: standard deviation; CV coefficient of variability
Table 2. Correlation matrix of the soil properties in the study area.
pHSOCNtotAPKCaSECECMgCuFeZnBMnNa
pH1--------------
SOC−0.11 **1-------------
Ntot−0.22 **0.87 **1------------
AP0.18 **0.16 **0.13 **1-----------
K−0.04 *0.42 **0.42 **0.10 **1----------
Ca0.18 **0.46 **0.48 **0.09 **0.34 **1---------
S−0.30 **0.55 **0.60 **0.030.26 **0.34 **1--------
ECEC−0.030.48 **0.52 **0.09 **0.42 **0.40 **0.57 **1-------
Mg0.11 **0.49 **0.52 **0.10 **0.48 **0.68 **0.42 **0.53 **1------
Cu−0.010.22 **0.25 **0.05 **−0.020.28 **0.50 **0.14 **0.24 **1-----
Fe−0.16 **0.24 **0.23 **0.10 **−0.030.040.19 **0.030.06 **0.18 **1----
Zn0.030.17 **0.18 **0.13 **0.09 **0.21 **0.22 **0.13 **0.18 **0.09 **0.021---
B0.09 **0.51 **0.54 **0.23 **0.47 **0.49 **0.43 **0.56 **0.63 **0.54 **0.14 **0.38 **1--
Mn0.16 **0.20 **0.26 **0.010.24 **0.42 **0.12 **0.25 **0.42 **0.20 **−0.010.20 **0.42 **1-
Na0.060.11 **0.15 **−0.11 **0.21 **0.28 **0.28 **0.34 **0.37 **−0.02−0.040.010.21 **0.07 **1
SOC: soil organic carbon; Ntot: total nitrogen; AP: available phosphorus; ECEC: effective cation exchange capacity. ** Correlation is significant at 1% probability level. * Correlation is significant at 5% level of probability.
Table 3. Semivariogram model analysis for soil variables in the study area.
VariableModelNuggetPartial sillSillNugget/SillRange (m)RMSE
pH(H2O)Stable0.0110.1010.1120.1004000.41.370
SOC (%)Stable0.0130.1470.1600.0828000.80.128
Ntot (g/kg)Stable0.0010.0970.0980.0103710.06.856
AP (mg/kg)Circular0.0027.9407.9420.0003999.02.440
S (mg/kg)Exponential0.0690.0660.1350.5103638.03.424
K (cmocl/kg)Stable0.0230.0790.1020.2221100.52.431
Ca (cmolc/kg)Stable0.3220.1260.4470.7199515.05.164
Mg (cmolc/kg)Stable0.0630.2960.3590.1757900.00.295
Na (cmolc/kg)Exponential0.0050.0220.0260.1765900.00.328
ECEC (cmolc/kg)Stable0.0560.1100.1660.3373598.00.697
Cu mg/kg)Exponential0.3520.4900.8420.4187142.51.694
Fe (mg/kg)Exponential0.0650.0660.1310.4934338.01.506
Zn (mg/kg)Spherical0.2021.2201.4220.1422241.01.589
B (mg/kg)Stable0.1530.0940.2470.6202940.021.514
Mn (mg/kg)Stable0.6010.3991.0000.6011300.028.985
SOC: soil organic carbon; Ntot: total nitrogen; AP: available phosphorus; ECEC: effective cation exchange capacity.
Table 4. Eigen values, component loading, and cumulative loading of the principal components.
Principal ComponentEigen ValueComponent Loading (%)Cumulative Loading (%)
15.10234.0134.01
21.69711.3145.33
31.3899.2654.59
41.1337.5562.14
50.9486.3268.46
60.9066.0474.50
70.8075.3879.88
80.6554.3784.25
90.5633.7688.0
100.5403.6091.61
110.4132.7694.36
120.3472.3196.68
130.2771.8498.52
140.1330.8999.41
150.0890.59100.0
Table 5. Principal components loadings for each soil variable.
Soil VariablePC1PC2PC3PC4
pH(H2O)−0.0440.7690.2430.005
SOC (%)0.772−0.325−0.0250.276
Ntot (g/kg)0.808−0.318−0.0420.199
AP (mg/kg)0.1820.1200.5010.590
S (mg/kg)0.701−0.421−0.058−0.258
K (cmolc/kg)0.5800.129−0.3080.388
Ca (cmolc/kg)0.7070.323−0.002−0.095
Mg (cmolc/kg)0.7930.278−0.121−0.034
Na (cmolc/kg)0.3480.211−0.567−0.247
ECEC (cmolc/kg)0.7200.032−0.2680.037
Cu (mg/kg)0.438−0.1610.490−0.588
Fe (mg/kg)0.193−0.4740.3410.023
Zn (mg/kg)0.3260.1270.3530.039
B (mg/kg)0.8170.1490.254−0.066
Mn (mg/kg)0.4660.4180.162−0.167
PC: Principle component. SOC: soil organic carbon; Ntot: total nitrogen; AP: available phosphorus; ECEC: effective cation exchange capacity.
Table 6. Statistical analysis comparing soil variables in different management zones (MZs).
MZspH (H2O)SOC (%)Ntot (g/kg)AP (mg/kg)S (mg/kg)K (cmolc/kg)Ca (cmol/kg)
15.83c1.17a1.02a3.18c13.18a1.01a4.24a
25.73d0.78c0.69c3.79b10.64b0.50d1.87d
36.07b0.55d0.42d3.43c7.49c0.59c2.20c
46.13a1.07b0.86b8.46a10.02b0.95b3.35b
LSD0.0430.0390.0350.2300.4470.0340.182
ECEC (cmolc/kg)Mg (cmolc/kg)Cu (mg/kg)Fe (mg/kg)Zn (mg/kg)B (mg/kg)Mn (mg/kg)Na (cmolc/kg)
9.25a1.86a1.25a121.9c1.29b0.15a79.97a0.19a
6.58c0.79c1.20a164.6a1.05c0.07b61.64b0.13c
5.67d0.78c0.57c102.2d1.01c0.04c60.69b0.14b
7.89b1.50b1.08b142.6b1.42a0.15a79.93a0.14b
0.2670.0810.0643.7390.0380.0103.6210.009
Different lettering within the same column indicate significant mean difference at 1% level of probability using LSD. LSD: least significant difference between means. SOC: soil organic carbon; Ntot: total nitrogen; AP: available phosphorus; ECEC: effective cation exchange capacity.

