Article

Advancement of Green Public Purchasing by Category: Do Municipality Green Purchasing Policies Have Any Role in Japan?

1
Faculty of Economics, Tohoku Gakuin University, Sendai 980-8511, Japan
2
Graduate School of Economics and Waseda Institute of Political Economy, Waseda University, Tokyo 169-8050, Japan
3
Graduate School of Economics, Waseda University, Tokyo 169-8050, Japan
4
Faculty of Political Science and Economics and Research Institute for Environmental Economics and Management, Waseda University, Tokyo 169-8050, Japan
*
Author to whom correspondence should be addressed.
Sustainability 2020, 12(21), 8979; https://doi.org/10.3390/su12218979
Submission received: 17 August 2020 / Revised: 19 October 2020 / Accepted: 24 October 2020 / Published: 29 October 2020
(This article belongs to the Special Issue Prospects and Challenges of Sustainable Public Purchasing)

Abstract

:
The aim of this paper is to identify (1) the categories in which it is easier or more difficult for local municipalities to implement green purchasing and (2) the role and extent of green purchasing policy (GPP) in promoting green purchasing. To characterize the green purchasing potential of different categories, we examine the green purchasing rate, or the ratio of green products/services to total products/services purchased, of 21 categories of items. We employ data from a unique survey conducted by the Japanese Ministry of the Environment, which provides data on green procurement in municipalities. We observe that air conditioners suffer from low green purchasing rates, whereas most municipalities purchase green products in the paper products and stationery categories. We also examine the relationship between green purchasing rates and GPPs to identify the role and extent of GPPs. Our regression analyses reveal that the presence of a GPP is associated with higher implementation and measurement rates of green purchasing. This pattern is particularly evident for the categories in which many municipalities without GPPs purchase green products but, in most cases, do not measure their green purchasing rate.

1. Introduction

Green public procurement (and green public purchasing) is recognized as “an important tool to achieve environmental policy goals relating to climate change, resource use and sustainable consumption and production” [1]. One of the reasons for this is that “the public procurement market is considered as the largest business sector in the world” [2]. By using their purchasing power, governments and public authorities can make important contributions to sustainability goals [1]. Another reason is that a wide variety of items, including vehicle fleets, construction materials, chemicals, electronics and office materials, are publicly purchased. Therefore, public procurement has the potential to contribute to the sustainable consumption and production of various types of products and services.
However, many researchers have recognized that the potential of public purchasing/procurement was not fully exploited in the 2000s and early 2010s. Therefore, many previous studies have examined the barriers to exploiting the potential of green public purchasing/procurement. For example, researchers point to financial constraints [3,4,5,6,7,8,9], the small size of public organizations [10,11,12,13], and the lack of awareness [5,10,11] as barriers. In terms of other main barriers, many researchers have identified organizational issues such as the lack of senior management support [8,9,14,15,16] and the lack of clear strategic goals [8,9,17].
Some public authorities could actually implement green purchasing/procurement if environmental criteria and/or standards were taken into account during the procurement/purchasing process. Actually, some previous studies uncovered that environmental criteria were taken into account in Swedish road maintenance contracts [18], in the tendering process of Finnish and Swedish furniture regarding the chemical content [19], and in the Norwegian public procurement of Information and Communication Technology (ICT) equipment [20]. Other studies have found that environmental criteria were not taken into account in tender assessments of services by most Swedish municipalities [21], in the procurement of most Swedish construction contracts [22], and in the tendering processes of furniture in Spain [23]. As shown above and by Cheng et al. [24], these studies focused on only one category of products and services to determine whether to implement green purchasing/procurement. An exception is Da Ponte et al. [25], but they targeted Canadian large-scale procurements in only three sectors (construction, information technology (IT), and large service categories). However, governments purchase and procure products and services in various item categories.
This study will identify the progress that has been made in green purchasing across a wide range of item categories, not only specific categories. If information on green purchasing rates by item category or on the ratio of green products/services to total products/services purchased by category is available, then it will enable us to identify categories where green purchasing has not effectively been conducted and needs to be addressed. From such information, we can also infer the common characteristics of the item categories for which green products/services are either easily or not easily purchased. Understanding these characteristics allows us to develop more effective measures that are tailored to the characteristics of the category that needs to be addressed. A questionnaire survey conducted by the Ministry of the Environment, Japan (MOEJ) enables us to provide such information. In the survey, local governments were asked about the extent to which they were making green purchases for 21 categories, including stationery, office supplies, computers, air conditioners (hereinafter AC units), cars and public works. In addition, the survey covered all prefectures and municipalities in Japan, with a very high response rate of approximately 96%. By employing data collected from this survey, we present the distribution of green purchasing rates of Japanese municipalities by category and derive implications for green public purchasing and green consumption.
Moreover, we examine the relationship between the green purchasing rates of municipalities and their green purchasing policy (GPP). GPP is an action plan and/or a policy commitment that helps governments implement green purchasing. Therefore, establishing GPP is very likely to make the strategic goals of an organization clearer and as a result, make its staff awareness higher and make it easier to gain senior management support. We analyze the relationship between purchasing and policy because policy or action plans for green purchasing are recognized as powerful drivers of green purchasing implementation [26]. Operating with the same understanding, the sustainable purchasing research initiative (SPRI) has conducted surveys of local governments in several countries to identify the status of their GPP and to make policy recommendations [27,28,29]. To examine whether the presence or absence of a GPP is related to green purchasing performance (and the measurement of that performance), we conduct regression analyses. We verify the hypothesis that a GPP helps governments implement green purchasing.
We focus on local municipalities for the following two reasons. The first reason is that local municipalities have not been doing as well in green purchasing as the national authorities and prefectures. However, municipalities have accounted for a large percentage of the total public spending although they are small. Thus, we cannot ignore the role of municipalities in making public procurement even greener and thus, we focus on them. The second reason is that there is a variation in the adaptation of GPPs among local municipalities. This variation is necessary for examining the relationship between green purchasing rates and GPP. As all of the prefectural governments and designated cites have implemented green purchasing and adopted related policies, we cannot compare entities that have adopted GPPs with those that have not at this administrative level.
Thus, the contributions of this paper are twofold: first, by using data with comprehensive item categories relative to previous studies, it identifies the categories that are easier or harder for local municipalities to implement green purchasing in. If we can understand these aspects of green purchasing, we can identify which categories we should focus on as policy targets. This understanding will help us form a policy to promote green purchasing in an efficient way, especially for small and medium organizations. Second, we identify the relationship between green purchasing performance and policy and determine whether and how the relationship is different between item categories. Identifying the role and the extent of GPP in promoting green purchasing will be useful for local municipalities across the globe (not only for Japan but also for the rest of the world).
The next section will explain the background of Japan’s green purchasing and the survey analyzed in this paper. The third section will present the results of data analysis. The fourth section will discuss the regression results. The final section will discuss the implications of the results and conclude this paper.

2. Background

2.1. Basic Forms of Japanese Government

Similar to the UK and France, Japan is a unitary state. Its administration is divided into the following three basic levels: nation, prefectures and municipalities. As of April 2020, there are 47 prefectures and 1724 municipalities. Many cities with a population greater than 500,000, but not all, are designated with a special status by a government ordinance and delegated many of the functions normally performed by prefectural governments. These cities are known as “designated cities”. As of April 2020, the following 20 cities have been given a designated status: Yokohama, Osaka, Nagoya, Sapporo, Fukuoka, Kobe, Kawasaki, Kyoto, Saitama, Hiroshima, Sendai, Chiba, Kitakyushu, Sakai, Niigata, Hamamatsu, Kumamoto, Sagamihara, Okayama and Shizuoka. The designated cities are considered “equivalent to prefectures” in that many of the powers of prefectures have been delegated to them [30].

2.2. Green Purchasing in Japan

As Thomson and Jackson [31] mentioned, “Japan is the leading country in green public procurement”, and Japan has been committed to green purchasing since a relatively early stage of the movement. In 1995, the Japanese national government introduced the action plan for greening government operations, in which “environmental consideration[s] when procuring and using goods and services” was mentioned. After the action plan, the Japanese Green Purchasing Law (the act on promoting green procurement) was promulgated on 31 May 2000 and enforced on 1 April 2001.
The Green Purchasing Law obligates all national institutions (ministries, independent administrative agencies, national university corporations, etc.) to buy designated green purchase items that are specified by the basic policy of the law. The designated items included 101 items in 14 categories in 2001 and 275 items in 21 categories in 2018. Since 2003, the percentage of categories with a green procurement rate of 95% or more in national organizations has been approximately 90%. Green purchasing by national organizations in 2017 is estimated to have reduced greenhouse gas emissions by approximately 34,570 tonnes of CO2 emissions [32].
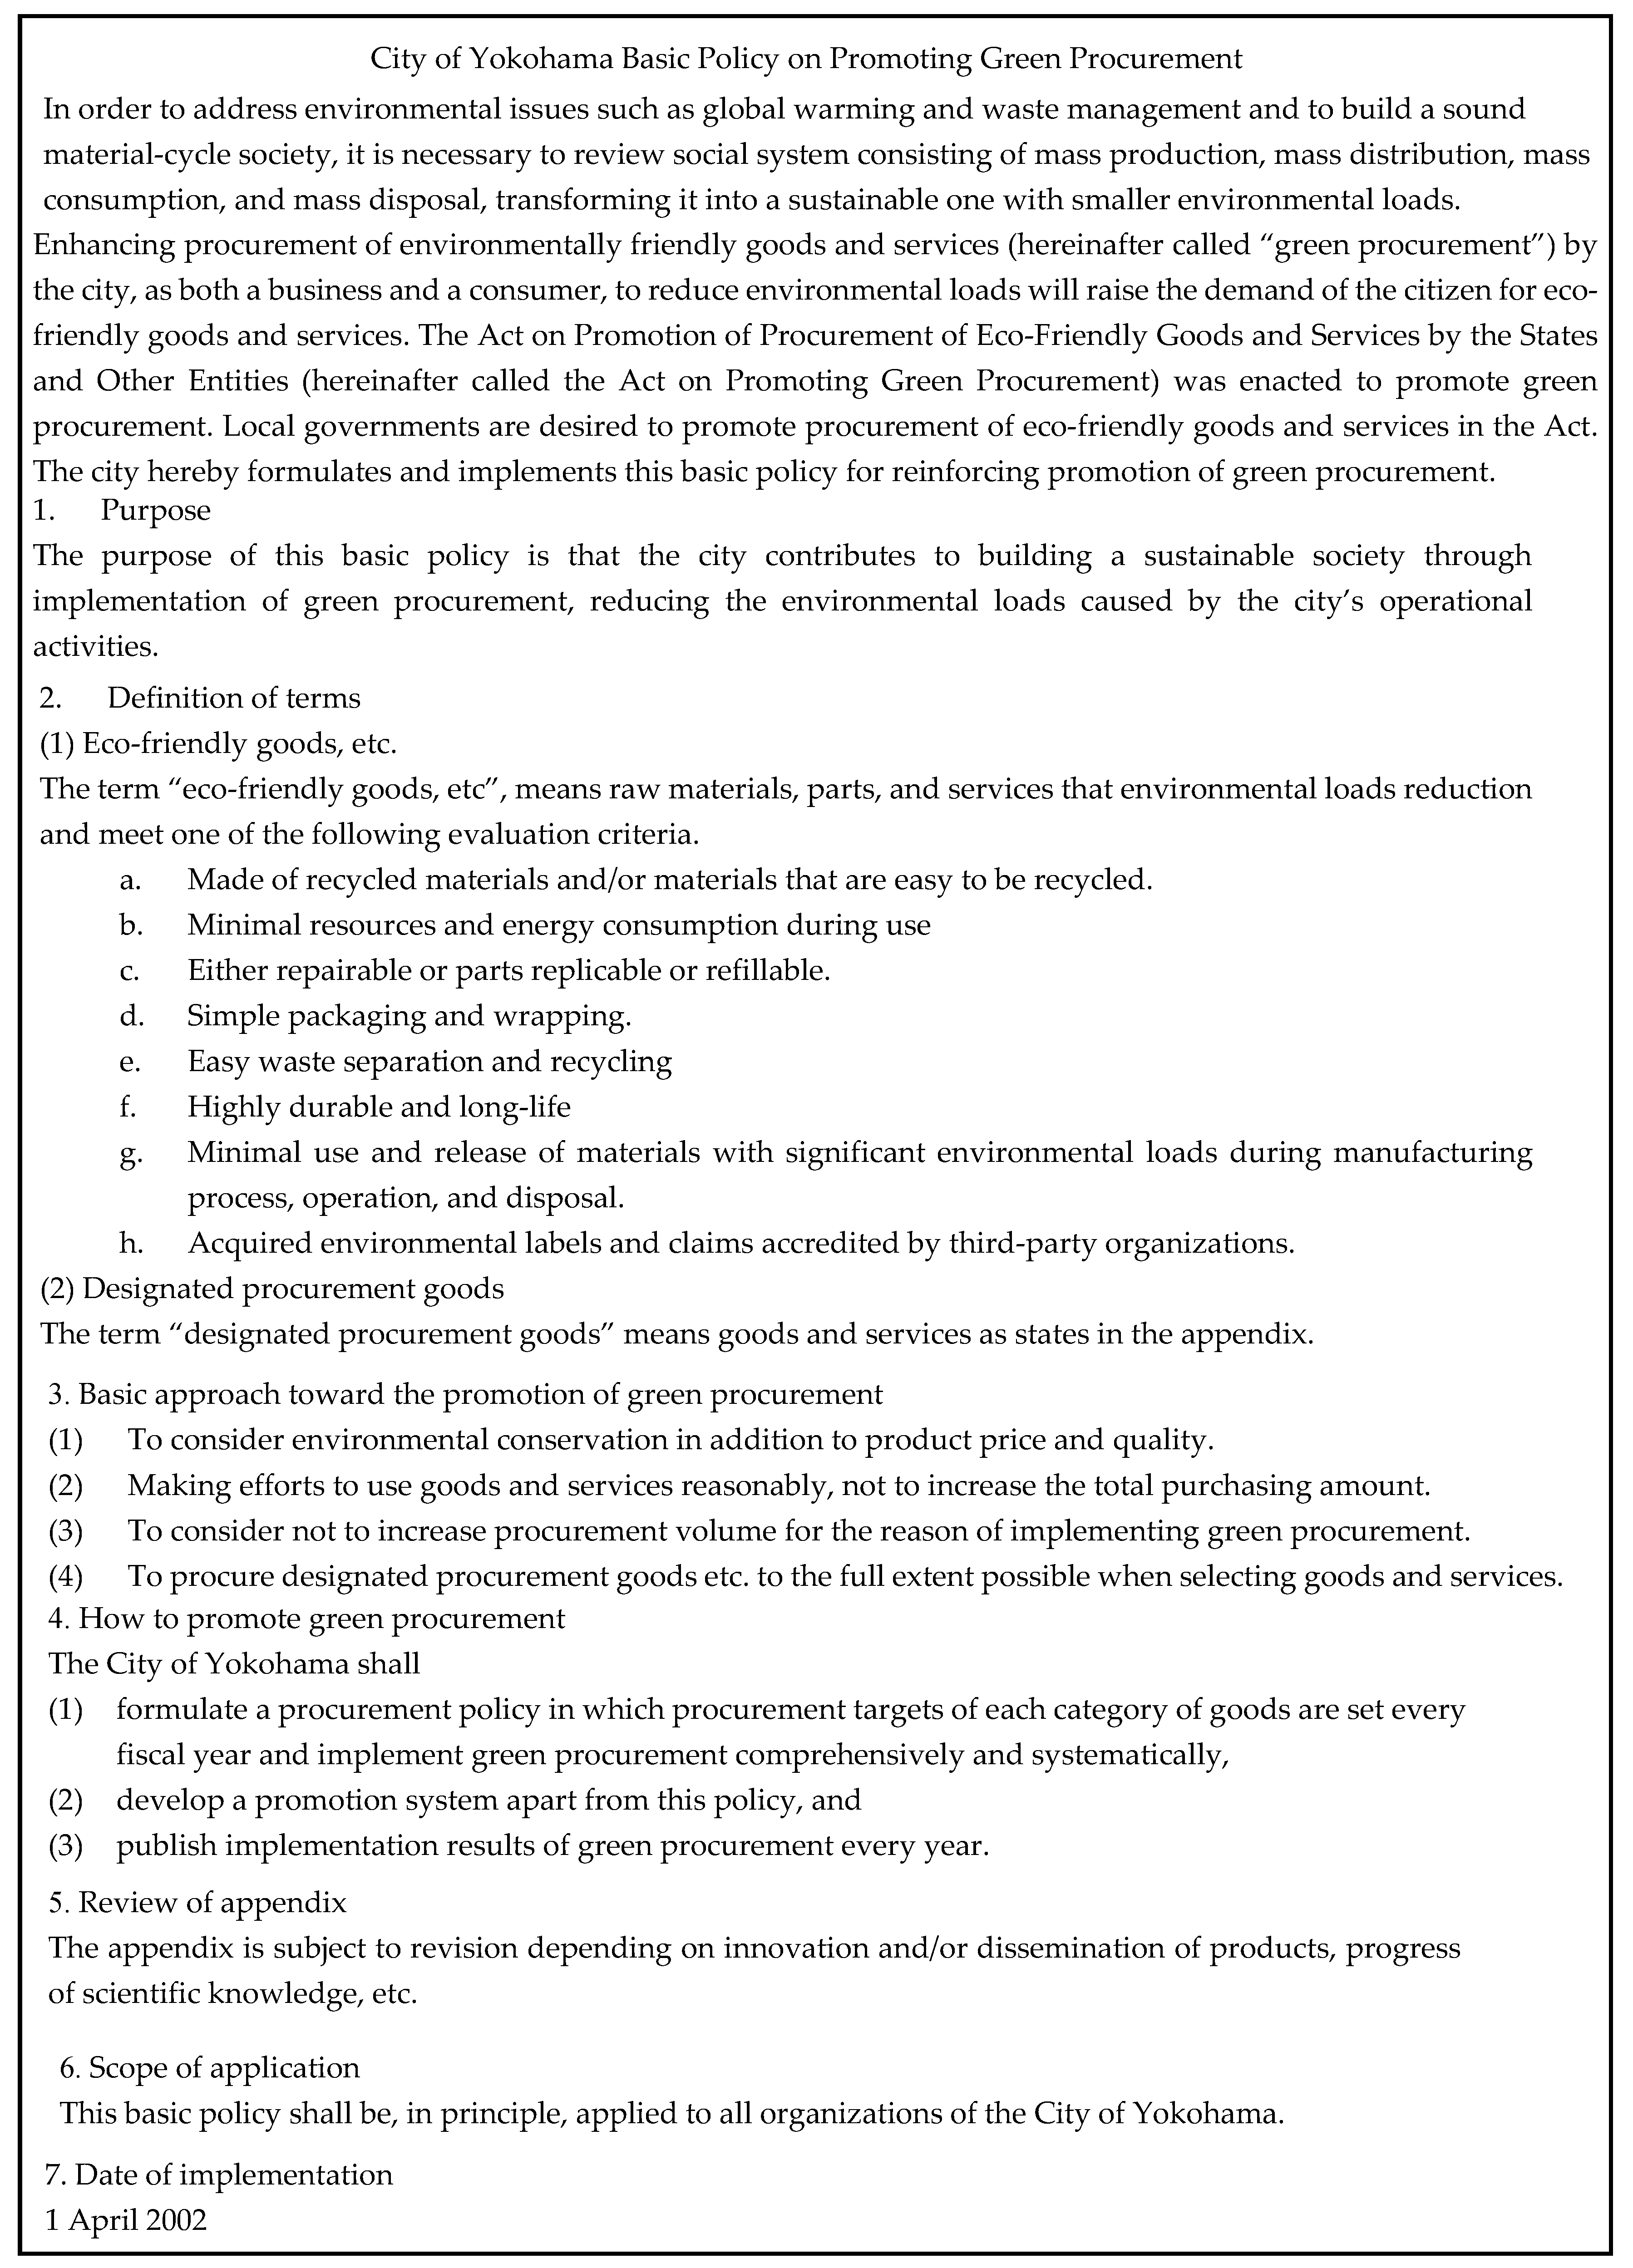
Green purchasing itself is not the only obligation under the Green Purchasing Law. National institutions are obligated to publicly report their green purchasing activity and to adopt a PDCA (Plan-Do-Check-Act) cycle for their GPP that includes developing a GPP, implementing the policy, analyzing policy achievements and improving the policy. The MOEJ [33] recommends taking the following three steps for institutions making their own GPPs: (1) specifying procurement items targeted by the policy, (2) establishing a policy task force or policy implementation system, and (3) illustrating the procurement procedure. Figure A1 presents the basic green procurement policy of the city of Yokohama. Although targeted procurement items and policy implementation systems are not specified in this policy, they are specified in the Appendix A, which is mentioned in the policy. Moreover, the city of Yokohama published a manual for its procurement procedure [34].
In contrast to national institutions, local governments (prefectures and municipalities) have no obligations under the Green Purchasing Law. Local governments are required to make reasonable efforts to do what national institutions are obligated to do. All prefectures and all designated cities have GPPs, whereas only about a quarter of municipalities do, as we will see in the next section. To improve the situation and promote green procurement by municipalities, the MOEJ, in collaboration with the green purchasing network (GPN), an non-governmental organization that aims to promote green purchasing, has undertaken the following initiatives for local governments: training newly appointed green procurement staff in local governments, dispatching lecturers to teach green purchasing courses for staff and helping individual local governments formulate and review their own GPPs and green contract policies.
As we can see from one of the above initiatives, local governments are required to make a reasonable effort to fulfill green contracts and engage in green purchasing, as per the Green Contract Law established and enacted in 2007. This law targets the following six types of contracts: the procurement of electricity, the procurement and leasing of automobiles, the procurement of ships, energy service company (ESCO) projects, architectural design and industrial waste management. As with green purchasing, national institutions are obligated to take environmental issues into consideration when making the above six types of public contracts and to publish records regarding the contracts.

2.3. Questionnaire Survey on Green Procurement by Local Governments

We use a survey conducted by the MOEJ, the “Questionnaire survey on green procurement by local governments”. This survey collects information on the adoption of GPPs and municipalities’ progress in green procurement. The survey began in 2001, and questionnaires are sent to all municipalities every year. The survey has several distinctive and useful features that reveal municipalities’ progress in green procurement in Japan.
First, the survey has very high response rates, approximately 75% on average from 2001 to 2016, with a maximum rate of 96%. In contrast, the literature on green procurement in other countries has suffered from low response rates; for example, Michelsen and Boer [10] had a response rate of approximately 25% from municipalities and counties in Norway. Similarly, the survey conducted by the Swedish Environmental Protection Agency had a response rate of 58% from municipalities, government agencies, and government companies [35]. Such data sets can cause sample selection bias problems, i.e., the local governments that have a higher interest in green procurement tend to respond. In addition, the Japanese survey data allow us to describe the progress of green procurement by municipalities with lower respondent bias.
Second, in addition to asking about the adoption of GPP, the survey asks about the extent to which each municipality has implemented green procurement and which products it has procured in such a way. In 2018, the MOEJ expected municipalities to implement green procurement for the following 21 categories: paper products, stationery, office furniture, imaging equipment (e.g., printers, scanners, projectors), electronic devices (e.g., laptop or desktop computers), office equipment, mobile phones, home appliances, AC units, water heaters, lighting equipment (e.g., light emitting diodes), cars, fire extinguishers, uniforms, bedclothes, work gloves, other fiber products (e.g., tents, flags), other equipment (e.g., water-saving devices, solar power cells), emergency supplies (e.g., emergency food/water, portable batteries), public works (i.e., contracts with private firms, in terms of infrastructures), and other public services (e.g., dining hall-related goods in government offices, cleaning-related goods in government offices).
In asking about the extent of the green procurement of these products and services, the questionnaire requires respondents to answer by choosing one of the following seven categories: “Almost 100%”, “More than 80%”, “80% to 40%”, “Less than 40%”, “Do not know the extent”, “Have the criteria but have not purchased any yet”, and “No purchasing”. The first four categories imply that the respondents have implemented green procurement and calculated the ratio of green products and services to total purchase amount, while “Do not know the extent” implies that the respondent does not know the ratio. The remaining two items imply that the respondent has not yet begun purchasing greener products. However, “Have the criteria but have not purchased any yet” also indicates at least that the respondent has some criteria for green procurement (though not a GPP itself), such as a list of greener products or criteria for identifying which product is appropriate for green procurement.
In this paper, we focus on the survey conducted in 2016 because it is the latest version available to researchers and the most comprehensive version in terms of the targeted items. Moreover, we can ignore the change in the number of municipalities and their sizes over years, which were caused by several mergers following the enactment of the Special Merger Law in 1995. The number of municipalities was 3234 in 1995; however, this figure had decreased to 1724 by 2018. The largest change in the number of municipalities occurred from 2003 to 2006. During that period, the number of municipalities diminished from 3196 (the beginning of April 2003) to 1827 (the end of March 2006).

2.4. Summary Statistics

In 2016, the questionnaire was sent to 1721 municipalities, and there were more than 1664 responses, representing a response rate of 97%. We focus on the responses of municipalities by excluding designated cities. That is, the size of our sample is 1644, representing almost all the municipalities in Japan.
The size of the municipalities measured with a standard financial scale or by total population tend to have right-skewed distributions (Figure 1). The standard financial scale is the sum of the municipality’s standard tax revenue and ordinary local allocation tax by the national government [36] (p. 23). This scale is an index of the size of a municipality’s budget, which indicates how much money they can use for their own purposes. This index rages from 2.75 to 1726.80 million dollars, with a mean of 135.61 million dollars. In addition, the total population in municipalities ranges from 160 to 892,535, with a mean of 60,257.32 persons. These indices imply that the size of the municipalities is widely dispersed, including a large number of small- and medium-scale municipalities and several large-scale municipalities.
From the survey, we found that 400 of the 1644 municipalities had adopted a GPP by 2016. This indicates that almost 24% of municipalities in Japan have a GPP. Therefore, we have enough variation in the implementation of GPPs by municipalities to examine the relationships between the implementation of a GPP and the progress of green procurement.
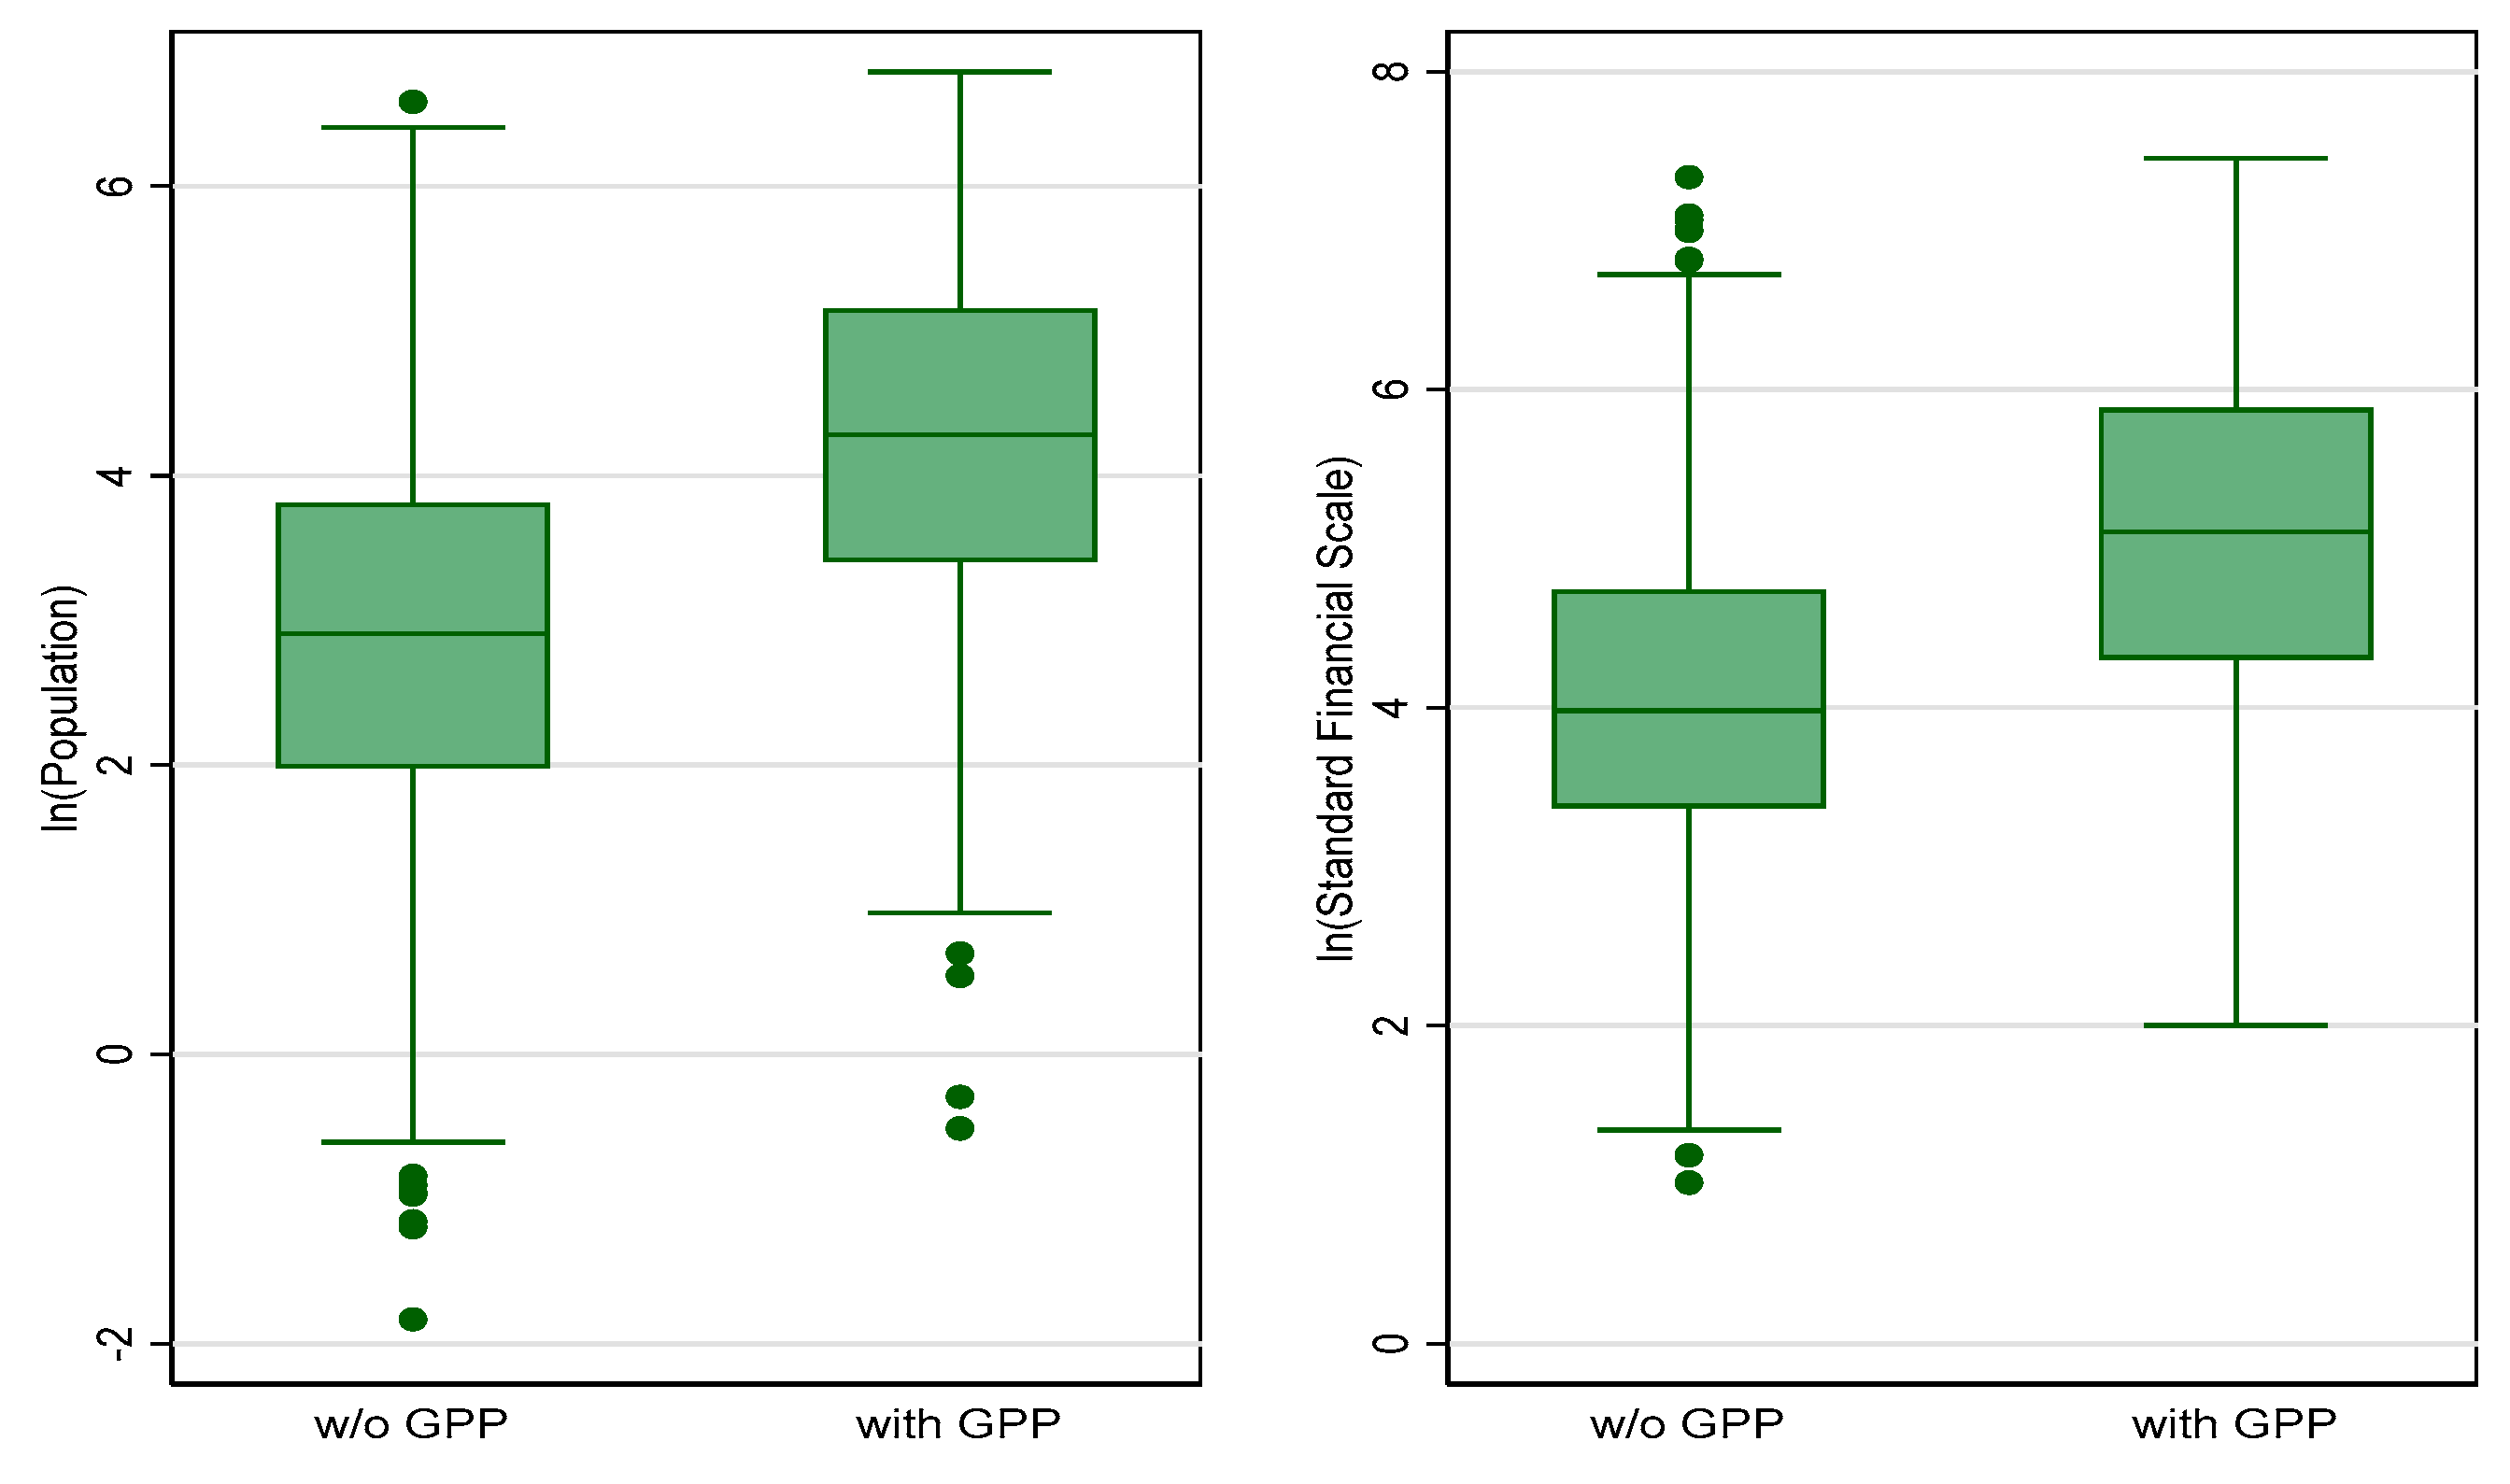
Finally, the right and left sides of Figure 2 show box plots of the natural log of standard financial scale and total population in municipalities with and without GPPs, respectively. Each box area implies between the 25th and 75th percentiles of each of the size indices, while an upper line implies an upper adjacent value, and a lower line implies a lower adjacent value. Moreover, the points outside of both the upper and lower lines indicate outliers. We can see that in terms of size, municipalities with GPPs tend to be larger than those without GPPs. However, the outliers in Figure 2 imply that several large-scale municipalities, such as Kagoshima City or Suginami district, have not adopted a GPP.

3. Analysis

3.1. Green Purchasing Rate by Category

In this paper, we use the “green purchasing rate” to refer to the ratio of green products/services purchased to total products/services purchased.
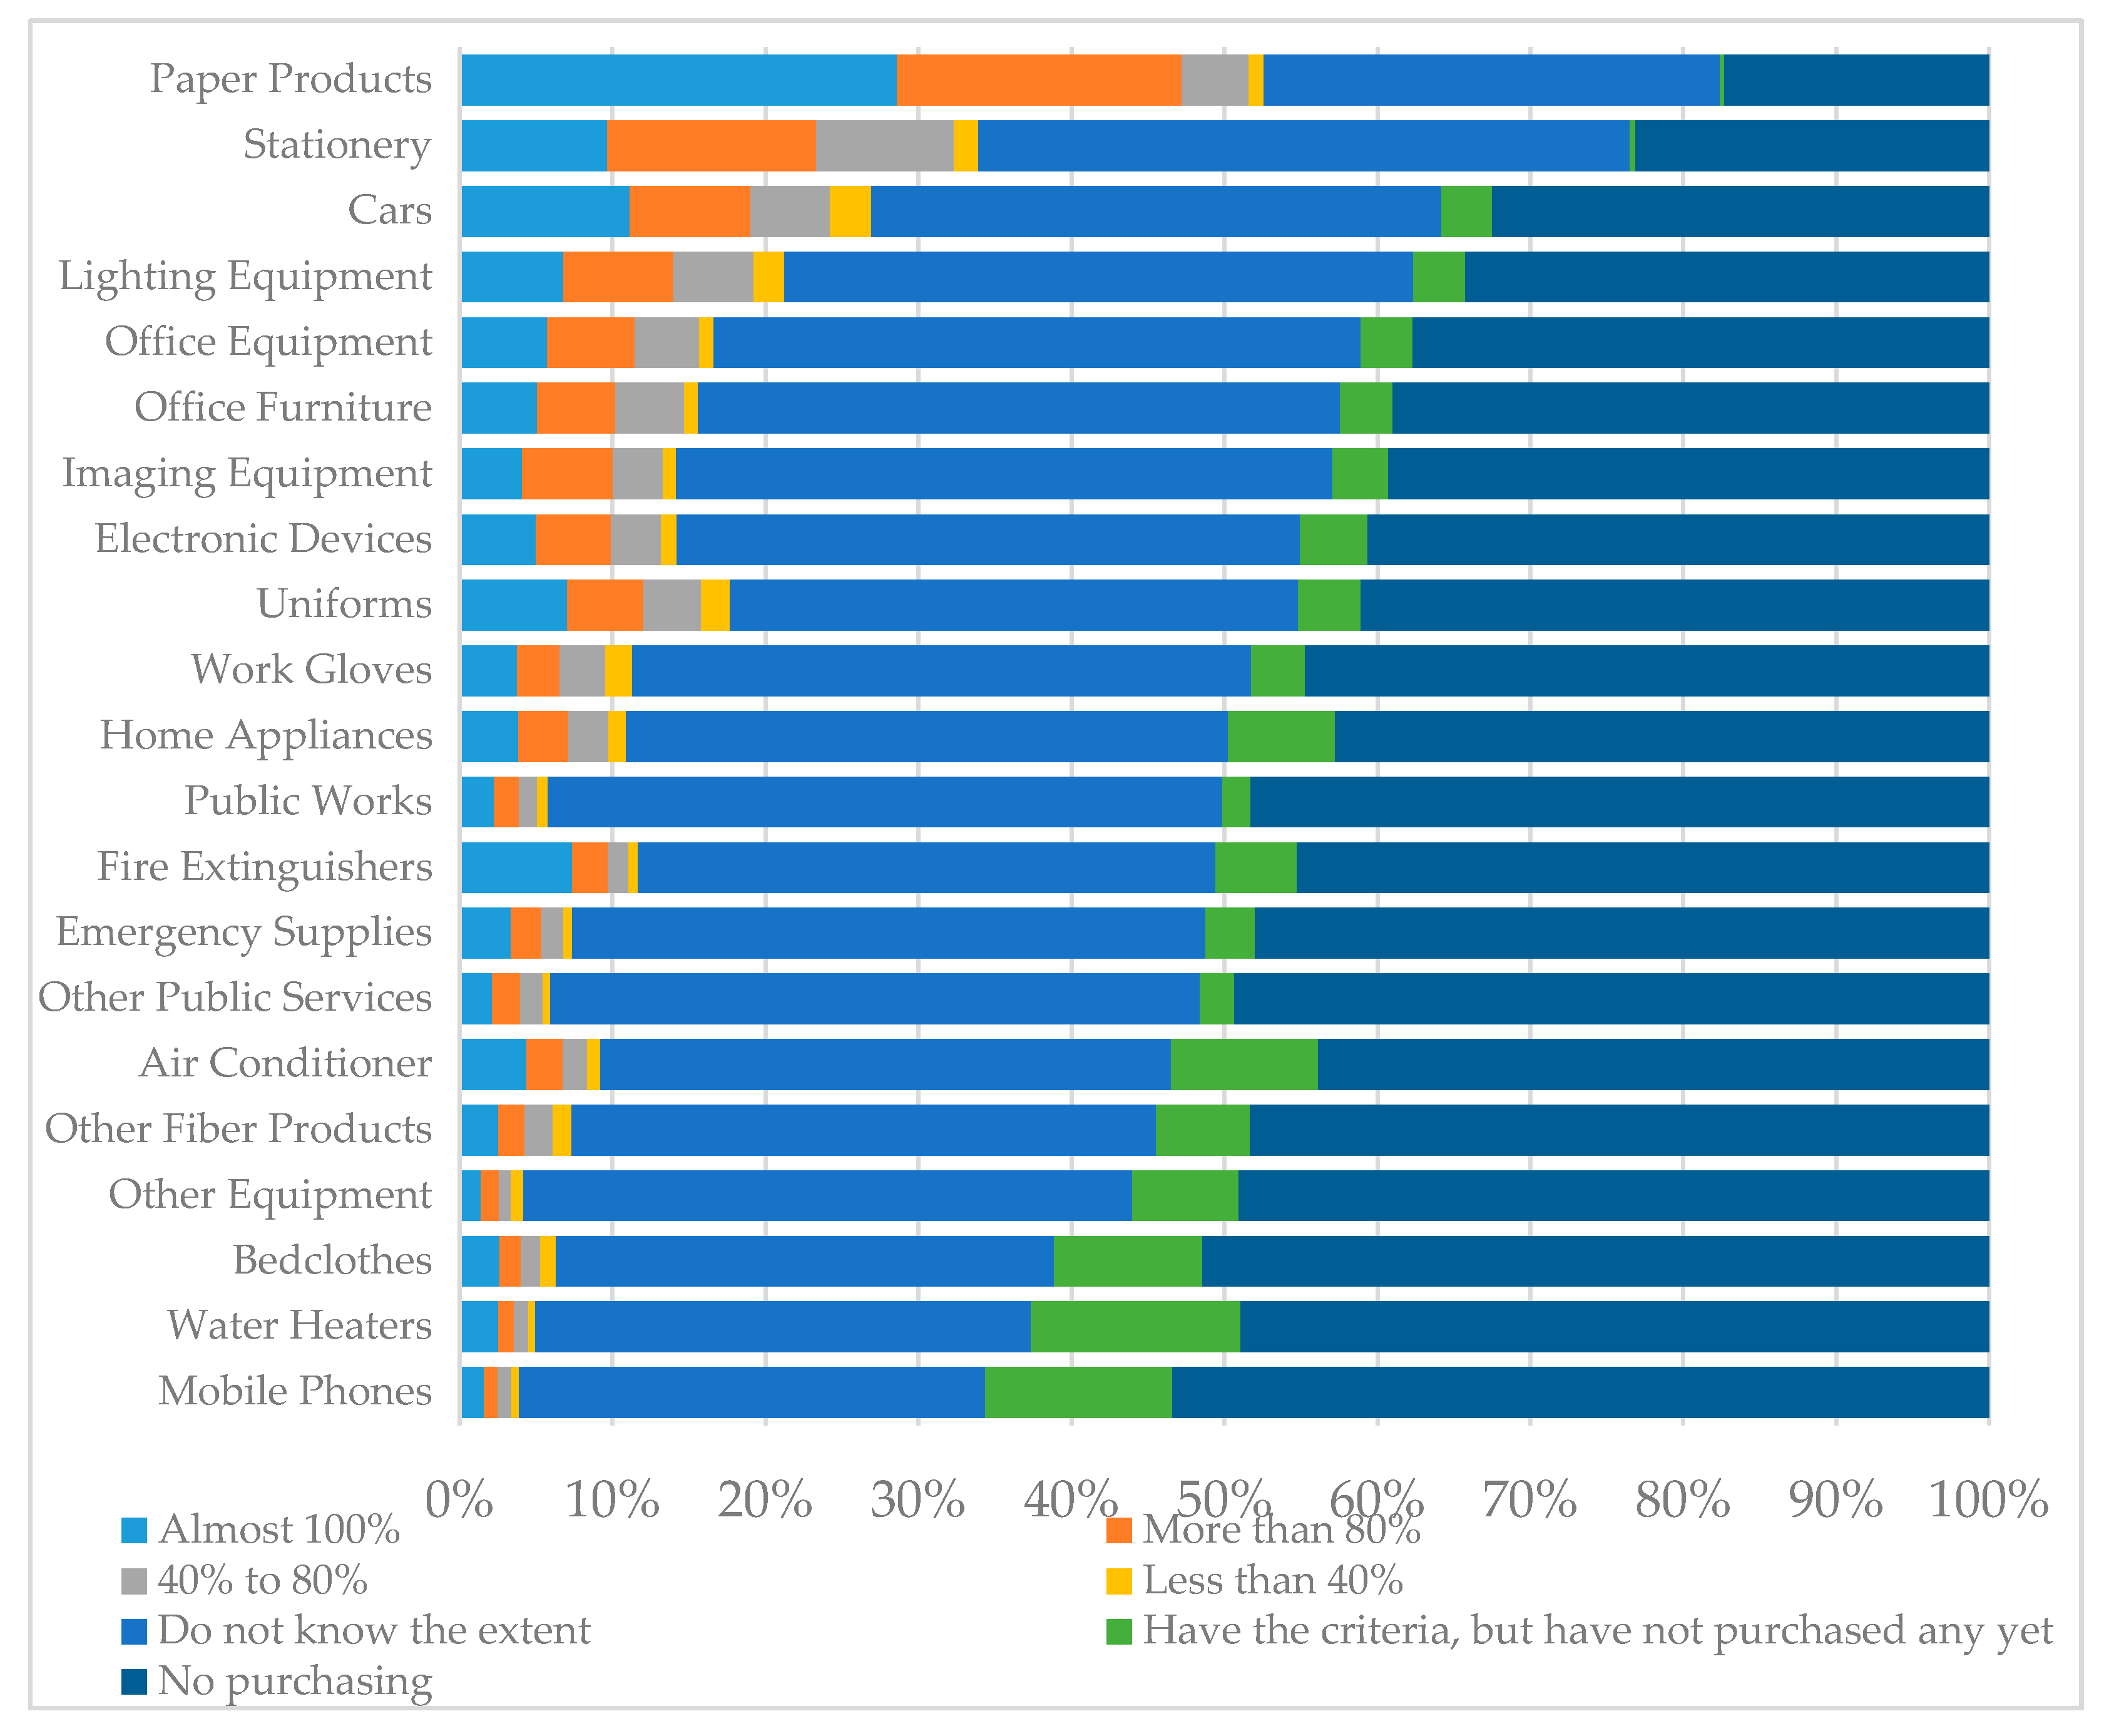
In this subsection, we describe the green purchasing rate of Japanese municipalities. Figure 3 displays the distribution of the green purchasing rate for 21 categories. It should be noted that the number of valid responses differs across items. Blue areas represent the share of municipalities implementing green purchasing at almost 100% for the item. Thus, all the purchases for the item follow the guidelines for green purchasing. Orange areas show the share of municipalities whose green purchasing of the items ranges from 80 to 99% of the total purchases of that item. Thus, the municipalities in this area have excellent green purchasing performance. The gray areas represent the proportion of municipalities that implement the green purchasing of items 40 to 80% of the time. Roughly speaking, half or more than half of their purchases in this area are of green products. Finally, light blue areas indicate the municipalities that implement green purchasing for the item but do not measure the ratio of green purchasing to total purchasing of that item. Therefore, the blue, orange, gray, yellow, and light blue areas in Figure 3 jointly show the share of municipalities with some form of green purchasing for each item. Green purchasing items are sorted in descending order based on share.
According to Figure 3, paper products have the highest share of municipalities with at least some green purchasing. Eighty-two percent of municipalities are engaged in the green purchasing of paper products. The second most popular item for green purchasing using this measurement is stationery. The share of municipalities with some form of green purchasing for stationery amounts to more than 75%. Thus, quite a few municipalities are engaged in some form of the green purchasing of stationery. The third most popular item for green purchasing is cars. More than 60% of the municipalities have implemented the green purchasing of cars. However, one should note that there is a more than 10% difference between the green purchasing of cars and the green purchasing of stationery in the share of municipalities with green purchasing.
The fourth most popular item for green purchasing using this measurement is lighting, with a ratio of 62%. After lighting, the share of municipalities engaging in some green purchasing gradually declines for each category from office equipment to work gloves. Approximately half of the municipalities have implemented the green purchasing of home appliances in one way or another. The shares are the same for home appliances, public works, fire extinguishers, emergency supplies and other public services. The share declines, with a noticeable difference, for AC units. Then, the share further declines, with larger differences, from other fiber products, other equipment and bedclothes to water heaters. Finally, the green purchasing of mobile phones seems to be the least popular across municipalities. Only 34% of the municipalities are engaged in the green purchasing of mobile phones.
The light green area in Figure 3 represents municipalities that have developed criteria for green purchasing but not purchased such items yet. We can see that the size of the green area becomes larger as we move down the figure. For paper products and stationery, the light green part is almost negligible, i.e., almost all municipalities with criteria for green purchasing purchase appropriate green items. In contrast, the light green areas under bedclothes, water heaters and mobile phones are large. One plausible reason for this is that if items are purchased frequently, as in the case of paper products or stationery, green purchasing is very likely implemented, while green purchasing is seldom implemented if items are seldom purchased, as in the case of mobile phones or water heaters. We suspect that, in the former case, procurement personnel can learn green purchasing quickly, but they have few opportunities to learn how to implement green purchasing in the latter case. One reason why purchase frequency may affect advancement of green purchasing is that job rotation in the Japanese public sector occurs within a few years. As demonstrated by the previous literature [12,37,38,39,40,41], one must stay in the procurement position long enough to become an expert in green purchasing. Unfortunately, most municipalities in Japan have adopted job rotation systems in which officials change their positions in municipalities every few years. Thus, this job rotation system is an obstacle for Japanese municipalities in maintaining an expert in green purchasing. Due to the job rotation, knowledge, experience, and expertise in infrequent work are not likely to be accumulated within a given department or among the department’s personnel. For this reason, green purchasing of mobile phones, which are thought to be purchased less frequently, is not prioritized.
Conversely, making purchases more frequently is likely to advance green purchasing. Therefore, if a given department (usually the procurement department) purchases items that are infrequently purchased, including those for other departments, purchasing might be much greener. However, departments are reluctant to delegate other departments to purchase products/services that are important or urgently needed to complete their tasks. Otherwise, they might allow other departments to purchase products for them. Such product or service categories include, for example, uniforms and fire extinguishers.
As discussed above, we observe wide variation in the implementation of green purchasing among items. Why are the green purchasing rates high for some products and low for others? One reason is the difficulty involved in identifying greener products and services. For instance, in the case of paper products and stationery, there are several labels or criteria used to identify such products as environmentally friendly goods. One of the most famous examples is the “Eco-mark”, a label that indicates that the product is environmentally friendly. Eco-marks have been used since 1989; thus, for procurement personnel, it is relatively easy to purchase environmentally friendly products in that category. In contrast, there is no official way to indicate greener mobile phone products. We noticed that the green purchasing rate is low for AC units. This is somewhat surprising because the energy efficiency criteria issued by the Japanese government are well known and easy to find. Moreover, AC units are also known for their large electricity consumption. A plausible reason for the low green purchasing rate is that the price differential of energy efficient AC units and typical AC units is quite large. Another reason is that it is difficult to identify whether purchased AC units satisfy the criteria on green products because the AC units purchased in the Japanese public sector are not ready made in the same way as those for home use are but, rather, are tailor made and embedded in the building in many cases.
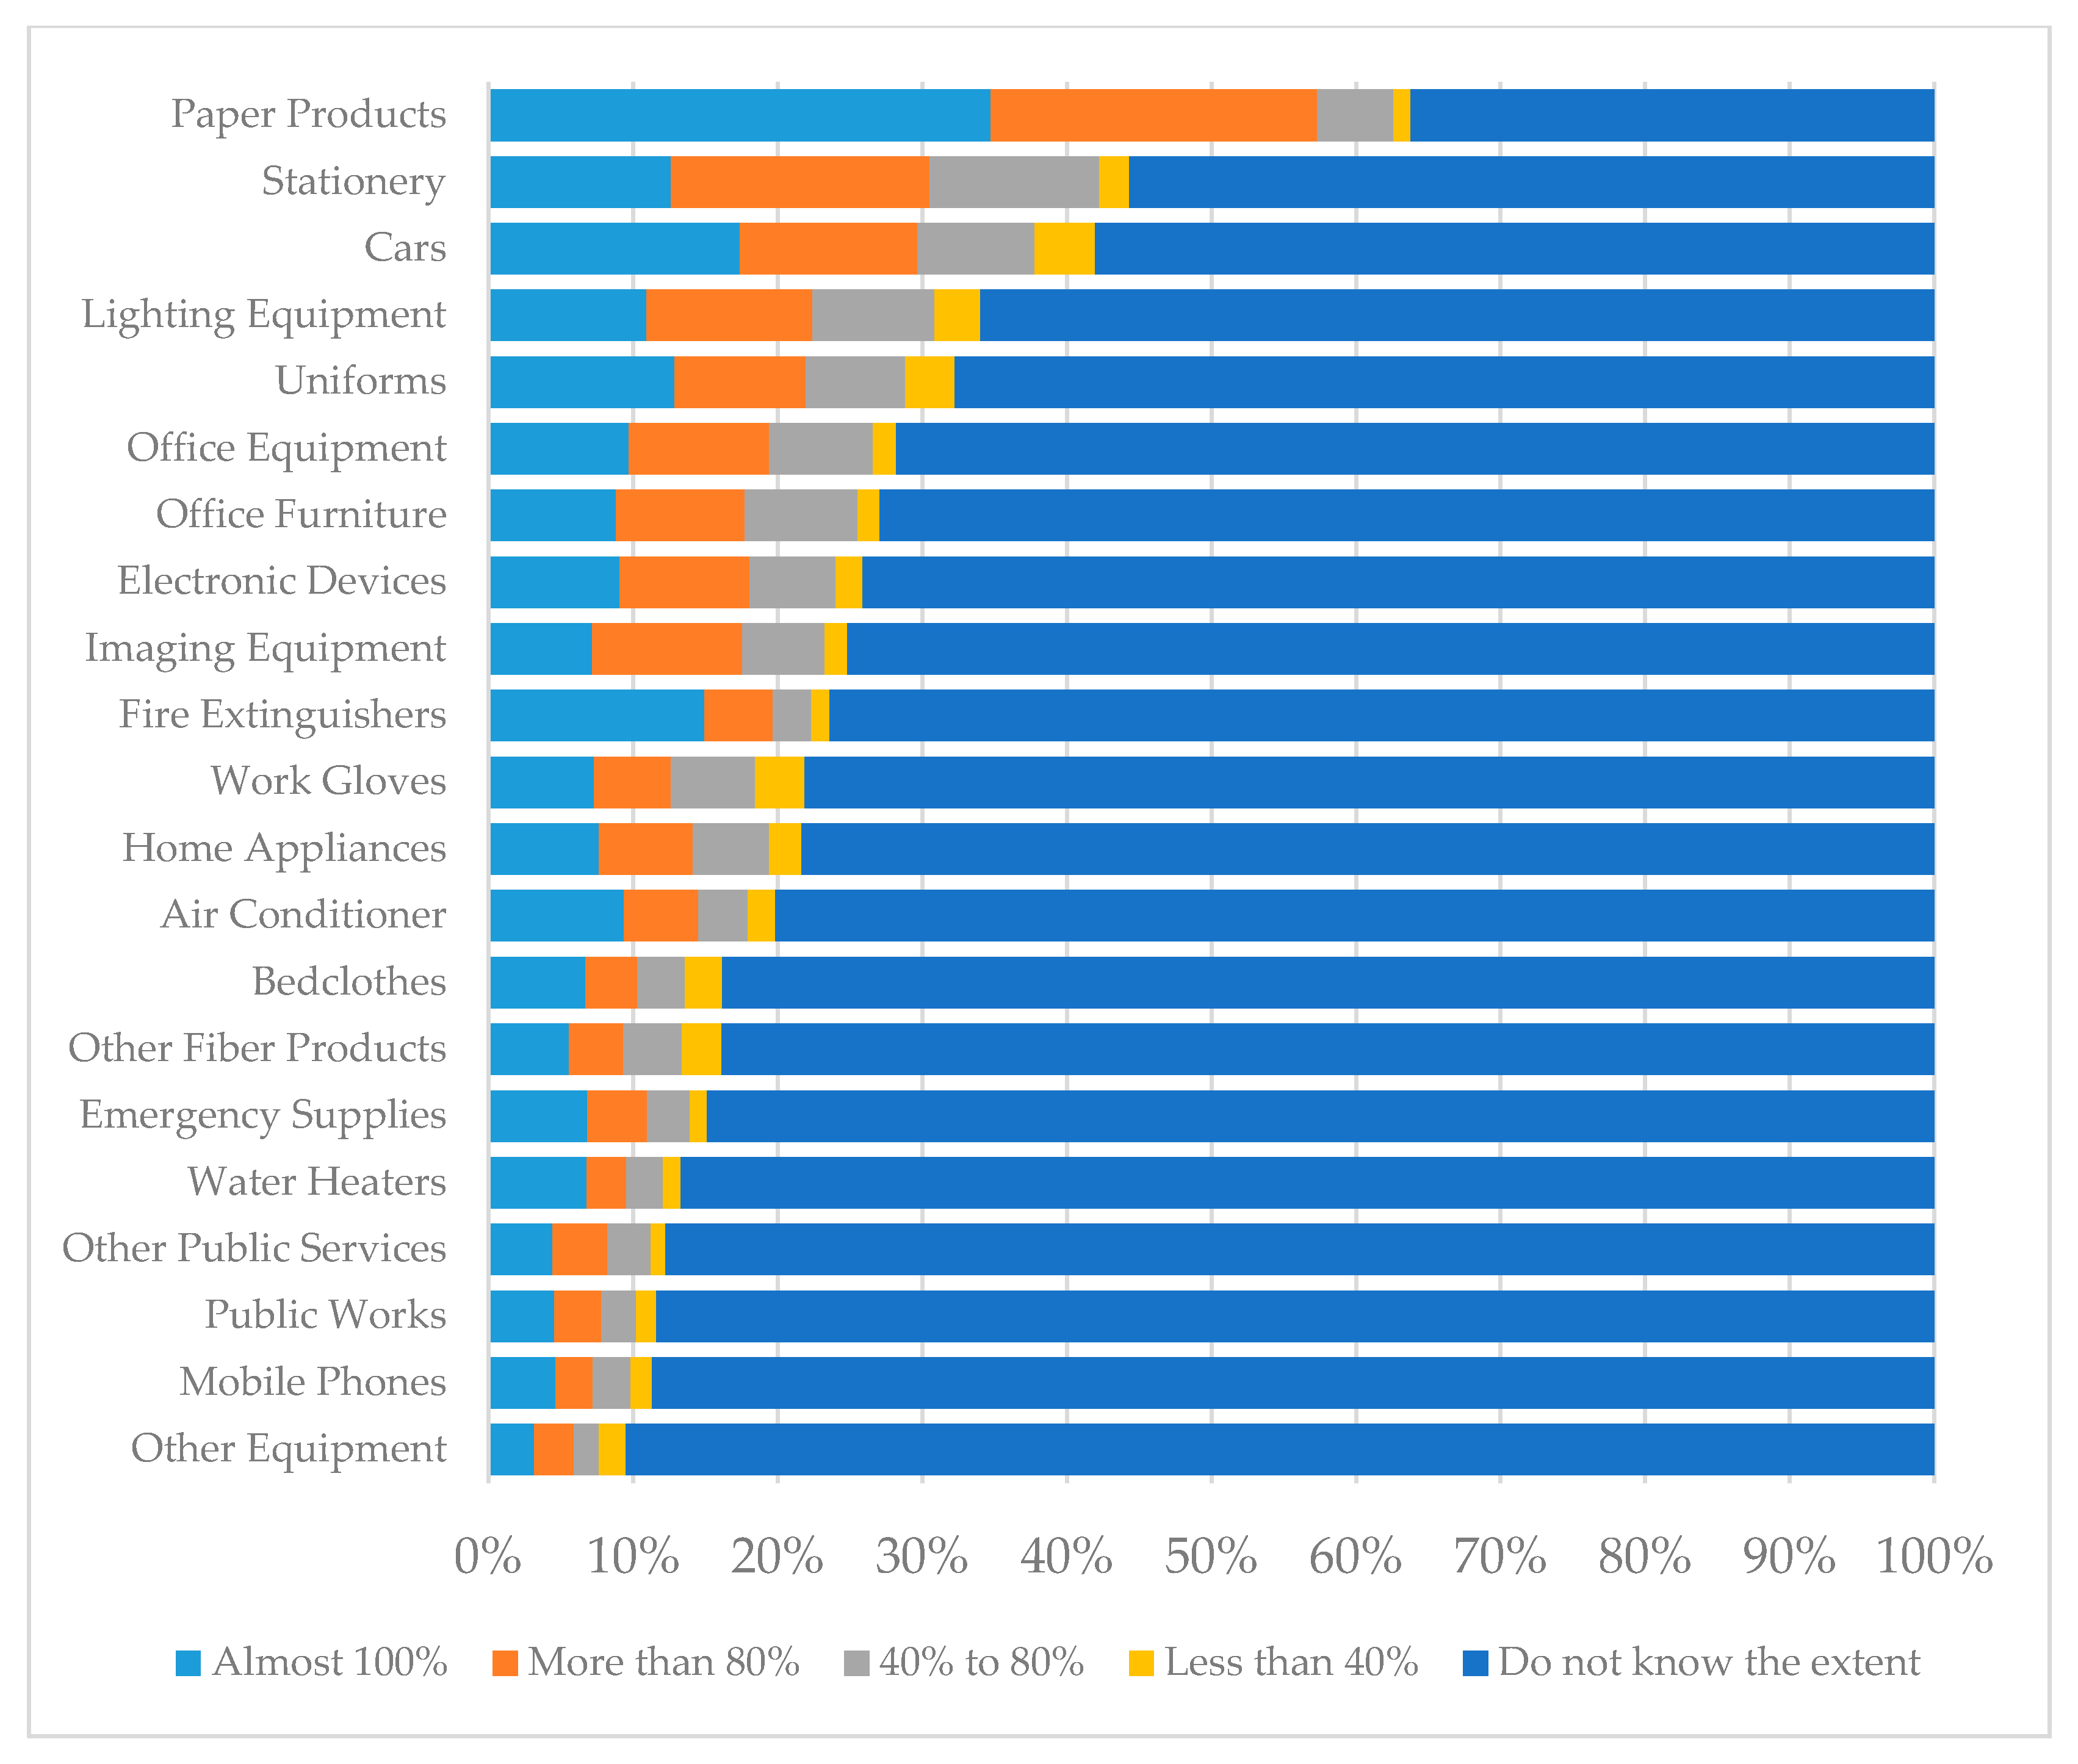
As we can see from Figure 3, there are many municipalities that have implemented green purchasing but do not measure their green purchasing rate, leaving us to wonder what percentage of municipalities that have implemented green purchasing do not measure their green purchasing rates and what percentage of municipalities have an almost 100% green purchasing rate? Figure 4 gives such information. The colors are the same as in Figure 3; for example, the blue areas represent the share of the municipalities whose green purchasing rate for the given category is almost 100%, and the blue, orange, gray, and yellow areas in Figure 4 jointly show the share of municipalities measuring their green purchasing rate for each category. The categories are sorted in descending order according to share. The average share across the categories is 24%. Thus, it is clear that many municipalities do not measure their purchasing rates.
From Figure 4, we can see that the share of municipalities measuring their green purchasing rates varies widely by category. Sixty-four percent of municipalities measure their green purchasing rate for paper products, whereas only 9% of them measure their green purchasing rate for other equipment. As the average share of municipalities measuring green purchasing rates is only 24%, it can be seen that the green purchasing rate for paper products is much easier to measure than the rates for other categories. Stationery and cars are also easier to measure (44% and 42%, respectively). It is likely easy to judge whether products in these categories are green products because there are many eco-labeled products in the categories or clear environmental criteria for products in the categories.
As a general trend, more municipalities measure the purchasing rate of the categories for which more municipalities implement green purchasing. While 50% of municipalities implement green purchasing in public works (from Figure 3), only 12% of those municipalities measure their green purchasing rate for public works. This tendency is similar to findings in the literature. Varnäs et al. [22] reported that it is hard to judge whether or not construction contracts fulfill the environmental requirements in the case of Sweden. Sporrong and Bröchner [21] also provided evidence that there are some difficulties with assessing the tenderers of architectural and engineering services using the environmental criteria in Swedish municipalities. Japanese municipalities may be in the same situation. The main reason for this is likely that it is hard to judge whether some public work products meet the criteria for being a green product, but it is easy to judge whether other public work products do. Some public work products are tailor made rather than ready made. Therefore, it is hard to judge whether they meet the criteria. However, it is relatively easy to judge whether certain public work products, such as road paving, meet the criteria for being green products [18]. We suspect that many municipalities implement green purchasing for products in public works categories with clear criteria for green products, but they do not know whether they are implementing green purchasing for products with unclear criteria. As a result, many municipalities implement green purchasing for public works but do not measure the purchasing rate of the categories.
In this subsection, we compared categories in terms of implementation of green purchasing and measurement of green purchasing rate. In discussing the comparative results, we discussed the following three aspects of the implementation and measurement: (1) frequency (quantity) of purchases, (2) product/services features (tailor made products or ready made products and existence of clear criteria such as eco-labels), and (3) whether it is easy to purchase in bulk (by the procurement department). While (1) and (2) are not controllable/easily controlled by municipal initiatives, (3) can be controlled by municipal initiatives. In addition, (1) and (2) make it easier to implement green purchasing, but whether they make it easier to measure the green purchasing rate is unclear. With regard to (1), in particular, the learning effect is likely to make it easier to implement green purchasing as the frequency of purchases increases. However, if it is not possible to purchase in bulk (by the procurement department), it is likely to be difficult to monitor the status of green purchasing or measure the green purchasing rate. Paper products and stationery are very likely to be purchased more frequently, and many municipalities have been implementing green purchasing for both categories. The difference in the share of municipalities measuring their green purchasing rates between these two categories may be due to the relative reluctance to buy stationery in bulk compared to paper products in general.
Measuring their own green purchasing rates allows municipalities to understand their current situation of green purchasing, and understanding the current situation is essential for improvement. In other words, measuring green purchasing rates of some items is essential for promoting green purchasing of these items. Based on the above discussion, a potentially effective initiative by municipalities is bulk purchasing by procurement departments to make it easier to measure green purchasing rates. Development of a green purchasing policy would facilitate bulk purchasing by procurement departments and, as a result, make it easier to measure the procurement rate as well as to implement green purchasing. To test this proposition, we analyze the differences in the implementation of green purchasing and measurement of green purchasing rates between municipalities with and without green purchasing policies.

3.2. Relationship between Green Purchasing Rates and Policies

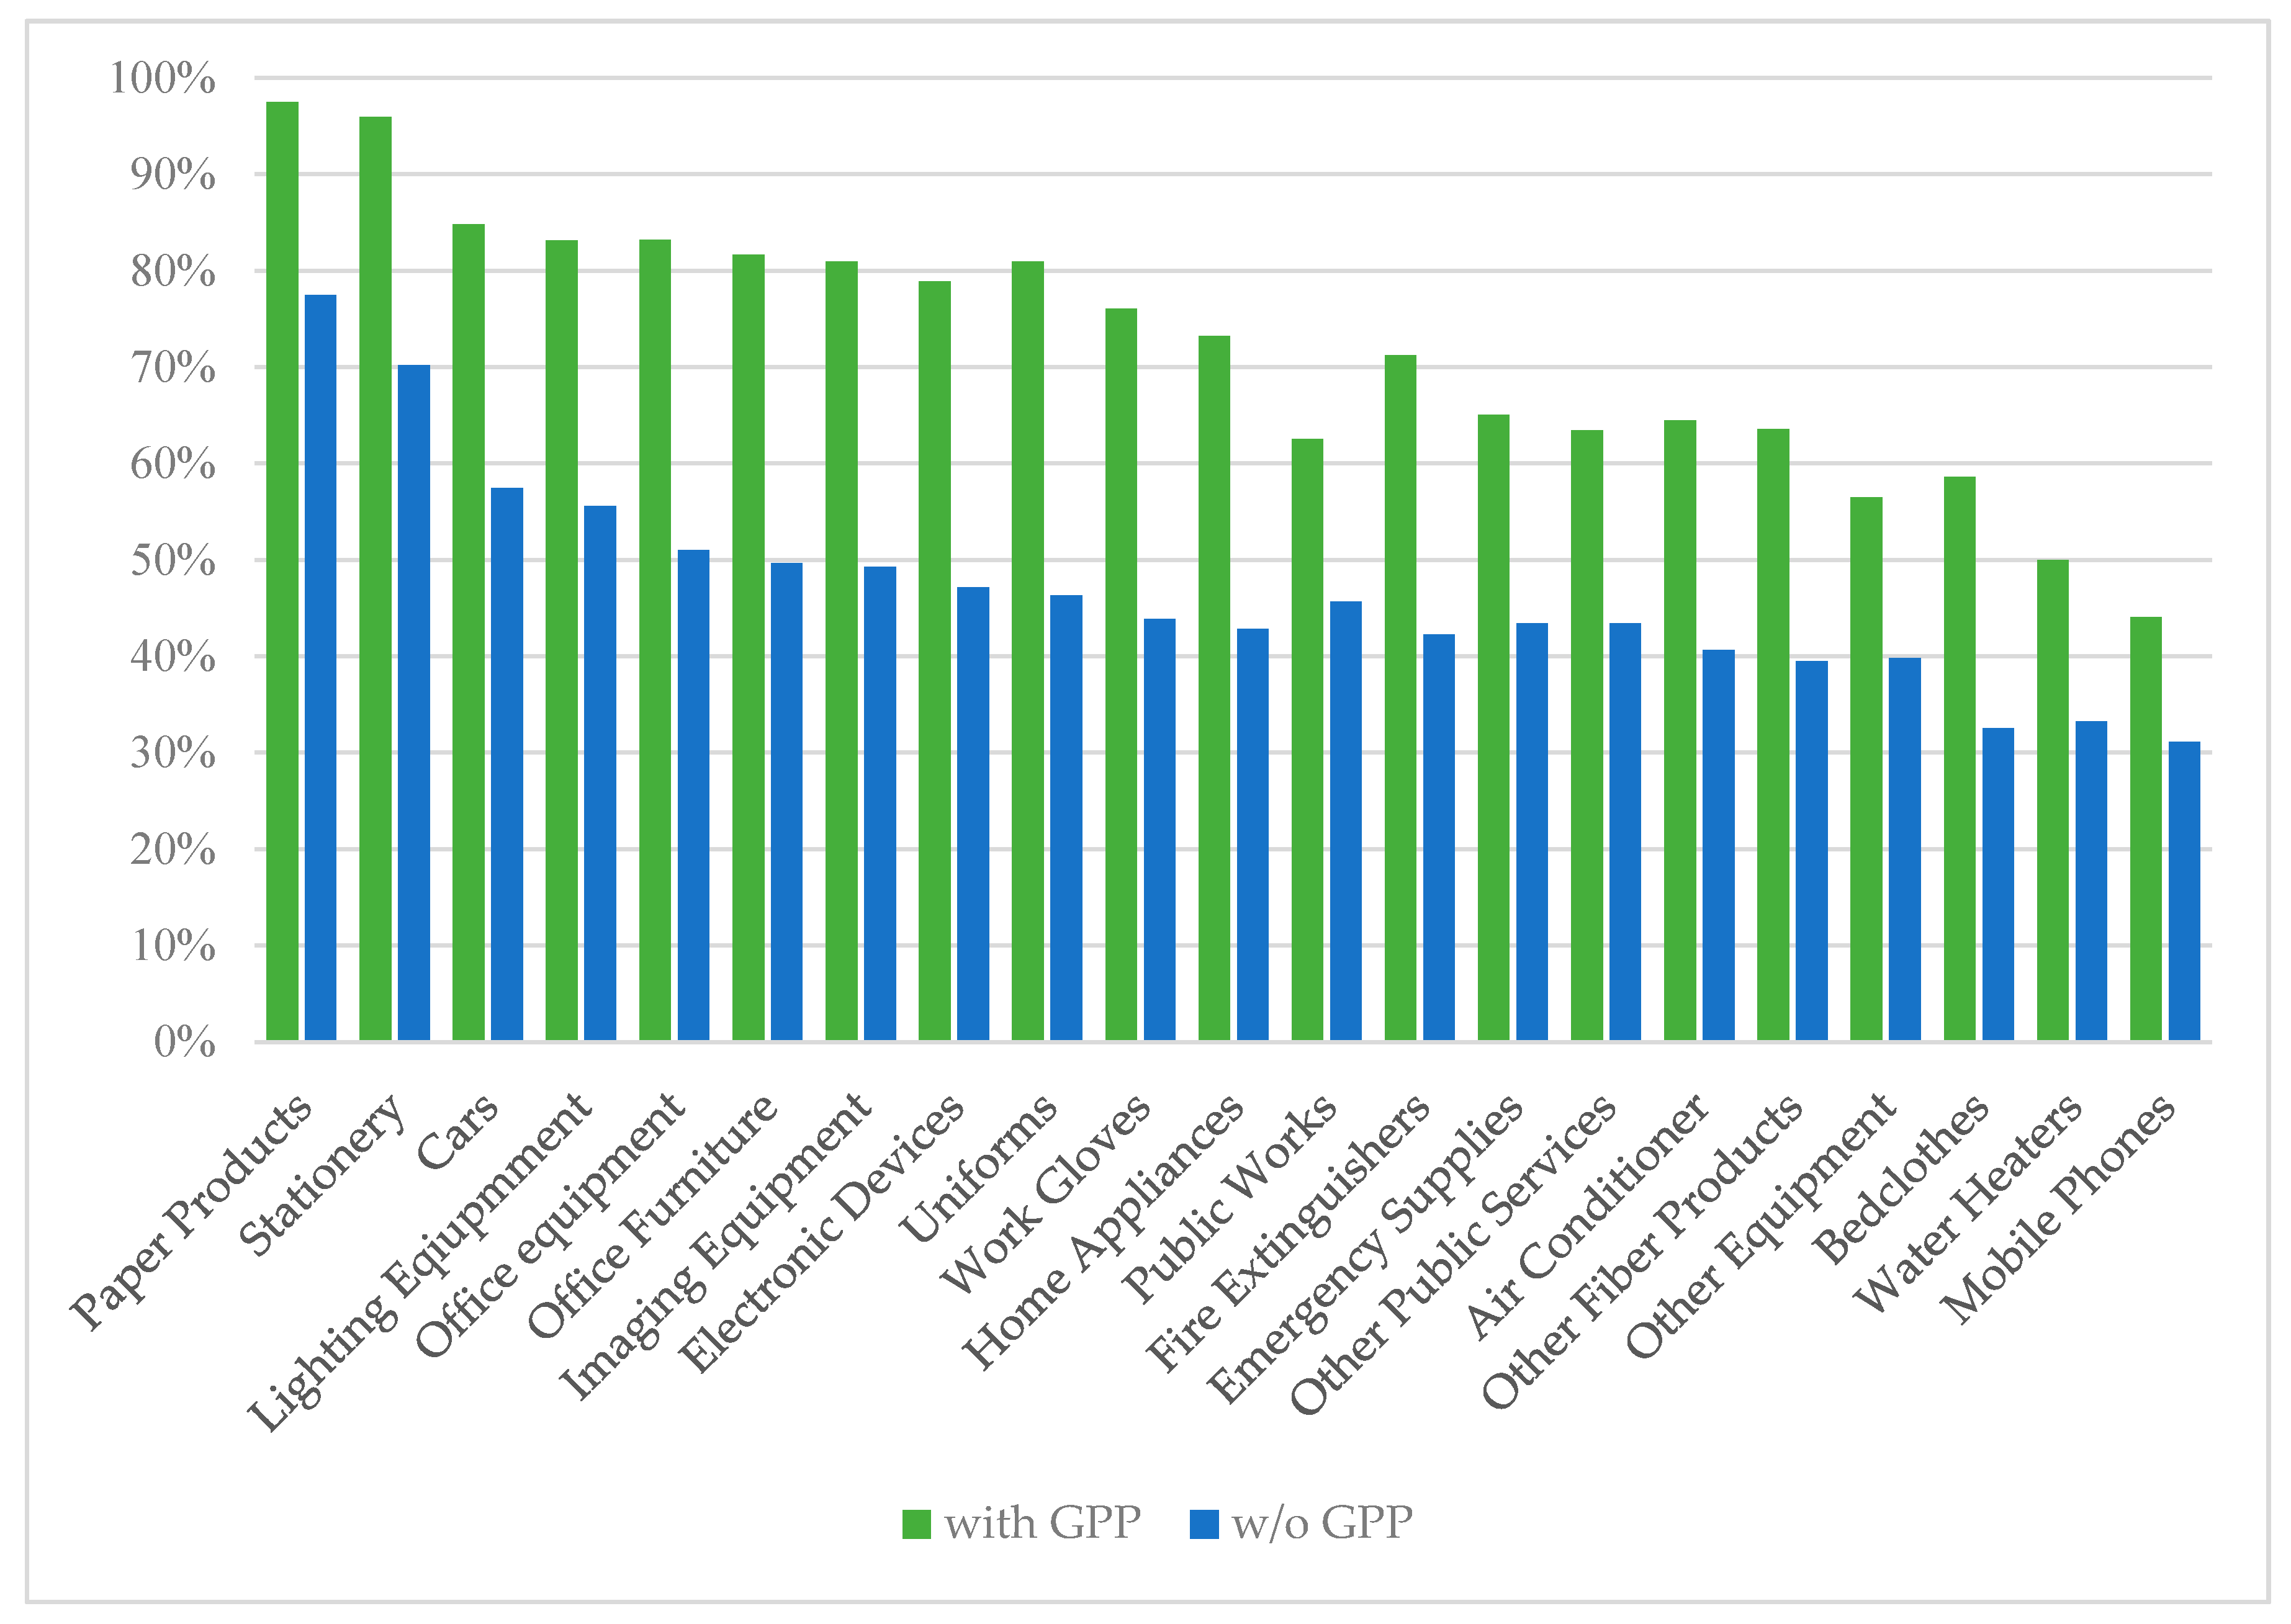
Figure 5 illustrates the share of municipalities that have implemented green purchasing by adopting a GPP. Light green bars show the share of green purchasing municipalities that have adopted a GPP, while light blue bars show those without a GPP. For example, among municipalities with a GPP, almost 100% implement green purchasing for paper products in one way or another. These include municipalities that implement green purchasing without measuring the green purchasing rate as well as those engaging in almost 100% green purchasing. For the paper products category, among municipalities without a GPP, the share of municipalities implementing green purchasing is less than 80%. The order of the items on the horizontal axis is the same as in Figure 3.
We observe a positive correlation between GPP adoption and green purchasing implementation. For all items, light green bars are taller than light blue bars, i.e., the share is higher if they have adopted a GPP. Even for the least popular category for green purchasing, mobile phones, the share of municipalities implementing green purchasing is more than 40%. This suggests that GPPs may promote or assist in the implementation of green purchasing.
Figure 5 demonstrates a pattern in the difference between municipalities with a GPP and those without a GPP in the share of green purchase implementing municipalities. The differences are smaller at both ends of Figure 5, that is, for paper products and mobile phones. As we move from the left to the center along the horizontal line, the difference becomes larger. It is the largest for uniforms, with 35 percentage points. The items next to uniforms such as electronic devices and work gloves seem to have greater impacts if a GPP is adopted by the municipalities.
The ranking based on the share of GPP-implementing municipalities is almost the same as that in Figure 3. Paper products have the highest share, while mobile phones have the lowest share. This observation is true for both municipalities with a GPP and those without a GPP, except for in the public works category. Among municipalities with a GPP, the share of municipalities implementing green purchasing for public works is slightly lower than that for other items on either side of public works. In contrast, among the municipalities without a GPP, the share is higher for public works than for other categories, such as work gloves and home appliances, which are located to the left of the graph. Thus, the positive correlation between the GPP adoption and the green purchasing rate is lower for public works than for other items. The procurement of public works may depend on regulations or policies other than a GPP.
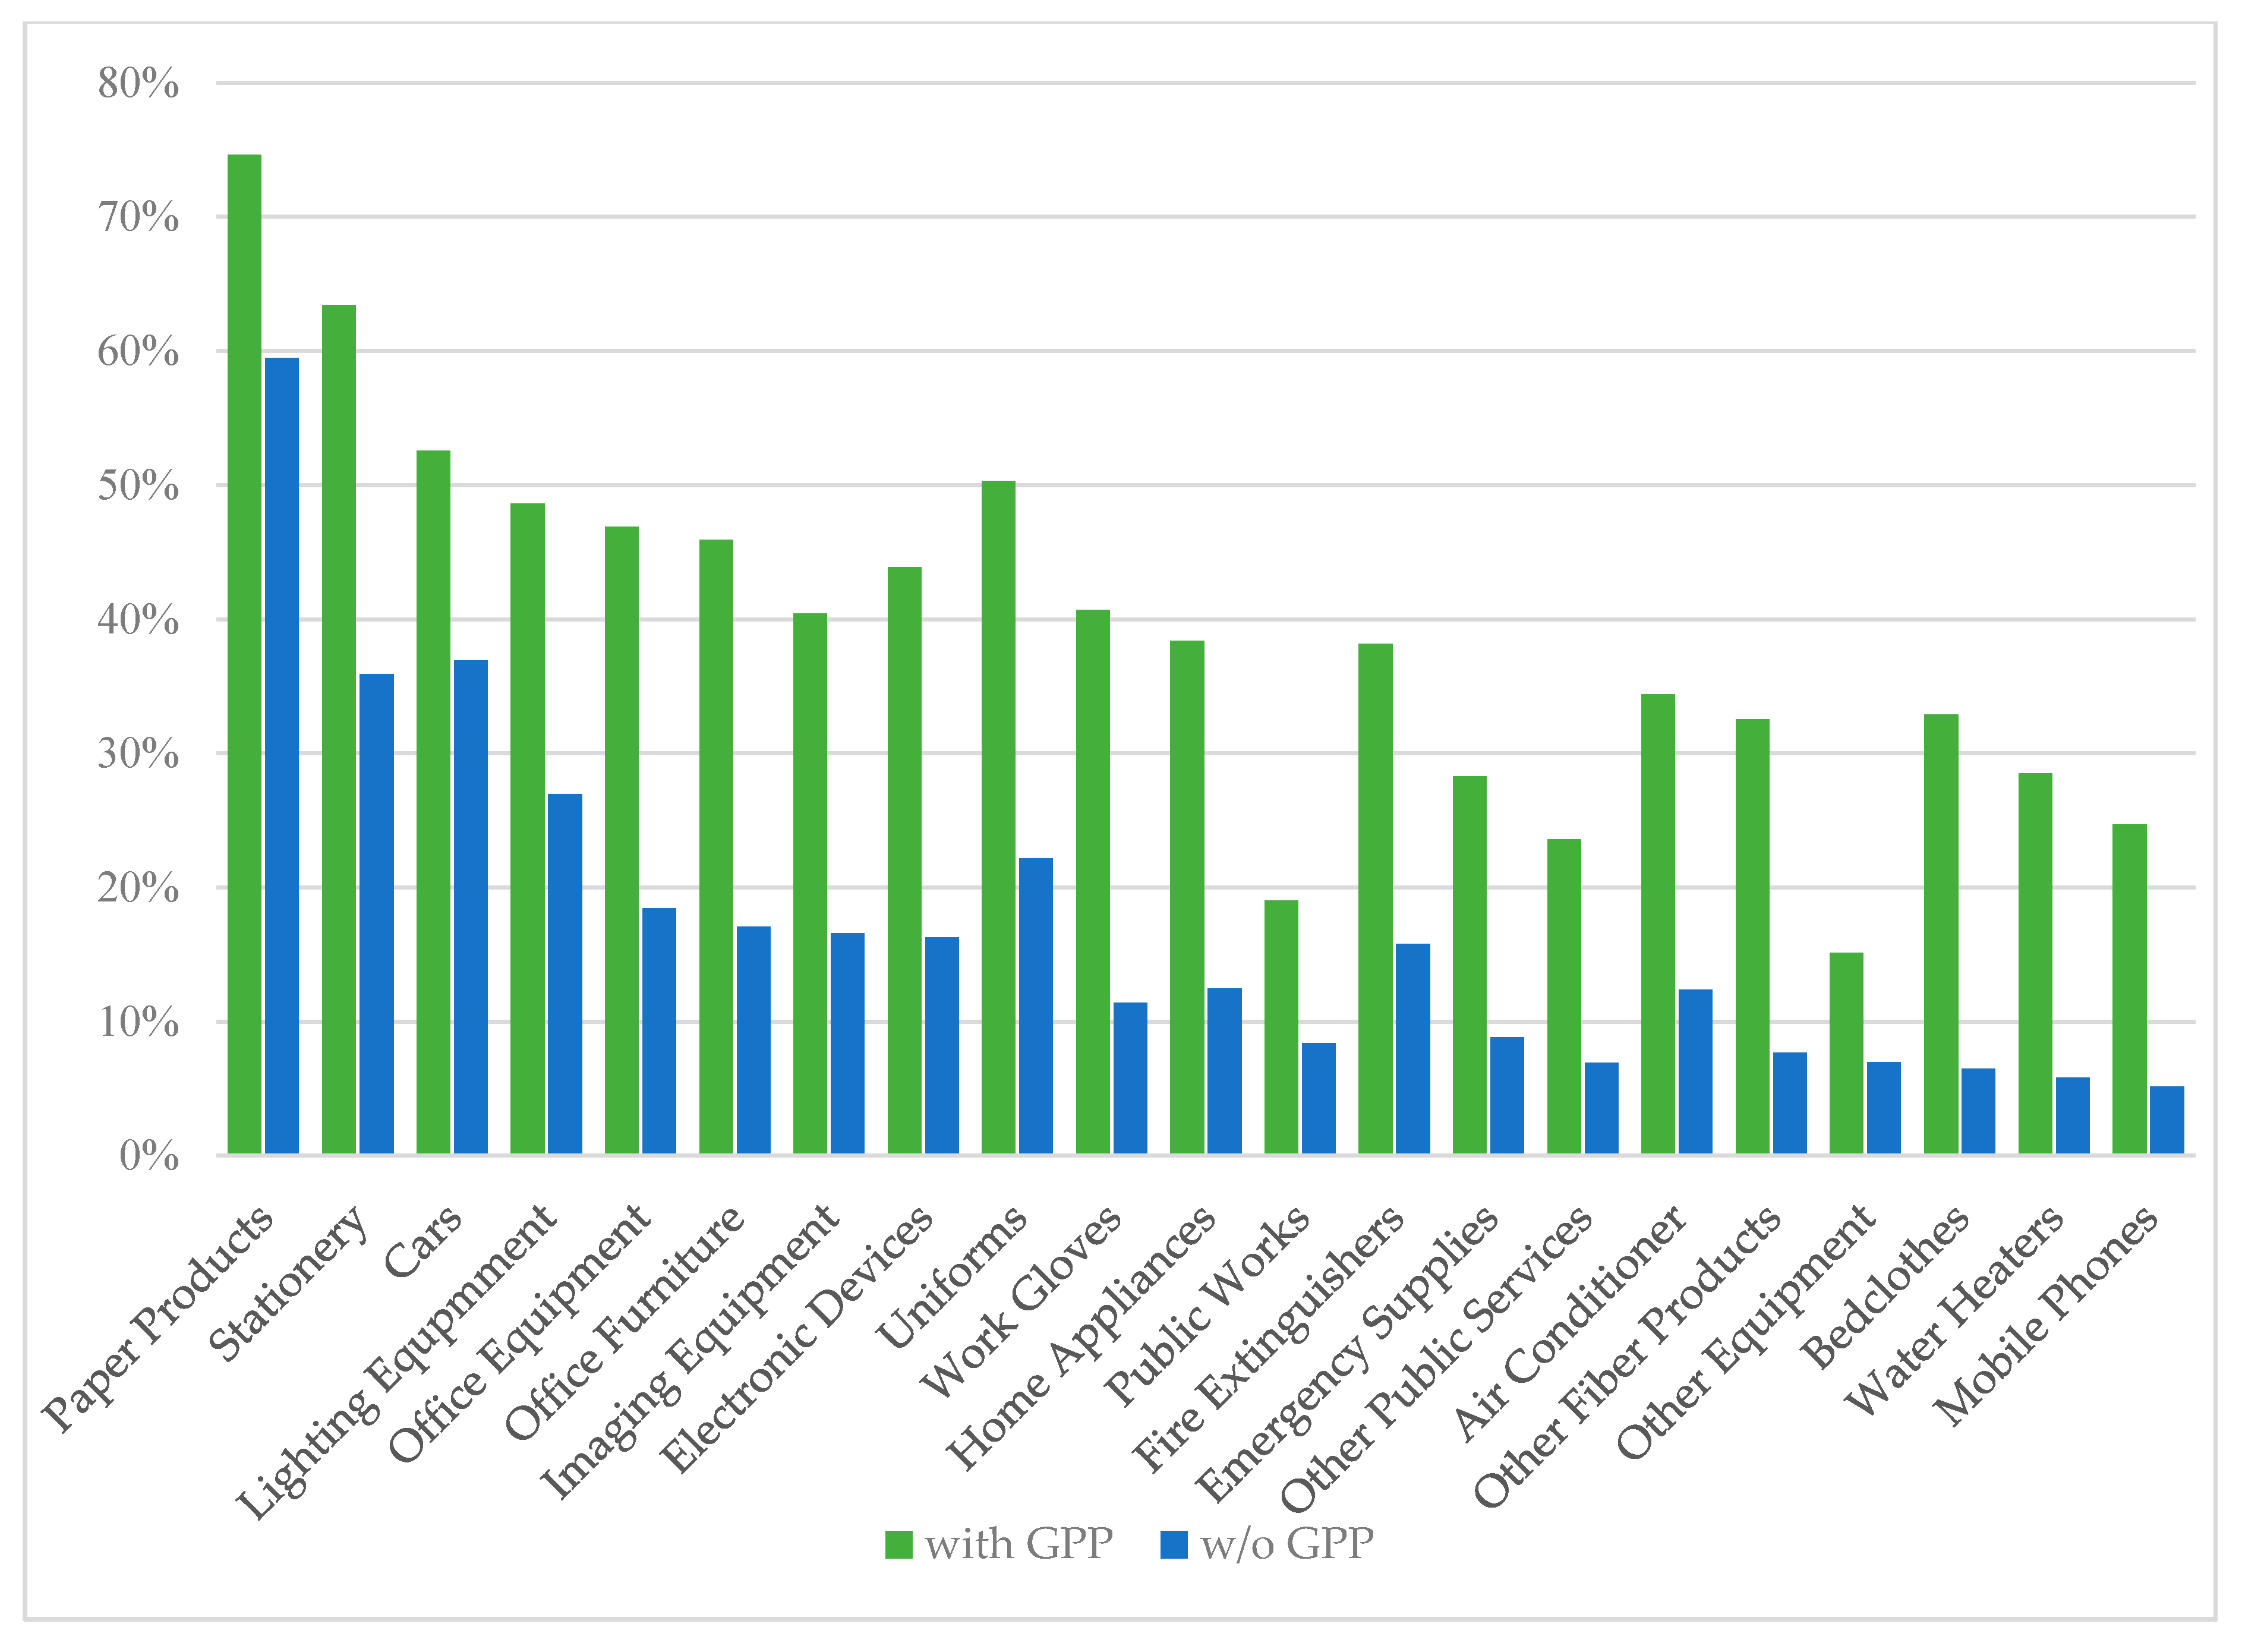
Figure 6 illustrates the share of municipalities with and without GPPs that measure their green purchasing rates for each item. The order of the items is the same as in Figure 3. The light green bar shows the share of municipalities measuring their green purchasing rates, while the light blue bar shows municipalities that lack such measurements.
We find that, overall, there are large differences in the share between the two types of municipalities. The largest difference, of almost 30 percentage points, is observed for work gloves. Municipalities with GPPs are more likely, by almost 20 percentage points, to measure their green purchasing rate than those that lack a GPP. The smallest difference is observed for other equipment, but that difference is still approximately seven percentage points.
The difference is also small for paper products and cars, which has two possible explanations. The first possible explanation is that the criteria for green products for these items are clear; hence, a GPP is not needed to purchase them. Another possible reason is that municipalities do not frequently purchase cars, and hence, it is easier for them to measure their own green purchasing rate. Figure 6 shows that for work gloves, office furniture and uniforms, the measurement rates are low for municipalities without a GPP. We notice that these three items have small environmental impacts, or, at least, they seem to. Consequently, procurement personnel in municipalities without a GPP may not bother to measure the green purchasing rate of these categories.
The comparison between stationery and cars provides insight into the impacts of GPP adoption and the impacts of purchase frequency. The share of municipalities without a GPP that measure their green purchasing rate for stationery is lower than that for cars (Figure 6), but the opposite is true for implementation of green purchasing (Figure 5). We surmise that this pattern reflects the impacts of purchase frequency on the implementation of green purchasing and measurement of green purchasing rates, purchase frequency is positively correlated with the implementation but negatively correlated with the measurement, as we discussed in the subsection above. However, from Figure 6, we can infer that once municipalities adopt a GPP, they are much more likely to measure their green purchasing rate for stationery than to do so for cars, and the impact of a GPP on the measurement is greater for stationery than for cars.

4. Regression Analysis

4.1. Estimation Model

In the last subsection, we examined the relationship between green purchasing of products/services in certain item categories and green purchasing policy or practices. However, other external factors such as the size of municipalities may also affect the decision regarding whether to adopt a GPP. For example, a municipality that has a larger budget can more easily adopt a GPP and implement green purchasing. In this case, it is difficult to distinguish between the effect of GPP adoption and that of the size of the municipality. Therefore, it is necessary to conduct a multivariate regression analysis to reveal the impact of GPP adoption on both the implementation of green purchasing and the municipality’s measurement of its own green purchasing rate.
The purpose of this section is to identify the treatment effects of GPP adoption on both the implementation of green purchasing and the municipality’s measurement of its own green purchasing rate while controlling for effects of other factors such as municipality size. Let I m p l e m e n t a t i o n i * and M e a s u r e m e n t i * be municipality i’s net benefits from the implementation of green purchasing and the measurement of its own green purchasing rate, respectively. In addition, we assume that these variables are explained by GPP adoption and other explanatory variables such as the size of each municipality. We specify the models as follows:
I m p l e m e n t a t i o n i * = β 1 G P P i + γ 1 X i + ε 1 i
M e a s u r e m e n t i * = β 2 G P P i + γ 2 X i + ε 2 i  
where G P P i is an indicator variable for GPP adoption, X i   is a vector of control variables, and ε 1 i and ε 2 i are idiosyncratic errors. In addition, β 1 , β 2 , γ 1 , and γ 2 are parameters to be estimated.
However, we cannot observe both I m p l e m e n t a t i o n i * and   M e a s u r e m e n t i * . Instead, we can observe whether the municipality implements green purchasing ( I m p l e m e n t a t i o n i ) and whether the municipality measures its own green purchasing rate ( M e a s u r e m e n t i ). Hence, we assume that I m p l e m e n t a t i o n i takes the value one if I m p l e m e n t a t i o n i *   0 , otherwise zero. Thus, the municipality implements green purchasing if it evaluates its net benefit to be greater than or equal to zero. M e a s u r e m e n t i and M e a s u r e m e n t i * are defined similarly.
Our variable of interest is G P P i , which takes the value one if a municipality i adopts a GPP. This variable is expected to identify the impacts of GPP adoption on whether a municipality implements GPP and/or measures its own green purchasing rate. Therefore, we expect G P P i to have positive signs.
A control variable vector, X i , includes the natural log of the standard financial scale of municipalities and populations. The natural log of the standard financial scale is expected to capture the effects of the financial constraints of the municipality and the municipality size. Financial constraints and a small size can be barriers to green purchasing [3,4,5,6,7,8,9,10,11,12,13]. Therefore, the coefficient of this variable is expected to be positive. We include the natural log of population as a proxy for the effects of the size of the municipality. Finally, we include prefecture dummies to control for time-constant unobservable factors such as the environmental consciousness of the prefecture to which municipality i belongs.
We assume that ε 1 i and ε 2 i are distributed by standard logistic distributions, respectively. Therefore, we apply the logit model to estimate the parameters. Moreover, for the estimation of Equation (2), we exclude municipalities that do not implement any green purchasing to focus on the extent to which municipalities that implement green purchasing also measure their own green purchasing rate.

4.2. Estimation Results

We confirm that almost all of the coefficients of the variables, except for the natural log of the population, have the expected sign. We briefly summarize the results in terms of the control variables. First, the coefficients of the natural log of standard financial size are statistically significant and show a positive sign for the implementation of green purchasing for most items. This result is consistent with the literature [3,4,5,6,7,8,9,10,11,12,13]. On the other hand, this variable has no significant impact on the measurement of green purchasing for most items. These results imply that financial constraints may not be a strong barrier to measuring the green purchasing te. Second, we find that the natural log of population has no significant impact on both the implementation of green purchasing and measuring the green purchasing rate for most items. It may not be appropriate as a proxy. The details are summarized in Table A2.
Next, we explain the results with regard to the GPP. Table 1 summarizes the average partial effects (hereinafter, APEs) of adopting a GPP on each of the dependent variables for 21 items. Table 1 also shows the effective sample size for each estimation. This table indicates that the adoption of a GPP has positive and statistically significant impacts on both the implementation of green purchasing and the municipality’s measurement of its own green purchasing rate.
Regarding the estimation results for the implementation of green purchasing, we find that if a municipality has a GPP, then it tends to implement green purchasing for all items except mobile phones, water heaters, other equipment, and public services. Almost all APEs are larger than 10%. According to column (1) of Table 1, for stationery and office equipment, GPP adoption has the highest APE, which is approximately 19%. The second highest APE, roughly 18%, is found for imaging equipment, electronic devices, and uniforms. The third highest APE, approximately 17%, is found for office furniture and work gloves. After work gloves, the APE declines but remains high. The APE is approximately 15% for lighting equipment. GPP adoption has the same APE, approximately 14%, for paper products, home appliances, and cars. Moreover, the APE is approximately 12% for fire extinguishers. The remaining items have APE values less than 10%. Among the remaining items, the highest APE of approximately 9% is revealed for bedclothes and emergency supplies. The second highest APE is approximately 8% for other fiber products. The lowest APE among the 21 items is approximately 6% for other public services and AC units.
According to these results and Figure 5 in the previous section, we find that GPP has a higher APE on items for which there is a larger difference in the share of municipalities engaging in green purchasing with and without a GPP. For example, uniforms have higher values in both APE and the difference in green purchasing between municipalities with and those without a GPP. In contrast, several items that have relatively higher values in this difference have lower APEs. For instance, the differences in green purchasing between municipalities with a GPP and those without a GPP for AC units and cars exceed 20%, whereas their APEs are lower than 15%.
Next, we discuss the impact of GPP adoption on a municipality’s measurement of its own green purchasing. Column (2) of Table 1 summarizes the estimation results for the measurement of green purchasing. This column shows that the APEs of the adoption of a GPP are positive and statistically significant for all items. Moreover, almost all of the APEs are larger than 20%. As shown in column (2) of Table 1, the highest APE of the implementation of GPP on a municipality’s measurement of its own green purchasing rate is approximately 28% for office equipment and work gloves. The second highest APE, approximately 26%, is found for electronic devices. The third highest APE, roughly 25%, is found for office furniture. The fourth highest APE is approximately 23% for stationery, water heaters, and bedclothes. Imaging equipment and other fiber products have the fifth highest APE, which is approximately 22%. Mobile phones, home appliances, lighting equipment, and uniforms have an APE of approximately 21%. The APE is less than 20% for the remaining items. Among them, fire extinguishers have an APE of approximately 19%. Other public services have an APE of approximately 17%, while the APE is approximately 16% for AC units. Paper products, cars, other equipment, and public services have the lowest APEs among the 21 items at approximately 12%.
These results are similar with the results for the implementation of some green purchasing. We find that GPP adoption has higher APE on items that have a large difference in the share of municipalities with measuring their own green purchasing rate by with and without GPP. Similarly, several items with relatively higher values in terms of this difference have lower APEs. One example is uniforms, which differ by 28% between municipalities with and without a GPP but for which the APE of a GPP is 20%.
In our analysis, the APE of G P P i indicates its impact on the probability of implementing green purchasing or of the municipality measuring its own green purchasing rate. Then, we can interpret our estimation results as expected differences in the share of municipalities that implement green purchasing or that measure their green purchasing rate according to whether the municipality has adopted a GPP after controlling for the effects of municipalities’ size. We can observe that this expected difference in the share of municipalities that measure their green purchasing rate is higher than the difference without controlling for municipalities’ size, while the opposite is true for the case of whether a municipality implements green purchasing.
Our estimation results are different from those illustrated in Figure 5 and Figure 6 in the previous section. Before controlling for the effects of the municipalities’ size, it appears that the impact of GPP adoption is greater on the implementation of green purchasing than on whether a municipality measures its own green purchasing rate. Figure 5 and Figure 6 indicate that the differences in the share of municipalities that implement green purchasing between those with and without a GPP is higher than the difference in whether they measure their own gre purchasing rate, except for stationery, other fiber products, mobile phones, and water heaters (for detailed information, see Table A1). Moreover, these differences are not particularly great, with a mean value of approximately 5%. In contrast, our estimation results, which take into account the size of the municipalities, provide the opposite results, showing that GPP adoption has a greater effect on whether a municipality measures its green purchasing rate. GPP adoption has a higher APE on the measurement of green purchasing rate than on the implementation of green purchasing except in the case of paper products. Moreover, the extent of the difference in the green purchasing rate between municipalities with and without a GPP becomes greater.
As argued by Darnall et al. [27], GPP adoption can promote green purchasing. We confirm that GPP adoption has positive and statistically significant impacts on both the implementation of green purchasing and on whether a municipality measures its own green purchasing rate after controlling for the effects of municipalities’ size. One implication of our estimation results is that GPP adoption can help municipalities to measure their own green purchasing rate rather than implement green purchasing. This finding suggests that the GPP adoption can help municipalities initiate green purchasing and make it more successful. Notably, there are higher impacts of GPP adoption on the further success of green purchasing measurements.
One possible interpretation of the effectiveness of GPP is that the adoption of GPP can promote green purchasing by solving some of the problems in advancing green purchasing. First, since the adoption of GPP can be interpreted as an establishment of a strategic goal in terms of green purchasing, it can identify the aims and benefits of green purchasing [8,9,17]. Second, once GPP is adopted, it can increase environmental awareness within the municipality. Therefore, the adoption of GPP can directly solve the lack of awareness [5,10,11]. Third, the adoption of GPP can make green purchasing an organization-wide initiative by increasing the importance of green purchasing within the municipality. Then, it can address the lack of support from senior managers [8,9,14,15,16].

5. Discussion

Our analysis revealed the extent to which green purchasing has been advanced in Japan by category or item. By observing in which categories or for which items the green purchasing rate is high, we can conjecture which characteristics help promote green purchasing by municipalities. At the same time, by identifying the categories or items that lag behind in green purchasing, we can propose policy measures that are useful for municipalities in terms of these items.
We can summarize the descriptive statistics of our data as follows. Our data reveal the characteristics of items that are more likely to advance in green purchasing and show that items tend to progress in green purchasing if they are purchased more frequently and/or in larger quantities (e.g., paper products and stationery). One possible reason for this success is that purchasing officers can improve the implementation of green purchasing with experience. If the frequency of purchasing is higher, then the purchasing officer can learn how to implement green purchasing by learning by doing, as pointed out by previous studies [12,37,38,39,40,41]. Alternatively, the cost of green purchasing may be relatively lower for such items. Therefore, even smaller municipalities can purchase the green products of such items [3,4,5,6,7,8,9,10,11,12,13]. Moreover, our data show that if items are often purchased in bulk (e.g., uniforms, work gloves, paper, stationery, etc.), then they also tend to be prioritized for green purchasing. One plausible reason is that bulk purchasing eliminates the need for interdepartmental coordination. In addition, green purchasing is also advanced in items for which criteria such as an “ecolabel” are used to identify eco-friendly goods [18,19,20,21,22,23]. The opposite is true for several items, such as mobile phones.
In contrast, tailored items such as public works and AC units are less likely to advance in green purchasing [18,19,20,21,22,23]. With regard to AC units, procurement officers have to specify the performance of the goods to meet the certain criteria of energy efficiency since no explicit standards exist for office AC units. This situation is also true for public works. For these items, it is more difficult for procurement officers to identify whether a product or contract is environmentally friendly. In addition, the green purchasing rate is less likely to be measured for tailored items.
Next, our estimation results indicate that a GPP can improve the advancement of green purchasing in terms of both its implementation and measurement, even for items for which green purchasing is relatively difficult to implement. The results are also robust when controlling for the size of the municipality. We find that for all items, implementation of green purchasing is more advanced in municipalities with a GPP. In terms of such implementation, there are large differences between municipalities with and without a GPP for uniforms, work gloves, and computers, with differences exceeding 30%. Conversely, the percentage is approximately 20% for paper products and 13% for mobile phones. In other words, it is clear that the impact of a GPP is relatively high for items for which green purchasing as a whole is in progress to some extent. The same is true for the measurement of green purchasing.
We also find that the impact of GPP adoption is higher on the measurement of green purchasing than on its implementation. One reason for the particularly large impact of GPP adoption on measurement might be that GPP adoption forces municipalities to manage green purchases, and measurement is necessary for such management. Another reason is that starting to measure the green purchasing rate is relatively easier than starting to implement green purchasing. The implementation of green purchasing requires coordination among departments making green purchases, which is particularly difficult in cases of separate purchases. Furthermore, the measurement of green purchasing is not progressing in most municipalities, so there is more room for improvement.
The results of our analyses suggest the effectiveness of a GPP. One of the main reasons for its effectiveness is likely that GPP adoption makes it easier to purchase items in bulk. As we discussed in Section 3.1, the relative ease of bulk purchasing is likely one of the main reasons for the successful green purchasing of paper products. GPP adoption changes green purchasing from concerning individual initiatives to concerning organization-wide initiatives. Consequently, the priority of green purchasing becomes higher, and support from senior managers increases [8,9,14,15,16]. This change facilitates interdepartmental coordination for bulk purchasing or may make interdepartmental coordination unnecessary to purchase in bulk in some cases. There are likely other channels through which GPP adoption affects green purchasing. Nevertheless, we find that GPP adoption is positively associated with the implementation and measurement of green purchasing.
Despite the effectiveness of a GPP, only approximately 25% of municipalities have adopted a GPP in Japan. Therefore, the national government should take measures to promote GPP adoption and green purchasing in collaboration with prefectures that have a better understanding of their own municipalities than the national government. As larger municipalities are more likely to adopt a GPP and there is a strong correlation between the advancement of green purchasing and the size of the municipality, such measures would be better targeted primarily at small municipalities. When developing measures for small municipalities, it is important to note that most small municipalities have limited human, financial and other resources for green purchasing.
By looking at the descriptive statistics and estimation results, we can identify the following policy implications to promote green purchasing. First, if the accessibility to and identifiability of green products/services is high, then even municipalities with little resources, knowledge and experience for green purchasing may be able to implement green purchasing. Some studies have pointed out the difficulties in the use of environmental criteria for purchasing and procurement [18,19,20,21,22,23]. We observe a high percentage of municipalities implementing green purchasing for categories for which there are many ecolabeled products (accessibility) or clear environmental criteria for products (identifiability). This observation implies that it is easier for the green purchasing of such categories to spread to small and medium-sized municipalities. Therefore, measures to improve the accessibility to and identifiability of green products may be useful for promoting green purchasing among small and medium-sized municipalities.
Second, the promotion of green purchasing has potential for further mitigation of climate change. Notably, green purchasing in public works and air conditioning can result in a large improvement in environmental quality since these categories have relatively large environmental impacts and are likely to have long-term consequences. Moreover, among municipalities with some extent of green purchasing, there is also room for improvement in their measurement of this purchasing. In these municipalities, measuring green purchasing is more effective since the high rate of green purchasing is more meaningful.
However, our study fails to address the important issues that were addressed in previous studies. For example, we do not examine how green purchasing performance is affected by some important drivers/barriers to implementing GPP practices, such as knowledge [9,22,42,43,44,45], training [9,11,12,15,17,22,38,39,46], organizational structure and culture [47,48,49], government legislation [9,11,31,50,51,52,53,54], public/citizen pressure [6,15,17,49,55,56,57], NGO influence [15,31,58], and supplier issues [6,42,45,49,59,60,61,62,63].
This study analyzed the status of green procurement by adopting the criteria for green products and services currently adopted in Japan. Therefore, this study does not address the development of better environmental standards, how to incorporate environmental standards into procurement, and how to include procurement performance in the evaluation of an organization’s environmental performance (sustainability performance), as some previous studies have done [64,65,66,67,68,69,70]. In addition, we do not examine the impacts of green public purchasing/procurement, such as environmental impacts, welfare impacts and spillover effects, unlike some previous studies (e.g., [71,72,73,74]). Finally, we focus only on environmental aspects, but public procurement/purchasing has been taken into account as well as environmental aspects (sustainable public procurement/purchasing). More recently, the EU has started to exploit public procurement toward a circular economy (circular public procurement) [75], and as Lăzăroiu et al. [76] mentioned, several studies have addressed public procurement from the perspective of circularity (e.g., [77,78,79]). With the current data, we cannot estimate the relationship between green purchasing performance and the above impacts and cannot analyze from the perspective of circularity.

6. Conclusions

This paper is, at least to the best of our knowledge, the first study to examine green purchasing in one country by item in a comprehensive way. Drawing upon a unique dataset from the “Questionnaire survey on green procurement by local governments”, we examined the current progress made in green purchasing in Japan in 21 categories and investigated the role of a GPP in green purchasing. We outlined the implementation of a GPP for the 21 categories and conducted multivariate regression analyses. We found considerable variation in the green purchasing rates among categories and positive impacts of GPP adoption on the green purchasing rates.
Our analysis revealed that green purchasing is advanced in items such as paper or stationery. We can point out the common characteristics of these items as follows. First, ecolabels are available and used for these products. Second, it is easy to purchase these items in bulk. In contrast, it is found that green purchasing is not so common in items such as air conditioners or public works. These items are often tailored, and it is difficult to determine if they are environmentally friendly or not. In general, these tendencies apply to GPP measurements as well. We also found that the measuring rates are higher than the purchasing rate for every item.
A GPP can play an important role in advancing green purchasing by municipalities. Darnall et al. [27] report that GPP adoption can promote successful green purchasing implementation. Our results are consistent with their findings. We empirically confirm that GPP adoption can promote green purchasing implementation as well as the measurement of the green purchasing rate for almost all 21 item categories. Notably, GPP adoption has a higher impact on measurement than on implementation. In other words, GPP adoption can promote green purchasing in practice while making green purchasing more successful. The GPP plays an important role in green purchasing implementation and its success.
This study, however, has not examined the causal relationship between a GPP and green purchasing. As the first study on green purchasing rates by category, we focused on fact finding. Consequently, we looked at the correlations but did not identify the causal impacts of a GPP, “ecolabeling”, bulk purchasing, and managerial barriers on the green purchasing rate. These are important areas for future research.

Author Contributions

N.Y. and T.T. conducted the data cleaning and analyzed the data. N.Y. validated the analysis and constructed graphs and tables. T.T. and T.M. conducted the literature review. N.Y. wrote the first draft of the analysis part of the paper. T.M. and T.H.A. provided overall guidance for the research and meaningfully contributed to the structure and revision of the paper. All authors have read and agreed to the published version of the manuscript.

Funding

This research was financially supported by the Research Institute for Environmental Economics and Management at Waseda University. Toshi Arimura also appreciates the financial support from Waseda University Grants for Special Research Projects. Toshi Arimura and Nao Yajima appreciate the financial support from the Environment Research and Technology Development Fund (JPMEERF20202008) of the Environmental Restoration and Conservation Agency of Japan. Nao Yajima also appreciates the financial support from the cooperation of organization between Waseda University and ENEOS Corporation.

Acknowledgments

The authors are grateful to the Ministry of the Environment, Japan, and to the Green Purchasing Network for providing the rich dataset from the “Questionnaire survey on green procurement by local governments”. Our research benefited from comments from Nicole Darnall, Gakuji Fukatsu and Riga Wu. We also greatly benefited from the participants in the stakeholder meeting of green purchasing that took place at Waseda University in December 2018.

Conflicts of Interest

The authors declare no conflict of interest.

Appendix A

Figure A1. The green purchasing policy of Yokohama city (Source: Ministry of the Environment [34].
Sustainability 12 08979 g0a1
Table A1. Differences in the share of green purchasing and measuring of 21 categories with and without a GPP.
CategoriesShare of Municipalities with a Green Purchasing PolicyShare of Municipalities Measuring Their Own Green Purchasing Rate
Allwith GPPw/o GPPDifferenceAPEAllwith GPPw/o GPPDifferenceAPE
Paper Products82%97%77%20%0.14 ***64%75%59%15%0.12 ***
obs.16293961229 16021342386952 1335
Stationery76%96%70%26%0.19 ***44%63%36%27%0.23 ***
obs.16253961225 15981243380860 1238
Office Furniture58%82%50%32%0.17 ***27%46%17%29%0.25 ***
obs.15983921204 1592920320598 916
Imaging Equipment57%81%49%32%0.18 ***25%40%17%24%0.22 ***
obs.15893881199 1583907314591 903
Electronic Devices55%79%47%32%0.18 ***26%44%16%28%0.26 ***
obs.15843841198 1578870303565 854
Office Equipment59%83%51%32%0.19 ***28%47%18%28%0.28 ***
obs.15913871202 1585937322613 933
Mobile Phones34%44%31%13%−0.0211%25%5%20%0.21 ***
obs.15713861183 1565540170368 424
Home Appliances50%73%43%30%0.14 ***22%38%12%26%0.20 ***
obs.15903881201 1585799284514 772
Air Conditioner47%64%41%24%0.06 **20%34%12%22%0.16 ***
obs.15843881194 1578737250485 701
Water Heaters37%50%33%17%0.0113%28%6%23%0.23 ***
obs.15733861185 1567588193394 454
Lighting Equipment62%83%56%28%0.15 ***34%49%27%22%0.20 ***
obs.16023911208 1595999325671 994
Cars64%85%57%27%0.14 ***42%53%37%16%0.12 ***
obs.15973881206 15901025329693 1020
Fire Extinguishers49%71%42%29%0.12 ***24%38%16%22%0.19 ***
obs.15863861197 1579784275506 758
Uniforms55%81%46%35%0.18 ***32%50%22%28%0.20 ***
obs.15893881198 1582871314555 867
Bedclothes39%59%32%26%0.09 ***16%33%6%26%0.23 ***
obs.15743841188 1568612225386 503
Work Gloves52%76%44%32%0.17 ***22%41%11%29%0.28 ***
obs.15923881201 1585824295527 777
Other Fiber Products46%64%39%24%0.08 **16%33%8%25%0.22 ***
obs.15803871190 1573719246470 659
Other Equipment44%56%40%17%0.039%15%7%8%0.12 ***
obs.15813861192 1574695218474 533
Emergency Supplies49%65%43%22%0.09 ***15%28%9%19%0.20 ***
obs.15893861200 1582775251521 719
Public Works50%63%46%17%0.0412%19%8%11%0.12 ***
obs.15923871202 1585794242549 676
Other Public Services48%63%43%20%0.06 **12%24%7%17%0.17 ***
obs.15873881196 1580768246519 652
Note: the number of the observations represents the valid responses to each question and valid sample sizes to estimate APE. ** p < 0.05, *** p< 0.01.
Table A2. Coefficients of GPP, population and standard financial scale (in logarithmic) for green purchasing and measuring of 21 categories.
(1)(2)
Implementation of Some Green PurchasingMEASURING Their Own Green Purchasing Rate
ItemsGPPln(Population)ln(SFS)NGPPln(Population)ln(SFS)N
Paper Products1.74 ***
(0.35)
0.05
(0.24)
1.15 ***
(0.34)
16020.58 ***
(0.15)
0.26
(0.21)
−0.11
(0.26)
1335
Stationery1.70 ***
(0.28)
0.34
(0.22)
0.54 *
(0.30)
15981.00 ***
(0.15)
0.10
(0.22)
0.14
(0.27)
1238
Cars0.80 ***
(0.18)
0.20
(0.19)
0.61 **
(0.26)
15900.51 ***
(0.15)
−0.00
(0.25)
0.20
(0.30)
1020
Lighting Equipment0.81 ***
(0.17)
0.30
(0.19)
0.39
(0.25)
15950.92 ***
(0.16)
0.18
(0.26)
−0.15
(0.32)
994
Office Equipment1.05 ***
(0.17)
0.27
(0.20)
0.54 **
(0.26)
15851.43 ***
(0.18)
−0.11
(0.30)
0.25
(0.37)
933
Office Furniture0.90 ***
(0.16)
0.38 *
(0.20)
0.40
(0.26)
15921.35 ***
(0.18)
−0.08
(0.32)
0.39
(0.39)
916
Imaging Equipment0.92 ***
(0.16)
0.24
(0.19)
0.50 **
(0.25)
15831.24 ***
(0.19)
−0.15
(0.32)
0.35
(0.39)
903
Electronic Devices0.92 ***
(0.16)
0.24
(0.19)
0.52 **
(0.25)
15781.37 ***
(0.19)
−0.05
(0.33)
0.27
(0.40)
854
Uniforms1.01 ***
(0.17)
0.37 *
(0.20)
0.53 **
(0.26)
15821.70 ***
(0.22)
−0.40
(0.39)
0.65
(0.47)
867
Work Gloves0.88 ***
(0.16)
0.32
(0.20)
0.43 *
(0.26)
15851.02 ***
(0.18)
0.57 *
(0.34)
−0.25
(0.41)
777
Home Appliances0.71 ***
(0.15)
0.08
(0.19)
0.73 ***
(0.25)
15851.23 ***
(0.21)
−0.44
(0.38)
0.95 **
(0.46)
772
Fire Extinguishers0.63 ***
(0.15)
0.28
(0.18)
0.57 **
(0.26)
15791.10 ***
(0.21)
0.10
(0.37)
0.10
(0.45)
758
Emergency Supplies0.41 ***
(0.15)
0.15
(0.19)
0.42 *
(0.24)
15821.44 ***
(0.25)
−0.35
(0.40)
0.46
(0.50)
719
Public Works0.17
(0.14)
0.03
(0.18)
0.59 **
(0.24)
15850.95 ***
(0.27)
−0.19
(0.42)
0.13
(0.53)
676
Other Public Services0.30 **
(0.14)
0.22
(0.19)
0.36
(0.24)
15801.42 ***
(0.28)
−0.87 *
(0.47)
1.13 **
(0.58)
652
Air Conditioners0.31 **
(0.15)
0.10
(0.20)
0.71 ***
(0.25)
15781.07 ***
(0.23)
0.25
(0.43)
0.09
(0.51)
701
Other Equipment0.13
(0.14)
0.24
(0.19)
0.34
(0.25)
15741.09 ***
(0.32)
−0.63
(0.50)
0.47
(0.63)
533
Other Fiber Products0.38 **
(0.15)
0.25
(0.20)
0.52 **
(0.26)
15731.68 ***
(0.27)
−0.73
(0.49)
1.19 **
(0.60)
659
Bedclothes0.45 ***
(0.15)
−0.05
(0.21)
0.94 ***
(0.27)
15681.79 ***
(0.32)
−0.69
(0.57)
1.37 **
(0.69)
503
Water Heaters0.06
(0.15)
−0.02
(0.20)
0.78 ***
(0.26)
15671.79 ***
(0.33)
−0.97 *
(0.54)
1.48 **
(0.68)
454
Mobile Phones−0.09
(0.15)
0.03
(0.21)
0.68 ***
(0.26)
15651.78 ***
(0.38)
−1.22 **
(0.57)
1.82 **
(0.71)
424
Note: all models contain a GPP dummy, prefecture dummies, natural log of population and standard financial scale. SFS denotes the standard financial scale. For definition of SFS, please see lines 191 to 194 of page 4. Standard errors in parentheses. The number of the observations represents the valid responses to each question and valid sample sizes to estimate the model. * p < 0.1, ** p < 0.05, *** p< 0.01.

References

  1. European Commission. Buying Green! A Handbook on Green Public Procurement, 3rd ed.; European Commission: Brussels, Belgium, 2016; ISBN 978-92-79-56848-0. [Google Scholar]
  2. Grandia, J. Finding the missing link: Examining the mediating role of sustainable public procurement behaviour. J. Clean. Prod. 2016, 124, 183–190. [Google Scholar] [CrossRef]
  3. Warner, K.E.; Ryall, C. Greener purchasing activities within UK local authorities. Eco Manag. Audit. 2001, 45, 36–45. [Google Scholar] [CrossRef]
  4. Preuss, L. Buying into our future: Sustainability initiatives in local government procurement. Int. J. Innov. Manag. 2007, 11, 515–537. [Google Scholar] [CrossRef]
  5. Geng, Y.; Doberstein, B. Greening government procurement in developing countries: Building capacity in China. J. Environ. Manag. 2008, 88, 932–938. [Google Scholar] [CrossRef]
  6. Walker, H.; Brammer, S. Sustainable procurement in the United Kingdom public sector. Supply Chain Manag. An Int. J. 2009, 14, 128–137. [Google Scholar] [CrossRef] [Green Version]
  7. Brammer, S.; Walker, H. Sustainable procurement in the public sector: An international comparative study. Int. J. Oper. Prod. Manag. 2011, 31, 452–476. [Google Scholar] [CrossRef]
  8. Hoejmose, S.U.; Adrien-Kirby, A.J. Socially and environmentally responsible procurement: A literature review and future research agenda of a managerial issue in the 21st century. J. Purch. Supply Manag. 2012, 18, 232–242. [Google Scholar] [CrossRef]
  9. Ahsan, K.; Rahman, S. Green public procurement implementation challenges in Australian public healthcare sector. J. Clean. Prod. 2017, 152, 181–197. [Google Scholar] [CrossRef]
  10. Michelsen, O.; de Boer, L. Green procurement in Norway; a survey of practices at the municipal and county level. J. Environ. Manag. 2009, 91, 160–167. [Google Scholar] [CrossRef] [PubMed]
  11. Testa, F.; Iraldo, F.; Frey, M.; Daddi, T. What factors influence the uptake of GPP (Green Public Procurement) practices? New evidence from an Italian survey. Ecol. Econ. 2012, 82, 88–96. [Google Scholar] [CrossRef] [Green Version]
  12. Testa, F.; Annunziata, E.; Iraldo, F.; Frey, M. Drawbacks and opportunities of green public procurement: An effective tool for sustainable production. J. Clean. Prod. 2016, 112, 1893–1900. [Google Scholar] [CrossRef]
  13. Prier, E.; Schwerin, E.; McCue, C.P. Implementation of sustainable public procurement practices and policies: A sorting framework. J. Public Procure. 2016, 16, 312–346. [Google Scholar] [CrossRef]
  14. Carter, C.R.; Jennings, M.M. The role of purchasing in corporate social responsibility: A structural equation analysis. J. Bus. Logist. 2004, 25, 145–186. [Google Scholar] [CrossRef]
  15. Zhu, Q.; Geng, Y.; Sarkis, J. Motivating green public procurement in China: An individual level perspective. J Environ. Manag. 2013, 126, 85–95. [Google Scholar] [CrossRef] [PubMed]
  16. Blome, C.; Hollos, D.; Paulraj, A. Green procurement and green supplier development: Antecedents and effects on supplier performance. Int. J. Prod. Res. 2014, 52, 32–49. [Google Scholar] [CrossRef]
  17. Günther, E.; Scheibe, L. The hurdle analysis. A self-evaluation tool for municipalities to identify, analyse and overcome hurdles to green procurement. Corp. Soc. Responsib. Environ. Manag. 2006, 13, 61–77. [Google Scholar] [CrossRef]
  18. Faith-Ell, C.; Balfors, B.; Folkeson, L. The application of environmental requirements in Swedish road maintenance contracts. J. Clean. Prod. 2006, 14, 163–171. [Google Scholar] [CrossRef]
  19. Parikka-Alhola, K. Promoting environmentally sound furniture by Green Public Procurement. Ecol. Econ. 2008, 68, 472–485. [Google Scholar] [CrossRef]
  20. Igarashi, M.; de Boer, L.; Michelsen, O. Investigating the anatomy of supplier selection in green public procurement. J. Clean. Prod. 2015, 108, 442–450. [Google Scholar] [CrossRef]
  21. Sporrong, J.; Bröchner, J. Public procurement incentives for sustainable design services: Swedish experiences. Archit. Eng. Des. Manag. 2009, 5, 24–35. [Google Scholar] [CrossRef]
  22. Varnäs, A.; Balfors, B.; Faith-Ell, C. Environmental consideration in procurement of construction contracts: Current practice, problems and opportunities in green procurement in the Swedish construction industry. J. Clean. Prod. 2009, 17, 1214–1222. [Google Scholar] [CrossRef]
  23. Braulio-Gonzalo, B.; Bovea, M.D. Criteria analysis of green public procurement in the Spanish furniture sector. J. Clean. Prod. 2020, 258, 120704. [Google Scholar] [CrossRef]
  24. Cheng, W.; Appolloni, A.; D’Amato, A.; Qinghua Zhu, Q. Green Public Procurement, missing concepts and future trends—A critical review. J. Clean. Prod. 2018, 176, 770–784. [Google Scholar] [CrossRef]
  25. Da Ponte, M.; Foley, M.; Cho, C.H. Assessing the degree of sustainability integration in Canadian public sector procurement. Sustainability 2020, 12, 5550. [Google Scholar] [CrossRef]
  26. United Nations Environment Programme. Global Review of Sustainable Public Procurement 2017. Available online: https://www.unenvironment.org/resources/report/2017-global-review-sustainable-public-procurement (accessed on 15 April 2020).
  27. Darnall, N.; Stritch, J.M.; Bretschneider, S.; Hsueh, L.; Duscha, M.; Iles, J.; No, W.; Suarez, J.; Burwell, C. Advancing Green Purchasing in Local Governments; Arizona State University, Center for Organization Research and Design, Sustainable Purchasing Research Initiative: Phoenix, AZ, USA, 2017. [Google Scholar]
  28. Darnall, N.; Arimura, T.H.; Miyamoto, T.; Stritch, J.M.; Bretschneider, S.; Hsueh, L. Advancing Green Purchasing in Japanese Municipalities; Arizona State University, Center for Organization Research and Design, Sustainable Purchasing Research Initiative: Phoenix, AZ, USA; Waseda University, Research Institute for Environmental Economics and Management: Tokyo, Japan, 2018. [Google Scholar]
  29. Leal, A.R.; Pérez-Castillo, D.; Husted, B.W.; Amorós, E. Advancing Green Purchasing in Mexican Municipalities; Arizona State University, Center for Organization Research and Design, Sustainable Purchasing Research Initiative: Phoenix, AZ, USA; Tecnológico de Monterrey, EGADE Business School: San Pedro Garza García, Mexico, 2019. [Google Scholar]
  30. Cities Designated by Government Ordinance of Japan. Wikipedia. Available online: https://ja.wikipedia.org/wiki/%E6%94%BF%E4%BB%A4%E6%8C%87%E5%AE%9A%E9%83%BD%E5%B8%82 (accessed on 27 October 2020).
  31. Thomson, J.; Jackson, T. Sustainable procurement in practice: Lessons from local government. J. Environ. Plan. Manag. 2007, 50, 421–444. [Google Scholar] [CrossRef]
  32. Ministry of the Environment. Achievements of Green Purchasing by the National Institutions and Their Environmental Impact Reduction Effects, etc. (In Japanese). Available online: https://www.env.go.jp/policy/hozen/green/g-law/jisseki/reduce-effect_h29.pdf (accessed on 27 October 2020).
  33. Ministry of the Environment. Act on Promoting Green Procurement. Available online: https://www.env.go.jp/policy/hozen/green/attach/gpp%20pamphlet_eng.pdf (accessed on 15 April 2020).
  34. Promotion of Green Purchasing. Webpage of City of Yokohama. (In Japanese). Available online: https://www.city.yokohama.lg.jp/kurashi/machizukuri-kankyo/ondanka/etc/shiyakusho/green.html (accessed on 15 April 2020).
  35. Von Oelreich, K.; Philip, M. Green Public Procurement—A Tool for Achieving National Environmental Quality Objectives; Swedish Environmental Protection Agency: Stockholm, Sweden, 2013.
  36. IR document by Budget Division. Bureau of Finance Tokyo Metropolitan Government. 2019. Available online: https://www.zaimu.metro.tokyo.lg.jp/bond/en/ir_library/ir/ir_document2019_Nov.pdf (accessed on 16 April 2020).
  37. Handfield, R.; Sroufe, R.; Walton, S. Integrating environmental management and supply chain strategies. Bus. Strategy Environ. 2005, 14, 1–19. [Google Scholar] [CrossRef]
  38. Kjöllerström, M. Public Procurement as a tool for promoting more sustainable consumption and production patterns. Sustain. Dev. Innov. Briefs. 2008, 1, 1–12. [Google Scholar]
  39. Giunipero, L.; Handfield, R.B.; Eltantawy, R. Supply management’s evolution: Key skill sets for the manager of the future. Int. J. Oper Prod. Manag. 2006, 26, 702–714. [Google Scholar] [CrossRef]
  40. Sarkis, J.; Gonzalez-Torre, P.; Adenso-Diaz, B. Stakeholder pressure and the adoption of environmental practices: The mediating effect of training. J. Oper. Manag. 2010, 28, 163–176. [Google Scholar] [CrossRef]
  41. Tassabehji, R.; Moorhouse, A. The changing role of procurement: Developing professional effectiveness. J. Purch. Supply Manag. 2008, 14, 55–68. [Google Scholar] [CrossRef]
  42. Mosgaard, M.; Riisgaard, H.; Huulgaard, R.D. Greening non-product-related procurement—When policy meets reality. J. Clean. Prod. 2013, 39, 137–145. [Google Scholar] [CrossRef]
  43. Grandia, J.; Voncken, D. Sustainable Public Procurement: The Impact of Ability, Motivation, and Opportunity on the Implementation of Different Types of Sustainable Public Procurement. Sustainability 2019, 11, 5215. [Google Scholar] [CrossRef] [Green Version]
  44. Ogunsanya, O.A.; Aigbavboa, C.O.; Thwala, D.W.; Edwards, D.J. Barriers to sustainable procurement in the Nigerian construction industry: An exploratory factor analysis. Int, J. Constr. Manag. 2019. [Google Scholar] [CrossRef]
  45. Mendoza Jiménez, J.; Hernández López, M.; Franco Escobar, S.E. Sustainable Public Procurement: From Law to Practice. Sustainability 2019, 11, 6388. [Google Scholar] [CrossRef] [Green Version]
  46. Min, H.; Galle, W.P. Green purchasing practices of US firms. Int. J. Oper. Prod. Manag. 2001, 21, 1222–1238. [Google Scholar] [CrossRef]
  47. Stritch, J.M.; Bretschneider, S.; Darnall, N.; Hsueh, L.; Chen, Y. Sustainability Policy Objectives, Centralized Decision Making, and Efficiency in Public Procurement Processes in U.S. Local Governments. Sustainability 2020, 12, 6934. [Google Scholar] [CrossRef]
  48. AlNuaimi, B.K.; Khan, M. Public-sector green procurement in the United Arab Emirates: Innovation capability commitment to change. J. Clean. Prod. 2019, 233, 482–489. [Google Scholar] [CrossRef]
  49. Glas, A.H.; Schaupp, M.; Essig, M. An organizational perspective on the implementation of strategic goals in public procurement. J. Public Procure. 2017, 17, 572–605. [Google Scholar] [CrossRef]
  50. Oruezabala, G.; Rico, J.-C. The impact of sustainable public procurement on supplier management—The case of French public hospitals. Ind. Mark. Manag. 2012, 41, 573–580. [Google Scholar] [CrossRef]
  51. Rahman, S.; Subramanian, N. Factors for implementing end-of-life computer recycling operations in reverse supply chains. Int. J. Prod. Econ. 2012, 140, 239–248. [Google Scholar] [CrossRef]
  52. Boros, A.; Fogarassy, C. Relationship between Corporate Sustainability and Compliance with State-Owned Enterprises in Central-Europe: A Case Study from Hungary. Sustainability 2019, 11, 5653. [Google Scholar] [CrossRef] [Green Version]
  53. Davies, A. The Law of Green and Social Procurement in Europe; Sweet MaxwellL Ltd.: North Way, UK, 2011. [Google Scholar]
  54. Kaiser, B.; Eagan, P.D.; Shaner, H. Solutions to health care waste: Life-cycle thinking and "green" purchasing. Environ. Health Perspect. 2001, 109, 205. [Google Scholar] [CrossRef]
  55. Worthington, I. Corporate perceptions of the business case for supplier diversity: How socially responsible purchasing can ‘pay’. J. Bus. Ethics 2009, 90, 47–60. [Google Scholar] [CrossRef]
  56. Seuring, S.; Müller, M. From a literature review to a conceptual framework for sustainable supply chain management. J. Clean. Prod. 2008, 16, 1699–1710. [Google Scholar] [CrossRef]
  57. Vluggen, R.; Gelderman, C.J.; Semeijn, J.; van Pelt, M. Sustainable Public Procurement—External Forces and Accountability. Sustainability 2019, 11, 5696. [Google Scholar] [CrossRef] [Green Version]
  58. Vigerstol, K.L.; Aukema, J.E. A comparison of tools for modeling freshwater ecosystem services. J. Environ. Manag. 2011, 92, 2403–2409. [Google Scholar] [CrossRef] [PubMed]
  59. Gualandris, J.; Kalchschmidt, M. Customer pressure innovativeness: Their role in sustainable supply chain management. J. Purch. Supply Manag. 2014, 20, 92–103. [Google Scholar] [CrossRef]
  60. Lee, S.-Y. Drivers for the participation of small and medium-sized suppliers in green supply chain initiatives. Supply Chain Manag. J. 2008, 13, 185–198. [Google Scholar] [CrossRef]
  61. Seuring, S. A review of modeling approaches for sustainable supply chain management. Decis. Support Syst. 2013, 54, 1513–1520. [Google Scholar] [CrossRef]
  62. Vachon, S.; Klassen, R.D. Extending green practices across the supply chain: The impact of upstream downstream integration. Int. J. Oper. Prod. Manag. 2006, 26, 795–821. [Google Scholar] [CrossRef]
  63. Bala, A.; Munoz, P.; Rieradevall, J.; Ysern, P. Experiences with greening suppliers the universitat autonoma de Barcelona. J. Clean. Prod. 2008, 16, 1610–1619. [Google Scholar] [CrossRef]
  64. Xu, S.; Chu, C.; Ju, M.; Shao, C. System Establishment and Method Application for Quantitatively Evaluating the Green Degree of the Products in Green Public Procurement. Sustainability 2016, 8, 941. [Google Scholar] [CrossRef] [Green Version]
  65. Soto, T.; Escrig, T.; Serrano-Lanzarote, B.; Matarredona Desantes, N. An Approach to Environmental Criteria in Public Procurement for the Renovation of Buildings in Spain. Sustainability 2020, 12, 7590. [Google Scholar] [CrossRef]
  66. Montalbán-Domingo, L.; Aguilar-Morocho, M.; García-Segura, T.; Pellicer, E. Study of Social and Environmental Needs for the Selection of Sustainable Criteria in the Procurement of Public Works. Sustainability 2020, 12, 7756. [Google Scholar] [CrossRef]
  67. Lam, T.Y.M. A sustainable procurement approach for selection of construction consultants in property and facilities management. Facilities 2019, 38, 98–113. [Google Scholar] [CrossRef]
  68. Laosirihongthong, T.; Samaranayake, P.; Nagalingam, S. A holistic approach to supplier evaluation and order allocation towards sustainable procurement. Benchmarking 2019, 26, 2543–2573. [Google Scholar] [CrossRef]
  69. Sparrevik, M.; Wangen, H.F.; Fet, A.M.; De Boer, L. Green public procurement—A case study of an innovative building project in Norway. J. Clean. Prod. 2018, 188, 879–887. [Google Scholar] [CrossRef]
  70. De Filippo, D.; Sandoval-Hamon, L.A.; Casani, F.; Sanz-Casado, E. Spanish Universities ’Sustainability Performance and Sustainability-Related R&D + I. Sustainability 2019, 11, 5570. [Google Scholar]
  71. Rietbergen, M.G.; Blok, K. Assessing the potential impact of the CO2 Performance Ladder on the reduction of carbon dioxide emissions in The Netherlands. J. Clean. Prod. 2013, 52, 33–45. [Google Scholar] [CrossRef]
  72. Simcoe, T.; Toffel, M.W. Government green procurement spillovers: Evidence from municipal building policies in California. J. Environ. Econ. Manag. 2014, 68, 411–434. [Google Scholar] [CrossRef] [Green Version]
  73. Brusselaers, J.; Van Huylenbroeck, G.; Buysse, J. Green Public Procurement of Certified Wood: Spatial Leverage Effect and Welfare Implications. Ecol. Econ. 2017, 135, 91–102. [Google Scholar] [CrossRef]
  74. Islam, M.M.; Turki, A.; Murad, M.W.; Karim, A. Do Sustainable Procurement Practices Improve Organizational Performance? Sustainability 2017, 9, 2281. [Google Scholar] [CrossRef] [Green Version]
  75. EU Commission. Public Procurement for a Circular Economy: Good Practice and Guidance. Available online: http://ec.europa.eu/environment/gpp/pdf/Public_procurement_circular_economy_brochure.pdf (accessed on 12 September 2020).
  76. Lăzăroiu, G.; Ionescu, L.; Uță, C.; Hurloiu, I.; Andronie, M.; Dijmărescu, I. Environmentally Responsible Behavior and Sustainability Policy Adoption in Green Public Procurement. Sustainability 2020, 12, 2110. [Google Scholar] [CrossRef] [Green Version]
  77. Witjes, S.; Lozano, R. Towards a more circular economy: Proposing a framework linking sustainable public procurement and sustainable business models. Resour. Conserv. Recycl. 2016, 112, 37–44. [Google Scholar] [CrossRef] [Green Version]
  78. Alhola, K.; Ryding, S.-O.; Salmenperä, H.; Busch, N.J. Exploiting the potential of public procurement: Opportunities for circular economy. J. Ind. Ecol. 2019, 23, 96–109. [Google Scholar] [CrossRef] [Green Version]
  79. Sönnichsen, S.D.; Clement, J. Review of green and sustainable public procurement: Towards circular public procurement. J. Clean. Prod. 2020, 245, 118901. [Google Scholar] [CrossRef]
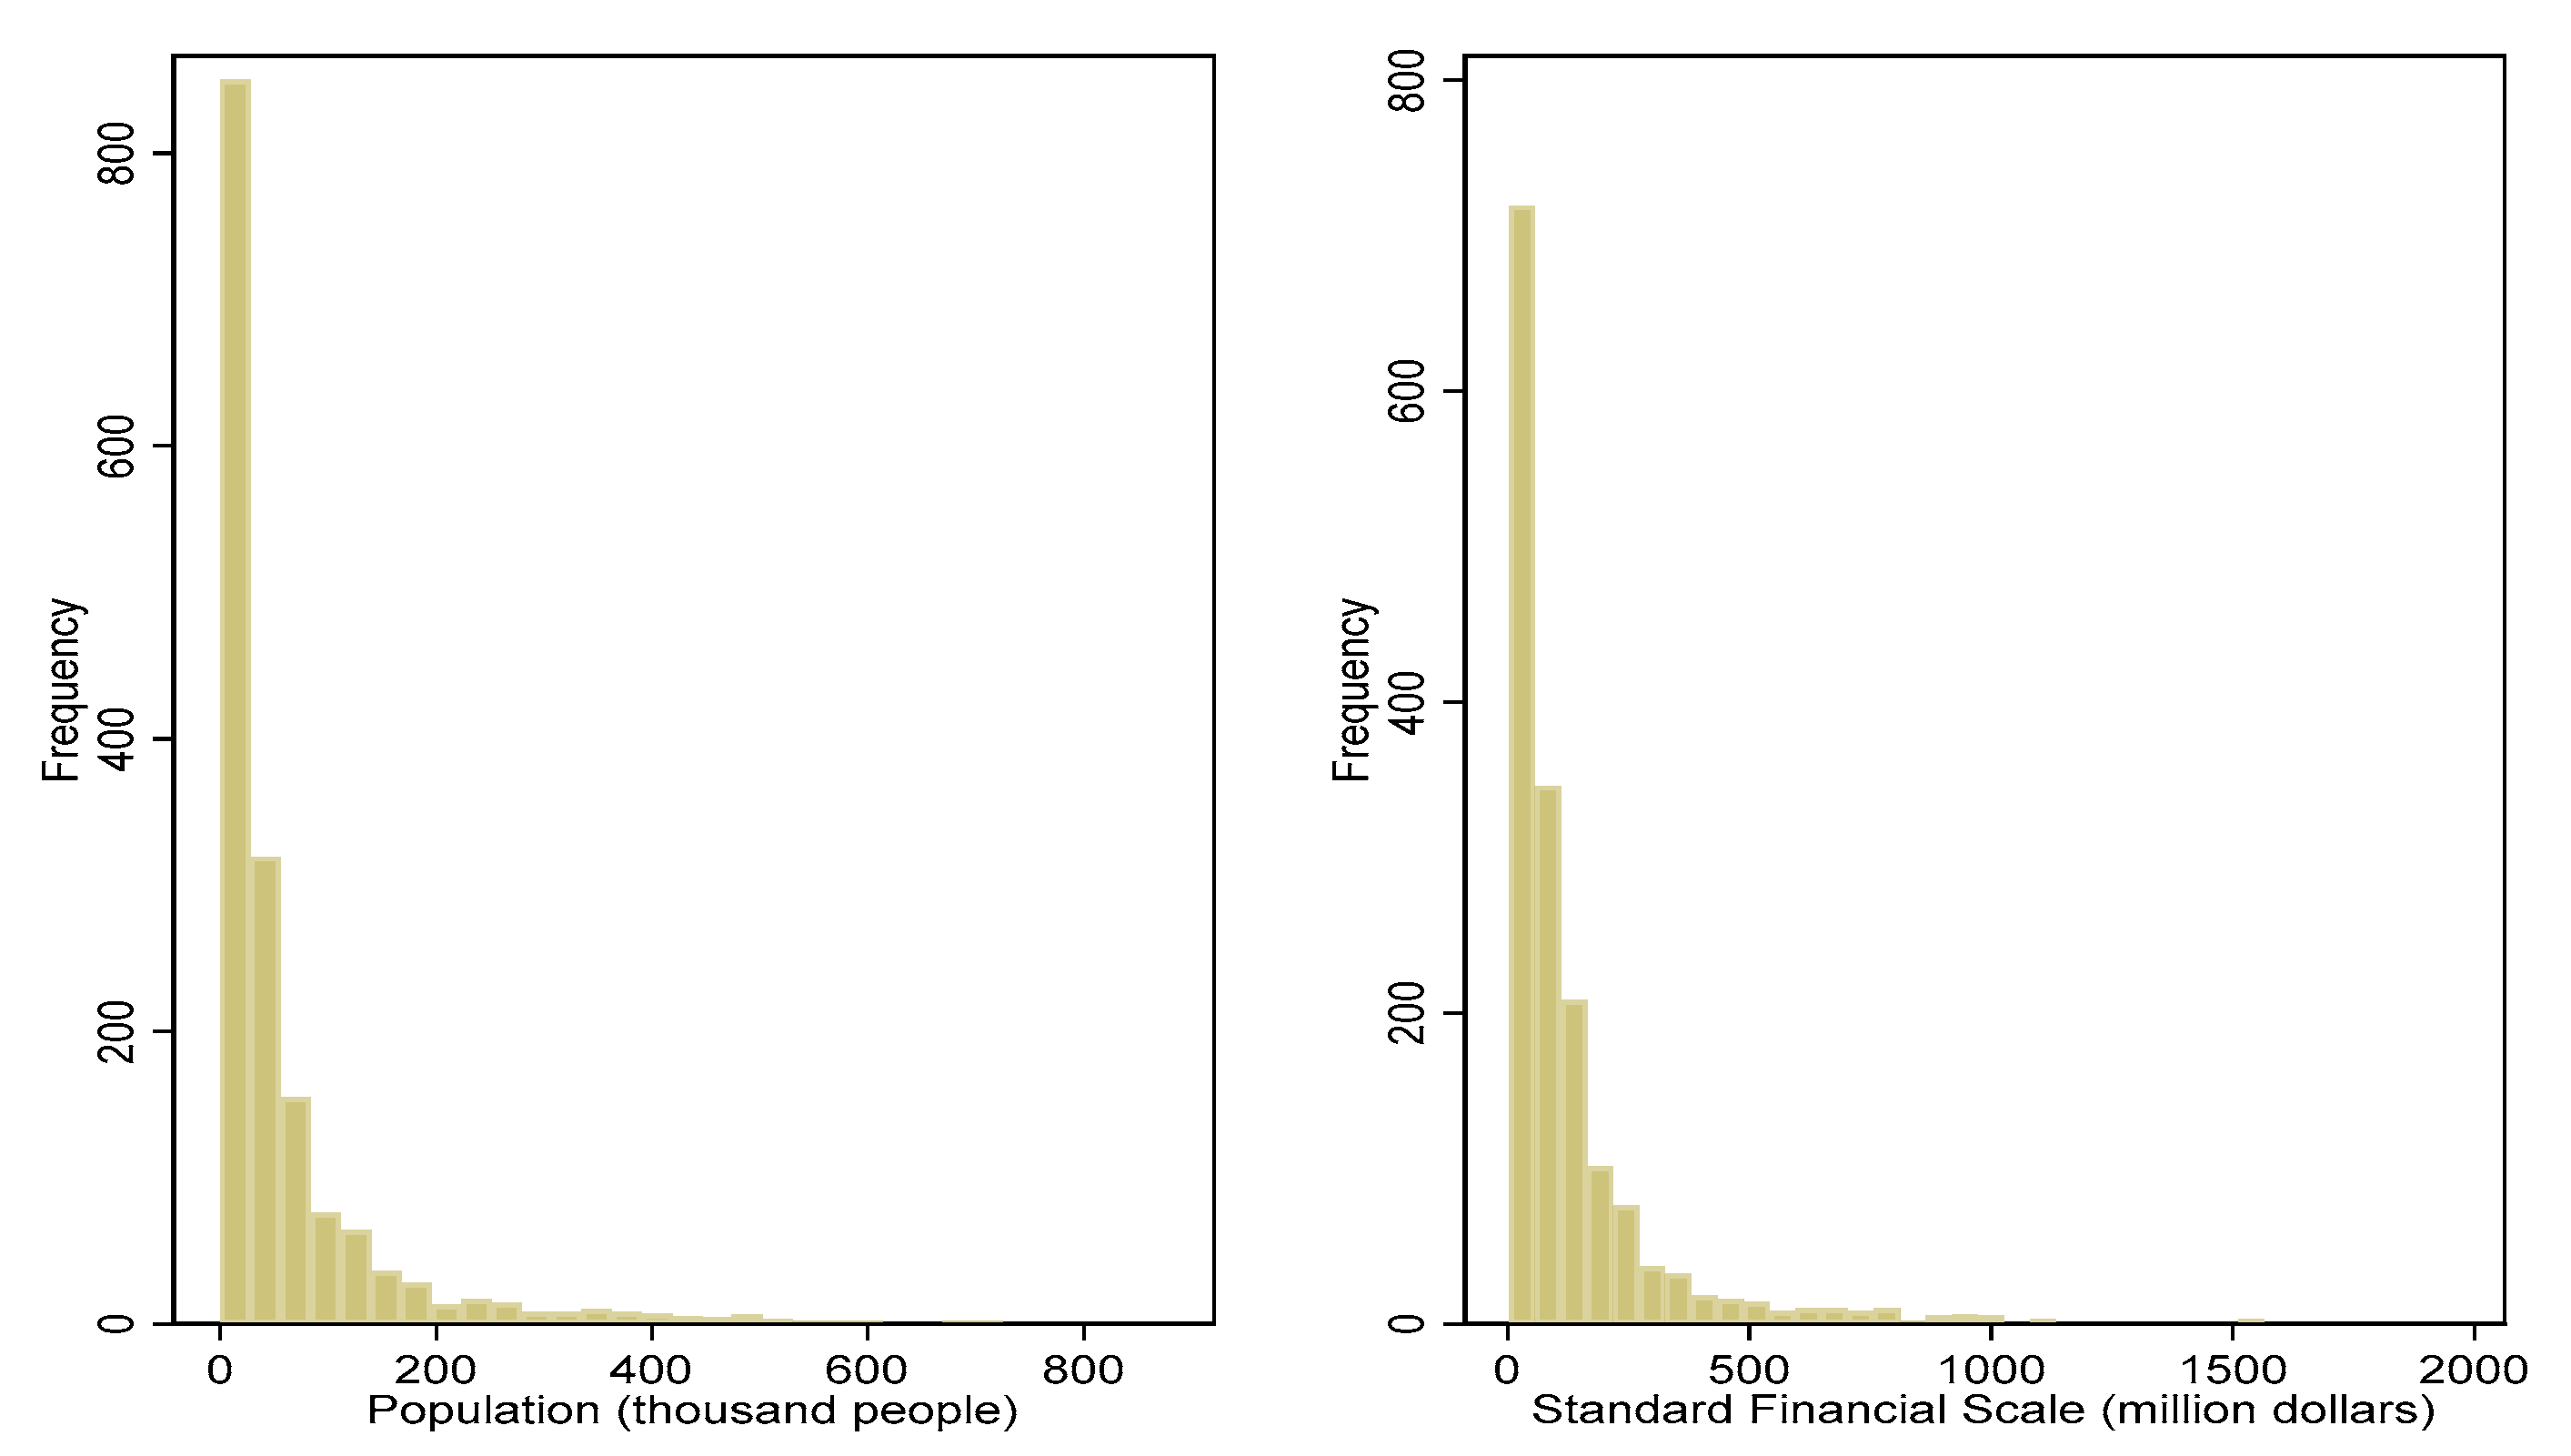
Figure 1. The distributions of population and standard financial scale.
Sustainability 12 08979 g001
Figure 2. Box plots of population and standard financial scale of the municipalities with and without green purchasing policies.
Sustainability 12 08979 g002
Figure 3. Green purchasing rate of Japanese municipalities by category.
Sustainability 12 08979 g003
Figure 4. The share of municipalities measuring their green purchasing rate.
Sustainability 12 08979 g004
Figure 5. Share of municipalities implementing green purchasing with/without a green purchasing policy (GPP).
Sustainability 12 08979 g005
Figure 6. Share of municipalities measuring their green purchasing rate.
Sustainability 12 08979 g006
Table 1. Average partial effects (APEs) of green purchasing implementation and measurement of 21 categories.
(1)(2)
Implementation of Green PurchasingMunicipality Measuring Its Own Green Purchasing Rate
ItemsAPENAPEN
Paper Products0.14 ***
(0.02)
16020.12 ***
(0.03)
1335
Stationery0.19 ***
(0.02)
15980.23 ***
(0.03)
1238
Cars0.14 ***
(0.03)
15900.12 ***
(0.04)
1020
Lighting Equipment0.15 ***
(0.03)
15950.20 ***
(0.04)
994
Office Equipment0.19 ***
(0.03)
15850.28 ***
(0.04)
933
Office Furniture0.17 ***
(0.03)
15920.25 ***
(0.03)
916
Imaging Equipment0.18 ***
(0.03)
15830.22 ***
(0.04)
903
Electronic Devices0.18 ***
(0.03)
15780.26 ***
(0.04)
854
Uniforms0.18 ***
(0.03)
15820.20 ***
(0.04)
867
Work Gloves0.17 ***
(0.03)
15850.28 ***
(0.04)
777
Home Appliances0.14 ***
(0.03)
15850.20 ***
(0.04)
772
Fire Extinguishers0.12 ***
(0.03)
15790.19 ***
(0.04)
758
Emergency Supplies0.09 ***
(0.03)
15820.20 ***
(0.04)
719
Public Works0.04
(0.03)
15850.12 ***
(0.04)
676
Other Public Services0.06 **
(0.03)
15800.17 ***
(0.04)
652
Air Conditioners0.06 **
(0.03)
15780.16 ***
(0.04)
701
Other Equipment0.03
(0.03)
15740.12 ***
(0.04)
533
Other Fiber Products0.08 **
(0.03)
15730.22 ***
(0.04)
659
Bedclothes0.09 ***
(0.03)
15680.23 ***
(0.04)
503
Water Heaters0.01
(0.03)
15670.23 ***
(0.04)
454
Mobile Phones−0.02
(0.03)
15650.21 ***
(0.05)
424
APE denotes the average partial effect of GPPi on corresponding dependent variables for 21 items. Standard errors in parentheses. All the estimations include the natural log of the population, the natural log of the standard financial scale, and prefecture dummies. ** p < 0.05, *** p < 0.01.
Publisher’s Note: MDPI stays neutral with regard to jurisdictional claims in published maps and institutional affiliations.