Data-Driven Detection Methods on Driver’s Pedal Action Intensity Using Triboelectric Nano-Generators


Abstract
1. Introduction
2. Materials and Methods
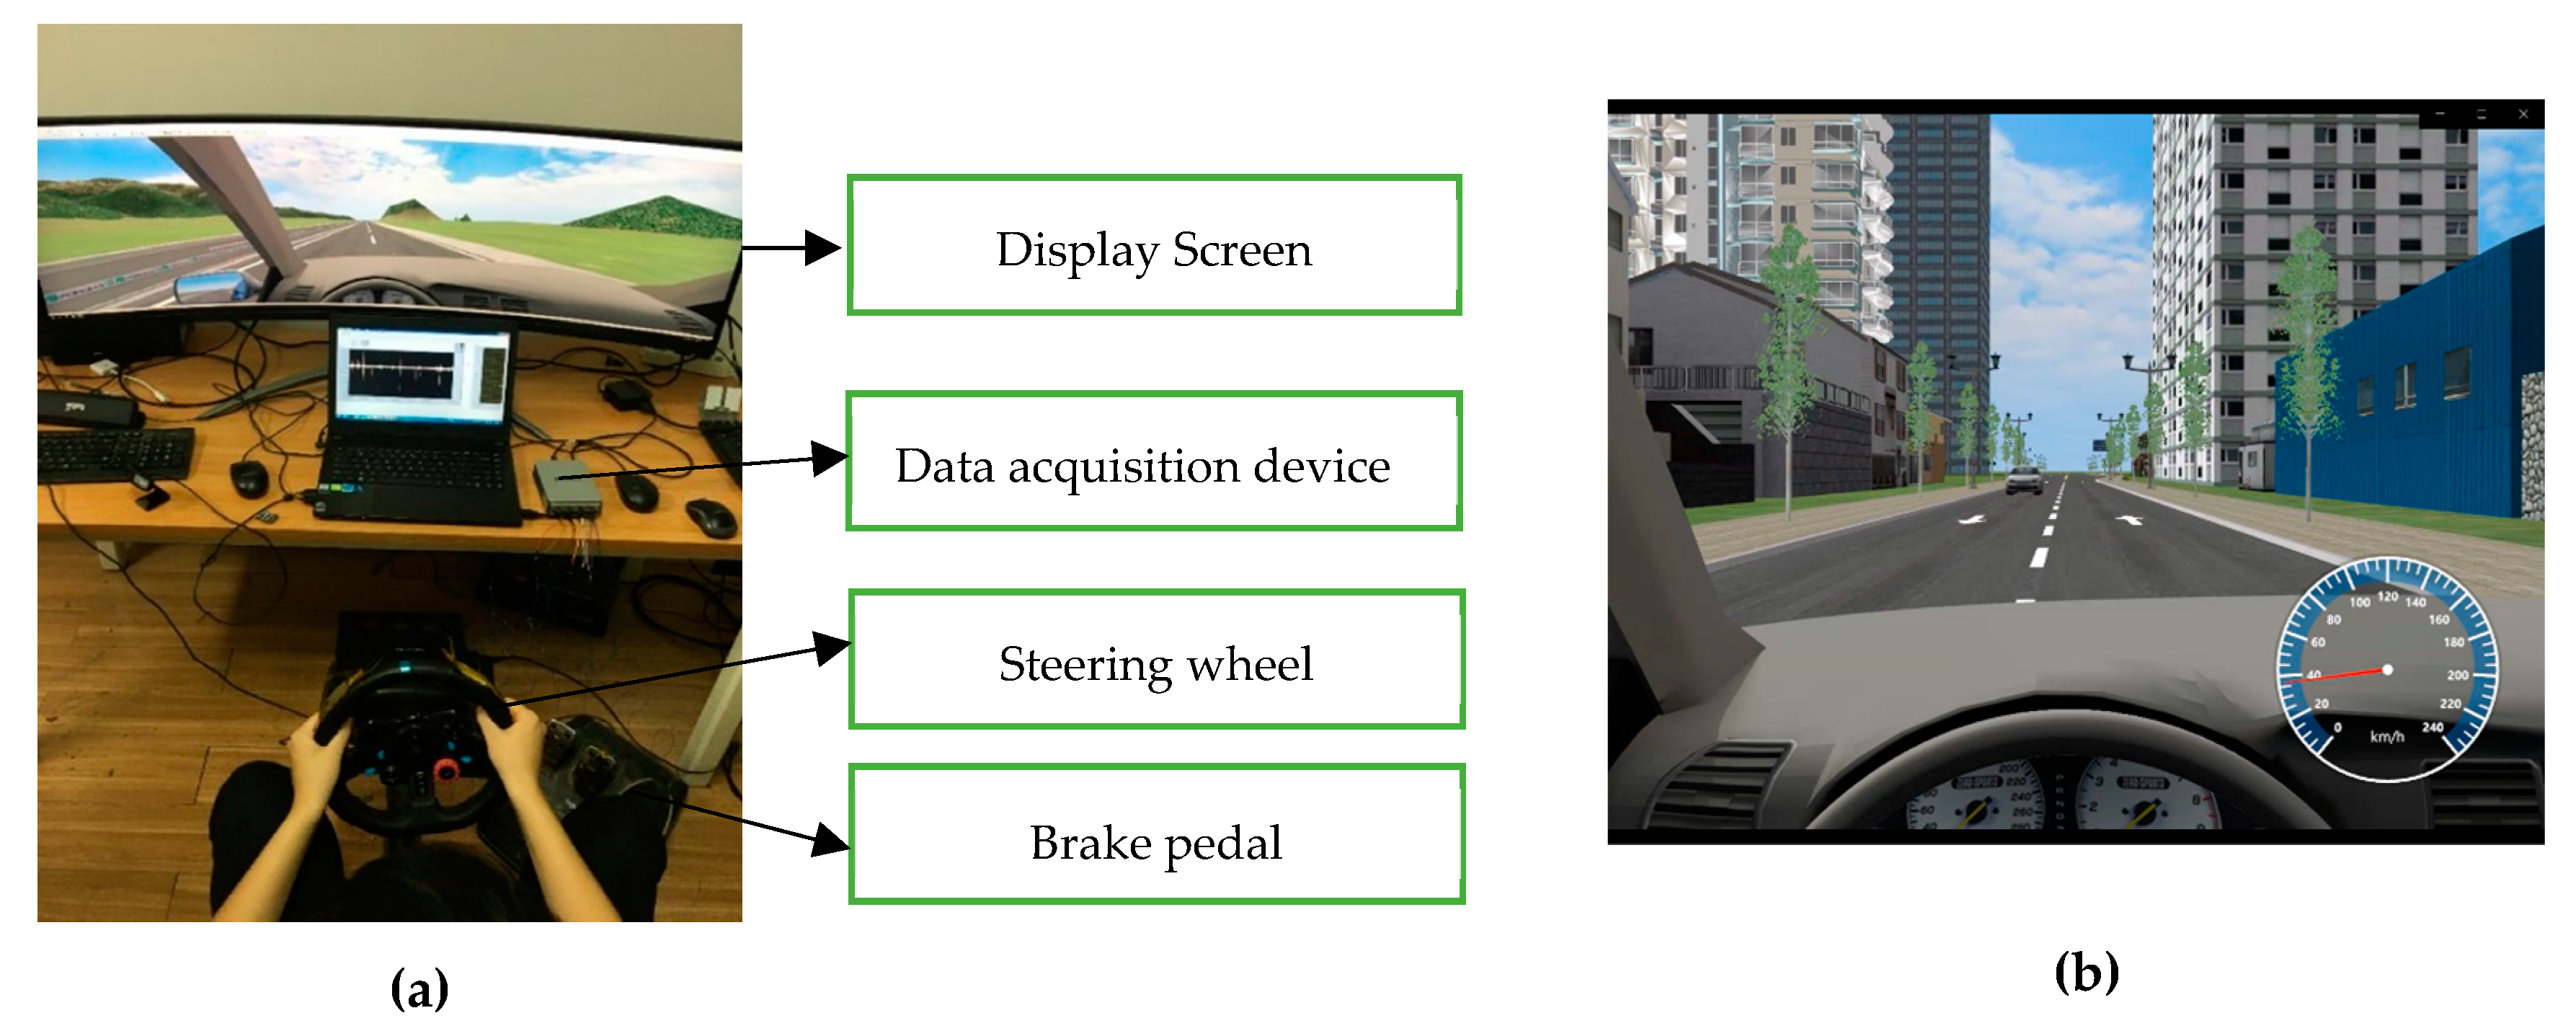
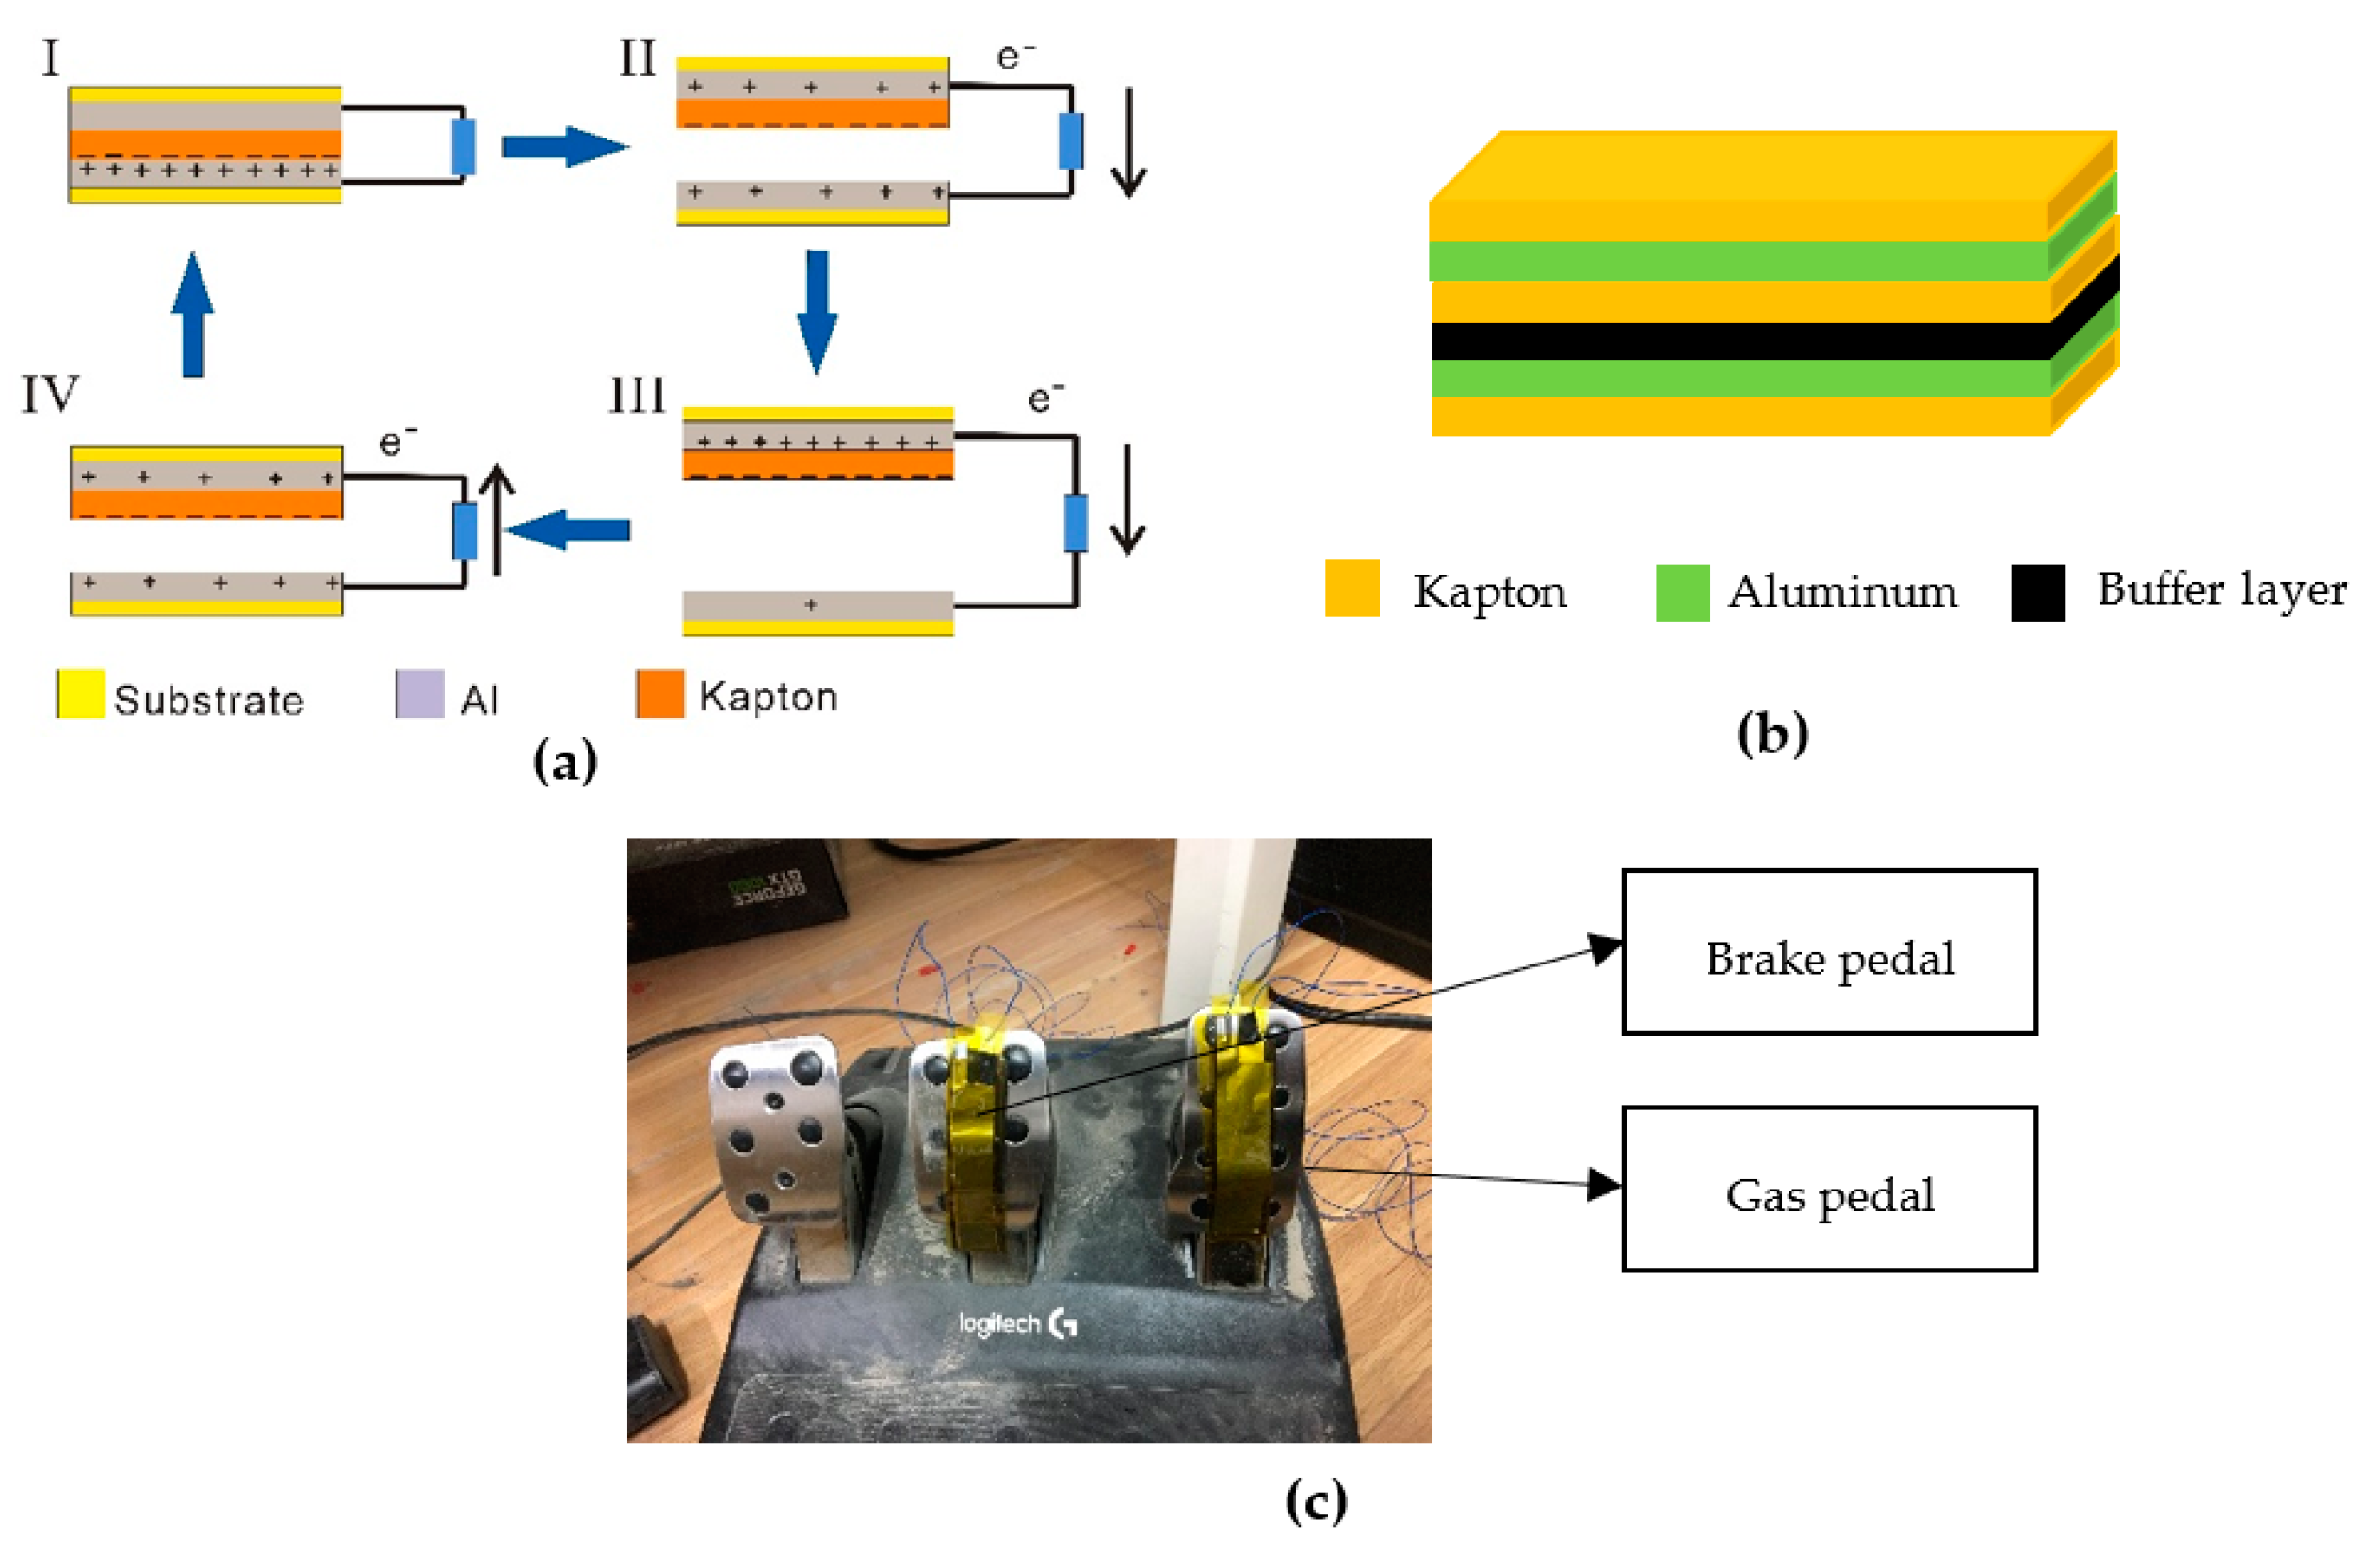
2.1. Apparatus and Participants
2.2. Experiment Design
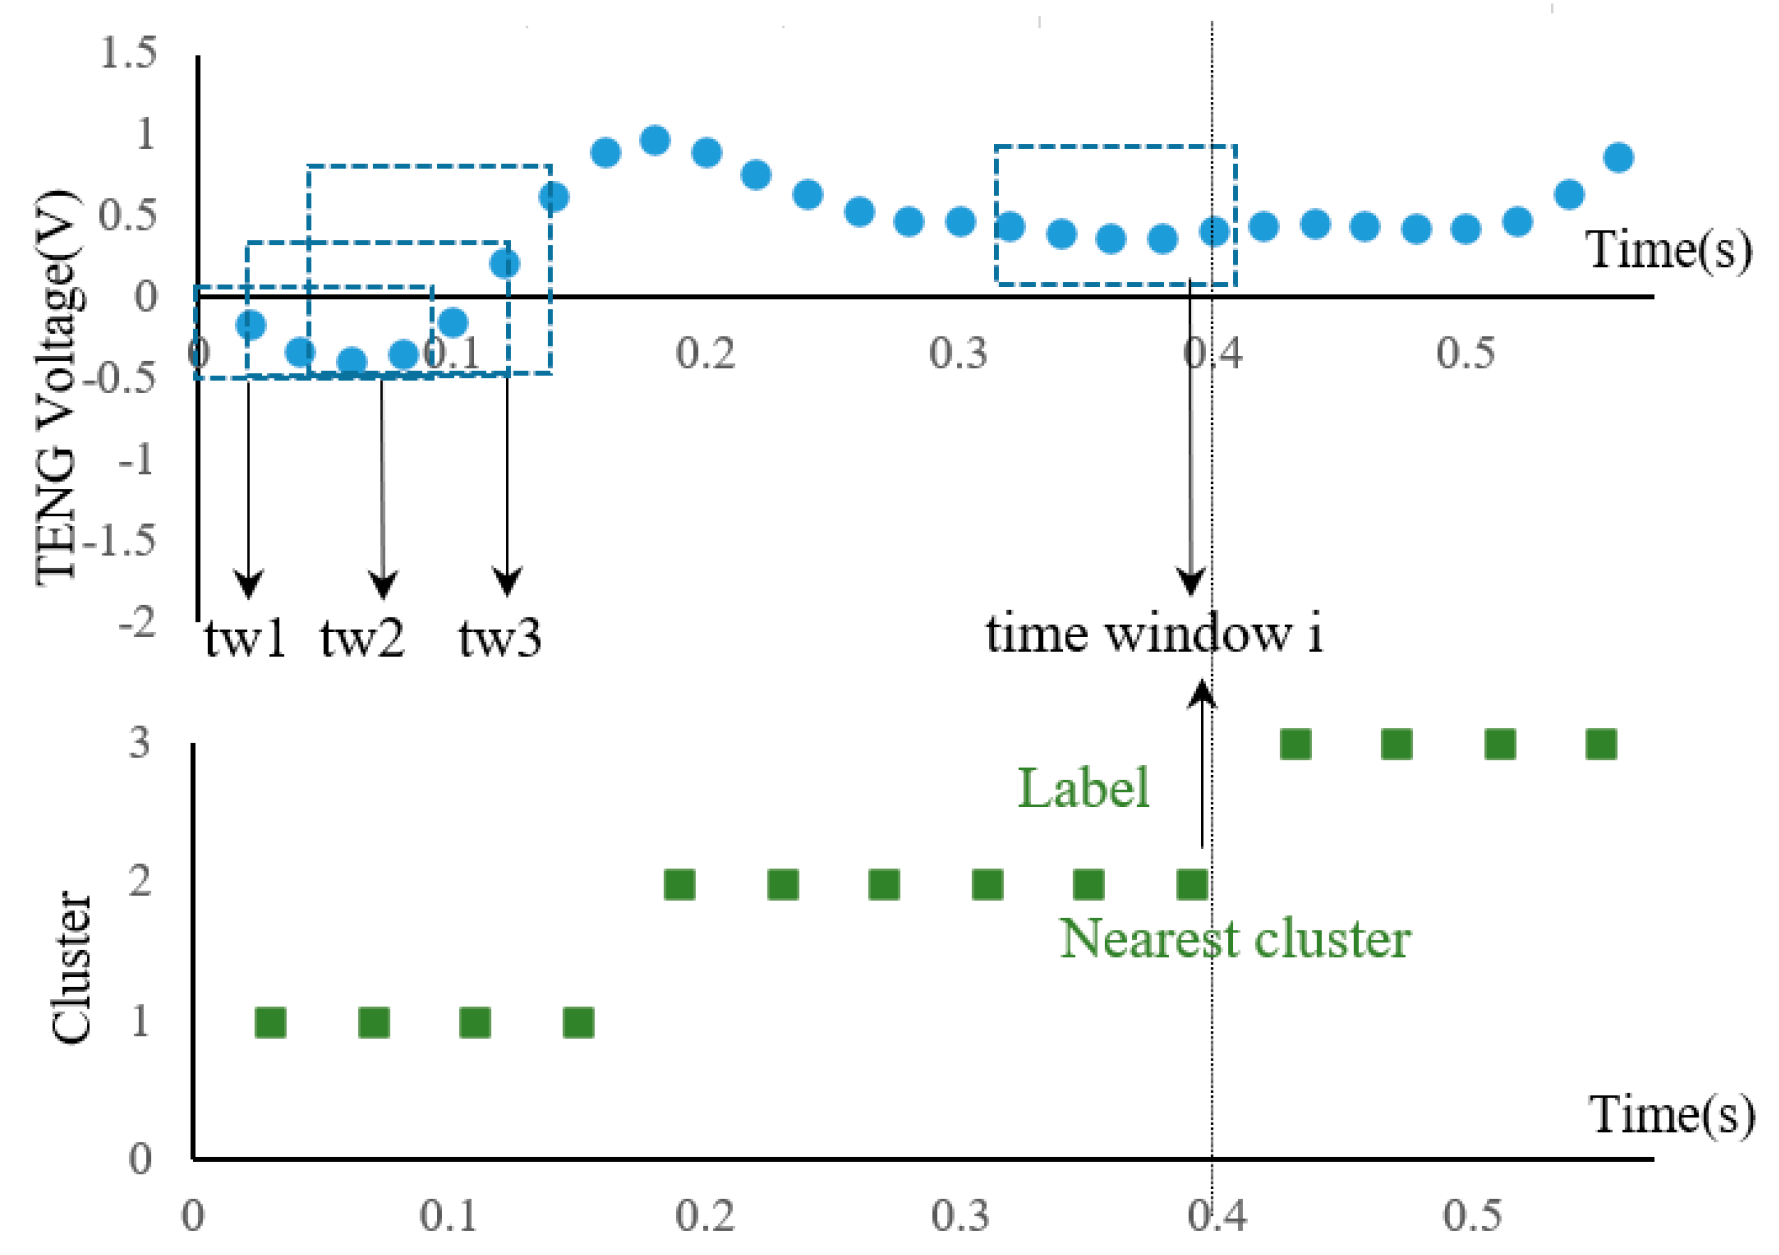
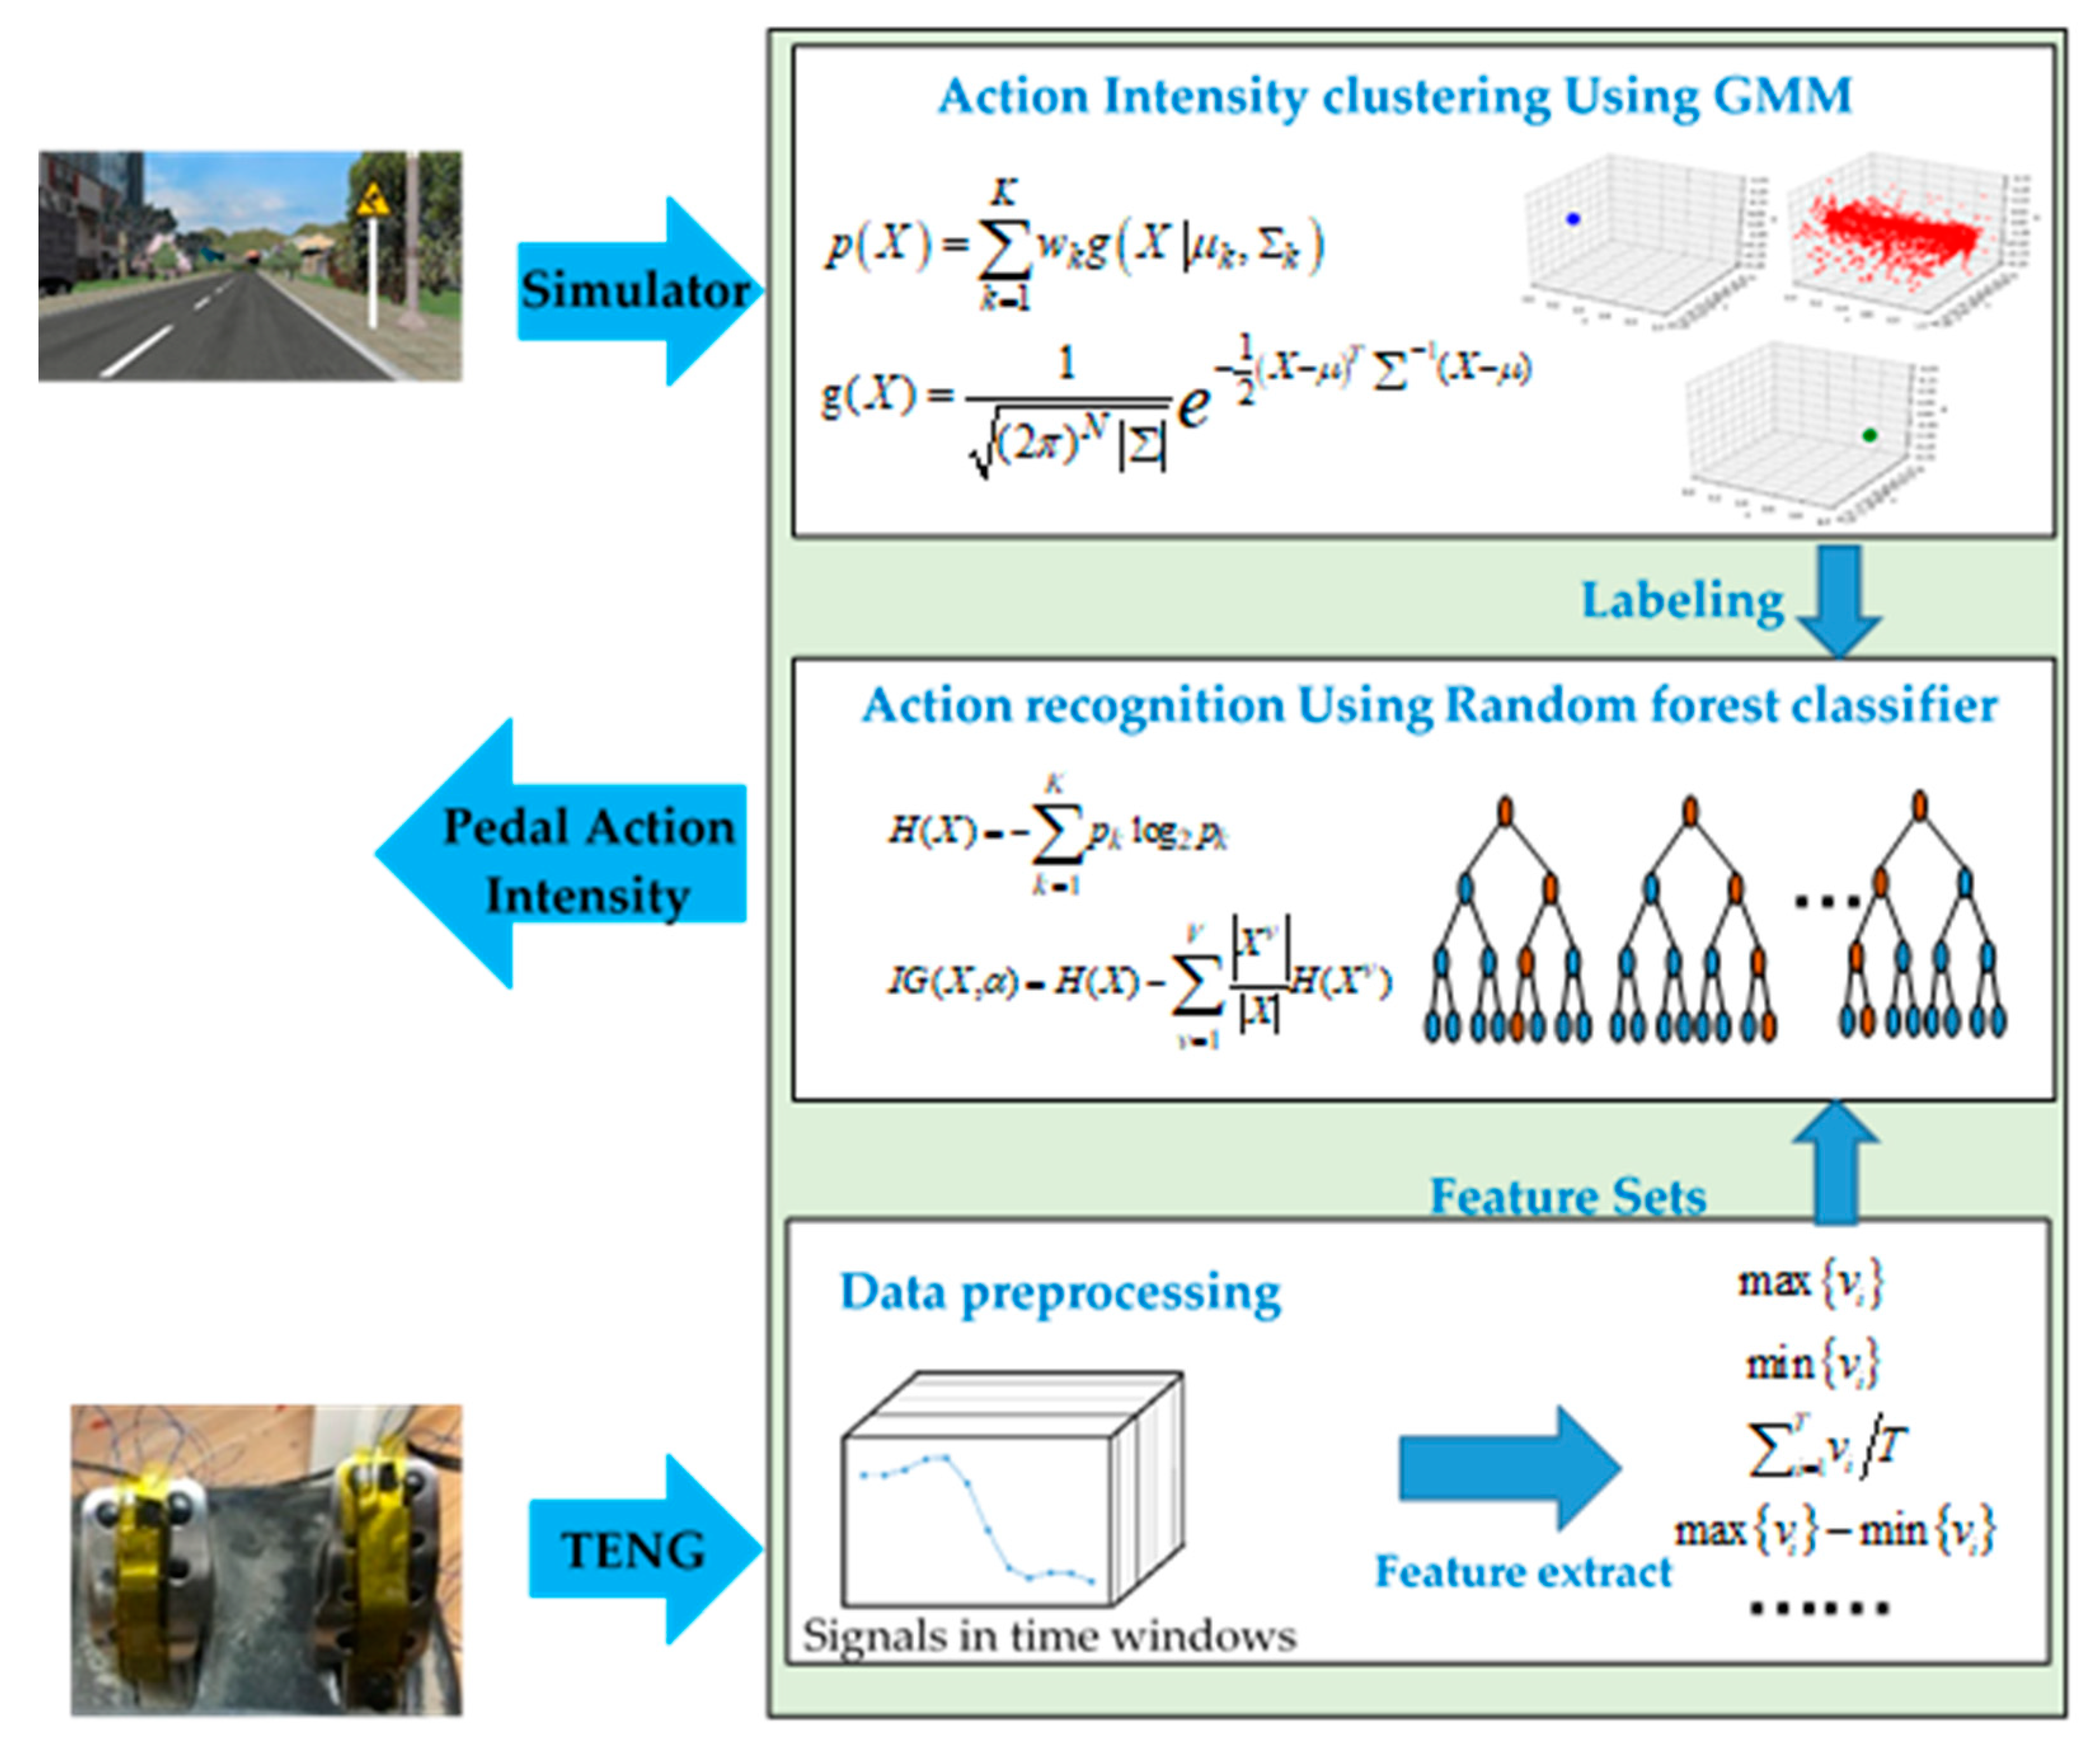
2.3. Data and Algorithm
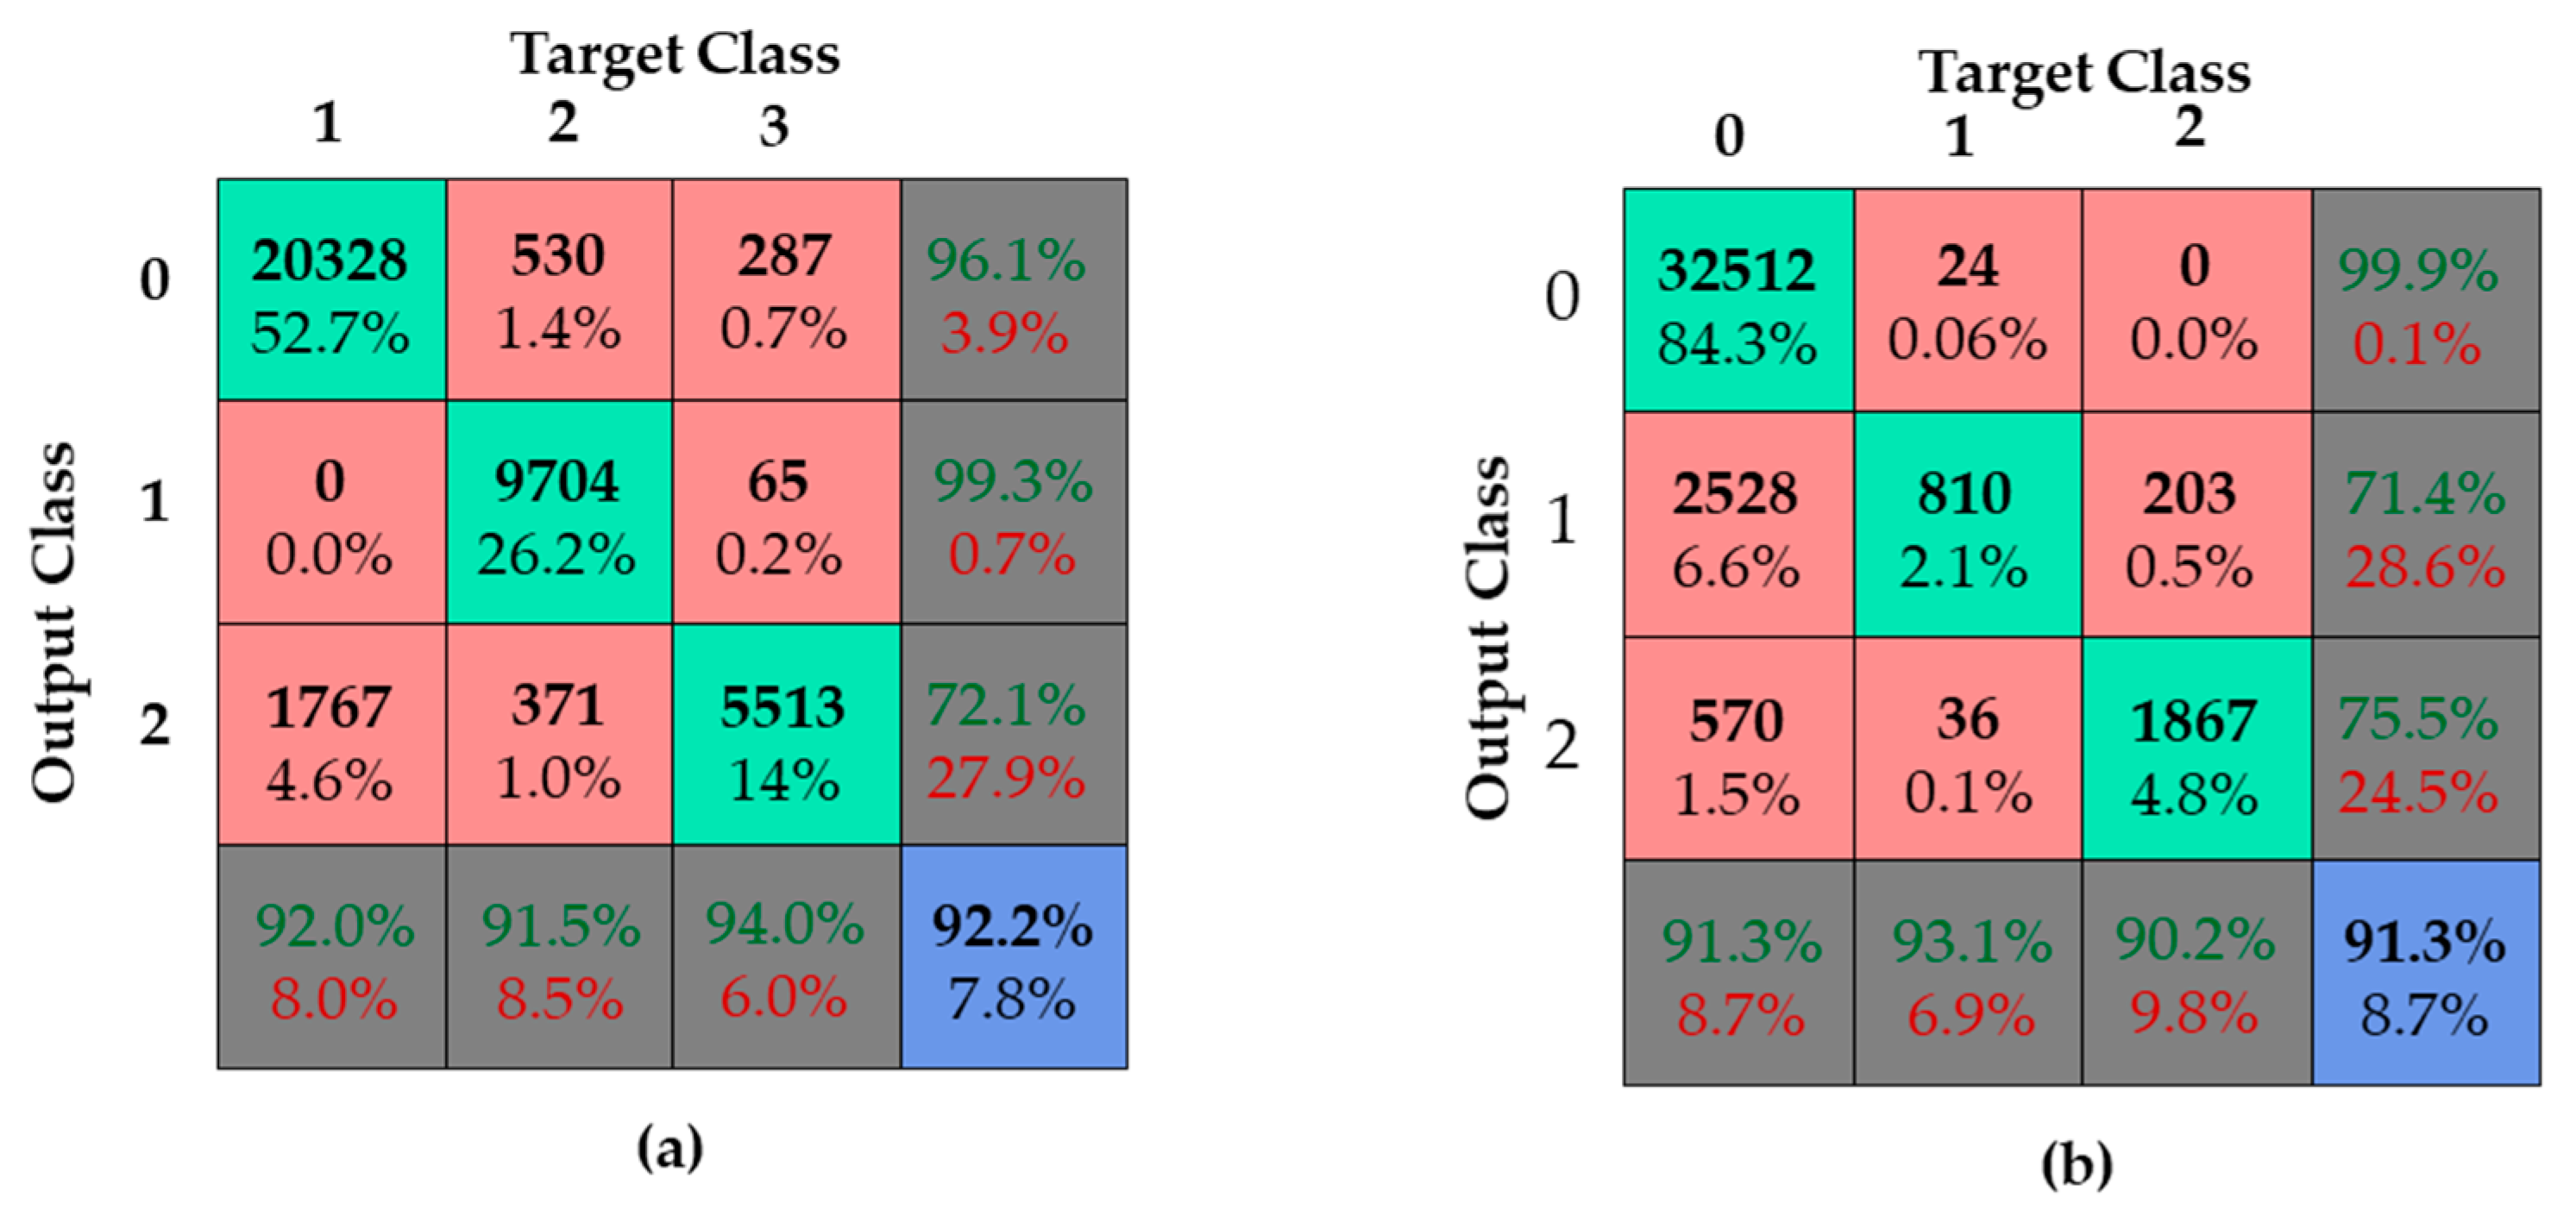
3. Results
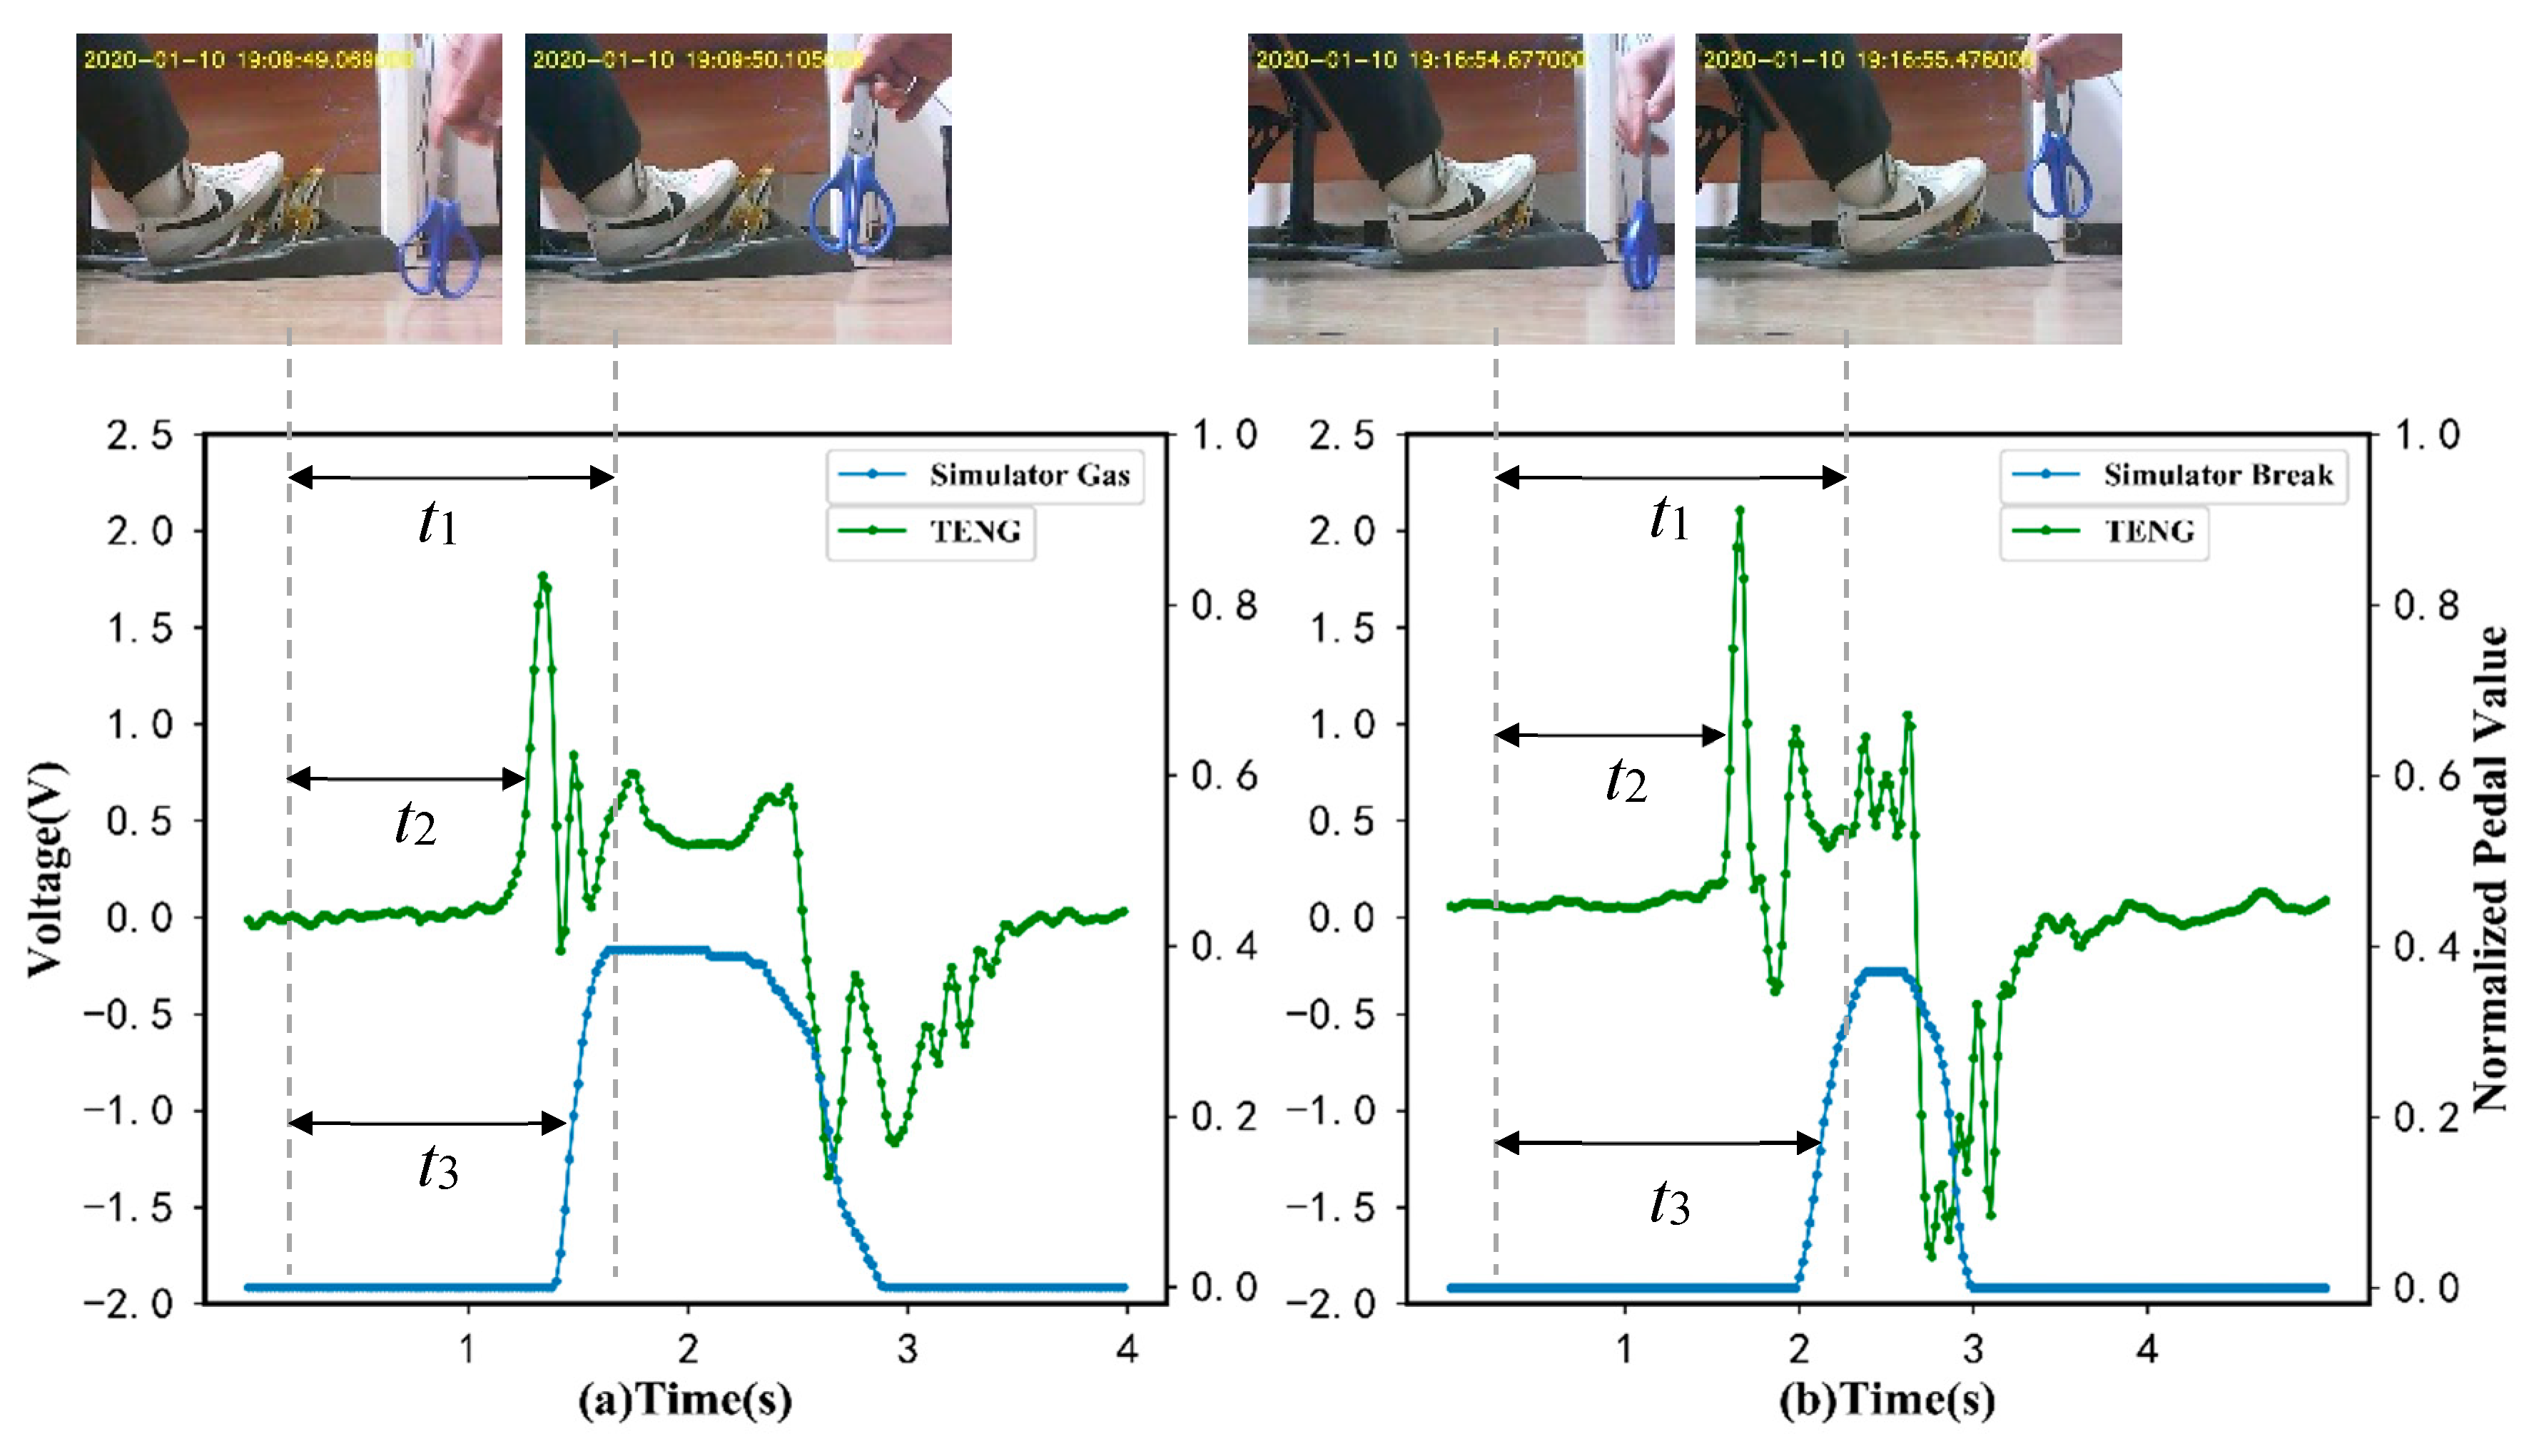
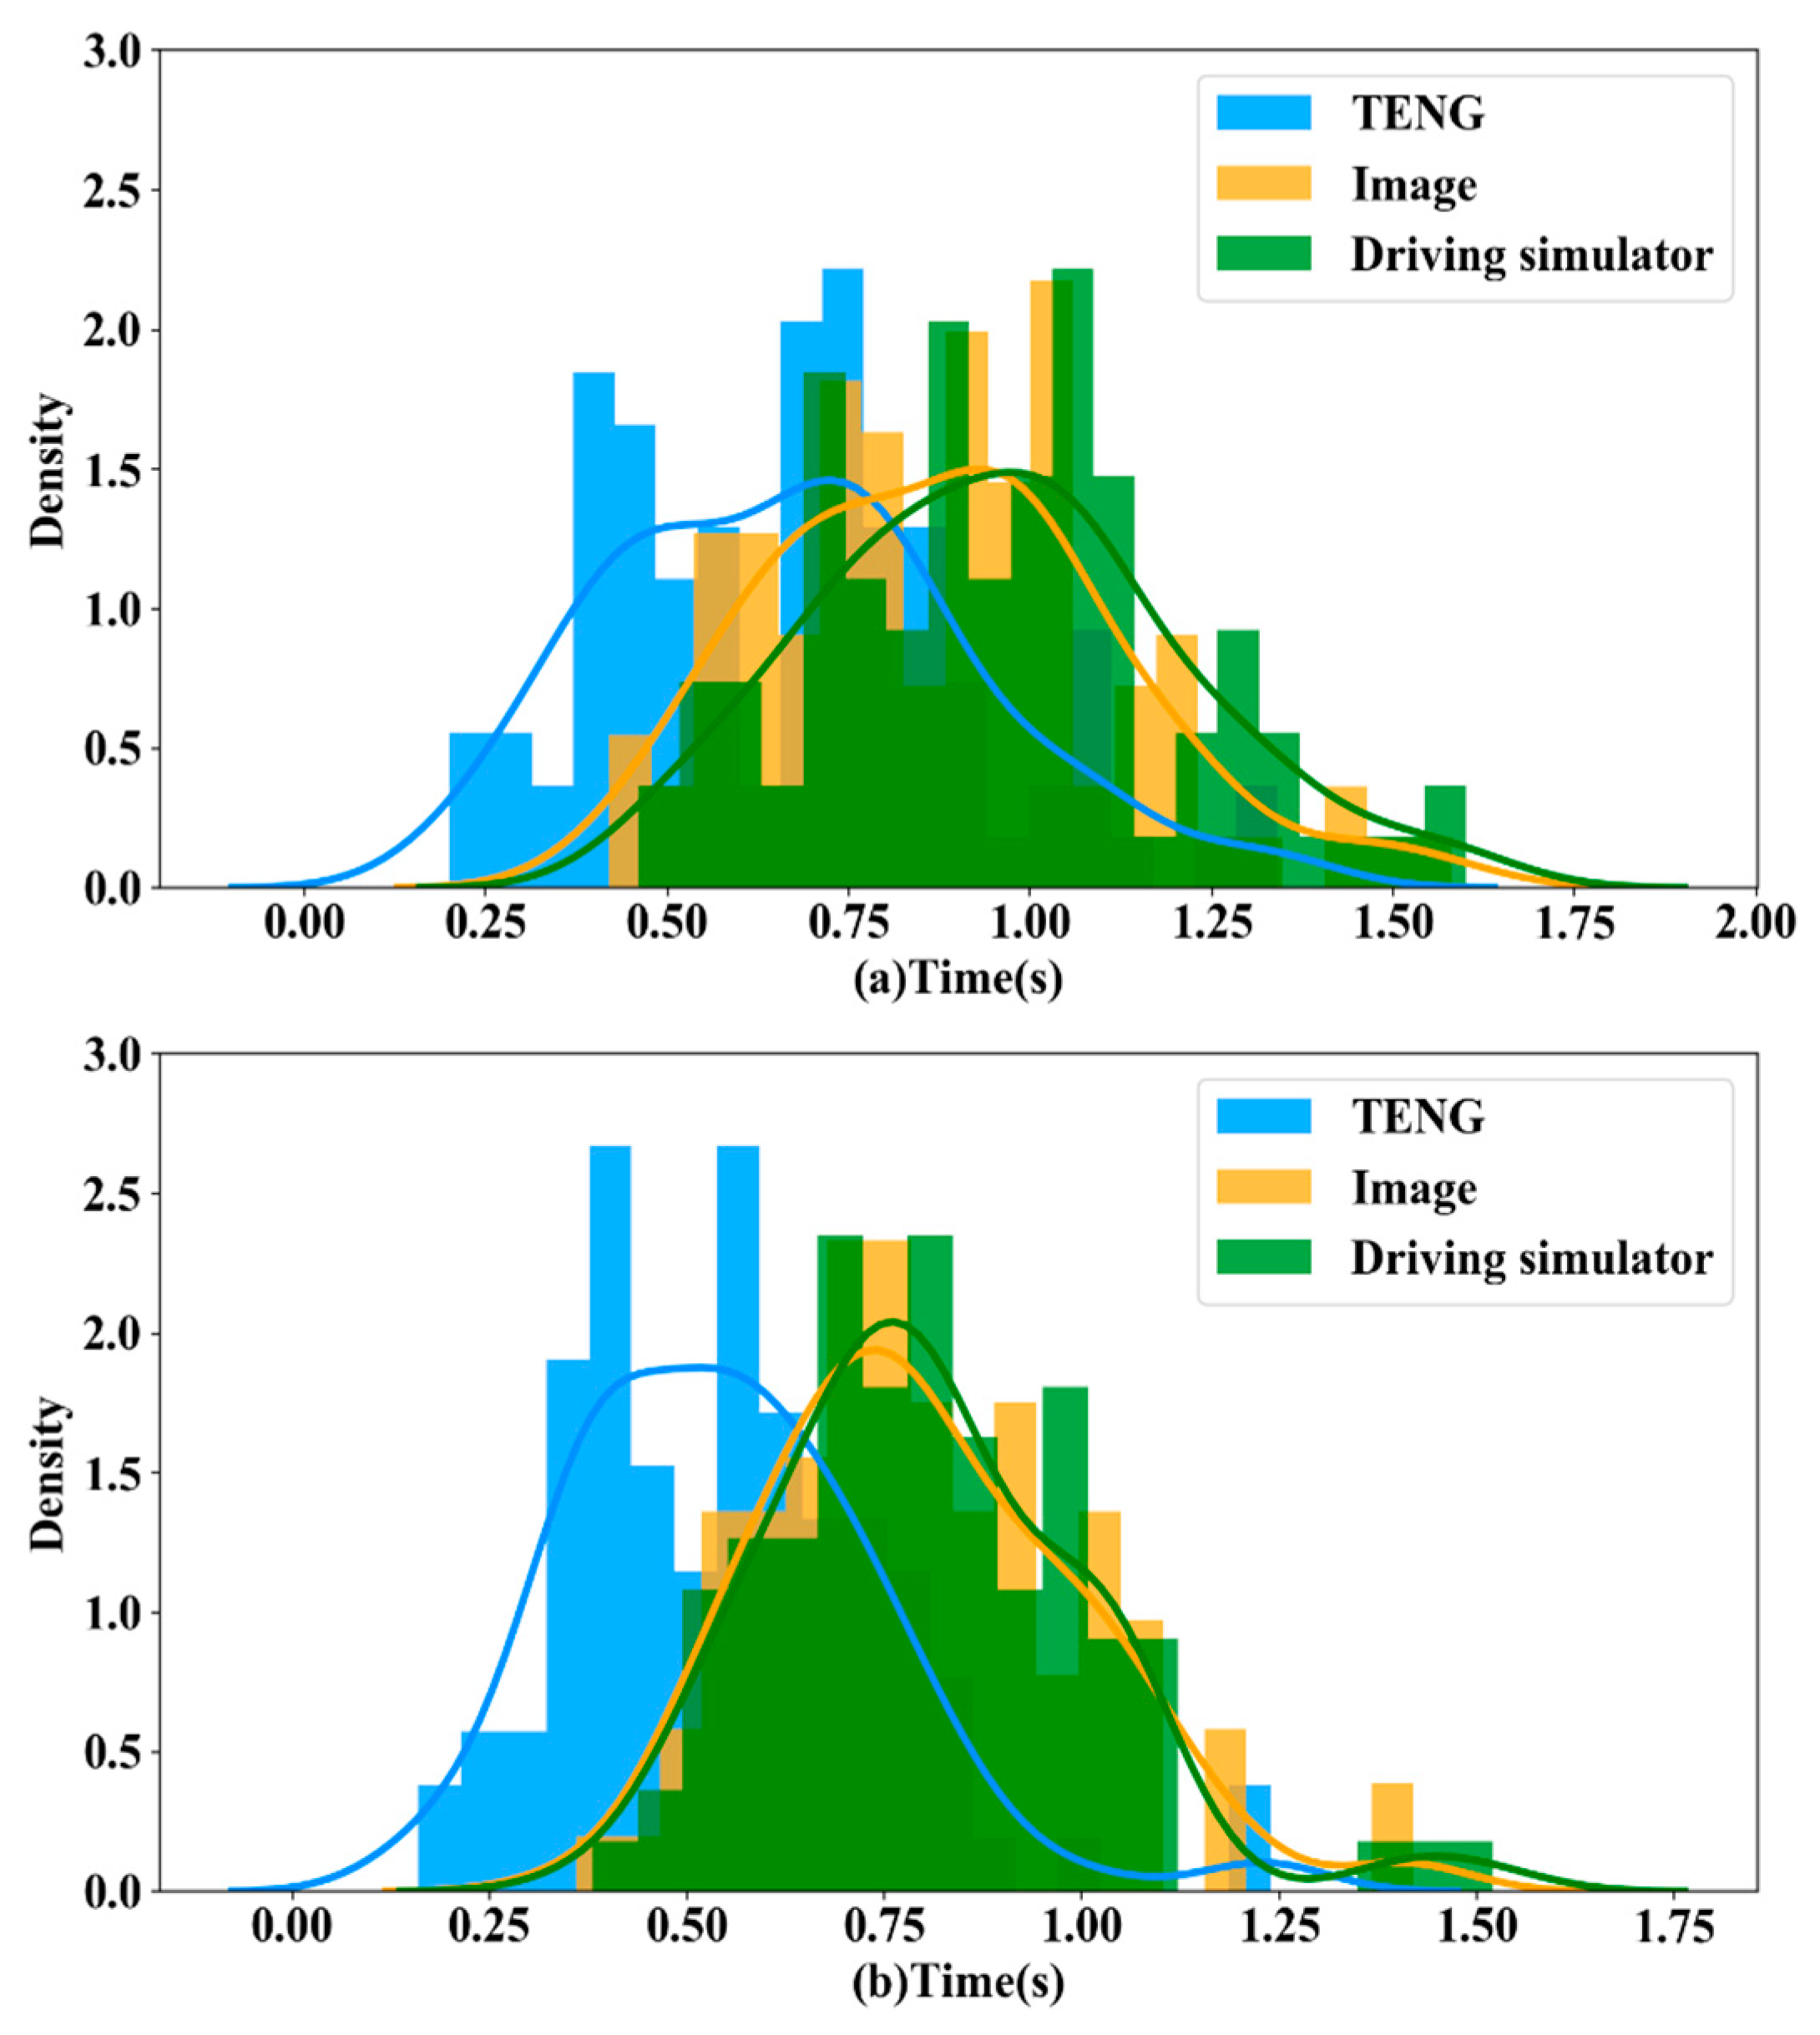
3.1. Reaction Time
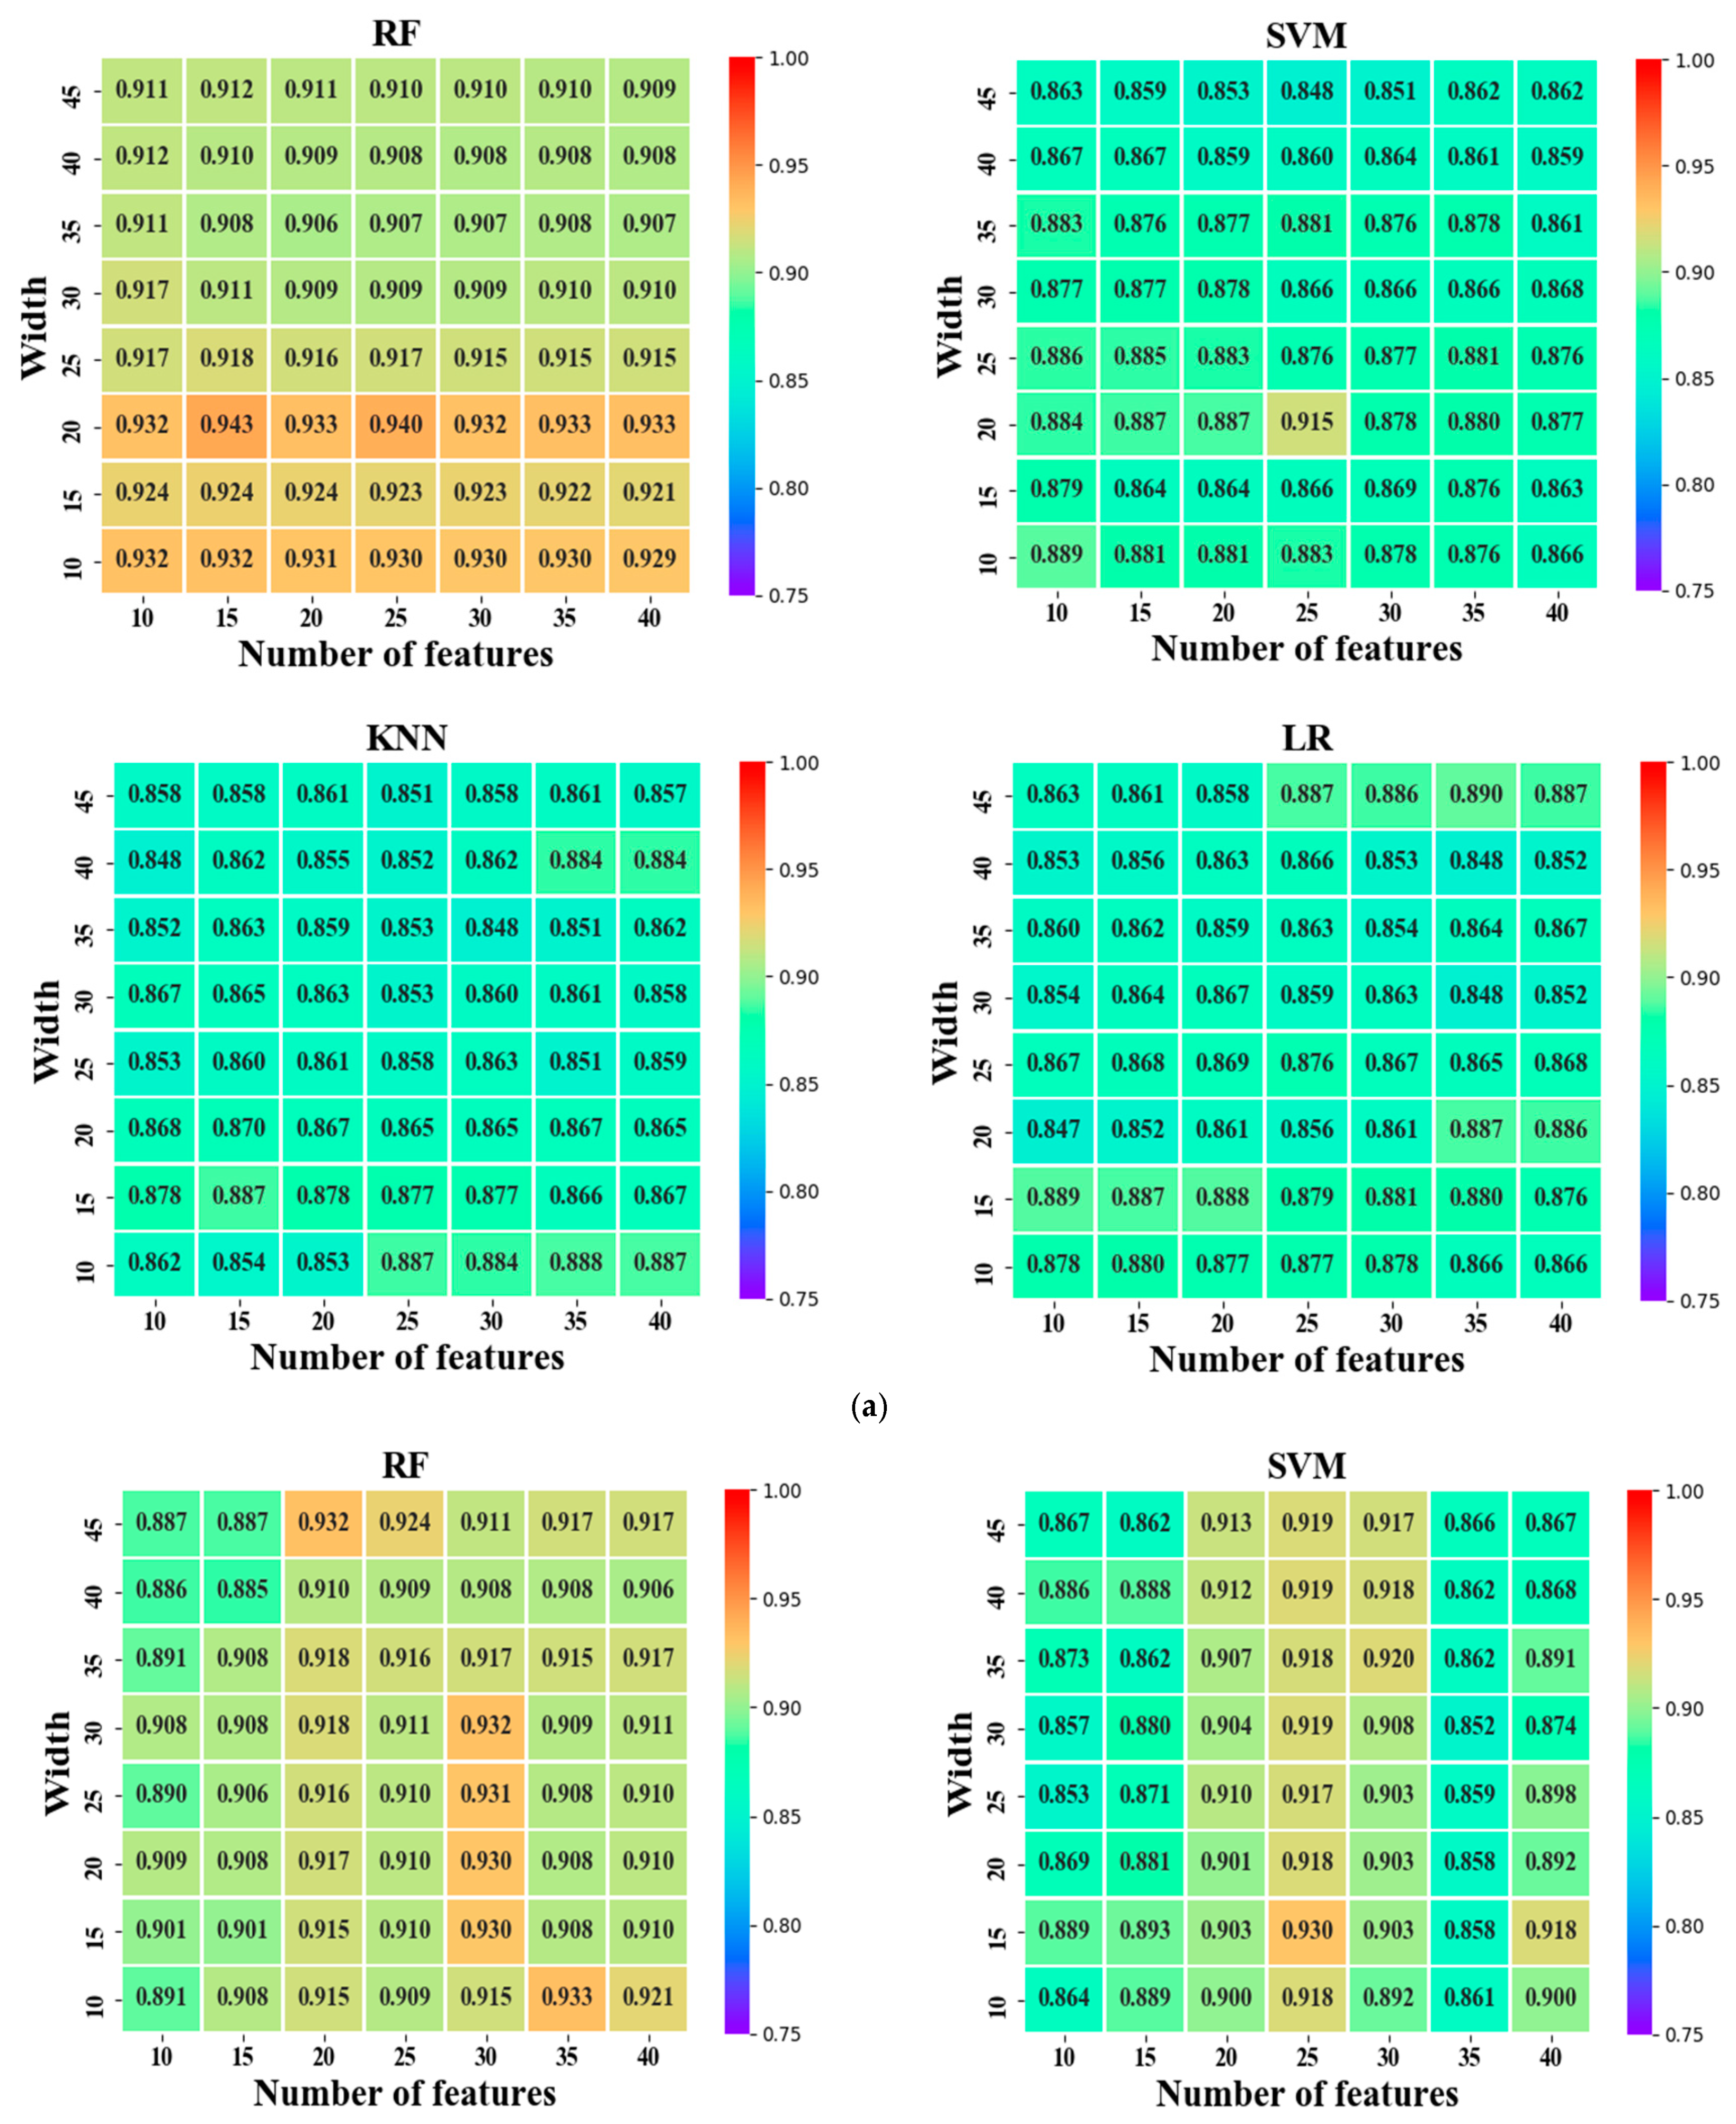
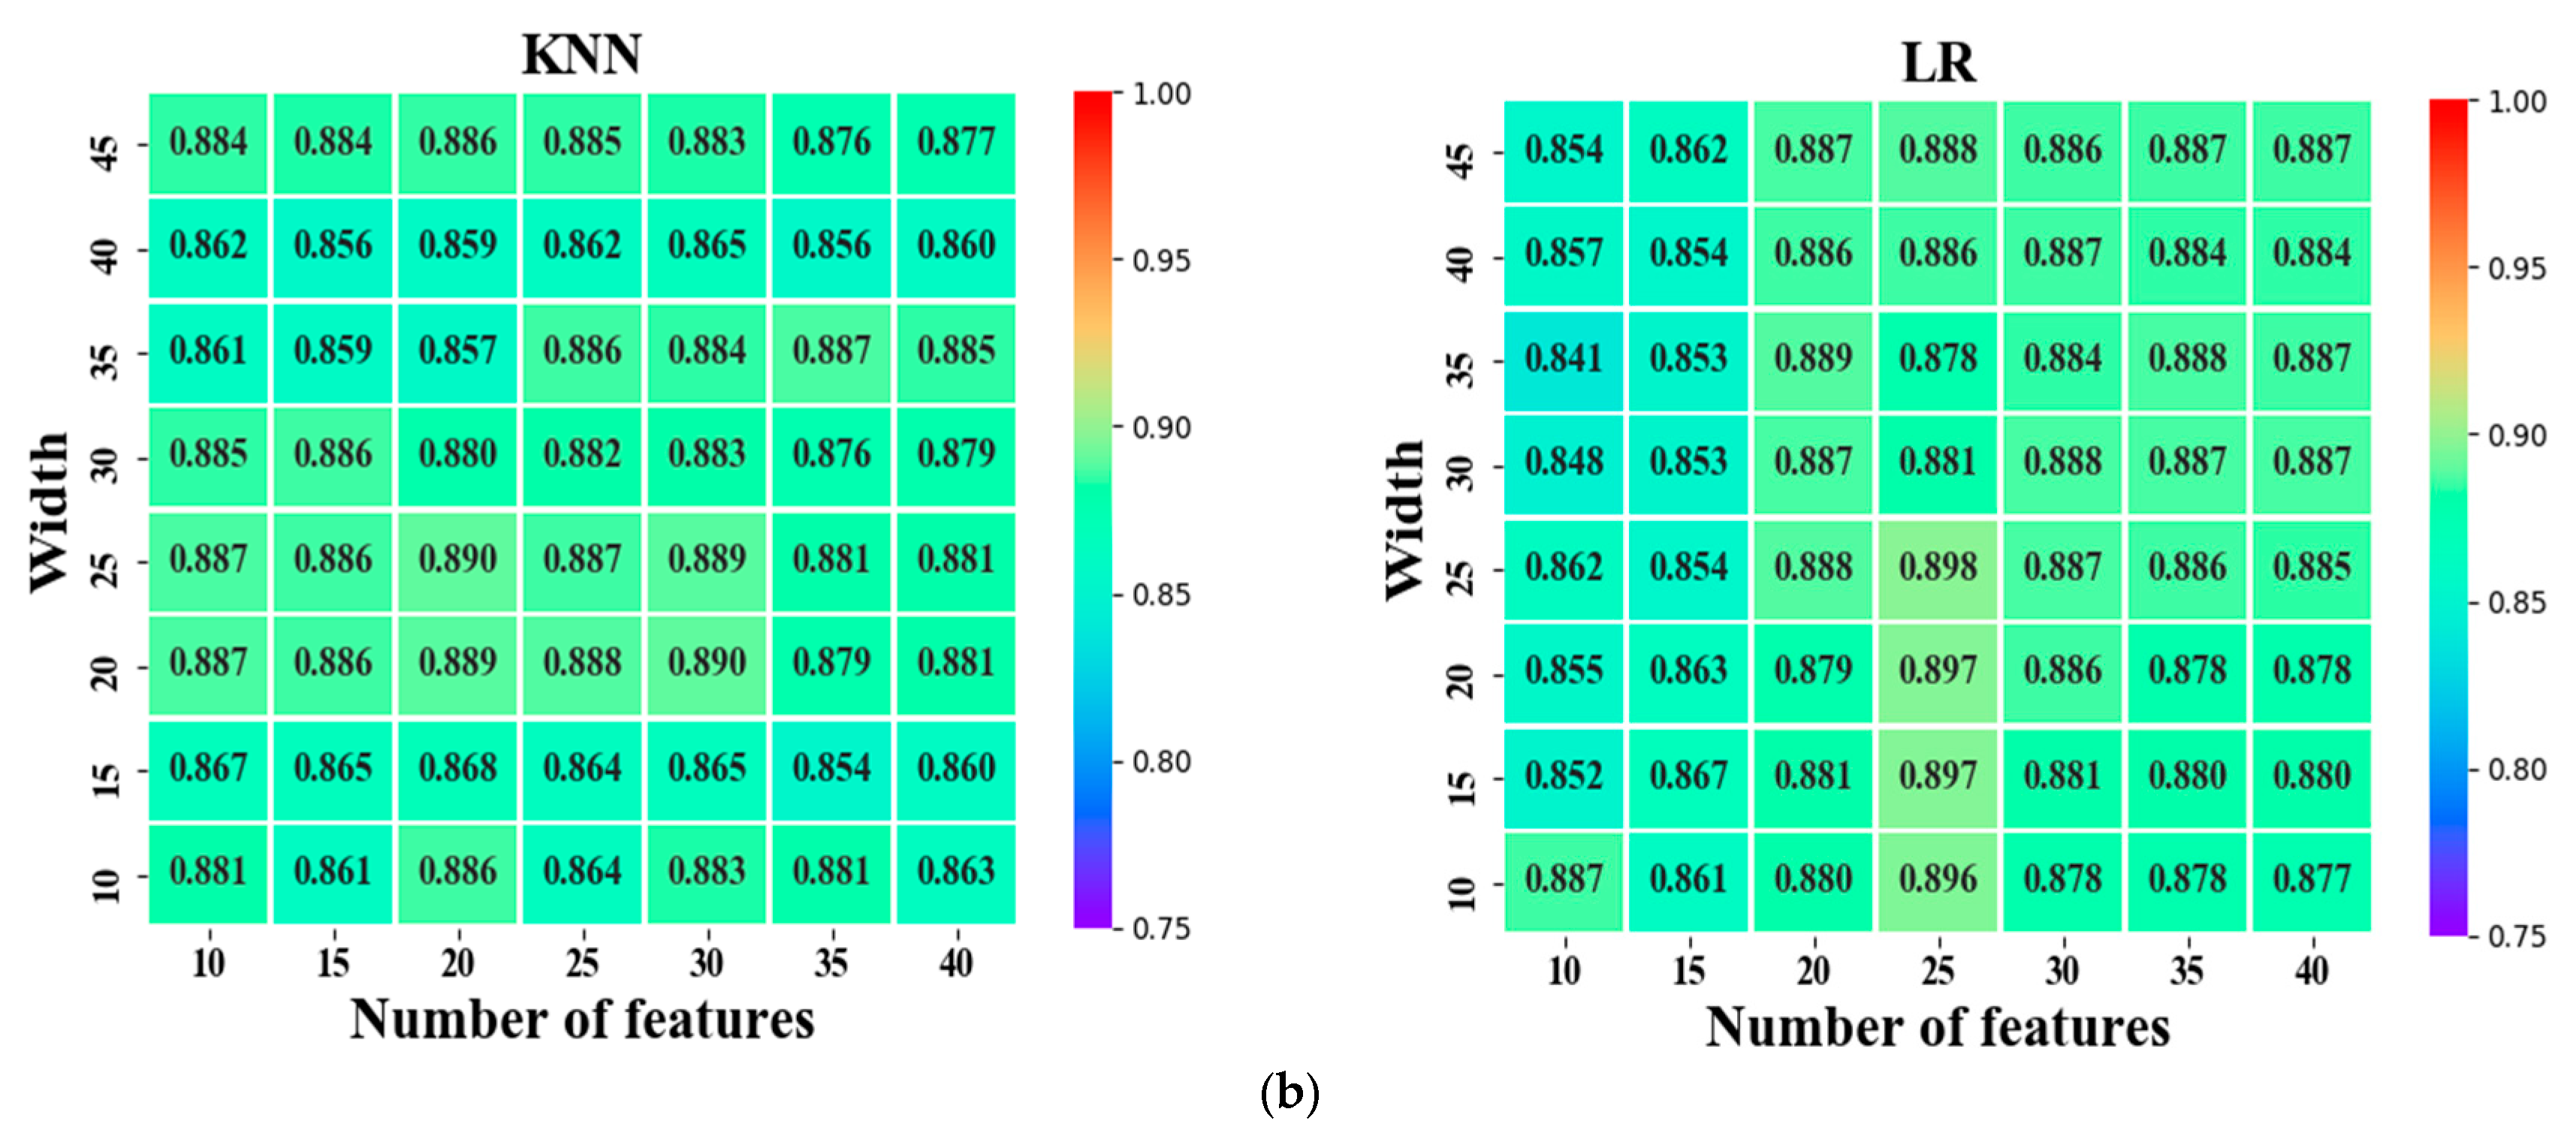
3.2. Performance of the Algorithm
4. Discussion and Conclusions
Author Contributions
Funding
Acknowledgments
Conflicts of Interest
Appendix A

| Index | Name | Formula | Index | Name | Formula |
|---|---|---|---|---|---|
| 1 | Maximum value | 22 | Frequency of maximum amplitude | ||
| 2 | Minimum value | 23 | Minimum amplitude | ||
| 3 | Average value | 24 | Frequency of minimum amplitude | ||
| 4 | Peak value | 25 | Average amplitude | ||
| 5 | First quartile | 26 | Peak amplitude | ||
| 6 | Median value | 27 | Median amplitude | ||
| 7 | Third quartile | 28 | Maximum power | ||
| 8 | Variance | 29 | Minimum power | ||
| 9 | Standard deviation | 30 | Average power | ||
| 10 | Mean absolute value | 31 | Peak power | ||
| 11 | Mean square value | 32 | Median power | ||
| 12 | Root mean square value | 33 | Centroid frequency | ||
| 13 | Root amplitude | 34 | Mean-square frequency | ||
| 14 | Skewness | 35 | Root mean-square frequency | ||
| 15 | Kurtosis | 36 | Variance frequency | ||
| 16 | Crest factor | 37 | Root variance frequency | ||
| 17 | Waveform factor | 38 | Energy (0–2 Hz) | ||
| 18 | Pulse factor | 39 | Energy (2–4 Hz) | ||
| 19 | Margin factor | 40 | Energy (4–6 Hz) | ||
| 20 | Kurtosis factor | 41 | Energy (6–8 Hz) | ||
| 21 | Maximum amplitude | 42 | Energy (8–10 Hz) |
References
- World Health Organization. Global Status Report on Road Safety; World Health Organization: Geneva, Switzerland, 2018. [Google Scholar]
- Elamrani Abou Elassad, Z.; Mousannif, H.; Al Moatassime, H. A real-time crash prediction fusion framework: An imbalance-aware strategy for collision avoidance systems. Transp. Res. Part C Emerg. Technol. 2020, 118, 102708. [Google Scholar] [CrossRef]
- Soares, S.; Monteiro, T.; Lobo, A.; Couto, A.; Cunha, L.; Ferreira, S. Analyzing driver drowsiness: From causes to effects. Sustainability 2020, 12, 1971. [Google Scholar] [CrossRef]
- Moretti, L.; Palazzi, F.; Cantisani, G. Operating times and users’ behavior at Urban road intersections. Sustainability 2020, 12, 4120. [Google Scholar] [CrossRef]
- Kamrani, M.; Srinivasan, A.R.; Chakraborty, S.; Khattak, A.J. Applying Markov decision process to understand driving decisions using basic safety messages data. Transp. Res. Part C Emerg. Technol. 2020, 115, 102642. [Google Scholar] [CrossRef]
- Dols, J.F.; Girbés-Juan, V.; Luna, Á.; Catalán, J. Data acquisition system for the characterization of biomechanical and ergonomic thresholds in driving vehicles. Sustainability 2020, 12, 7013. [Google Scholar] [CrossRef]
- Wu, Y.; Abdel-Aty, M.; Park, J.; Zhu, J. Effects of crash warning systems on rear-end crash avoidance behavior under fog conditions. Transp. Res. Part C Emerg. Technol. 2018, 95, 481–492. [Google Scholar] [CrossRef]
- Jensen, A.F.; Rasmussen, T.K.; Prato, C.G. A route choice model for capturing driver preferences when driving electric and conventional vehicles. Sustainability 2020, 12, 1149. [Google Scholar] [CrossRef]
- Zhu, X.; Zhang, T.; Gao, W.; Mei, D. Analysis on spatial pattern and driving factors of carbon emission in urban-rural fringe mixed-use communities: Cases study in East Asia. Sustainability 2020, 12, 3101. [Google Scholar] [CrossRef]
- Zhou, J.; Sun, J.; He, L.; Ding, Y.; Cao, H.; Zhao, W. Control Oriented Prediction of Driver Brake Intention and Intensity Using a Composite Machine Learning Approach. Energies 2019, 12, 2483. [Google Scholar] [CrossRef]
- Lv, C.; Xing, Y.; Lu, C.; Liu, Y.; Guo, H.; Gao, H.; Cao, D. Hybrid-Learning-Based Classification and Quantitative Inference of Driver Braking Intensity of an Electrified Vehicle. IEEE Trans. Veh. Technol. 2018, 67, 5718–5729. [Google Scholar] [CrossRef]
- Tran, C.; Doshi, A.; Trivedi, M.M. Modeling and prediction of driver behavior by foot gesture analysis. Comput. Vis. Image Underst. 2012, 116, 435–445. [Google Scholar] [CrossRef]
- Ohn-Bar, E.; Tawari, A.; Martin, S.; Trivedi, M.M. On surveillance for safety critical events: In-vehicle video networks for predictive driver assistance systems. Comput. Vis. Image Underst. 2015, 134, 130–140. [Google Scholar] [CrossRef]
- Haufe, S.; Kim, J.W.; Kim, I.H.; Sonnleitner, A.; Schrauf, M.; Curio, G.; Blankertz, B. Electrophysiology-based detection of emergency braking intention in real-world driving. J. Neural Eng. 2014, 11, 056011. [Google Scholar] [CrossRef] [PubMed]
- Frank, S.; Kuijper, A. Robust driver foot tracking and foot gesture recognition using capacitive proximity sensing. J. Ambient Intell. Smart Environ. 2019, 11, 221–235. [Google Scholar] [CrossRef]
- Teng, T.; Bi, L.; Liu, Y. EEG-Based Detection of Driver Emergency Braking Intention for Brain-Controlled Vehicles. IEEE Trans. Intell. Transp. Syst. 2018, 19, 1766–1773. [Google Scholar] [CrossRef]
- Hernandez-Rojas, L.G.; Martinez, E.; Antelis, J.M. Detection of emergency braking intention using driver’s electroencephalographic signals. IEEE Lat. Am. Trans. 2019, 17, 111–118. [Google Scholar] [CrossRef]
- Wang, X.; Wang, X.; Zhou, J.; Zhou, J.; Song, J.; Song, J.; Liu, J.; Liu, J.; Xu, N.; Xu, N. Piezoelectric Field Effect Transistor and Nanoforce Sensor Based on a Single ZnO Nanowire. Nano Lett. 2006, 6, 2768–2772. [Google Scholar] [CrossRef]
- Li, S.; Zhang, D.; Meng, X.; Huang, Q.A.; Sun, C.; Wang, Z.L. A flexible lithium-ion battery with quasi-solid gel electrolyte for storing pulsed energy generated by triboelectric nanogenerator. Energy Storage Mater. 2018, 12, 17–22. [Google Scholar] [CrossRef]
- Hou, H.; Xu, Q.; Pang, Y.; Li, L.; Wang, J.; Zhang, C.; Sun, C. Efficient Storing Energy Harvested by Triboelectric Nanogenerators Using a Safe and Durable All-Solid-State Sodium-Ion Battery. Adv. Sci. 2017, 4, 1700072. [Google Scholar] [CrossRef]
- Song, W.; Gan, B.; Jiang, T.; Zhang, Y.; Yu, A.; Yuan, H.; Chen, N.; Sun, C.; Wang, Z.L. Nanopillar Arrayed Triboelectric Nanogenerator as a Self-Powered Sensitive Sensor for a Sleep Monitoring System. ACS Nano 2016, 10, 8097–8103. [Google Scholar] [CrossRef]
- Li, S.; Meng, X.; Yi, Q.; Alonso, J.A.; Fernández-Díaz, M.T.; Sun, C.; Wang, Z.L. Structural and electrochemical properties of LiMn0.6Fe0.4PO4 as a cathode material for flexible lithium-ion batteries and self-charging power pack. Nano Energy 2018, 52, 510–516. [Google Scholar] [CrossRef]
- Lin, Z.H.; Cheng, G.; Wu, W.; Pradel, K.C.; Wang, Z.L. Dual-mode triboelectric nanogenerator for harvesting water energy and as a self-powered ethanol nanosensor. ACS Nano 2014, 8, 6440–6448. [Google Scholar] [CrossRef] [PubMed]
- Chen, S.W.; Cao, X.; Wang, N.; Ma, L.; Zhu, H.R.; Willander, M.; Jie, Y.; Wang, Z.L. An Ultrathin Flexible Single-Electrode Triboelectric-Nanogenerator for Mechanical Energy Harvesting and Instantaneous Force Sensing. Adv. Energy Mater. 2017, 7, 1601255. [Google Scholar] [CrossRef]
- Hou, T.C.; Yang, Y.; Zhang, H.; Chen, J.; Chen, L.J.; Lin Wang, Z. Triboelectric nanogenerator built inside shoe insole for harvesting walking energy. Nano Energy 2013, 2, 856–862. [Google Scholar] [CrossRef]
- Yang, Y.; Zhu, G.; Zhang, H.; Chen, J.; Zhong, X.; Lin, Z.H.; Su, Y.; Bai, P.; Wen, X.; Wang, Z.L. Triboelectric nanogenerator for harvesting wind energy and as self-powered wind vector sensor system. ACS Nano 2013, 7, 9461–9468. [Google Scholar] [CrossRef]
- Zhang, H.; Yang, Y.; Zhong, X.; Su, Y.; Zhou, Y.; Hu, C.; Wang, Z.L. Single-electrode-based rotating triboelectric nanogenerator for harvesting energy from tires. ACS Nano 2014, 8, 680–689. [Google Scholar] [CrossRef]
- Lin, Z.; Chen, J.; Li, X.; Zhou, Z.; Meng, K.; Wei, W.; Yang, J.; Wang, Z.L. Triboelectric Nanogenerator Enabled Body Sensor Network for Self-Powered Human Heart-Rate Monitoring. ACS Nano 2017, 11, 8830–8837. [Google Scholar] [CrossRef]
- Zhang, H.; Yang, Y.; Hou, T.C.; Su, Y.; Hu, C.; Wang, Z.L. Triboelectric nanogenerator built inside clothes for self-powered glucose biosensors. Nano Energy 2013, 2, 1019–1024. [Google Scholar] [CrossRef]
- Pu, X.; Liu, M.; Chen, X.; Sun, J.; Du, C.; Zhang, Y.; Zhai, J.; Hu, W.; Wang, Z.L. Ultrastretchable, transparent triboelectric nanogenerator as electronic skin for biomechanical energy harvesting and tactile sensing. Sci. Adv. 2017, 3, e1700015. [Google Scholar] [CrossRef]
- He, X.; Zi, Y.; Guo, H.; Zheng, H.; Xi, Y.; Wu, C.; Wang, J.; Zhang, W.; Lu, C.; Wang, Z.L. A Highly Stretchable Fiber-Based Triboelectric Nanogenerator for Self-Powered Wearable Electronics. Adv. Funct. Mater. 2017, 27, 1604378. [Google Scholar] [CrossRef]
- Quan, T.; Wang, X.; Wang, Z.L.; Yang, Y. Hybridized Electromagnetic-Triboelectric Nanogenerator for a Self-Powered Electronic Watch. ACS Nano 2015, 9, 12301–12310. [Google Scholar] [CrossRef]
- Zhang, H.; Yang, Y.; Su, Y.; Chen, J.; Hu, C.; Wu, Z.; Liu, Y.; Ping Wong, C.; Bando, Y.; Wang, Z.L. Triboelectric nanogenerator as self-powered active sensors for detecting liquid/gaseous water/ethanol. Nano Energy 2013, 2, 693–701. [Google Scholar] [CrossRef]
- Parida, K.; Bhavanasi, V.; Kumar, V.; Bendi, R.; Lee, P.S. Self-powered pressure sensor for ultra-wide range pressure detection. Nano Res. 2017, 10, 3557–3570. [Google Scholar] [CrossRef]
- Lin, M.F.; Xiong, J.; Wang, J.; Parida, K.; Lee, P.S. Core-shell nanofiber mats for tactile pressure sensor and nanogenerator applications. Nano Energy 2018, 44, 248–255. [Google Scholar] [CrossRef]
- Askari, H.; Khajepour, A.; Khamesee, M.B.; Wang, Z.L. Embedded self-powered sensing systems for smart vehicles and intelligent transportation. Nano Energy 2019, 66, 104103. [Google Scholar] [CrossRef]
- Meng, X.; Cheng, Q.; Jiang, X.; Fang, Z.; Chen, X.; Li, S.; Li, C.; Sun, C.; Wang, W.; Wang, Z.L. Triboelectric nanogenerator as a highly sensitive self-powered sensor for driver behavior monitoring. Nano Energy 2018, 51, 721–727. [Google Scholar] [CrossRef]
- Fernández-Delgado, M.; Cernadas, E.; Barro, S.; Amorim, D. Do we need hundreds of classifiers to solve real world classification problems? J. Mach. Learn. Res. 2014, 15, 3133–3181. [Google Scholar] [CrossRef]
- Miao, C.; Liu, H.; Zhu, G.G.; Chen, H. Connectivity-based optimization of vehicle route and speed for improved fuel economy. Transp. Res. Part C Emerg. Technol. 2018, 91, 353–368. [Google Scholar] [CrossRef]
- Peiris, S.; Berecki-Gisolf, J.; Chen, B.; Fildes, B. Road trauma in regional and remote Australia and New Zealand in preparedness for ADAS technologies and autonomous vehicles. Sustainability 2020, 12, 4347. [Google Scholar] [CrossRef]
- Choi, J.; Lee, K.; Kim, H.; An, S.; Nam, D. Classification of inter-urban highway drivers’ resting behavior for advanced driver-assistance system technologies using vehicle trajectory data from car navigation systems. Sustainability 2020, 12, 5936. [Google Scholar] [CrossRef]
- Bifulco, G.N.; Galante, F.; Pariota, L.; Spena, M.R. A linear model for the estimation of fuel consumption and the impact evaluation of advanced driving assistance systems. Sustainability 2015, 7, 14326–14343. [Google Scholar] [CrossRef]
- Gonzalez, J.G.; Casado-Mansilla, D.; López-de-Ipiña, D. Analysis of driver’s reaction behavior using a persuasion-based IT artefact. Sustainability 2020, 12, 6857. [Google Scholar] [CrossRef]


| Ref. | Data Resource | Algorithm | Actions | Accuracy | Apparatus |
|---|---|---|---|---|---|
| [10] | CAN bus | Random forest | Slight; medium; intensive; emergency | More than 90% | Real vehicle |
| [11] | CAN, powertrain | Random forest, Neural Networks | Three levels of braking | More than 90% | Electric vehicle |
| [12] | Camera | Hidden Markov Model (HMM) | 7 semantic states | 94% | Real vehicle |
| [13] | Cameras | Hidden Conditional Random Field (HCRF) | Overtake; Normal driving; Brake | More than 90% | Real vehicle |
| [15] | Cameras | / | Four foot gestures | Area under curve (AUC) > 0.9 | Real vehicle |
| [14] | Electroencephalography Electromyography | Regularization linear discriminant analysis | Emergency braking | Area under curve (AUC) > 0.9 | Real vehicle |
| [16] | Electroencephalography | Regularization linear discriminant analysis | Emergency braking | More than 94% | Real vehicle |
| [17] | Electroencephalography | Statistics analysis | Emergency braking | More than 80% | Driving simulator |
| Gas Pedal | x | v | a | Time | |||
|---|---|---|---|---|---|---|---|
| Mean | SD | Mean | SD | Mean | SD | ||
| Cluster1 | 1.000 | 0.000 | 0.000 | 0.000 | 0.000 | 0.000 | 1473 s |
| Cluster2 | 0.000 | 0.000 | 0.000 | 0.000 | 0.000 | 0.000 | 707 s |
| Cluster3 | 0.478 | 0.281 | 0.001 | 0.027 | 0.001 | 0.001 | 391 s |
| BrakePedal | x | v | a | Time | |||
| Mean | SD | Mean | SD | Mean | SD | ||
| Cluster1 | 0.000 | 0.000 | 0.000 | 0.000 | 0.000 | 0.000 | 2374 s |
| Cluster2 | 0.421 | 0.290 | 0.001 | 0.003 | 0.000 | 0.002 | 58 s |
| Cluster3 | 0.344 | 0.248 | 0.000 | 0.046 | 0.001 | 0.021 | 138 s |
| Name | Values We Tested |
|---|---|
| Width of time window (* 0.02 s) | 5, 10, 15, 20, 25, 30, 35, 40, 45 |
| Number of ranked features | 5, 10, 15, 20, 25, 30, 35, 40 |
| Classifier | random forest (RF), vector machine (SVM), logistic regression (LR), K Nearest Neighbor (KNN) |
| (a) | |||
| Classifier | Width of Time Window | Number of Features | F1 Score |
| RF | 20 | 15 | 0.943 |
| SVM | 20 | 25 | 0.915 |
| KNN | 10 | 35 | 0.888 |
| LR | 45 | 35 | 0.890 |
| (b) | |||
| Classifier | Width of Time Window | Number of Features | F1 Score |
| RF | 10 | 35 | 0.933 |
| SVM | 15 | 25 | 0.930 |
| KNN | 25 | 20 | 0.890 |
| LR | 25 | 25 | 0.898 |
Publisher’s Note: MDPI stays neutral with regard to jurisdictional claims in published maps and institutional affiliations. |
© 2020 by the authors. Licensee MDPI, Basel, Switzerland. This article is an open access article distributed under the terms and conditions of the Creative Commons Attribution (CC BY) license (http://creativecommons.org/licenses/by/4.0/).
Share and Cite
Cheng, Q.; Jiang, X.; Zhang, H.; Wang, W.; Sun, C. Data-Driven Detection Methods on Driver’s Pedal Action Intensity Using Triboelectric Nano-Generators. Sustainability 2020, 12, 8926. https://doi.org/10.3390/su12218926
Cheng Q, Jiang X, Zhang H, Wang W, Sun C. Data-Driven Detection Methods on Driver’s Pedal Action Intensity Using Triboelectric Nano-Generators. Sustainability. 2020; 12(21):8926. https://doi.org/10.3390/su12218926
Chicago/Turabian StyleCheng, Qian, Xiaobei Jiang, Haodong Zhang, Wuhong Wang, and Chunwen Sun. 2020. "Data-Driven Detection Methods on Driver’s Pedal Action Intensity Using Triboelectric Nano-Generators" Sustainability 12, no. 21: 8926. https://doi.org/10.3390/su12218926
APA StyleCheng, Q., Jiang, X., Zhang, H., Wang, W., & Sun, C. (2020). Data-Driven Detection Methods on Driver’s Pedal Action Intensity Using Triboelectric Nano-Generators. Sustainability, 12(21), 8926. https://doi.org/10.3390/su12218926